Transport and Main Roads
Queensland Road Crash Weekly Report
Report No: 1382 Data Extracted: 29 Jul 2024
Fatalities: Year to Date to Sunday, 28 July 2024
Table 1: Comparative Queensland Road Fatalities
2019 2020 2021 2022 2023 2024
no. % no. ₁ %
101 126 146 157 145 152 7 4.8% 17 12.6%
118 142 161 170 153 168 15 9.8% 19 12.9%
56 60 68 89 68 72 4 5.9% 4 5.6%
24 27 36 27 17 27 10 58.8% 1 3.1%
27 30 43 39 49 45 -4 -8.2% 7 19.7%
2 5 4 1 3 5 2 66.7% 2 66.7%
- - - - 1 4 3 300.0% - -
8 20 10 14 15 15 0 0.0% 2 11.9%
1 0 0 0 0 0 0 - 0 -100.0%
21 23 32 35 31 27 -4 -12.9% -1 -4.9%
Note:
Variation in 2024
from the
2019 to 2023 Avg
Variation in 2024
from 2023
Year to Date to 28 July
Driver fatalities
Total fatalities
Total fatal crashes
Figures are preliminary.
₁
Figures are rounded to the nearest whole number.
₂
Personal mobility device users were recorded as pedestrians prior to 1 November 2022.
₃
Includes other fatalities such as horse riders and train drivers and passengers.
₄ Includes all fatalities as a result of crashes involving heavy freight vehicles. These figures are also included in the road user type breakdown above (e.g. drivers,
passengers, etc).
Passenger fatalities
Motorcycle/Moped rider and pillion fatalities
Other fatalities₃
Bicycle rider and pillion fatalities
Pedestrian fatalities
Personal mobility device user fatalities₂
Fatalities involving heavy freight vehicles₄
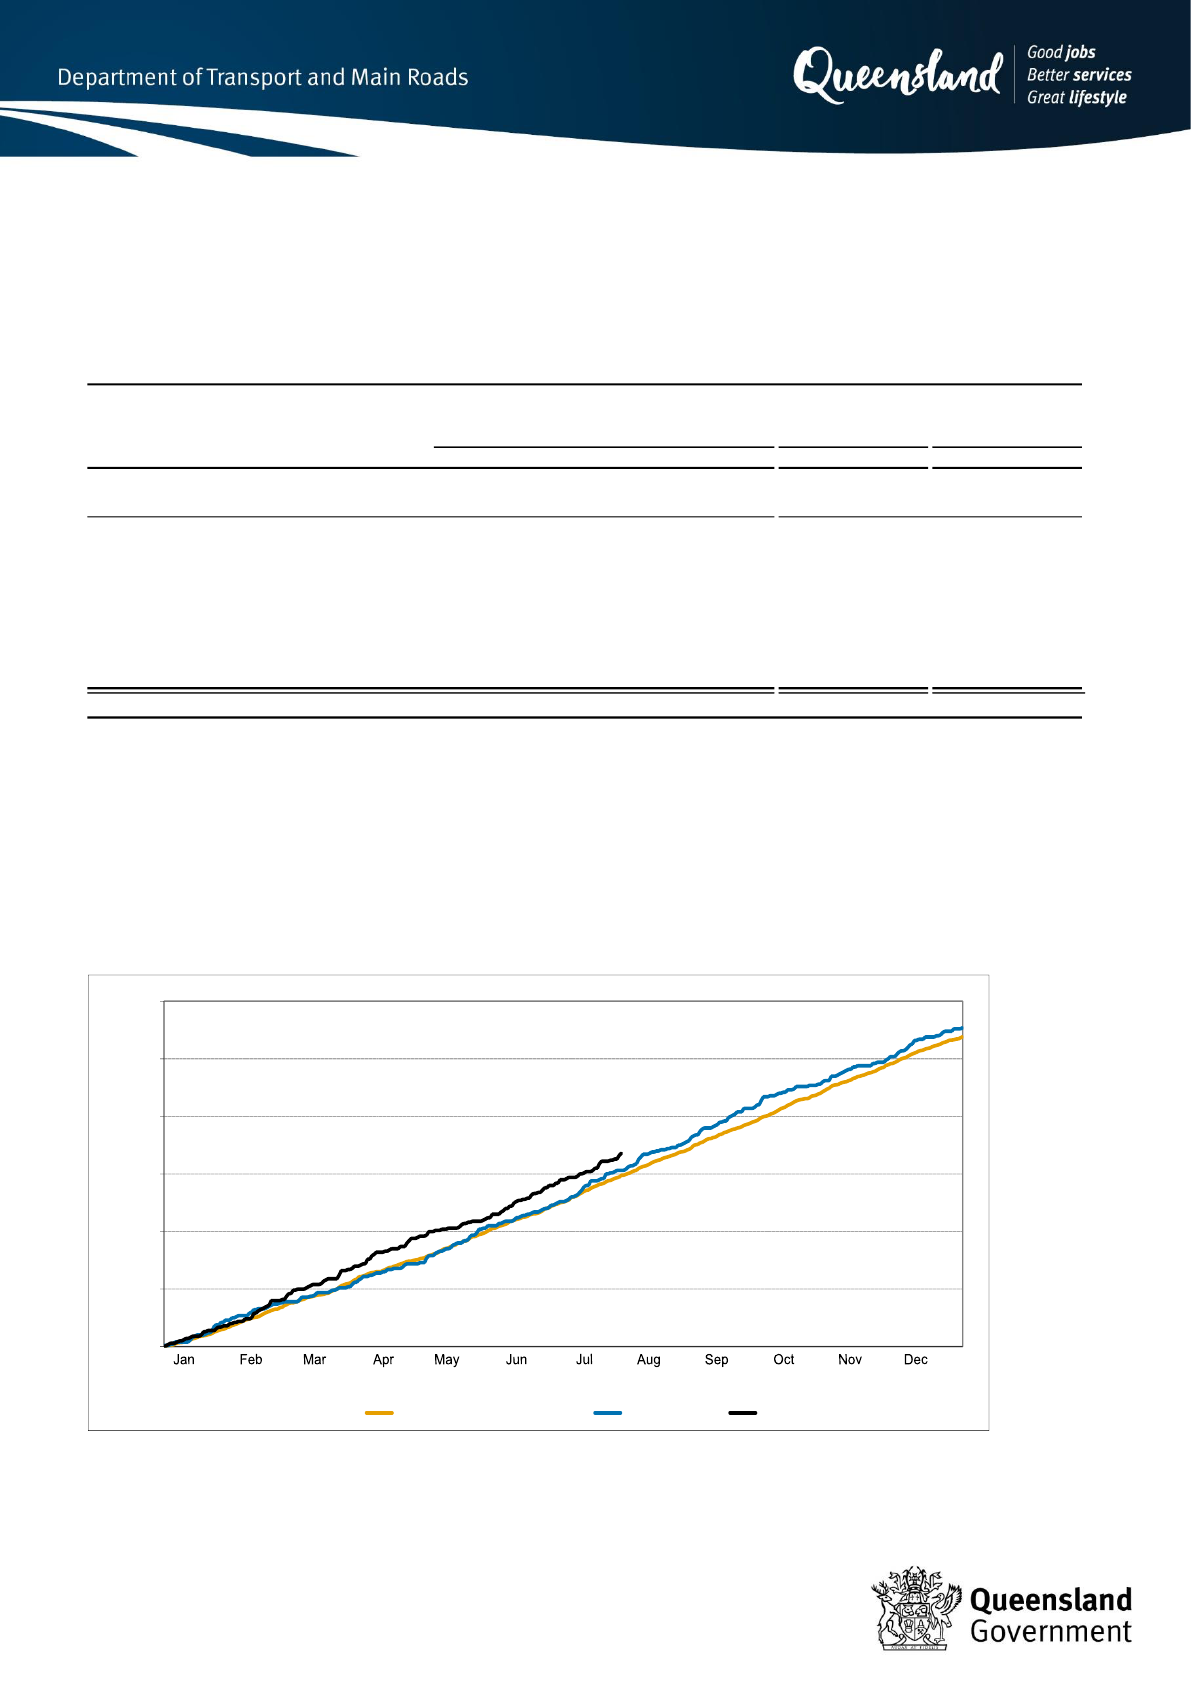
During 1 January to 28 July 2024, there were 168 fatalities as a result of crashes within Queensland,
which is 15 fatalities (or 9.8%) greater than the same period for the previous year and 19 fatalities (or
12.9%) greater than the previous five year average for the same period (Table 1).
Figure 1: Cumulative Daily Road Fatalities, Queensland
0
50
100
150
200
250
300
Number of fatalities
Month
2019 to 2023 Average 2023 2024

Queensland Road Crash Weekly Report, Transport and Main Roads Page 2 of 7
Table 2: Fatalities by Police Region
2019 2020 2021 2022 2023 2024
no. % no.* %
15 14 24 13 14 31 17 121.4% 15 93.8%
15 22 18 33 13 24 11 84.6% 4 18.8%
14 10 13 18 10 13 3 30.0% 0 0.0%
22 32 47 35 46 31 -15 -32.6% -5 -14.8%
13 14 14 8 6 12 6 100.0% 1 9.1%
9 22 15 21 24 25 1 4.2% 7 37.4%
30 28 30 42 40 32 -8 -20.0% -2 -5.9%
Note:
Central
Variation in 2024
from 2023
Figures are preliminary.
Where Police Region was known.
* Figures are rounded to the nearest whole number.
Far Northern
Brisbane
Police Region
North Coast
Southern
Variation in 2024
from the
2019 to 2023 Avg
Year to Date to 28 July
Northern
South Eastern
Table 3: Fatalities by TMR Customer Services Branch Region
2019 2020 2021 2022 2023 2024
no. % no.* %
15 23 19 33 13 24 11 84.6% 3 16.5%
27 24 27 26 16 25 9 56.3% 1 4.2%
20 23 30 31 33 34 1 3.0% 7 24.1%
25 37 35 42 45 45 0 0.0% 8 22.3%
31 35 50 38 46 40 -6 -13.0% 0 0.0%
Note:
Figures are preliminary.
Where CSB Region was known.
* Figures are rounded to the nearest whole number.
Year to Date to 28 July
Transport and Main Roads
Customer Services Branch Region
Variation in 2024
from 2023
Southern
Central
SEQ North
Variation in 2024
from the
2019 to 2023 Avg
SEQ South
Northern
Table 4: Fatalities by TMR Program Delivery and Operations Region
2019 2020 2021 2022 2023 2024
no. % no.* %
15 23 19 33 13 24 11 84.6% 3 16.5%
16 17 22 21 21 38 17 81.0% 19 95.9%
16 18 27 27 27 15 -12 -44.4% -8 -34.8%
27 24 27 26 16 25 9 56.3% 1 4.2%
11 23 15 24 28 24 -4 -14.3% 4 18.8%
33 37 51 39 48 42 -6 -12.5% 0 1.0%
Note
South Coast
Southern Queensland
Figures are preliminary.
Where PDO Region was known.
* Figures are rounded to the nearest whole number.
North Coast
North Queensland
Central Queensland
Variation in 2024
from 2023
Year to Date to 28 July
Metropolitan
Transport and Main Roads
Program Delivery and Operations Region
Variation in 2024
from the
2019 to 2023 Avg

Queensland Road Crash Weekly Report, Transport and Main Roads Page 3 of 7
Fatalities: 1 January 2018 to 31 December 2023 and Year to Date to 29 February 2024
Table 5: Fatalities by characteristic
2018 2019 2020 2021 2022
no. no. no. no. no.
no. % no. % no.* % no. %
All fatalities 245 220 278 275 296 277 - -19 -6.4% 14 5.4% 49 -
Involving speeding drivers/riders 51 51 70 78 88 89 32.1% 1 1.1% 21 31.7% 13 26.5%
Involving drink drivers/riders 43 46 62 64 66 50 18.1% -16 -24.2% -6 -11.0% 11 22.4%
Involving drug drivers/riders~ 42 43 68 53 63 60 21.7% -3 -4.8% 6 11.5% 7 14.3%
Involving distracted/inattentive drivers/riders 33 22 26 25 36 32 11.6% -4 -11.1% 4 12.7% 6 12.2%
Fatigue related crashes (involving drivers/riders) 30 30 33 42 33 34 12.3% 1 3.0% 0 1.2% 11 22.4%
Involving young adult drivers/riders, aged 16 to 24 years 61 69 81 79 74 75 27.1% 1 1.4% 2 3.0% 13 26.5%
Involving young adult drivers/riders, aged 16 years 0 4 1 0 2 0 0.0% -2 -100.0% -1 -100.0% 1 2.0%
Involving young adult drivers/riders, aged 17 to 20 years 30 42 32 49 33 45 16.2% 12 36.4% 8 21.0% 9 18.4%
Involving young adult drivers/riders, aged 21 to 24 years 31 24 49 34 40 32 11.6% -8 -20.0% -4 -10.1% 4 8.2%
Involving senior adult drivers/riders, aged 60 to 74 years 62 46 49 50 76 55 19.9% -21 -27.6% -2 -2.8% 12 24.5%
Involving senior adult drivers/riders, aged 75 years or over 18 24 24 17 26 26 9.4% 0 0.0% 4 19.3% 4 8.2%
Involving learner drivers/riders 7 9 10 14 8 11 4.0% 3 37.5% 1 14.6% 2 4.1%
Involving provisional/P1/P2 drivers/riders 37 43 34 46 47 30 10.8% -17 -36.2% -11 -27.5% 4 8.2%
Involving unlicensed drivers/riders 26 24 37 39 40 43 15.5% 3 7.5% 10 29.5% 10 20.4%
Involving heavy freight vehicles 53 36 47 51 52 50 18.1% -2 -3.8% 2 4.6% 4 8.2%
Involving motorcycles (excluding mopeds) 41 44 55 67 72 81 29.2% 9 12.5% 25 45.2% 18 36.7%
Involving mopeds 2 2 0 0 2 1 0.4% -1 -50.0% 0 -16.7% 0 0.0%
Involving buses 5 0 3 3 4 3 1.1% -1 -25.0% 0 0.0% 0 0.0%
Child road user fatalities, aged 16 years or younger^ 12 14 15 15 17 7 2.5% -10 -58.8% -8 -52.1% 1 2.0%
Young adult road user fatalities, aged 17 to 24 years^ 45 53 49 48 51 56 20.2% 5 9.8% 7 13.8% 7 14.3%
Mature adult road user fatalities, aged 25 to 59 years^ 124 98 148 153 150 144 52.0% -6 -4.0% 9 7.0% 27 55.1%
Senior adult road user fatalities, aged 60 to 74 years^ 43 31 38 31 45 46 16.6% 1 2.2% 8 22.3% 10 20.4%
Senior adult road user fatalities, aged 75 years or over^ 20 24 28 28 33 24 8.7% -9 -27.3% -3 -9.8% 4 8.2%
Vehicle occupant fatalities 162 150 183 178 188 167 - -21 -11.2% -5 -3.0% 24 -
Vehicle occupant fatalities, where restraint use was known 112 110 139 147 144 137 - -7 -4.9% 7 5.1% 15 -
Unrestrained vehicle occupant fatalities# 31 28 43 40 40 40 29.2% - 5.1% - 4.6% 3 20.0%
Behaviour / Characteristic:
Fatalities as a result of crashes
1 January 2018 to 31 December 2023
and Year to Date to 29 February 2024
Variation in 2023
from 2022
Variation in 2023
from the 2018 to
2022 Avg
Year to Date to
29 February 2024
2023
Note:
Figures are preliminary.
* Figures are rounded to the nearest whole number.
^ Where age was known.
~ Drug driving figures for fatal crashes are available from 1 January 2017, therefore figures have been compared against the previous four year average.
# Restraint use is not applicable for all road user types (i.e. pedestrians, motorcycle riders/pillions, etc) and is not always known. Therefore the variation in unrestrained vehicle occupant casualties is
measured as a change in the percentage of all vehicle occupant casualties, instead of the change in number, where restraint use was known.
Queensland Road Crash Weekly Report, Transport and Main Roads Page 4 of 7
Fatalities per 100,000 population: 12 months to 30 June 2024
Table 6: Fatalities per 100,000 population, by state
Fatalities
Population
('000)
as at
Dec 2022
Fatalities
per 100,000
population
Fatalities
Population
('000)
as at
Dec 2023
Fatalities
per 100,000
population
Queensland 272 5,386.9 5.05 296 5,528.3 5.35 6.0%
New South Wales 291 8,249.3 3.53 358 8,434.8 4.24 20.3%
Victoria 266 6,719.5 3.96 290 6,906.0 4.20 6.1%
South Australia 93 1,836.1 5.07 101 1,866.3 5.41 6.8%
Western Australia 176 2,834.1 6.21 178 2,927.9 6.08 -2.1%
Tasmania 39 572.4 6.81 27 574.7 4.70 -31.1%
Northern Territory 31 251.2 12.34 55 253.6 21.68 75.8%
Australian Capital Territory 10 461.1 2.17 8 470.2 1.70 -21.5%
Rest of Australia 906 20,928.7 4.33 1,017 21,438.5 4.74 9.6%
Australian Total 1,178 26,315.6 4.48 1,313 26,966.8 4.87 8.8%
Data source:
Note:
State
July 2022 to June 2023
July 2023 to June 2024
Percentage
difference in rate
with previous 12
month period
Population: Australian Bureau of Statistics - Catalog 3101.0
Interstate fatalities: Relevant State Authority
Figures are preliminary
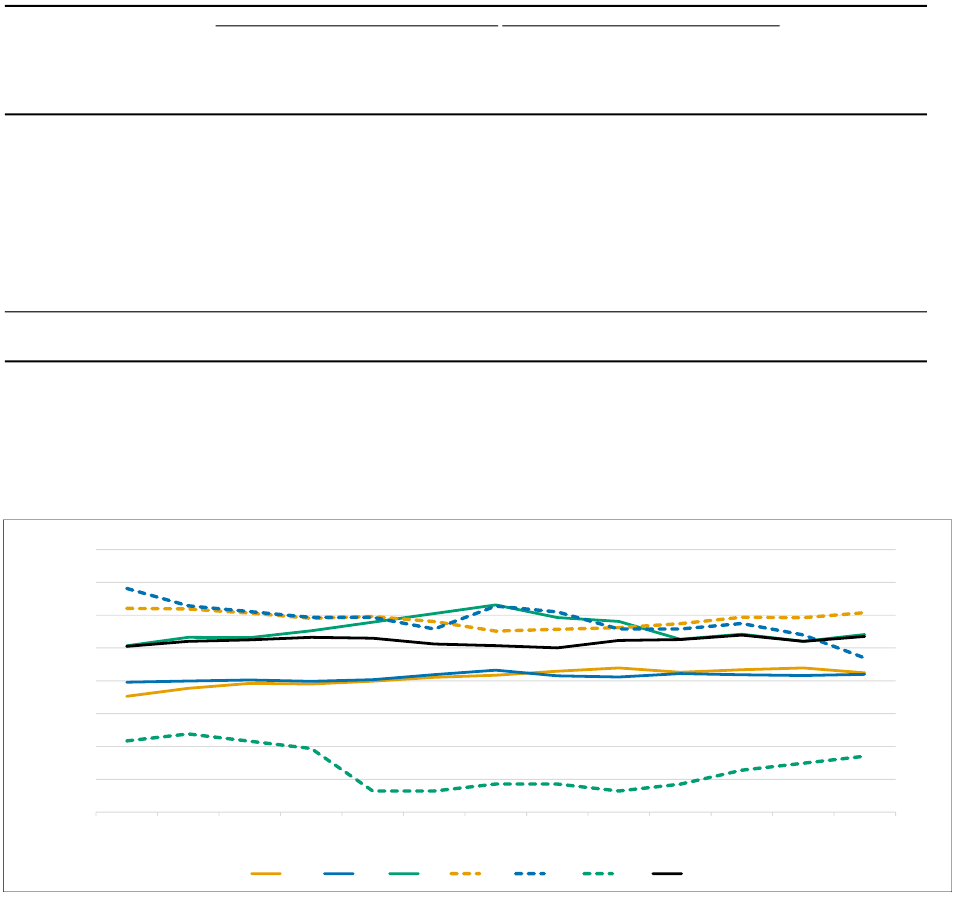
Figure 2: Road fatalities per 100,000 population, Australia
0
1
2
3
4
5
6
7
8
Jun-23 Jul-23 Aug-23 Sep-23 Oct-23 Nov-23 Dec-23 Jan-24 Feb-24 Mar-24 Apr-24 May-24 Jun-24
Fatalities per 100,000 population
12 months ending
Road fatalities per 100,000 population
NSW VIC SA WA TAS ACT QLD
For the 12 month period, 1 July 2023 to 30 June 2024:
• There were 296 fatalities within Queensland, which is 24 fatalities (or 8.8%) greater than the
previous 12 month period (272).
• The road fatality rate for Queensland was 5.35 fatalities per 100,000 population which is 6.0%
higher than the previous 12 month period (5.05) and is fifth behind the Australian Capital Territory
(1.70), Victoria (4.20), New South Wales (4.24) and Tasmania (4.70).
• There were 1,313 fatalities within Australia, which is 135 fatalities (or 11.5%) greater than the
previous 12 month period (1,178).
• The road fatality rate for Australia was 4.87 fatalities per 100,000 population which is 8.8% higher
than the previous 12 month period (4.48).
Queensland Road Crash Weekly Report, Transport and Main Roads Page 5 of 7
Hospitalised Casualties: Year to Date to Saturday, 30 September 2023
Table 7: Comparative Queensland Hospitalised Casualties
2018 2019 2020 2021 2022 2023
no. % no. ₁ %
4,109 4,244 4,053 4,810 4,477 5,064 587 13.1% 725 16.7%
5,058 5,305 4,973 6,010 5,579 6,265 686 12.3% 880 16.3%
2,793 2,966 2,799 3,524 3,132 3,458 326 10.4% 415 13.6%
974 1,042 930 1,093 1,061 1,087 26 2.5% 67 6.6%
758 761 748 830 770 924 154 20.0% 151 19.5%
269 265 274 255 268 314 46 17.2% 48 18.0%
- - - - - 155 - - - -
257 258 214 289 341 314 -27 -7.9% 42 15.5%
7 13 8 19 7 13 6 85.7% 2 20.4%
378 384 312 371 427 469 42 9.8% 95 25.3%
Note:
Hospitalised casualties involving heavy freight
vehicles₄
Variation in 2023
from the
2018 to 2022 Avg
Pedestrian hospitalised casualties
Total hospitalised casualties
Total hospitalisation crashes
Variation in 2023
from 2022
Bicycle rider and pillion hospitalised casualties
Driver hospitalised casualties
Passenger hospitalised casualties
Year to Date to 30 September
Motorcycle/Moped rider and pillion hospitalised
casualties
Personal mobility device user hospitalised
casualties₂
Other hospitalised casualties₃
₁
Figures are rounded to the nearest whole number.
₂
Personal mobility device users were recorded as pedestrians prior to 1 November 2022
₃
Includes other hospitalised casualties such as horse riders and train drivers and passengers.
₄ Includes all hospitalised casualties as a result of crashes involving heavy freight vehicles. These figures are also included in the road user type breakdown above
(e.g. drivers, passengers, etc).
Figures are preliminary.
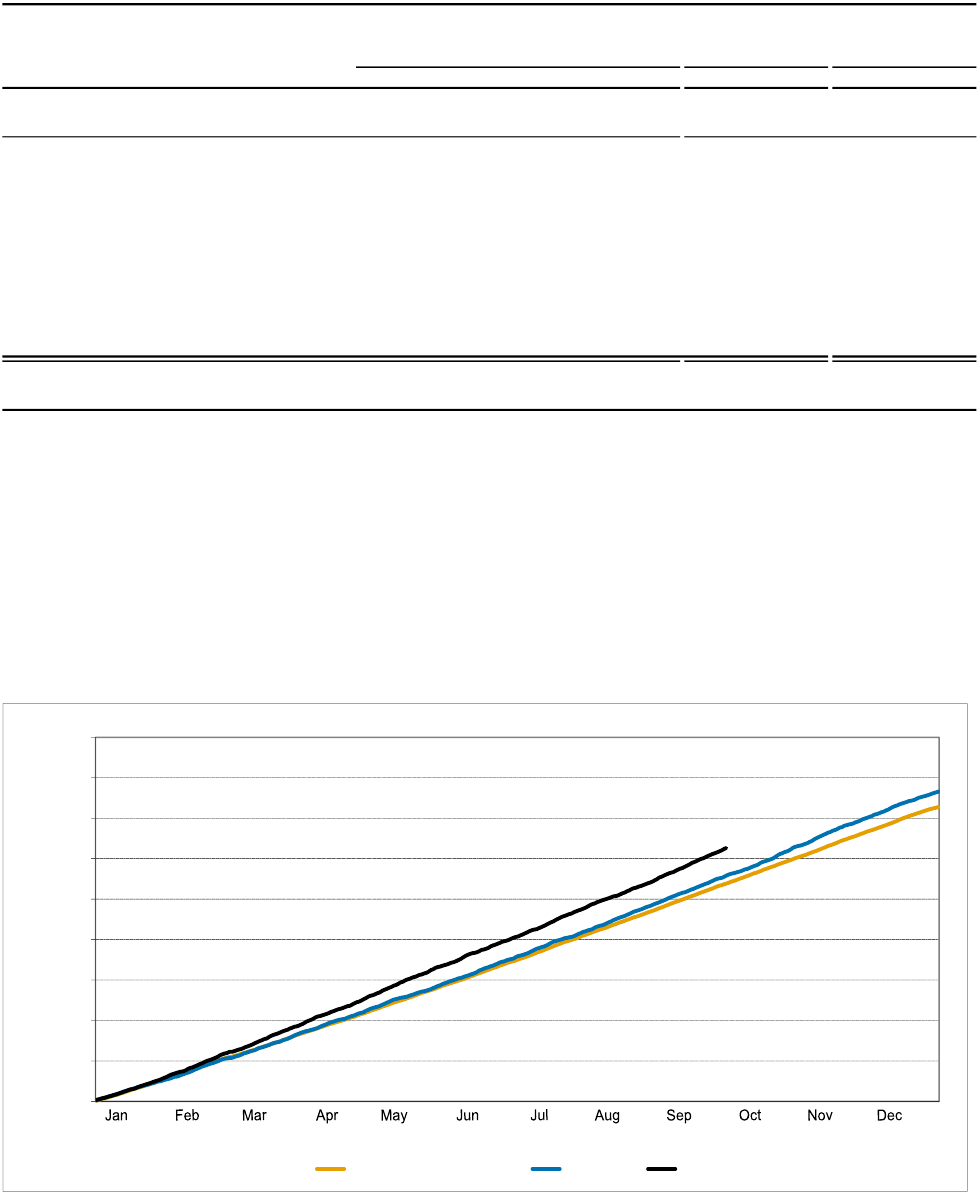
During 1 January to 30 September 2023, there were 6,265 hospitalised casualties as a result of crashes
within Queensland, which is 686 hospitalised casualties (or 12.3%) greater than the same period for the
previous year and 880 hospitalised casualties (or 16.3%) greater than the previous five year average for
the same period (Table 7).
Figure 3: Cumulative Daily Hospitalised Casualties, Queensland
0
1,000
2,000
3,000
4,000
5,000
6,000
7,000
8,000
9,000
Number of hospitalised casualties
Month
2018 to 2022 Average 2022 2023

Queensland Road Crash Weekly Report, Transport and Main Roads Page 6 of 7
Table 8: Hospitalised Casualties by Police Region
2018 2019 2020 2021 2022 2023
no. % no.* %
1,228 1,257 1,084 1,250 1,112 1,379 267 24.0% 193 16.3%
541 586 588 717 653 683 30 4.6% 66 10.7%
381 402 321 387 375 407 32 8.5% 34 9.1%
984 1,089 1,073 1,200 1,168 1,319 151 12.9% 216 19.6%
330 314 312 405 356 397 41 11.5% 54 15.6%
940 891 890 1,199 1,131 1,221 90 8.0% 211 20.9%
654 766 705 852 784 859 75 9.6% 107 14.2%
Note:
Southern
South Eastern
Where Police Region was known.
* Figures are rounded to the nearest whole number.
Year to Date to 30 September
Variation in 2023
from the
2018 to 2022 Avg
Central
Far Northern
Brisbane
Police Region
Variation in 2023
from 2022
Figures are preliminary.
North Coast
Northern
Table 9: Hospitalised Casualties by TMR Customer Services Branch Region
2018 2019 2020 2021 2022 2023
no. % no.* %
548 594 590 724 657 693 36 5.5% 70 11.3%
705 713 631 788 728 798 70 9.6% 85 11.9%
1,252 1,296 1,214 1,356 1,309 1,457 148 11.3% 172 13.3%
1,904 1,924 1,790 2,281 2,120 2,457 337 15.9% 453 22.6%
649 778 748 861 765 860 95 12.4% 100 13.1%
Note:
Figures are preliminary.
Where CSB Region was known.
* Figures are rounded to the nearest whole number.
Northern
SEQ North
Southern
Variation in 2023
from the
2018 to 2022 Avg
SEQ South
Central
Transport and Main Roads
Customer Services Branch Region
Variation in 2023
from 2022
Year to Date to 30 September
Table 10: Hospitalised Casualties by TMR Program Delivery and Operations Region
2018 2019 2020 2021 2022 2023
no. % no.* %
548 594 590 724 657 693 36 5.5% 70 11.3%
1,368 1,455 1,240 1,459 1,303 1,608 305 23.4% 243 17.8%
759 805 783 879 901 979 78 8.7% 154 18.6%
705 713 631 788 728 798 70 9.6% 85 11.9%
961 904 919 1,222 1,151 1,247 96 8.3% 216 20.9%
717 834 810 938 839 940 101 12.0% 112 13.6%
Note
Metropolitan
North Coast
Year to Date to 30 September
North Queensland
South Coast
Southern Queensland
Figures are preliminary.
Where PDO Region was known.
* Figures are rounded to the nearest whole number.
Variation in 2023
from the
2018 to 2022 Avg
Central Queensland
Variation in 2023
from 2022
Transport and Main Roads
Program Delivery and Operations Region
Queensland Road Crash Weekly Report, Transport and Main Roads Page 7 of 7
Hospitalised Casualties: 1 January 2017 to 31 December 2022 and Year to Date to 30 September 2023
Table 11: Hospitalised Casualties by Characteristic
2017 2018 2019 2020 2021
no. no. no. no. no.
no. % no. % no.* % no. %
All hospitalised casualties 6,517 6,823 7,016 7,011 7,905 7,662 - -243 -3.1% 608 8.6% 6,265 -
Involving speeding drivers/riders 297 380 338 391 451 487 6.4% 36 8.0% 116 31.1% 324 5.2%
Involving drink drivers/riders 643 621 634 803 891 823 10.7% -68 -7.6% 105 14.6% 599 9.6%
Involving drug drivers/riders 214 180 263 345 273 267 3.5% -6 -2.2% 12 4.7% 188 3.0%
Involving distracted/inattentive drivers/riders 1,128 1,361 1,482 1,488 1,643 1,747 22.8% 104 6.3% 327 23.0% 1,304 20.8%
Fatigue related crashes (involving drivers/riders) 405 470 479 474 544 547 7.1% 3 0.6% 73 15.3% 354 5.7%
Involving young adult drivers/riders, aged 16 to 24 years 2,096 2,187 2,223 2,439 2,613 2,437 31.8% -176 -6.7% 125 5.4% 2,017 32.2%
Involving young adult drivers/riders, aged 16 years 55 40 52 54 66 60 0.8% -6 -9.1% 7 12.4% 48 0.8%
Involving young adult drivers/riders, aged 17 to 20 years 1,049 1,110 1,165 1,306 1,387 1,308 17.1% -79 -5.7% 105 8.7% 1,127 18.0%
Involving young adult drivers/riders, aged 21 to 24 years 1,075 1,104 1,107 1,182 1,258 1,184 15.5% -74 -5.9% 39 3.4% 948 15.1%
Involving senior adult drivers/riders, aged 60 to 74 years 1,201 1,272 1,386 1,207 1,495 1,476 19.3% -19 -1.3% 164 12.5% 1,237 19.7%
Involving senior adult drivers/riders, aged 75 years or over 439 500 480 433 558 560 7.3% 2 0.4% 78 16.2% 469 7.5%
Involving learner drivers/riders 213 195 189 249 221 270 3.5% 49 22.2% 57 26.5% 204 3.3%
Involving provisional/P1/P2 drivers/riders 1,204 1,271 1,261 1,307 1,511 1,313 17.1% -198 -13.1% 2 0.2% 1,137 18.1%
Involving unlicensed drivers/riders 447 500 514 560 571 629 8.2% 58 10.2% 111 21.3% 474 7.6%
Involving heavy freight vehicles 445 494 501 454 500 541 7.1% 41 8.2% 62 13.0% 469 7.5%
Involving motorcycles (excluding mopeds) 936 965 965 1,004 1,074 1,030 13.4% -44 -4.1% 41 4.2% 936 14.9%
Involving mopeds 65 61 76 54 37 36 0.5% -1 -2.7% -23 -38.6% 33 0.5%
Involving buses 121 121 112 85 131 110 1.4% -21 -16.0% -4 -3.5% 67 1.1%
Child road user hospitalised casualties, aged 16 years or younger^ 483 482 487 524 610 625 8.2% 15 2.5% 108 20.8% 481 7.7%
Young adult road user hospitalised casualties, aged 17 to 24 years^ 1,407 1,426 1,449 1,634 1,705 1,593 20.8% -112 -6.6% 69 4.5% 1,342 21.5%
Mature adult road user hospitalised casualties, aged 25 to 59 years^ 3,530 3,694 3,826 3,787 4,221 4,043 52.9% -178 -4.2% 231 6.1% 3,323 53.1%
Senior adult road user hospitalised casualties, aged 60 to 74 years^ 744 851 871 761 920 949 12.4% 29 3.2% 120 14.4% 779 12.5%
Senior adult road user hospitalised casualties, aged 75 years or over^ 335 357 363 296 434 434 5.7% 0 0.0% 77 21.6% 330 5.3%
Vehicle occupant hospitalised casualties 4,784 5,118 5,302 5,298 6,056 5,811 - -245 -4.0% 499 9.4% 4,545 -
Vehicle occupant hospitalised casualties, where restraint use was known 3,928 4,274 4,479 4,369 5,109 4,912 - -197 -3.9% 480 10.8% 3,876 -
Unrestrained vehicle occupant hospitalised casualties# 185 189 180 188 206 238 4.8% - 20.2% - 13.3% 129 3.3%
Year to Date to
30 September 2023
2022
Behaviour / Characteristic:
Hospitalised casualties as a result of crashes
1 January 2017 to 31 December 2022
and Year to Date to 30 September 2023
Variation in 2022
from 2021
Variation in 2022
from the 2017 to
2021 Avg
Figures are preliminary.
* Figures are rounded to the nearest whole number.
^ Where age was known.
# Restraint use is not applicable for all road user types (i.e. pedestrians, motorcycle riders/pillions, etc) and is not always known. Therefore the variation in unrestrained vehicle occupant casualties is measured as a change in
the percentage of all vehicle occupant casualties, instead of the change in number, where restraint use was known.
Note:
