
Bradley M. Allan and Roland G. Fryer, Jr.
The Power and Pitfalls of Education Incentives
DISCUSSION PAPER 2011-07 | SEPTEMBER 2011

The Hamilton Project seeks to advance America’s promise
of opportunity, prosperity, and growth.
We believe that today’s increasingly competitive global economy
demands public policy ideas commensurate with the challenges
of the 21st Century. The Project’s economic strategy reflects a
judgment that long-term prosperity is best achieved by fostering
economic growth and broad participation in that growth, by
enhancing individual economic security, and by embracing a role
for effective government in making needed public investments.
Our strategy calls for combining public investment, a secure social
safety net, and fiscal discipline. In that framework, the Project
puts forward innovative proposals from leading economic thinkers
— based on credible evidence and experience, not ideology or
doctrine — to introduce new and effective policy options into the
national debate.
The Project is named after Alexander Hamilton, the nation’s
first Treasury Secretary, who laid the foundation for the modern
American economy. Hamilton stood for sound fiscal policy,
believed that broad-based opportunity for advancement would
drive American economic growth, and recognized that “prudent
aids and encouragements on the part of government” are
necessary to enhance and guide market forces. The guiding
principles of the Project remain consistent with these views.
MISSION STATEMENT

The Hamilton Project • Brookings 1
The Power and Pitfalls of
Education Incentives
Bradley M. Allan
EdLabs
Roland G. Fryer, Jr.
Harvard University, EdLabs
SEPTEMBER 2011
NOTE: is discussion paper is a proposal from the author. As emphasized in e Hamilton Project’s
original strategy paper, the Project was designed in part to provide a forum for leading thinkers across the
nation to put forward innovative and potentially important economic policy ideas that share the Project’s
broad goals of promoting economic growth, broad-based participation in growth, and economic security.
e authors are invited to express their own ideas in discussion papers, whether or not the Project’s sta or
advisory council agrees with the specic proposals. is discussion paper is oered in that spirit.
2 The Power and Pitfalls of Education Incentives
Abstract
ere is widespread agreement that America’s school system is in desperate need of reform, but many educational interventions
are ineective, expensive, or dicult to implement. Recent incentive programs, however, demonstrate that well-designed
rewards to students can improve achievement at relatively low costs. Fryer and Allan draw on school-based field experiments
with student and teacher incentives to oer a series of guidelines for designing successful educational incentive programs. e
experiments covered more than 250 urban schools in ve cities and were designed to better understand the impact of nancial
incentives on student achievement. Incentives for inputs, such as doing homework or reading books, produced modest gains
and might have positive returns on investment, and thus provide the best direction for future programs. Additionally, this paper
proposes directions for future incentive programs and concludes with implementation guidelines for educators and policymakers
to implement incentive programs based on the experiments’ research ndings and best practices. Incentive programs are not
enough to solve all the problems in America’s educational system, but they can denitely play a role in the larger solution.
The Hamilton Project • Brookings 3
Table of Contents
ABSTRACT 2
CHAPTER 1: EDUCATION IN AMERICA 5
CHAPTER 2: STUDENT INCENTIVE PROGRAM DETAILS AND RESULTS 8
CHAPTER 3: TEACHER INCENTIVE PROGRAM DETAILS AND RESULTS 12
CHAPTER 4: THE 10 DO’S AND DON’TS OF EDUCATION INCENTIVES 15
CHAPTER 5: MOVING FORWARD ON EVALUATING EDUCATION INCENTIVES 22
CHAPTER 6: STRUCTURING AND IMPLEMENTING INCENTIVE PROGRAMS 23
CONCLUSION 28
AUTHORS 29
ENDNOTES 30
REFERENCES 31
4 The Power and Pitfalls of Education Incentives
The Hamilton Project • Brookings 5
Chapter 1: Education in America
M
any believe that there is a “crisis” in American
education. On the Program for International
Student Assessment (OECD 2009), out of thirty-
four countries, our ninth graders rank twenty-h in math,
seventeenth in science, and fourteenth in reading achievement.
1
Seventy percent of American students graduate from high
school, which ranks the United States in the bottom quartile of
OECD countries (OECD 2007). In large urban areas with high
concentrations of blacks and Latinos, educational attainment
and achievement are even bleaker, with graduation rates as
low as 38 percent in Detroit and 31 percent in Indianapolis
(Swanson 2009). Of the eighteen districts in the National
Assessment of Educational Progress (NAEP) Trial Urban
District Assessment (TUDA) sample, at least half of the black
students in fourteen of these districts score at the “below basic”
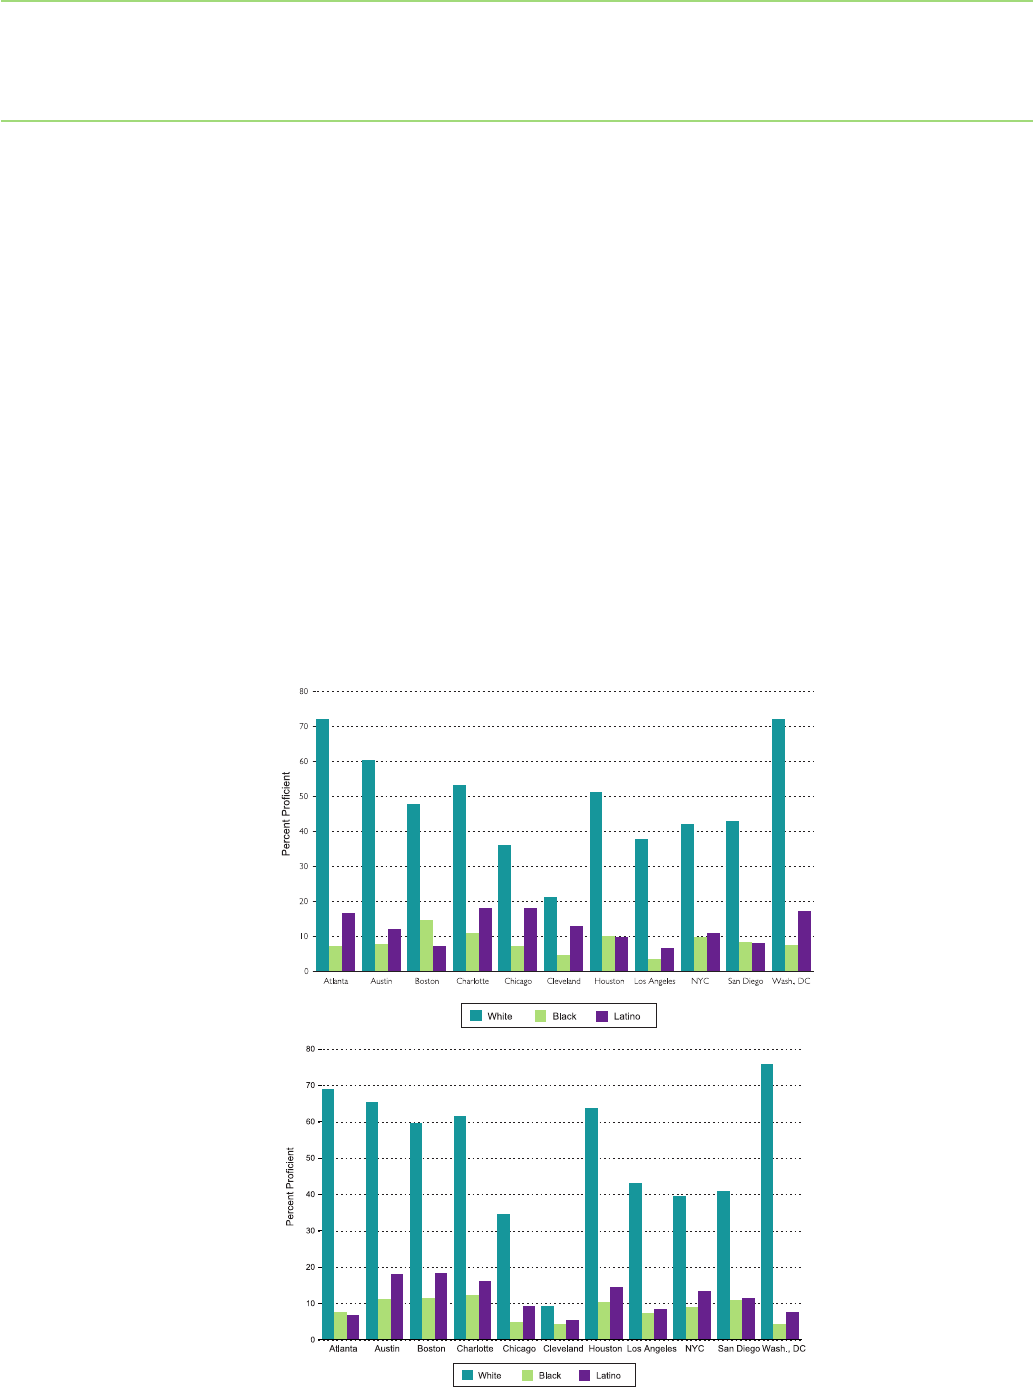
level on eighth-grade math. And, as Figure 1 demonstrates,
there is not a major city in the United States in which even
one fourth of black or Latino eighth graders are procient in
reading or math. In Detroit, for example, only 4 percent of
black fourth graders are procient in math; by eighth grade,
only 3 percent are procient. e performance of black and
Latino students on international assessments is roughly equal
to national performance in Mexico and Turkey—two of the
lowest-performing OECD countries.
FIGURE 1
Racial Differences in Achievement on NAEP, 8th Grade
Reading
Mathematics
Note: All means are calculated using sample weights. N=16,473.
Source: Fryer 2010.
Note: All means are calculated using sample weights. N=17,110.
6 The Power and Pitfalls of Education Incentives
In an eort to increase achievement and narrow dierences
between racial groups, school districts have become
laboratories for reforms. ese reforms include smaller schools
and classrooms (Krueger 2003; Nye, Fulton, Boyd-Zaharias,
and Cain 1995); mandatory summer school (Jacob and Lefgren
2004); aer-school programs (Lauer, Akiba, Wilkerson,
Apthorp, Snow, and Martin-Glenn 2006); budget, curricula,
and assessment reorganization (Borman, Slavin, Cheung,
Chamberlain, Madden, and Chambers 2007); policies to lower
the barrier to teaching via alternative paths to accreditation
(Decker, Mayer, and Glazerman 2004; Kane, Rocko, and
Staiger 2008); single-sex education (Shapka and Keating
2003); data-driven instruction (Datnow, Park, and Kennedy
2008); ending social promotion (Greene and Winters 2006);
mayoral or state control of schools (Henig and Rich 2004;
Wong and Shen 2002, 2005); instructional coaching (Knight
2009); local school councils (Easton, Flinspach, O’Connor,
Paul, Qualls, and Ryan 1993); reallocating per pupil spending
(Guryan 2001; Marlow 2000); providing more culturally
sensitive curricula (Banks 2001, 2006; Protheroe and Barsdate
1991; ernstrom 1992); renovated and more technologically
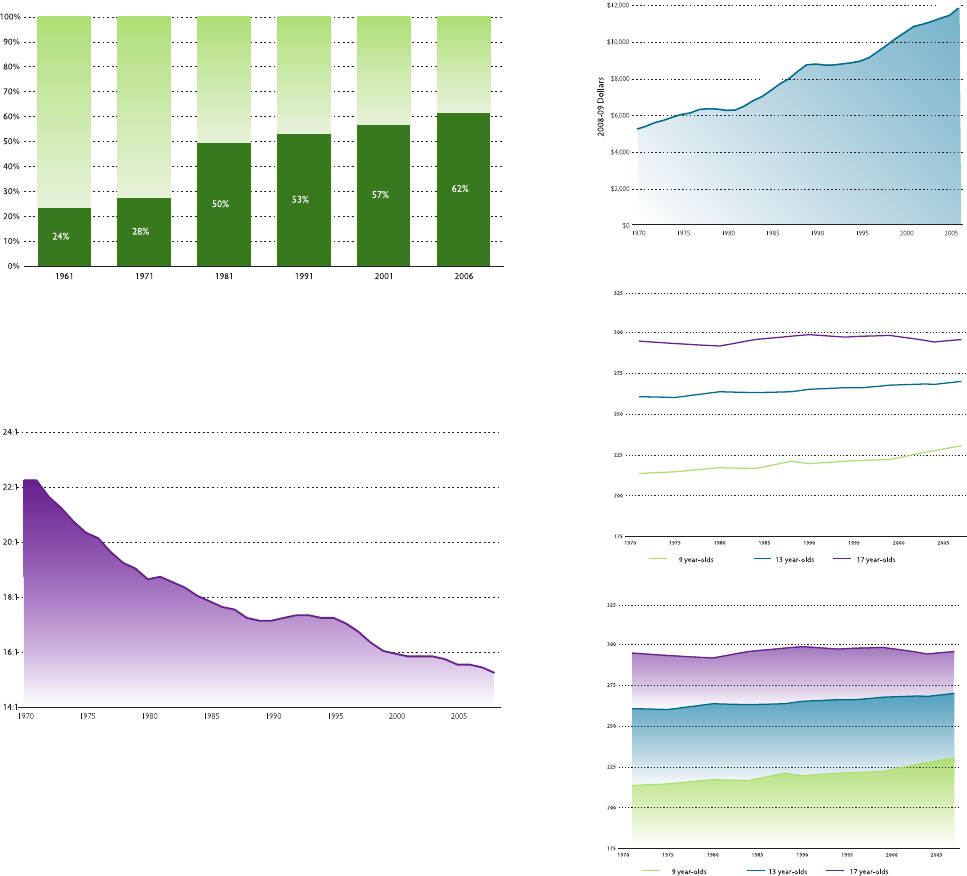
FIGURE 2
Conventional Wisdom Has Failed – Despite well-intentioned and intuitive reforms,
performance has been at since the 1970s.
Source: Snyder and Dillow 2010.
Percentage of Teachers with a Master’s Degree or Higher
Total Expenditure Per Pupil (In 2008-09 US Dollars)
Student to Teacher Ratio
Mean Reading and Math Achievement, 1971-2008
HS Graduates as a Ratio of 17 Year-Old Population
The Hamilton Project • Brookings 7
savvy classrooms (Goolsbee and Guryan 2006; Krueger and
Rouse 2004); professional development for teachers and other
key sta (Boyd, Grossman, Lankford, Loeb, and Wycko 2008;
Rocko 2008); and increasing parental involvement (Domina
2005).
Consider Figure 2. In 1961, 23.5 percent of teachers had a
master’s degree or higher. In 2001, 56.8 percent of teachers
had at least a master’s degree. Student-to-teacher ratios in
public schools have decreased from more than 22 to 1 in 1970
to 16 to 1 in 2000, a decrease of almost 30 percent in class
size in thirty years. America spends more on education than
ever: per pupil spending has increased (in 2008–2009 dollars)
from approximately $5,200 per student in 1970 to more than
$12,000 in 2007 (Snyder and Dillow 2011). Despite these
and many other intuitive eorts in the past three decades to
increase student achievement, even the most reform-minded
districts have shown little progress.
One potentially cost-eective strategy that has received
considerable attention recently is providing short-term
nancial incentives for students, teachers, parents, or
principals to achieve or exhibit certain behaviors correlated
with student achievement. eoretically, providing such
incentives could have one of three possible eects. (1) If
individuals lack sucient motivation, dramatically discount
the future, or lack accurate information on the returns to
schooling to exert optimal eort, then providing incentives
for achievement will yield increases in student performance.
(2) If individuals lack the structural resources or knowledge
to convert eort to measurable achievement or if their success
depends on forces out of their control (e.g., eective teachers,
motivated students, engaged parents, or peer dynamics), then
incentives will have very little impact. (3) Some argue that
nancial rewards for students (or any type of external reward
or incentive) will undermine intrinsic motivation and lead to
negative outcomes.
Between the 2007–2008 and 2010–2011 school years, we
conducted incentive experiments in public schools in ve
prototypically low-performing urban school districts—
Chicago, Dallas, Houston, New York City, and Washington,
DC—distributing a total of $9.4 million to roughly 36,000
students in 250 schools (including treatment and control
schools).
2
All experiments were randomized control trials
that varied from city to city on several dimensions: what was
rewarded, how oen students were given incentives, the grade
levels that participated, and the magnitude of the rewards.
e key features of each experiment consisted of monetary
payments to students, teachers, parents—and sometimes
all three—for performance according to a simple incentive
scheme. e incentive schemes were designed to be simple and
politically feasible. It is important to note at the outset that
these incentive schemes barely scratch the surface of what is
possible. We urge the reader to interpret any results as specic
to these incentive schemes and refrain from drawing more
general conclusions. Many more programs need to be tried
and evaluated before we can form more general conclusions
about the ecacy of incentives writ large.
e goal of this paper is three-fold. First, we provide an
overview of the literature on incentives in education and
develop a broad sense of the potential power (or, in many
cases, lack thereof) of incentives as a tool in a reformer’s
toolkit. Second, using the experimental evidence as a guide, we
develop a list of “10 Do’s and Don’ts” for the use of incentives
in education. ird, we provide a “How To” guide for policy-
makers or school districts that are interested in implementing
nancial incentives for teachers, students, or parents. In all
sections, we draw on scholarly work from Fryer (forthcoming),
which provides additional analysis of education incentive
experiments.
We begin by providing some key details of our experiments
on incentives and their implementation in ve cities (see
Fryer (forthcoming) for further details). We concentrate on
the incentive experiments implemented by the Education
Innovation Laboratory at Harvard University (EdLabs)
because of our access to important information about every
phase of the implementation and evaluation process, which
allows more adequate comparisons across experimental sites.
Chapters 2 and 3 provide a high-level summary of the results
of these experiments and how they compare with estimates
gleaned from other experimental analyses. Based on our
set of incentive experiments for students and teachers and
the literature, Chapter 4 exposits “10 Do’s and Don’ts” of
education incentive programs. Chapter 5 oers considerations
for evaluating incentive programs in the future, and Chapter 6
is an implementation supplement that provides guidelines for
structuring and implementing an incentive program.
America spends more on education than ever: per pupil
spending has increased from approximately $5,200 per
student in 1970 to more than $12,000 in 2007.

8 The Power and Pitfalls of Education Incentives
Chapter 2: Student Incentive Program Details
and Results
T
his section examines the evidence on student incentive
programs. Students in cities across the United States
were paid for inputs, such as reading books, completing
math assignments, and attending school, or for outputs, such as
grades and test scores. Although programs rewarding outputs
showed no signicant results, incentive programs can be a
cost-eective strategy to raise achievement if the incentives
are targeted for eective inputs, such as reading books and
completing math assignments.
STUDENT INCENTIVE PROGRAM DESIGN
Table 1 provides an overview of each experiment and species
conditions for each site. In total, experiments were conducted
in 250 schools across ve cities, distributing $9.4 million
to roughly 36,000 students. In all cities, the students in the
experimental sample were predominantly black or Latino.
In all cities except Washington, DC, more than 90 percent
of students were free lunch eligible, meaning that they were
Reward Structure Amounts Earned Operations
A. Input Experiments
Dallas Students earned $2 per book to read Average: $13.81 $126,000 total cost.
(2nd graders) books and pass a short test to ensure Max: $80 80% consent rate. One dedicated
they read it. project manager.
Washington DC Students were rewarded for meeting Average: $532.85 $3,800,000 distributed. 99.9% consent
(6th-8th graders) behavioral, attendance, and performance- Max: $1322 rate. 86% of students understood the
based metrics. They could earn up to basic structure of the program. Two
$100 every two weeks - up to $1500 dedicated project managers.
for the year.
Houston Students and parents earned $2 for each Student $870,000 distributed. 99.9% consent rate.
(5th graders) math objective the student mastered by Average: $228.72 Two dedicated project managers.
passing a short test, and parents earned Max: $1392
$20 for each teacher conference attended. Parent
Average: $254.27
Max: $1000
B. Output Experiments
NYC Students were paid for interim tests similar 4th grader $1,600,000 distributed. 82% consent rate.
(4th graders and 7th graders) to state assessments. 4th graders could Average: $139.43 90% of students understood the basic
earn up to $25 per test and $250 per year. Max: $244 structure of the program. 66% opened
7th graders could earn up to $50 per test 7th grader bank accounts. Three dedicated project
and $500 per year. Average: $232 managers.
Max: $495
Chicago Students earned money for their report Average: $422.93 $3,000,000 distributed. 88.97% consent
(9th graders) card grades. The scheme was A=$50, Max: $1000 rate. 91% of students understood the
B=$35, C=$20, D=$0, and F=$0 (and basic structure of the program. Two
resulted in $0 for all classes). They could dedicated project managers
earn up to $250 per report card and $2,000
total. Half of the rewards were given
immediately; the other half at graduation.
Notes: Each column describes a different aspect of treatment. Entries are school districts where the experiments were held. See Fryer (forthcoming) for further details.
TABLE 1
Student Incentive Treatments by School District
The Hamilton Project • Brookings 9
economically disadvantaged. In Washington, DC, more than
70 percent of students t this criterion.
e incentives can be divided into two general categories:
incentives for inputs and incentives for outputs. e output
of interest is student achievement, which is measured through
test scores or class grades. An input is anything that can
contribute to student learning. Generally, this category
includes high-quality teachers, a safe learning environment,
and student eort. In Dallas, Houston, and Washington, DC,
students were paid for inputs that were under their control.
ese included tasks such as reading books, doing homework,
attending school, or wearing a school uniform. In New York
City and Chicago, incentives were based on outputs.
e input experiments in Dallas, Houston, and Washington,
DC oered students incentives for either engaging in positive
behaviors or completing certain tasks. In Dallas, students
were rewarded for reading books and completing quizzes
based on the books. Students were allowed to select and read
books of their choice at the appropriate reading level and at
their leisure. Students were paid $2 for each book they read for
up to twenty books per semester.
Student incentives in Washington, DC, were based on a
combination of ve inputs, including attendance and behavior.
3
A typical scheme included attendance, behavior, wearing a
school uniform, homework, and class work. Students were
given as much as $10 per day for satisfying the ve criteria.
4
e Houston experiment applied incentives to students,
parents, and teachers. Students were given customized math
assignments that focused on their areas of weakness. Students
worked on these assignments at home with their parents or at
school outside of regular school hours and then took a quiz to
show that they had mastered the content. ey earned $2 for
each quiz they passed. Teachers could hold eight conferences
each year to update parents on their child’s progress. Both
parents and teachers were paid for each conference that they
attended. Parents could also earn money if their child passed
quizzes, as long as they attended at least one conference.
In addition, teachers and principals were both eligible for
bonuses through the HISD (Houston Independent School
District) ASPIRE (Accelerating Student Progress Increasing
Results and Expectations) program.
e output incentive programs paid students for test scores
and grades. In New York City, students took ten interim
assessments. For each test, fourth graders earned $5 plus
an amount proportional to their score. e magnitude of
the incentive was doubled for seventh graders. In Chicago,
students were paid for their grades in ve core courses.
5
STUDENT INCENTIVE PROGRAM RESULTS
Table 2 presents the results from the experiments described
above and includes estimates from the literature. e nal
columns report intent-to-treat (ITT) estimates from the
experiments. e ITT estimates capture the impact of
being oered a chance to participate in a nancial incentive
program, not of actually participating. An important potential
limitation of this set of experiments is that it was designed to
capture relatively large eects, and so some incentive programs
may generate positive returns even though they do not show
statistically signicant results.
6
Incentives can be a cost-effective strategy to raise
achievement among even the poorest minority students
in the lowest-performing schools.

10 The Power and Pitfalls of Education Incentives
Effect Effect in
in Standard Months of
Incentive Outcome Deviations Schooling
A. Input Experiments
Dallas $2 per book ITBS 2nd grade Reading Comp. 0.180** 2.250**
(0.075) (0.938)
Logramos 2nd grade Reading Comp. -0.165* -2.063*
(0.090) (1.125)
Washington DC Up to $100 per week for DC-CAS 6th-8th grade Reading 0.142 1.775
school-determined goals (0.090) (1.125)
DC-CAS 6th-8th grade Math 0.103 1.288
(0.104) (1.300)
Houston $2 per math objective Accelerated Math Objectives Mastered 0.985*** ______
(0.121)
TAKS 5th Grade Math 0.074* 0.925*
(0.044) (0.550)
B. Output Experiments
NYC Up to $250 for test results NY State Assmt. 4th grade ELA -0.026 -0.325
(0.034) (0.425)
NY State Assmt. 4th grade Math 0.062 0.775
(0.047) (0.588)
Up to $500 for test results NY State Assmt. 7th grade ELA 0.004 0.050
(0.017) (0.213)
NY State Assmt. 7th grade Math -0.031 -0.388
(0.037) (0.463)
Chicago Up to $250 per report card for PLAN 9th grade Reading -0.006 -0.075
grades (0.028) (0.350)
PLAN 9th grade Math -0.010 -0.125
(0.023) (0.288)
C. Other Incentive Programs
Rural Ohio Cash for test scores Terra Nova, Ohio Achievement, Math 0.133** 1.663**
(0.049) (0.609)
Kenya Scholarships for test scores Kenya Cert. of Primary Ed. Exam 0.12** 1.50**
(0.07) (0.88)
Israel Cash for test scores Bagrut HS Matriculation Exam 0.067* 0.838*
(0.036) (0.450)
Notes: The first three columns describe the treatment and its location. The last two columns are intent-to-treat estimates of the effect of being offered a chance to participate in treatment on the
outcome listed in column three. All regressions control for demographic factors and previous test scores and include all members of the experimental group with non-missing reading or math
test scores. Results marked with *, **, and *** are significant at the 10%, 5%, and 1 percent levels, respectively. Entries are school districts where the experiments were held. Conversion factor
of 0.08 standard deviations=1 month of schooling. See Fryer (forthcoming) for further details.
TABLE 2
Average Effects of Student Incentive Programs
The Hamilton Project • Brookings 11
Results are reported in standard deviations (Column 4) and
months of schooling (Column 5). A standard deviation is
the distance between ranking in the middle of the class and
ranking at the 84th percentile. A student typically improves
by about 1.0 standard deviation over the course of 1.4 years
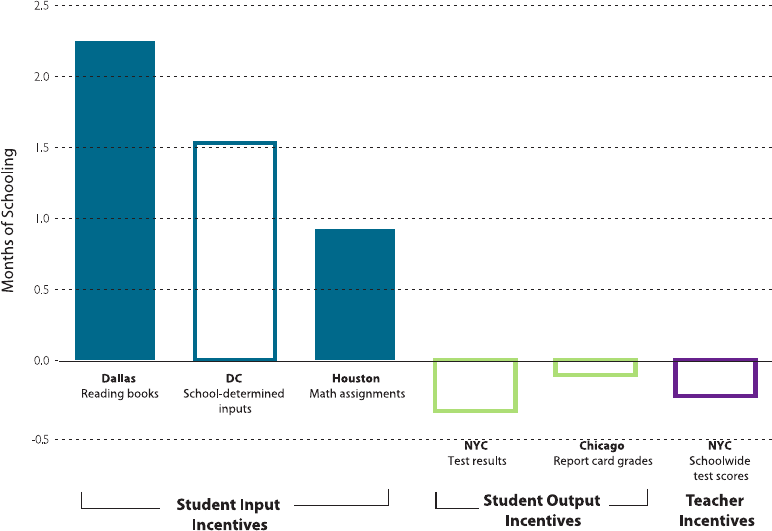
academic school years, or 12.5 months. Figure 3 summarizes
the results of all the incentive experiments.
Figure 3 (and the rst three rows of table 2) demonstrate that
incentives can be a cost-eective strategy to raise achievement
among even the poorest minority students in the lowest-
performing schools if the incentives are given for certain
inputs to the educational production function. Paying students
to read books yields large and statistically signicant increases
in reading comprehension. Paying students for attendance,
good behavior, wearing their uniforms, and turning in their
homework yields a similar estimate; due to imprecision,
however, the eects are not statistically signicant.
In Houston, where parents, students, and teachers were all
given incentives for a student’s mastery of math objectives,
students who were given incentives mastered 125 percent more
objectives than did students who were not given incentives.
However, because the focus of the math quizzes was not
tightly aligned with the topics that appeared on the statewide
test, the eects on measured mathematics achievement on the
state test were more muted.
7
Conversely, the output experiments demonstrate less-
promising results. Paying for performance on standardized
tests in New York City did not signicantly aect test scores
in math or reading. Rewarding ninth graders in Chicago for
their grades similarly has no eect on achievement test scores
in math or reading.
ese experimental results are broadly consistent with
international results that show mixed eects for output
incentives. Kremer, Miguel, and ornton (2009) evaluated a
merit scholarship program in Kenya, where girls in the top 15
percent of the two participating districts received scholarships
to oset school fees. ey found that the program raised test
scores by 0.13 standard deviations. Angrist and Lavy (2009)
examined a program in Israel that oered scholarships to
students from low-achieving schools for passing the Bagrut,
but they do not nd signicant eects.
8
FIGURE 3
Impact of Incentive Programs on Student Achievement
Notes: Solid bars represent impacts that are extremely unlikely to have occurred through chance. These results are statistically significant at the 10% level. Results are impacts on standardized
tests, averaged over subjects and grade levels where applicable. See Fryer (forthcoming) for further details.
Source: Fryer (forthcoming) and data from the authors.
12 The Power and Pitfalls of Education Incentives
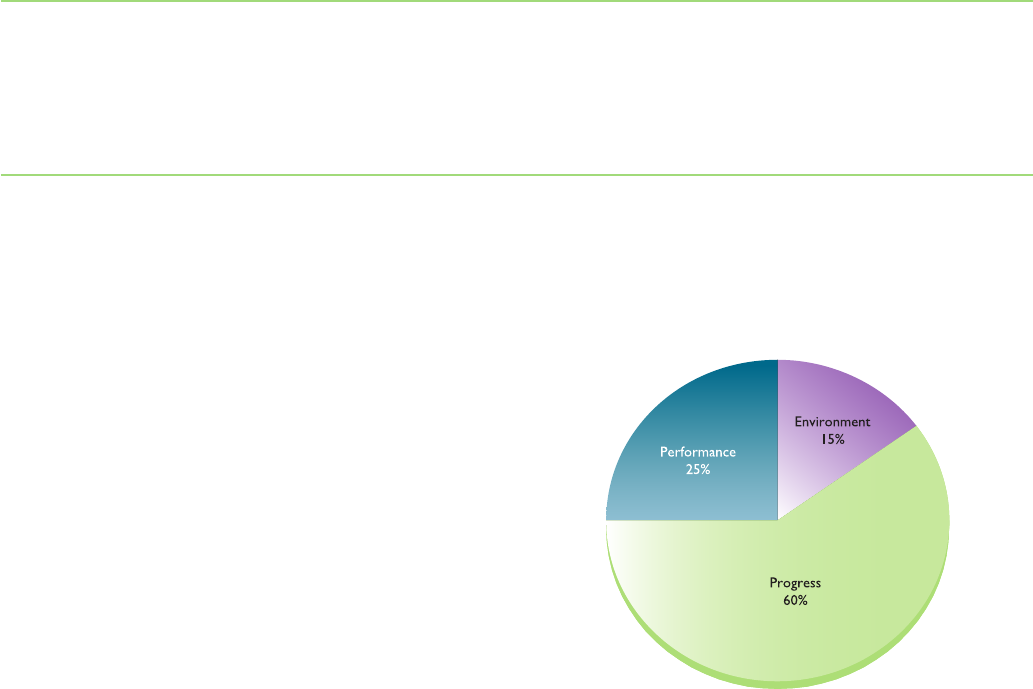
FIGURE 4
Progress Report Card Metrics
Chapter 3: Teacher Incentive Program Details
and Results
E
xperiments with teacher incentive programs in the
United States, such as one in New York City, nd
that nancial incentives given to teachers for student
achievement are not eective. is result may depend on
the structure of the particular incentive program tested. A
great deal more research is needed on the ecacy of teacher
incentives.
NEW YORK CITY
On October 17, 2007, New York City’s mayor, schools
chancellor, and the president of the United Federation of
Teachers (UFT) announced an initiative to provide teachers
with nancial incentives to improve student performance,
attendance, and school culture. Schools that met their
achievement target would be awarded $3,000 per teacher,
and schools that met 75 percent of their target would receive
$1,500 per teacher. Each school decided at the beginning of the
year how the bonus would be distributed among teachers and
other sta, but incentives were not allowed to be distributed
according to seniority. Schools could have chosen to distribute
the incentives to teachers based on which classes showed the
most improvement in students’ achievement, but instead an
overwhelming majority of schools chose an incentive scheme
that gave teachers more or less the same award, varied only by
position held in the school.
Figure 4 shows how the progress report card score, which is
the basis for awarding incentives to schools, is calculated. In
each of the three categories—learning environment, student
performance, and student progress—schools were evaluated
by their relative performance in each metric compared to their
peer schools and all schools in the city, with performance
relative to peer schools weighted three times as heavily as
performance relative to all schools citywide. However, because
it is calculated using many metrics and because scores in each
metric are calculated relative to other schools, it is not obvious
how much eort is needed to raise the progress report card
score by, say, one point.
Subscore Example Criteria
Environment 5% Attendance, 10% Learning Environment
Survey results
Progress Elementary/Middle schools: Average change
in state exam proficiency rating among level
1 and 2 students, average change in state
exam proficiency ratings among level 3 and 4
students, percentage of students making a year
of progress among the bottom third
High schools: Percentage of students earning
more than 10 credits among the bottom third,
weighted Regents pass rates, average comple-
tion rates of remaining Regents
Performance Elementary/Middle schools: Proportion
of students at state ELA and math exam
performance level 3 or 4, state exam median
proficiency ratings
High schools: 4- and 6-year graduation rates,
diploma-weighted graduation rates
Source: New York Department of Education (2011a, 2011b).

The Hamilton Project • Brookings 13
Results of the New York City teacher incentive scheme are
presented in Table 3, and the total eect is compared to
the impacts of student incentives in Figure 3. Across eight
outcomes, there is no evidence that teacher incentives increase
student performance, attendance, or graduation, nor is there
any evidence that the incentives change teacher behavior. If
anything, the evidence suggests that teacher incentives may
decrease student achievement, especially in larger schools.
Elementary Middle School High School
Outcome Standard Months of Standard Months of Standard Months of
Deviations Schooling Deviations Schooling Deviations Schooling
A. Effects on Student Achievement
NY State Assessment ELA -0.011 -0.138 -0.032** -0.400** --- ---
(0.020) (0.250) (0.011) (0.138)
NY State Assessment Math -0.015 -0.188 -0.048** -0.600** --- ---
(0.024) (0.300) (0.017) (0.213)
Regents Exam ELA --- --- --- --- -0.003 -0.038
(0.044) (0.550)
Regents Exam Math --- --- --- --- -0.011 -0.138
(0.031) (0.388)
Attendance Rate -0.018 --- -0.019 --- -0.014 ---
(0.020) (0.022) (0.050)
GPA -0.001 --- 0.001 --- -0.004 ---
(0.040) (0.031) (0.029)
4-year Graduation Rate --- --- --- --- -0.044** ---
(0.021)
B. Effects on Teacher Behavior
Retention in District 0.002 --- -0.006 --- --- ---
(0.006) (0.011)
Retention in School -0.007 --- -0.027 --- --- ---
(0.021) (0.017)
Personal Absences 0.275 --- -0.440 --- --- ---
(0.212) (0.403)
Notes: The first column describes the outcome of interest for that row. The last five columns are intent-to-treat estimates of the effect of being offered a chance to participate in treatment on
the outcome listed in column one. All regressions control for demographic factors and previous test scores and include all members of the experimental group or subgroup with non-missing
reading or math test scores. Results marked with *, **, and *** are significant at the 10%, 5%, and 1 percent levels, respectively. Entries are school districts where the experiments were held.
Conversion factor of 0.08 standard deviations=1 month of schooling.
TABLE 3
Average Effects of Teacher Incentive Programs
14 The Power and Pitfalls of Education Incentives
OTHER INCENTIVE PROGRAMS
An individual-based teacher incentive program elsewhere
in the United States similarly found no impact on student
achievement. Springer and colleagues (2010) evaluated teacher
incentives in Nashville. Middle school math teachers were
awarded $5,000, $10,000, and $15,000 bonuses if their students
performed at the 80th, 90th, and 95th percentiles, respectively,
in the historical distribution of class performance. Springer
and colleagues found no signicant eects on student
achievement or teaching practices.
ere are a couple of nonexperimental evaluations of teacher
incentive programs in the United States, both of which
report nonsignicant impacts on student achievement
(Glazerman, McKie, and Carey 2009; Vigdor 2008). e
Teacher Advancement Program (TAP) in Chicago rewarded
teachers based on classroom observations (50 percent) and
schoolwide student growth on Illinois state exams (50 percent).
Evaluations of TAP in its rst two years nd no impact on
student achievement, but further time is needed to determine
the program’s eect, especially because the structure of the
program is still changing and teachers can adapt to new
incentives (Glazerman and Seifullah 2010).
9
Other schools also have implemented performance pay
programs for teachers, but there is little rigorous evidence on
their eectiveness. Most school districts that have implemented
performance pay for teachers use similar metrics to those
used in New York City to measure teacher’s performance. For
example, Houston’s ASPIRE program uses measures of the
impact of both schools and individual teachers on student
test score growth in state exams to reward the top 50 percent
of teachers, with the top 25 percent receiving an extra bonus.
Alaska’s Public School Performance Incentive Program
divides schoolwide student achievement into six categories
and rewards teachers based on the average movement up to
higher categories. Florida’s STAR uses a similar approach, but
at a teacher level instead of a school level. Virginia is piloting
a program with individual incentives for teachers at hard-to-
sta schools.
Other experimental evaluations come from other countries.
Duo and Hanna (2005) provided schools in rural India with
incentives to reduce absenteeism and found positive eects
on teacher attendance and student achievement. In India,
Glewwe Ilias, and Kremer (2010) found that group incentives
for teachers based on test scores increased test scores in the
short run, but that students did not retain the gains aer the
program ended. Finally, Muralidharan and Sundararaman
(forthcoming) investigate the eect of individual and group
incentives in India, nding increases in student achievement
from both types of incentives, although individual incentives
were more successful in the second year.
e eectiveness of teacher incentives can vary a good
deal depending on the context; more research is needed on
incentive design and eectiveness. One common feature of
incentive programs tested is that they compare teachers’ or
schools’ performance to the distribution of performance
in the district. In this system, teachers may feel that their
measured performance is not entirely in their control because
it also depends on how well teachers at other schools are doing
(since teachers are compared to other teachers). Additionally,
the incentives experimented with in New York City were
awarded based on overall school performance. Because
schools then chose to distribute the incentives more or less
equally internally, teachers were not awarded based on their
individual eort. is ambiguity—the likelihood of receiving
an incentive depends on one’s own eort and the eort of
others—may make increased eort seem less worthwhile.
Another possibility is that these programs simply have not
been in place for long enough for teachers to properly react
and adapt their teaching habits.
The effectiveness of teacher incentives can vary a good deal
depending on the context…

The Hamilton Project • Brookings 15
Chapter 4: The 10 Do’s and Don’ts of
Education Incentives
T
his section expatiates “10 Do’s and Don’ts” of education
incentive programs based on our set of incentive
experiments for students and teachers and the literature
from elsewhere in the United States and around the world.
1. DO PROVIDE INCENTIVES FOR INPUTS, NOT
OUTPUTS, ESPECIALLY FOR YOUNGER CHILDREN.
Economic theory predicts that incentives based on outputs or
achievements, such as test scores or grades, will work better
than incentives based on inputs, such as a required time for
reading and homework. e theory would suggest that not
all students learn the same, and they individually know what
works best for them with regard to activities such as time
spent doing homework, reading books, and listening in class
to achieve the best outcome. Incentives for inputs are basically
rewards for specic behaviors that may lead students to focus
on that input (i.e., reading or better behavior) even if it is not
the input that will most help them achieve higher grades.
Incentives for the desired output or achievement would instead
empower each student to decide how to improve his output.
As any parent knows, however, this simple set of assumptions
does not always hold true; therefore, in some cases, it can be
more eective to provide incentives for inputs. In the end, this
is the result that our research supported.
In our experiments, input incentives were more eective than
output incentives, suggesting that students do not know how
to increase their test scores. If students only have a vague
idea of how to increase their test scores, then when provided
with incentives for performance, they may not be motivated
to increase eort. In Dallas, Houston, and Washington, DC,
students were not required to know how to increase their test
scores: they only needed to know how to read books on their
grade level, master math objectives, attend class, behave well,
wear their uniforms, and so on. In other words, they were
rewarded for inputs. In New York City, students were required
either to know how to improve test scores or to know someone
who could help them with the task. In Chicago, students faced
a similar challenge—they were required to undertake the
necessary steps to improve their performance.
In addition to our quantiable ndings, there is also qualitative
data supporting the theory that students do not respond well
to the general challenge of improving their performance, or
output. During the 2008–2009 school year, seven full-time
qualitative researchers in New York City observed twelve
students and their families, as well as ten classrooms. From
detailed interview notes, the researchers gathered that students
were uniformly excited about the incentives and the prospect
of earning money for school performance. In a particularly
illuminating example, one of the treatment schools asked their
students to propose a new “law” for the school, a pedagogical
tool to teach students how bills make their way through
Congress. e law that students chose to study, by a nearly
unanimous vote, was a proposal that students take incentive
tests every day.
Despite showing that students were excited about the incentive
programs, the qualitative data also demonstrate that students
had little idea about how to translate their enthusiasm into
tangible steps designed to increase their achievement. Aer
each of the ten exams administered in New York City, our
qualitative team asked students how they felt about the
rewards and what they could do to earn more money on
the next test. Every student found the question about how
to increase his or her scores dicult to answer. Students
answering this question discussed test-taking strategies rather
than salient inputs into the education production function or
improving their general understanding of a subject area. For
instance, many of the students expressed the importance of
“reading the test questions more carefully,” “not racing to see
who could nish rst,” or “re-reading their answers to make
sure they had entered them correctly.” Not a single student
mentioned reading the textbook, studying harder, completing
homework, or asking teachers or other adults for help with
confusing topics.
Two focus groups in Chicago conrmed the more
systematically collected qualitative data from New York City.
e focus groups included a total of thirteen students, evenly
split (subject to rounding) between blacks and Latinos, males
and females. Again, students reported excitement about
receiving nancial incentives for their grades. Students also
reported that they attended school more, turned in more
homework, and listened more in class. Yet when probed about
16 The Power and Pitfalls of Education Incentives
why other inputs to the educational production function were
not used—reading books, staying aer school to work on more
problems, asking teachers for help when they were confused,
reviewing homework before tests, or doing practice problems
presented in textbooks—one female student remarked, “I
never thought about it.” e basic themes from students in
Chicago centered on the excitement generated by the program
at the beginning of the year. is excitement triggered more
eort initially—coming to school, paying attention in class,
and so on. Students indicated that they did not notice any
change in their performance on quizzes or tests, however, so
they eventually stopped trying. As one student put it, “Classes
were still hard aer I tried doing my homework.”
A similar argument may partially explain the ineectiveness
of the teacher incentives tested. It is plausible that teachers do
not know how to increase student achievement without proper
coaching and development. If true, teachers face the same
challenges as students in responding to the general challenge
of improving student performance, or output. Rather, future
teacher incentive programs may try to link additional
compensation to activities, behaviors, or training that policy-
makers believe are correlated with student performance.
2. DO THINK CAREFULLY ABOUT WHAT TO
INCENTIVIZE.
Ideally, providing incentives for a particular activity would
have spillover eects on many other activities. For instance,
paying students to read books might make them equally
excited about math. Or paying students for attendance and
behavior—as we did in Washington, DC—might increase
enthusiasm for school so much that students engage in new
ways with their teachers. From our set of experiments, these
eects did seem to take place. Incentives seem to change
what people do, and not who they are. Unfortunately, since
the standard errors are so large in our DC experiment, it is
unclear whether this principle holds there, because we cannot
rule out modest-sized eects in either direction.
Across our set of experiments, we collected self-reported
measures of eort and investigated achievement on
dimensions in which we did not provide incentives. In every
experiment the data were clear: students did precisely what
they were paid to do, and not any more. Indeed, our team
of qualitative researchers reported general excitement by
students about earning rewards, but the students seem to have
focused their behavioral changes on precisely those elements
that were incentivized.
us, one has to think very carefully about what to provide
incentives for and target those incentives to achievement-
enhancing activities. For instance, it is plausible that some
of the inputs for which we provided incentives—behavior,
attendance, turning in homework regardless of the quality—
are not well suited to achievement gains. As discussed
above, we cannot rule out the possibility that the experiment
produced modest gains on these dimensions. But, due to
imprecision, the achievement eects of this experiment are
only marginally signicant.
3. DO ALIGN INCENTIVES.
Among the incentive programs tried, the one that has shown
the most power on direct outcomes is our experiment in
Houston that aligned the incentives of teachers, students, and
parents. Recall that treatment students mastered 125 percent
(or 0.985 standard deviations) more objectives than control
students. Furthermore, according to student and parent
surveys, parents of students in treatment attended 87 percent
(or 0.829 standard deviations) more teacher conferences than
parents of control students.
Since teachers, students, and parents can all play a role in
learning, incentives may be more eective when they are
all nudged toward the same goal. ere may be important
factors outside of a student’s or teacher’s control that aect
performance. For instance, student incentives may need to be
coupled with good teachers, an engaging curriculum, eective
parents, or other inputs in order to produce output. In Dallas,
students were encouraged to read books independently and at
their own pace. In Washington, DC, we provided incentives
for several inputs, many of which may be complementary. It
is plausible that increased student eort, parental support and
guidance, and high-quality schools would have been necessary
and sucient conditions for test scores to increase during our
Chicago or New York City experiments. An anecdote from
our qualitative interviews illustrates the potential power of
parental involvement and expectations coupled with student
incentives to drive achievement. Our interviewers followed
a high-performing Chinese immigrant student home when
she told an illiterate grandmother that she had earned $30 for
her performance at school. Her grandmother immediately
retorted, “But Jimmy next door won more than you!”
The Hamilton Project • Brookings 17
4. DON’T THINK THE EFFECTS GO AWAY
IMMEDIATELY AFTER THE INCENTIVES ARE
REMOVED.
A central question in the study of incentives is what happens
when the incentives are taken away. Many believe that
students will have decreased intrinsic motivation and that
their achievement will be negative once the incentives are
discontinued. (See Kohn 1993 and references therein.)
Contrary to this view, the point estimate one year aer the
Dallas experiment is roughly half of the original eect in
reading and larger in math. e nding for reading is similar
to the classic “fade-out” eect that has been documented in
other successful interventions, such as Head Start, a high-
quality teacher for one year, or a reduced class size (Nye,
Hedges, and Konstantopoulos 1999; Puma, Bell, Cook, and
Heid 2010).
Furthermore, fading of test score gains does not necessarily
mean that there are no positive long-term outcomes. One
study that links kindergarten test scores with adult wages
nds that even when test score gains disappear in later grades,
the eects appear again in earnings as an adult (Chetty,
Friedman, Hilger, Saez, Schanzenbach, and Yagan 2011). In
the experiment, kindergarteners were randomly assigned to
dierent classrooms. Some of these classrooms had better
teachers or meshed together better. Chetty and colleagues
identied kindergarteners who received a boost in their test
scores from being randomly assigned to better classrooms.
ese students did not score signicantly better on tests in later
grades, but earned more as adults. One possible explanation
is that good kindergarten classes teach other skills, such as
patience and work ethics, that may not inuence test scores
later on, but do inuence income.
5. DON’T BELIEVE THAT ALL EDUCATION INCENTIVES
DESTROY INTRINSIC MOTIVATION.
One of the major criticisms of the use of incentives to boost
student achievement is that the incentives may destroy a
student’s “love of learning.” In other words, providing external
(extrinsic) rewards can crowd out a student’s internal (intrinsic)
motivation. ere is an active debate in psychology as to
whether extrinsic rewards crowd out intrinsic motivation.
11
In a review of the literature surrounding the detrimental eects
of extrinsic rewards on intrinsic motivation, Eisenberger and
Cameron (1996) conclude that although there can be negative
eects on intrinsic motivation from certain uses of extrinsic
reward structures, these circumstances are restricted and
do not eliminate the use of extrinsic rewards altogether.
Eisenberger and Cameron claim, however, that there are many
uses of incentives that do not diminish student motivation.
12
To test the impact of our incentive experiments on intrinsic
motivation, we administered the Intrinsic Motivation
Inventory, developed by Ryan (1982), to students in our
experimental groups. e inventory has been used in several
experiments related to intrinsic motivation and self-regulation
(e.g., Deci, Eghrari, Patrick, and Leone 1994; Ryan, Koestner,
and Deci 1991). e instrument assesses participants’ interest/
enjoyment, perceived competence, eort, value/usefulness,
pressure and tension, and perceived choice while performing
a given activity. ere is a subscale score for each of those six
categories. We include only the interest/enjoyment subscale in
our surveys because it is considered the self-report measure
of intrinsic motivation. e interest/enjoyment instrument
consists of seven statements on the survey: (1) I enjoyed doing
this activity very much. (2) is activity was fun to do. (3) I
thought this was a boring activity. (4) is activity did not
hold my attention at all. (5) I would describe this activity as
very interesting. (6) I thought this activity was quite enjoyable.
(7) While I was doing this activity, I was thinking about how
much I enjoyed it. Respondents are asked how much they
agree with each of the above statements on a seven-point
Likert scale ranging from “not at all true” to “very true.” To
get an overall intrinsic motivation score, we added the values
for these statements (reversing the sign on Statements [3] and
[4]). Only students with valid responses to all statements are
included in our analysis of the overall score, as nonresponse
may be confused with low intrinsic motivation.
Table 4 reports the impact of our set of experiments on the
intrinsic motivation of students in each city. Contrary to
Deci (1972), Kohn (1993), and others, these results show that
our incentive programs had little to no eect on intrinsic
motivation. is suggests that the hyperconcern of some
educators and social psychologists that nancial incentives
destroy a student’s intrinsic motivation may be unwarranted
in this context.
Incentives seem to change what
people do, and not who they
are…. In every experiment the
data were clear: students did
precisely what they were paid to
do, and not any more.

18 The Power and Pitfalls of Education Incentives
6. DON’T WORRY THAT STUDENTS WASTE THE
MONEY THEY EARN.
e spending habits of our subjects was a common query, and
in response we asked detailed questions in every experiment
about what students spent their money on, how much was
saved, and how much their parents took away from them. e
results were enlightening, and are summarized in Table 5.
13
Our incentives experiments produced a large eect on students’
saving habits: in Washington, DC, treatment students were
27.8 percent more likely than control students to have saved
over $50, while in Houston, treatment students were 45.4
percent more likely to have saved over $50. Both estimates
are signicant at the 1 percent level. On the other hand, in
Washington, DC, paying students produced signicant
negative eects on student spending on entertainment (–$9.96
per month), clothing (–$25.84 per month), food (–$12.84
per month), and even household bills (–$6.96 per month).
Likewise, in Houston point estimates revealed large negative
eects: –$14.57, –$6.76, –$2.55, and –$0.03, respectively. All
DC results were signicant below the 5 percent level, while in
Houston, only the decrease in spending on entertainment was
statistically signicant, albeit at the 1 percent level.
ese ndings demonstrate that apprehension over paying
students for fear that they will spend their earnings quickly
is misguided. Students in our programs showed a strong
proclivity not only to spend less than nonearning peers, but
also to save more. Each of our experiments involved educating
students on nancial literacy and helping students establish
bank accounts. A well-designed incentive program can
incorporate nancial literacy education that promotes savings
behaviors and a sense of personal responsibility. Recall
that MDRC’s Opportunity NYC conditional cash transfer
TABLE 4
Average Effects of Student Incentive Programs On Intrinsic Motivation
Dallas Washington DC Houston NYC Chicago
7th
Intrinsic Motivation -0.020 0.067 -0.003 -0.048 0.017
Inventory (0.068) (0.052) (0.055) (0.049) (0.065)
Notes: Each column label describes the district where the experiment took place. This table reports intent-to-treat estimates of the effect of being offered a chance to participate in treatment on
the outcome listed in column one. All dependent variables are normalized to be mean zero, standard deviation 1, and all point estimates are in standard deviations from the normalized mean.
Regressions control for demographic factors and previous test scores and include all members of the experimental group with non-missing survey data. Results marked with *, **, and *** are
significant at the 10%, 5%, and 1 percent levels, respectively. See Fryer (forthcoming) for further details.
TABLE 5
Average Effects of Student Incentive Programs On Spending Habits
Entertainment Clothing Food Household Bills Saved more
than $50?
Washington DC -9.956** -25.844*** -12.840*** -6.961** 0.276***
(3.852) (6.810) (3.061) (2.814) (0.070)
Houston -14.571*** -6.759 -2.553 -0.033 0.454***
(3.478) (5.725) (2.051) (1.263) (0.079)
Notes: Each column label describes a category of expenditure where students reported spending their money. The first four columns report intent-to-treat estimates (in $) of the effect of being
offered a chance to participate in treatment on the amount of money an individual spends on each category. The final column, labeled “Savings” reports coefficient on treatment from a probit
regression on a binary variable of whether or not a student has $50 or more in savings. Regressions control for demographic factors and previous test scores and include all members of the
experimental group with non-missing survey data. Results marked with *, **, and *** are significant at the 10%, 5%, and 1 percent levels, respectively. Entries are school districts where the
experiments were held. Observations where students reported spending more than $300 on any single component of a given category were set to missing.
The Hamilton Project • Brookings 19
Health and Human Services designed “Opportunity NYC” in
partnership with MDRC to closely mirror the PROGRESA
(Programa de Educación, Salud y Alimentación) experiment
in Mexico by providing cash incentives to parents (and
sometimes students) for a range of behaviors and outcomes
including school attendance, student achievement, preventive
healthcare participation, and human capital development.
e evaluation of Opportunity NYC showed promise for
reducing some of the immediate hardships linked to poverty
by mitigating hunger, increasing healthcare participation,
and decreasing reliance on alternative banking institutions,
but the program demonstrated no impacts on academic
dimensions, including all academic outcomes for elementary
school, middle school, and lower-achieving high school
students. However, among well-prepared high school students,
Opportunity NYC appears to have modest positive eects on
attendance, course grades, credits earned, and standardized
test achievement (MDRC 2010).
It is possible that one of the reasons that incentive schemes
such as PROGRESA were eective in Mexico but not New York
City is that the social safety net in America is very dierent
from the safety net in Mexico. In other words, the incentives
in programs such as Opportunity NYC provide marginal
incentives above and beyond what individuals already have.
If there are dierences across places in the level of baseline
incentives, the eect of an additional incentive program can
vary dramatically.
8. DO STAY THE COURSE.
Few educational policies provoke as strong a negative visceral
reaction among the general public as tying nancial incentives
to learning. In a 2010 PDK/Gallup poll, only 23 percent of
Americans said they supported “the idea of school districts
paying small amounts of money to students to, for example,
read books, attend school or get good grades.” Seventy-
six percent opposed the idea, with 1 percent undecided. As
points of contrast, consider the results from another recent
public opinion poll. In 2008, an ABCNEWS poll found that
26 percent of Americans say grade-school teachers should be
allowed to spank kids at school, with even higher approval
rates in the South (35 percent) and the Midwest (31 percent).
In other words, the concept of paying students in school is less
palatable than the concept of spanking students in school.
Despite the public’s negative opinion of nancial incentives
for students, reform-minded school leaders are increasingly
interested because they recognize that conventional wisdom
is simply not producing results (see Figure 2). While the initial
phases of implementation can lead to negative publicity and
pushback from within the community, what ultimately matters
program successfully decreased reliance on alternative
banking institutions and increased savings by providing cash
incentives to parents and students. More research is needed,
but preliminary results suggest that implementing these
kinds of programs early on for our youth may help promote a
culture of savings and help students develop a higher level of
uency and comfort within the context of traditional nancial
institutions.
To be sure, the exact spending habits of recipients of rewards
in education incentive programs may not be important at all
if the incentives themselves have a positive impact on student
achievement. Of course, understanding that students (perhaps
unexpectedly) save a large portion of their rewards might make
the idea of an incentive program more palatable to districts
and schools. But student achievement is the most important
outcome, and if incentive programs improve achievement and
students spend their earnings on video games and junk food,
from our perspective, that is a desirable set of outcomes.
7. DO IMPLEMENT WHAT WORKS.
Implement what has been shown to work, not what tickles
your intuition, and do not generalize the results too broadly.
Aer we nished the rst round of our incentives work, we
briefed a top-ranking policy ocial in Washington, DC.
Aer hearing that paying students $2 per book read yielded
statistically signicant eects on reading comprehension
scores, his response was, “Excellent. Based on these results I
want to implement a policy that rewards kids with nonnancial
incentives for doing their homework.” But our results showed
that paying students for doing general homework was not
an eective way to increase achievement, and nonnancial
incentives may not have the same eect as nancial incentives.
e results discussed here are from demonstration projects on
nancial incentives across the United States. We are condent
that the impacts of these particular programs are accurately
estimated. We are less condent that the same program
implemented in a dierent city will give similar answers. And,
perhaps more importantly, we have absolutely no condence
that a program with multiple variations in any city will have
similar results.
Also, we need to be careful about extrapolating results from
other countries. Incentives given to students and teachers in
other countries are given in a dierent context from those
given in the United States. In Mexico, incentives were shown
to have a large positive impact on student attendance and
growth and development outcomes, such as child health
and early childhood cognitive development. In the United
States, though, we have not seen any such increases with
similar incentives. Indeed, the New York City Department of
20 The Power and Pitfalls of Education Incentives
is student achievement; the challenge for policy-makers is to
educate their constituents about the results. Results change
minds, and the body of evidence suggests that a properly
implemented incentive program can be a cost-eective means
of improving student learning outcomes.
In a similar poll by USA TODAY in 2008, more than half of
the seventy-four CEOs and other senior executives that were
surveyed supported nancial incentives in schools, and exactly
half reported instituting similar ideas for their own children.
While this sample is small and still divided, it suggests that
those individuals who have perhaps the most experience
with the power of nancial incentives in the marketplace—
businesspersons whose prots are driven by recruiting,
retaining, and motivating their workers to perform at their
peak—are far more likely than the general public to support
similar incentives in schools.
9. DON’T BE CHEAP.
Deciding the appropriate price to pay students for dierent
behaviors or levels of achievement can be dicult; given
scal constraints, policy-makers and educators may worry
about spending extra money that will not produce results.
Our research found, however, that when incentives work,
increasing the amount of the incentive also brings about a
larger impact. Students respond to the incentives, and when
we unexpectedly increase the price, students put in even more
eort.
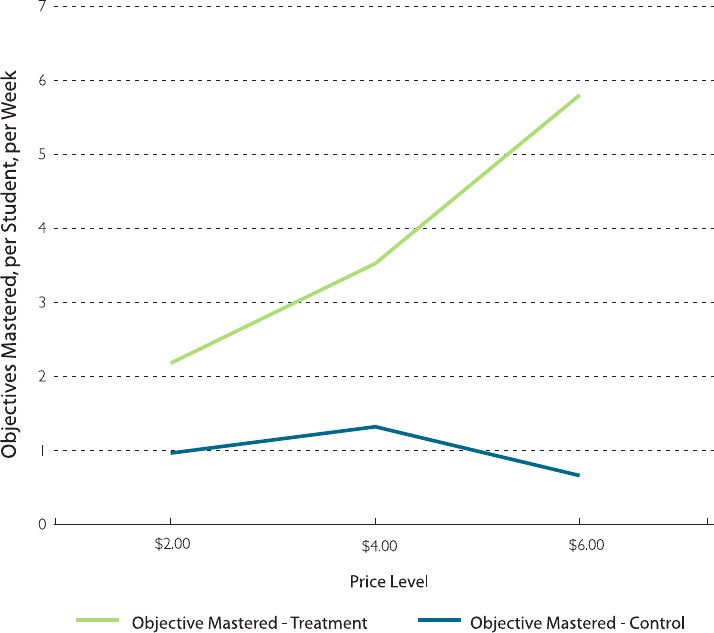
Figure 5 demonstrates this fact from our incentive experiment
in Houston. Students in treatment were paid $2 per math
objective mastered. (Students in control were not paid for
mastering objectives.) Under this incentive format, students
mastered roughly two objectives per week. In mid-February,
we unexpectedly increased the price to $4 per objective for
four weeks. During the following four weeks, the average
FIGURE 5
Math Stars Houston, Objectives Mastered by Price Level
Source: Data from the authors.
The Hamilton Project • Brookings 21
all. Eect sizes from incentive programs in America range from
statistically zero (or even negative) to 0.256 standard deviations,
or about three months of additional schooling. Relative to the
education “crisis” described in the introduction, these are modest
eects. For instance, black and Latino students are typically
1.0 standard deviation behind whites on standardized tests.
us, even under the most optimistic assumptions, and even if
we provided incentives only to minority students, they would
decrease the gap by one fourth. Again, the gain from incentive
programs is not large relative to the gap, but is large relative to its
cost. e ideal of students internalizing the incentive structure
and then demanding more (and better) education from their
teachers and parents is not consistent with the data.
Similarly, the hope that providing struggling teachers with
incentives will miraculously increase their eort, make them
better teachers, and increase student achievement is not
consistent with the experimental evidence to date. Teacher
incentive experiments in Tennessee provided incentives that
were roughly 22 percent of their annual salary. Still, the program
yielded no long-term eects.
number of objectives mastered per week increased to more
than three and a half in the treatment group and stayed
constant in the control group (where students were not being
paid for mastering objectives). Aer this bonus period was
over, students again were paid $2 per objective mastered. Two
months later, we again announced a price increase—this time
to $6 per objective mastered. Figure 5 shows that students
responded by mastering almost six objectives per week.
Using these three data points, a simple calculation shows that
for every 10 percent increase in payments, students increase
their eort by 8.7 percent. Compared to traditional measures
of labor supply elasticities of adult males—which average
about 0.32 (Chetty 2011)—this elasticity of 0.87 is relatively
high, meaning that students in our incentive program are
highly price sensitive and will likely respond to increased
incentives.
10. DON’T BELIEVE THE HYPE: INCENTIVES ARE NOT
A PANACEA.
Incentives can have a large return on investment, but they will
not eliminate the educational problems of the United States or
eliminate the racial achievement gap. at is, they are a wise
investment in a diverse portfolio of reforms, but not a cure-
Incentives are a wise investment in a diverse portfolio of reforms,
but not a cure-all.

22 The Power and Pitfalls of Education Incentives
Chapter 5: Moving Forward on Evaluating
Education Incentives
T
he set of experiments discussed here has generated three
broad lessons: (1) that incentives for certain inputs such
as reading and doing math homework will raise student
achievement, (2) that incentives for output seem less eective,
and (3) that group-level incentives for teachers do not appear to
be eective. Much more remains to be done and some areas for
research are discussed below:
PROVIDE INCENTIVES FOR STUDENTS OR TEACHERS
TO TRY NEW STRATEGIES.
Incentive programs provide the opportunity to experiment
with new approaches to learning and to nd out which
student behaviors and teaching strategies actually work.
Testing out incentives for innovative inputs is essential for
designing eective programs, and can also provides broader
insight into what works in the learning process. For example,
teachers could be given incentives for using technology in the
classroom, or students could be asked to watch educational
videos at home.
TRY VARYING THE INCENTIVES.
Incentives can vary in amount or type (nancial or
nonnancial). Every community is dierent and we encourage
education leaders to try new and dierent ideas to test what
works best in their schools. Changing the amount and type
of incentive can help determine the combinations with the
highest returns, and variation during the program itself helps
keep students engaged and motivated. During the Houston
experiment, for example, the reward for passing math quizzes
was increased during certain weeks. Interestingly, student
mastery per day rose dramatically when rewards increased, but
student participation (i.e., the percentage of eligible students
who mastered at least one objective and thereby received
rewards) did not increase. e higher reward amount did not
encourage more students to participate, but it made students
already participating more eager to complete the quizzes.
TRY NONFINANCIAL INCENTIVES, ESPECIALLY FOR
TEACHERS.
Mobile phone minutes and other nonnancial incentives
can save money for incentive programs by cutting down on
distribution costs. Nonnancial incentives may be more cost-
eective if students or teachers put a higher value on them
than their cost. For example, popcorn and pizza parties are
relatively low cost, but students enjoy them because they
provide opportunities to celebrate. Similarly, gi cards that
can be purchased in bulk at a discounted price might also
have excess value because they cut down on transaction costs
and render rewards nontransferable to other family members.
Teachers may not respond well to nancial incentives, but they
may be enticed by benets such as vacation time or changes
to the work environment. In Canada, teachers are allowed to
defer a portion of their salary each year to self-fund a leave of
absence. e popularity of this program shows that teachers
may prefer nonmonetary rewards to additional pay (Jacobson
and Kennedy 1997).
DO MORE WITH PARENTS.
Parent incentives were tested only as a part of the package
of incentives for teachers, parents, and students in Houston;
results showed that parents with incentives were signicantly
more invested than were other parents. Future programs could
incentivize only parents or they could provide incentives for
more specic behaviors outside of going to conferences, such as
enforcing a homework time for their children or encouraging
them to read for a given amount of time. Parent incentive
programs have potential to improve student achievement, but
we need to experiment with them further.

The Hamilton Project • Brookings 23
Chapter 6: Structuring and Implementing
Incentive Programs
T
his section discusses how to structure and implement
an incentive program. e guidelines provided are
based on the actual implementation of incentive
programs designed and evaluated by EdLabs at Harvard in
partnership with school districts. An online appendix provides
a full description of how these programs were designed and
implemented including approaches taken in dierent project
sites (please visit www.hamiltonproject.org for this online
appendix). is implementation guide draws lessons from
those experiences, but is written with the idea that districts and
schools can design and execute incentive programs on their
own. As long as schools are implementing incentive programs
that have been proven successful, then there may not be a role
for an implementation and evaluation partnership.
CONSTRUCTING AN INCENTIVES STRUCTURE
e structure of an incentive program can and will vary from
district to district and from school to school; each district
or school can pick and choose which tasks and behaviors to
provide incentives for, the amount of incentives to be paid,
and payment structure. If a particular district struggles
with reading scores or a particular school suers from low
attendance rates, the opportunity for a tailored yet properly
implemented incentive program could be especially fruitful.
Our prescription for constructing a workable incentives
structure follows from our two central claims about incentive
programs: First, unlike other major education initiatives of
the past few decades, a large proportion (approximately 70–
80 percent) of expenditures should be directed to students,
parents, or teachers in the form of incentives payments.
Past education initiatives—from reducing school and
classroom sizes and providing mandatory aer-school
programs, to providing renovated and more technologically
savvy classrooms and professional development for teachers
and other key sta—spend a far higher percentage of total
expenditures on indirect costs such as building renovation,
training, and computers than our incentive programs.
In incentive programs, most funds should go directly to
students, teachers, or parents. e proportion of expenditures
devoted to administration should be small but will vary
depending in part on the scale of the incentive program.
Consider a districtwide incentive program in which students
earn money for doing homework and are able to gain a
maximum of $100 during the school year. Two thousand
students from twenty schools participate, and the average
student receives $50 total. Students are paid by check every
three weeks, ten times total. Incentives payments for the year
would total approximately $100,000. In this hypothetical
example, the most signicant marginal costs for an internally
driven incentive program are a full-time program manager
and covering payment-processing fees. e program manager
would be responsible for all payment calculation, auditing,
and reward distribution. Where payments could be tied to the
employee payroll cycle, the cost of payment processing may be
minimized; where a bank partnership is necessary to process
Unlike other major education initiatives of the past few decades, a large
proportion (approximately 70-80 percent) of expenditures for incentive
programs should be directed to students, parents, or teachers...
24 The Power and Pitfalls of Education Incentives
and print checks, the cost will be similar to contracting with
an external payroll vendor (usually a per check or per deposit
rate between $0.30 and $0.50).
Now consider a single school incentive program in which
students can earn up to $180 for wearing their uniform to
school every day. Five hundred students participate and the
average student receives $120 during the school year. Students
are paid in cash at the end of every month by their assistant
principal, using Title I funds. Although the incentives
payments total is $60,000, in this instance there is no need
for a dedicated program manager and no cost associated with
processing the payments.
e second claim underlying our guidelines for implementing
incentive programs is that the incentive programs described
herein are eminently scalable within school districts or even
individual schools. is claim is based on our reliance on
district-based teams to help manage the day-to-day operations
in our own experiments and ensure delity of implementation.
At a district level, program implementation would be driven
entirely within a district department, with incentive payments
oered either along the employee payroll cycle or through a
third-party payroll vendor (see Payment Calculation and
Distribution, below). Following our ve guidelines can lead to
successful in-district implementation.
IMPLEMENTING INCENTIVE PROGRAMS
e implementation of an incentive program must be
a coordinated eort to ensure that students, parents,
teachers, and key school sta understand the particulars of
each program; that schools are constantly monitoring the
performance of students; and that payments are distributed
on time and accurately. Five guidelines are key to realizing
these objectives:
1. Students and their families are provided with extensive
information about the programs, with additional
mechanisms to check understanding.
2. Explicit structures of communication and responsibility
are created between districts and third-party vendors,
including procedures to govern the ow of data,
information, and reporting.
3. A payment algorithm is created to generate reward amounts
from student performance data, and procedures are
established to both run the algorithm on a predetermined
schedule and to distribute rewards.
4. Regular reporting is done on subject (student or parent)
performance, including metrics such as participation,
average earnings, and rened budget projections.
5. A culture of success is built by recognizing student
performance with assemblies, certicates, and bonuses.
A general summary of each guideline is included below.
Additional details, based on our research, can be found
in the online appendix. ese examples are based on our
work through EdLabs and should be replicable, whether a
school district works independently or with another outside
implementation and evaluation partner.
1. Informing Subjects. One of the truly distinguishing
features of our incentives experiments is the concentrated
eort made to fully inform students and their families not
only of the particulars of each program (i.e., incentive scheme,
reward schedule, etc.), but also the potential risks involved
in participating.
14
Students and families can be briefed in a
number of dierent ways, but we recommend the following
route to ensure all subjects are informed.
During the time leading up to and including the rst weeks of
school, community forums should be held to inform parents
of the details of the incentive program. Additionally, having
district ocials on hand at Back to School Night can be
valuable to answer any questions from parents.
Once the school year begins, eligible students should be given
an information packet to take home to their families. ese
packets can include any number of documents, but typically
include a letter from the superintendent with basic program
details, a parental consent or withdrawal form, a list of
frequently asked questions about the program, an overview
of the incentive scheme, and a program calendar with details
about reward distribution. Parents should return consent or
withdrawal forms to the school so the school can determine a
nal list of participants. Once program rosters are solidied,
the school should provide participating students with a second
welcome packet to reinforce program basics and should
provide students with additional copies of program calendars.
Aer the rst six to eight weeks of each program, we
recommend that a brief quiz be administered to students
during the school day to gauge understanding of the basic
elements of the program: incentive structure, reward calendar,
to whom to direct questions, and so on. Answers should be
compiled and analyzed as quickly as possible to determine
possible areas of confusion. If areas of confusion are identied,
a presentation should be developed and delivered to groups of
students before then re-administering the quiz.
e importance of ensuring subject understanding of an
incentive program through digestible materials and persistent
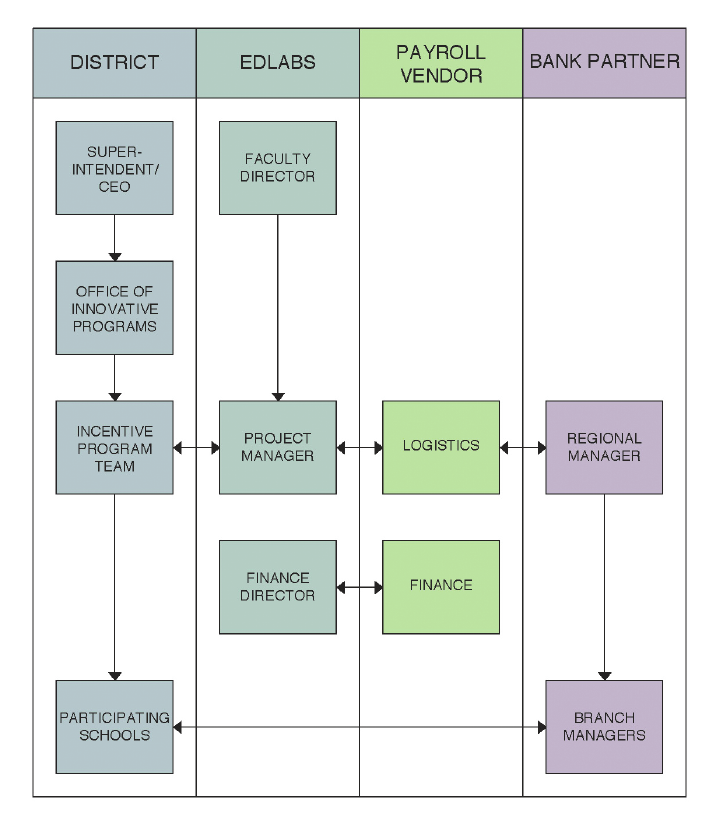
The Hamilton Project • Brookings 25
assessment of subject knowledge cannot be overstated.
Simply put, estimates of treatment eects are meaningless if
subjects do not fully comprehend the study in which they are
participants; it is as if the subjects did not participate at all,
and that is precisely why informing subjects is a foundational
piece of proper implementation.
2. Structures of Communication and Responsibility. e
second major guideline of successfully implementing an
education incentive program requires building district
capacity by hiring and empowering a district-based program
management team. is team would serve as the primary
liaison with both schools and other partners, where relevant.
Responsibilities would include maintaining delity to the
original design by ensuring that students, parents, teachers,
and key school sta understood the particulars of each
program; ensuring that programmatic data were reported
to vital district stakeholders and used to drive instruction;
correctly calculating rewards and distributing payments
on time and accurately; and (where relevant) ensuring that
external partners performed their duties and provided timely
assistance.
Given the temporary nature of their employment, district
program teams should report frequently to permanent
members of a district’s structure. In our experience, these
teams were oen subsumed under and reported directly to
district leadership (such as the superintendent/chancellor/
CEO, chief academic ocer, or even ad hoc “innovation”
departments). eir exact location is never important as
FIGURE 6
Personnel Structure
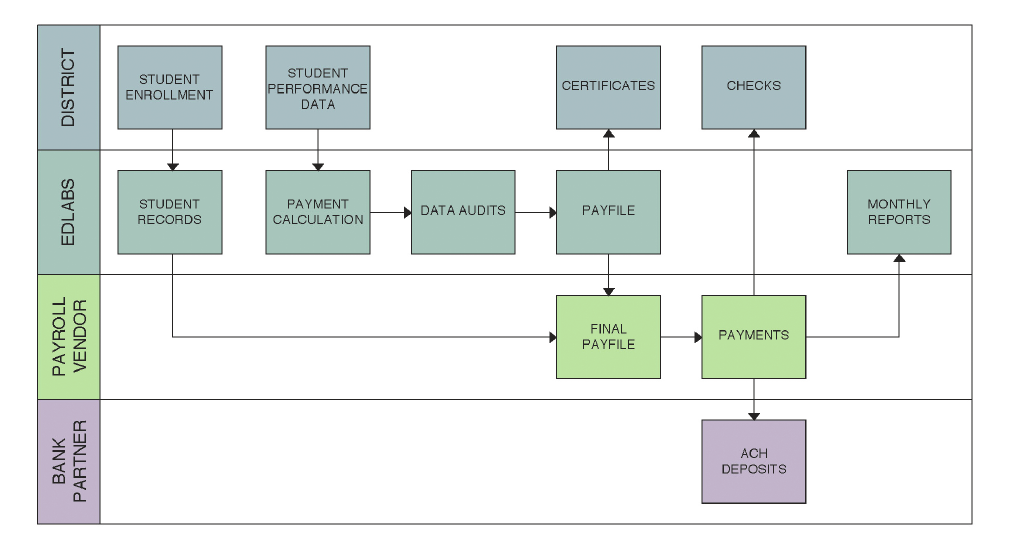
26 The Power and Pitfalls of Education Incentives
long as program teams are given the exibility to work with
dozens of schools and maintain close contact with third-
party vendors. Figure 6 provides an example of the personnel
structure used by EdLabs in partnering with school districts
that lays out the duties of each party and could serve as a
schematic for internally driven programs.
3. Payment Calculation and Distribution. Payment
protocol will vary from district to district or from school to
school. District program managers should be responsible for
rendering student performance data into reward amounts and
performing subsequent audits.
From there, structure can vary. Districts may choose to use
a third-party payroll vendor who can process payments and
either initiate a direct deposit, or print and ship a check.
Checks then could be audited and distributed to school-based
coordinators and, eventually, to students.
Alternatively, schools could process payments through their
current payroll system—aer calculating payments, the
district could process the checks through its payroll system.
Checks could be distributed on paydays.
Figure 7 diagrams the ow of the payment calculation and
distribution procedures as executed by EdLabs in partnership
with a diverse set of districts. Again, the separation of duties
could inform how to arrange a district-driven program.
4. Data Reporting and Monitoring. Careful and regular
reporting is another critical component of running an
incentive program, as the amount of programmatic
performance data generated provides a unique opportunity to
monitor student progress and to use data to drive instruction
outside the program.
Depending on the incentives structure developed, data will
be collected and analyzed through dierent avenues. In any
event, principals, educators, and program coordinators should
be constantly monitoring and reporting on students’ progress.
Examples of dierent data formats and gathering strategies
can be found in the online appendix.
Incorporating program data into larger school-level contexts
can both supplement strategic intervention plans and mitigate
any perceived burdens of implementation. Simply put, the
students who are struggling according to the incentive program
data are more than likely struggling “outside” the program as
well. e regular use of program data and implementation
monitoring can help teachers and school leaders identify not
FIGURE 7
Incentive Payment Calculation and Distribution Process
The Hamilton Project • Brookings 27
The nal critical component of running a successful incentive program
is building and maintaining an underlying culture of success and
recognition for student performance.
only individual students, but also schoolwide trends. If, for
example, a school that rewards students for attendance creates
a summary dashboard that indicates their school has fallen
behind the program average of attendance earnings, they
can design a supplemental reward, or tinker with the reward
amount, or even introduce a schoolwide initiative to improve
attendance. In sum, designing customized data reporting
tools and using preexisting tools are critical techniques for
monitoring delity of implementation (or adjusting the
research design), addressing challenges or shortcomings on
an ongoing basis, projecting program costs, and targeting
students, classrooms, and schools for specic interventions.
5. Building a Culture of Success. e nal critical component
of running a successful incentive program is building and
maintaining an underlying culture of success and recognition
for student performance. To do so, we recommend that schools,
in concert with teachers, principals, and district leadership,
use certicates and reward assemblies as the primary forms of
student support and encouragement.
Certicates including program insignia, pay period dates,
and details of student earnings are the primary vehicles for
reporting student performance to students. Certicates can be
created aer each pay period and distributed to school-based
coordinators. Students can receive certicates along with their
checks; for students that received payment via direct deposit,
certicates can function as a paystub. Students who do not
receive rewards for a given pay period can be given modied
certicates or encouraging letters as a way of motivating them
towards future rewards.
Assemblies are another important way of distinguishing
incentive programs within campuses and recognizing student
achievement. Two types of assemblies can be held: at the start
of the school years, schools can hold assemblies or pep rallies
to introduce and generate excitement about the program, as
well as answer questions and provide basic program details.
roughout the school year on paydays, additional assemblies
can be held, at which participating students could publicly
receive their check or certicate, or both.
In sum, our experience has showcased the power and
importance of supplementing incentives with other forms
of recognition for two principal reasons: rst, certicates
and assemblies reinforce student work and serve as a regular
reminder to students of their role and status within the
program (and their school generally); and second, the very
public distribution of reward amounts and certicates creates
an atmosphere of transparency among peers and might
contribute productively to increased competition in terms of
rewards and, as an extension, achievement generally.

28 The Power and Pitfalls of Education Incentives
Conclusion
I
n an eort to increase achievement and narrow dierences
between racial groups, school districts have attempted
reforms that include smaller schools and classrooms,
lowering the barriers to entry into the teaching profession
through alternative certification programs, and so on. One
potentially cost-eective strategy, not yet fully tested in
American urban public schools, is providing short-term
financial incentives for students to achieve or exhibit certain
behaviors correlated with student achievement.
is paper reports estimates from incentive experiments in
public schools in Chicago, Dallas, Houston, New York City,
and Washington DC—ve prototypically low-performing
urban school districts. Overall, the estimates suggest that
incentives are not a panacea. Our experiment on teacher
incentives revealed no statistically signicant eects across
myriad outcomes.
Yet, nancial incentives in education are potentially powerful
once we develop a deeper understanding of the right model for
how children and teachers respond to financial incentives. In
Houston, for instance, students who were provided incentives
mastered 125 percent more math objectives than students
who were not given incentives. Paying students to read books
yields large and statistically signicant increases in reading
comprehension. Incentives for other inputs like attendance,
wearing a school uniform, or doing homework did not
signicantly improve achievement. us, if nothing else, we
have shown that students will respond to the incentives—
but we have not yet discovered the best activities to provide
incentives for. It is important to note that our work has
barely scratched the surface of what is possible with incentive
programs.
Using our experiences as a guide, we hope school districts,
policy-makers, and scholars will try new and creative ways
to increase student achievement with incentives and, perhaps
even more importantly, rigorously assess the impact of their
eorts.

The Hamilton Project • Brookings 29
Authors
Bradley M. Allan
Project Manager, EdLabs
Bradley Allan is a project manager at the Education Innovation
Laboratory at Harvard University (EdLabs). In this capacity
he manages the ongoing research operations for district-
based innovations. While much of his work has centered on
implementing student incentive programs, he is currently
supporting EdLabs’ school turnaround work and planning
for future experiments in human capital and technology. He
holds a B.A. from the University of Virginia and an A.M. from
the University of Chicago.
Roland G. Fryer, Jr.
Robert M. Beren Professor of Economics, Harvard University;
Chief Executive Ofcer, EdLabs
Roland Fryer, Jr. is the Robert M. Beren Professor of
Economics at Harvard University, a Research Associate at the
National Bureau of Economic Research, and a former Junior
Fellow in the Harvard Society of Fellows — one of academia’s
most prestigious research posts. In January 2008, at the age
of 30, he became the youngest African-American to receive
tenure from Harvard. He has been awarded a Sloan Research
Fellowship, a Faculty Early Career Development Award from
the National Science Foundation, and the inaugural Alphonse
Fletcher Award (Guggenheims for race issues).
In addition to his teaching and research responsibilities, Fryer
served as the Chief Equality Ocer at the New York City
Department of Education during the 2007–2008 school year.
In this role, he developed and implemented several innovative
ideas on student motivation and teacher pay-for-performance
concepts. He won a Titanium Lion at the Cannes Lions
International Advertising Festival (Breakthrough Idea of the
Year in 2008) for the Million Motivation Campaign.
Fryer has published papers on topics such as the racial
achievement gap, the causes and consequences of distinctively
black names, armative action, the impact of the crack
cocaine epidemic, historically black colleges and universities,
and acting white. He is an unapologetic analyst of American
inequality who uses theoretical, empirical, and experimental
tools to squeeze truths from data — wherever that may lead.
Fryer is a 2009 recipient of a Presidential Early Career Award
for Scientists and Engineers, the highest award bestowed by
the government on scientists beginning their independent
careers. He is also part of the “2009 Time 100,” Time Magazine’s
annual list of the world’s most inuential people. Fryer’s work
has been proled in almost every major U.S. newspaper, TIME
Magazine, and CNN’s breakthrough documentary Black in
America.

30 The Power and Pitfalls of Education Incentives
Endnotes
1. Author’s calculations based on data from the 2009 Program for Interna-
tional Student Assessment, which contains data on sixty-ve countries,
including all OECD countries.
2. There were approximately 18,000 students in the treatment schools
who actually received nancial rewards.
3. This sentence describes Year 1. In the rst year, schools were allowed to
pick the other three metrics. Michelle Rhee, DC school chancellor at
the time, suggested that individual schools may have better information
on what behaviors are best to incentivize for that particular school. In
Year 2, a third metric—performance on a biweekly assessment—was
also mandated.
4. The structure changed slightly in the second year. In the second year,
students began each 2-week pay period with the maximum of $20 per
metric and were docked at least $2 for each behavioral or academic
infraction.
5. The ve courses were English, mathematics, science, social science, and
gym. Gym may seem like an odd core course in which to provide incen-
tives for achievement, but roughly 22 percent of ninth-grade students
failed their gym courses in the year prior to the experiment.
6. The experiments were designed to detect effects of 0.15 standard devia-
tions or more with 80 percent power. Thus, they are underpowered to
estimate effect sizes below this cutoff.
7. In the Houston results, we were able to determine which math objec-
tives completed by students were more tightly aligned with end-of-year
outcomes. This gure includes all objectives. When including only ob-
jectives that were tightly aligned, the gure increases to 1.448 more
months of schooling.
8. The Bagrut is the ofcial Israeli matriculation certicate.
9. In 2007–2009, the period in which results from TAP are available, the
program was not able to tie student achievement to individual teachers.
TAP will transition to individual teacher-level metrics as they become
available.
10. In the classic principal-agent framework, it is assumed that the agents’
actions are not contractible, rendering moot the decision between in-
puts and outputs (Grossman and Hart 1983; Holmstrom 1979; Mirrlees
1974).
11. See, for instance, Cameron and Pierce (1994), Deci (1972, 1975),
Gneezy and Rustichini (2000), or Kohn (1993, 1996) for differing views
on the subject.
12. Ryan and Deci (1996) dispute many of these claims, arguing that the
aggregation used in Eisenberger and Cameron (1996) was incorrect.
13. As the table subheader indicates, the effects summarized exclude stu-
dent-reported spending or saving amounts above $300, due to students
submitting so-called “nonsense” amounts in the thousands or millions
of dollars.
14. Consent forms and other informational documents contained language
about the potential risks of participation. Given the exchange of mone-
tary incentives, the two primary potential risks were that those students
who earn rewards could be targeted for theft or crime by their peers
or others; and those low-income students and their parents receiving
regular payments from the program could become dependent on the
payments and could suffer nancial harm after the payments stopped.

The Hamilton Project • Brookings 31
References
Angrist, Joshua, and Victor Lavy. 2009. “e Eect of High-Stakes
High School Achievement Awards: Evidence from a Group-
Randomized Trial.” American Economic Review 99: 1384–
1414.
Banks, James A. 2001. “Approaches to Multicultural Curriculum
Reform.” In Multicultural Education: Issues and Perspectives,
4th ed., edited by James A. Banks and Cherry A. M. Banks.
New York: John Wiley.
Banks, James A. 2006. Cultural Diversity and Education:
Foundations, Curriculum, and Teaching. Boston: Pearson
Education.
Borman, Georey D., Robert E. Slavin, Alan C. K. Cheung, Anne M.
Chamberlain, Nancy A. Madden, and Bette Chambers. 2007.
“Final Reading Outcomes of the National Randomized Field
Trial of Success for All.” American Educational Research
Journal 44 (3): 701–731.
Boyd, Donald, Pamela Grossman, Hamilton Lankford, Susanna
Loeb, and James Wycko. 2008. “Teacher Preparation and
Student Achievement.” Working Paper No. 14314, National
Bureau of Economic Research, Cambridge, MA.
Cameron, Judy, and W. David Pierce. 1994. “Reinforcement, Reward,
and Intrinsic Motivation: A Meta-Analysis.” Review of
Educational Research 64 (3): 363–423.
Chetty, Raj, John N. Friedman, Nathaniel Hilger, Emanuel Saez,
Diane Schanzenbach, and Danny Yagan. 2011. “How Does
Your Kindergarten Classroom Aect Your Earnings? Evidence
from Project STAR.” Quarterly Journal of Economics 126 (4).
Chetty, Raj. 2011. “Bounds on Elasticities with Optimization
Frictions: A Synthesis of Micro and Macro Evidence on Labor
Supply.” Econometrica 75 (5): 1243–1284.
Datnow, Amanda, Vicki Park, and Brianna Kennedy. 2008. “Acting
on Data: How Urban High Schools Use Data to Improve
Instruction.” Center on Educational Governance, USC Rossier
School of Education, Los Angeles.
Deci, Edward. 1972. “e Eects of Contingent and Noncontingent
Rewards and Controls on Intrinsic Motivation.”
Organizational Behavior and Human Performance 8: 217–229.
Deci, Edward. 1975. Intrinsic Motivation. New York: Plenum.
Deci, Edward, Haleh Eghrari, Brian Patrick, and Dean Leone.
1994. “Facilitating Internalization: e Self-Determination
eory Perspective.” Journal of Personality 62: 119–142.
Decker, Paul T., Daniel P. Mayer, and Steven Glazerman. 2004. “e
Eects of Teach for America on Students: Findings from a
National Evaluation.” Mathematica Policy Research Report
No. 8792–750, Princeton, NJ.
Domina, urston. 2005. “Leveling the Home Advantage: Assessing
the Electiveness of Parental Involvement in Elementary
School.” Sociology of Education 78 (3): 233–249.
Duo, Esther, and Rema Hanna. 2005. “Monitoring Works: Getting
Teachers to Come to School.” Working Paper No. 11880,
National Bureau of Economic Research, Cambridge, MA.
Easton, John Q., Susan Leigh Flinspach, Carla O’Connor, Mark
Paul, Jesse Qualls, and Susan P. Ryan. 1993. “Local School
Council Governance: e ird Year of Chicago School
Reform.” Chicago Panel on Public School Policy and Finance,
Chicago.
Eisenberger, Robert, and Judy Cameron. 1996. “Detrimental Eects of
Reward: Reality or Myth?” American Psychologist 51 (11):
1153–1166.
Fryer, Roland. 2010. “Racial Inequality in the 21st Century: e
Declining Signicance of Discrimination.” In Handbook of
Labor Economics, Vol. 4, edited by Orley Ashenfelter and
David Card. Amsterdam: North Holland.
Fryer, Roland. Forthcoming. “Financial Incentives and Student
Achievement: Evidence from Randomized Trials.”
Quarterly Journal of Economics.
Glazerman, Steven, Allison McKie, and Nancy Carey. 2009. “An
Evaluation of the Teacher Advancement Program (TAP)
in Chicago: Year One Impact Report.” Mathematica Policy
Research, Inc., Princeton, NJ.
Glazerman, Steven, and Allison Seifullah. 2010. “An Evaluation of
the Teacher Advancement Program.” Accessed from http://
www.mathematica-mpr.com/education/tapchicago.asp#pubs.
Glewwe, Paul, Nauman Ilias, and Michael Kremer. 2010. “Teacher
Incentives.” American Economic Journal 2 (3): 205–227.
Gneezy, Uri, and Aldo Rustichini. 2000. “Pay Enough or Don’t Pay at
All.” Quarterly Journal of Economics 115: 791–810.
Goolsbee, Austan, and Jonathan Guryan. 2006. “e Impact of
Internet Subsidies in Public Schools.” e Review of Economics
and Statistics 88 (2): 336–347.
Greene, Jay P., and Marcus A. Winters. 2006. “Getting Ahead by
Staying Behind: An Evaluation of Florida’s Program to End
Social Promotion.” Education Next (Spring).
Grossman, Sanford J., and Oliver D. Hart. 1983. “An Analysis of the
Principal-Agent Problem.” Econometrica 51 (1): 7–45.
Guryan, Jonathan. 2001. “Does Money Matter? Regression-
Discontinuity Estimates from Education Finance Reform
in Massachusetts.” Working paper 8269, National Bureau of
Economic Research, Cambridge, MA.
Henig, Jerey R., and Wilbur C. Rich. 2004. “Mayors in the Middle:
Politics, Race, and Mayoral Control of Urban Schools.”
Princeton University Press, Princeton, NJ.
Holmstrom, Bengt. 1979. “Moral Hazard and Observability.” Bell
Journal of Economics 10 (1): 74–91.
Jacob, Brian A., and Lars Lefgren. 2004. “Remedial Education and
Student Achievement: A Regression-Discontinuity Analysis.”
e Review of Economics and Statistics 86 (1): 226–244.
Jacobson, Stephen, and Sylvia Kennedy. 1992. “Deferred Salary Leaves
32 The Power and Pitfalls of Education Incentives
in Education: A Canadian Alternative to Reductions in the
Teaching Work Force.” Educational Evaluation and Policy
Analysis 14 (1): 83–87.
Kane, omas J., Jonah E. Rocko, and Douglas O. Staiger. 2008.
“What Does Certication Tell Us about Teacher Eectiveness?
Evidence from New York City.” Economics of Education
Review 27 (6): 615–631.
Knight, Jim, ed. 2009. Coaching: Approaches and Perspectives.
ousand Oaks, CA: Corwin Press.
Kohn, Ale. 1993. Punished by Rewards. Boston: Houghton Miin
Company.
Kohn, Ale. 1996. “By All Available Means: Cameron and Pierce’s
Defense of Extrinsic Motivators.” Review of Educational
Research 66: 1–4.
Kremer, Michael, Edward Miguel, and Rebecca ornton. 2009.
“Incentives to Learn.” Review of Economics and Statistics 91:
437–456.
Krueger, Alan B. 2003. “Economic Considerations and Class Size.”
e Economic Journal 113: F34–F63.
Krueger, Alan B., and Rouse, Cecilia Elena. 2004. “Putting
Computerized Instruction to the Test: A Randomized
Evaluation of a ‘Scientically Based’ Reading Program.”
Economics of Education Review 23: 323–338.
Lauer, Patricia A., Motoko Akiba, Stephanie B. Wilkerson, Helen
S. Apthorp, David Snow, and Mya L. Martin-Glenn. 2006.
“Out-of-School-Time Programs: A Meta-Analysis of Eects
for At-Risk Students.” Review of Educational Research 76 (2):
275–313.
Marlow, Michael L. 2000. “Spending, School Structure, and Public
Education Quality: Evidence from California.” Economics of
Education Review 19: 89–106.
MDRC. 2010, March. “Toward Reduced Poverty Across Generations:
Early Findings from New York City’s Conditional Cash
Transfer Program.” Author, New York.
Mirrlees, J. A. 1974. “Notes on Welfare Economics, Information
and Uncertainty.” In Essays on Equilibrium Behavior under
Uncertainty, edited by M. Balch, D. McFadden, and S. Wu.
Amsterdam: North Holland.
Muralidharan, Karthik and Venkatesh Sundararaman. 2011. “Teacher
Performance Pay: Experimental Evidence from India.” Journal
of Political Economy 119 (1).
New York City Department of Education. 2011a. “Educator Guide:
e New York City Progress Report 2009–2010, Elementary/
Middle School.” Updated March 10. Accessed from http://
schools.nyc.gov/NR/rdonlyres/4015AD0E-85EE-4FDE-B244-
129284A7C36C/0/EducatorGuide_EMS_2011_03_10.pdf.
New York City Department of Education. 2011b. “Educator Guide:
e New York City Progress Report 2009–2010, High School.”
Updated August 30. Accessed from http://schools.nyc.gov/
NR/rdonlyres/70F9E0D5-5049-4568-94FF-DA4F224D3827/0/
EducatorGuide_HS_2010_11_03.pdf.
Nye, Barbara, B. DeWayne Fulton, Jayne Boyd-Zaharias, and Van
A. Cain. 1995. “e Lasting Benets Study, Eighth Grade
Technical Report.” Center for Excellence for Research in Basic
Skills, Tennessee State University, Nashville, TN.
Nye, Barbara, Larry V. Hedges, and Spyros Konstantopoulos. 1999.
“e Long-Term Eects of Small Classes: A Five-Year Follow-
Up of the Tennessee Class Size Experiment.” Educational
Evaluation and Policy Analysis 21 (2, Summer): 127–142.
OECD. 2007. “Education at a Glance 2007: OECD Indicators.”
Accessed from http://www.oecd.org/dataoecd/36/4/40701218.
pdf.
OECD. 2009. “e PISA 2009 proles by country/economy.”
Accessed from http://stats.oecd.org/PISA2009Proles/#.
Protheroe, Nancy J., and Kelly J. Barsdate. 1991. “Culturally Sensitive
Instruction and Student Learning.” Educational Research
Center, Arlington, VA.
Puma, Michael, Stephen Bell, Ronna Cook, Camilla Heid. 2010. “Head
Start Impact Study: Final Report.” U.S. Department of Health
and Human Services, Washington, DC.
Rocko, Jonah E. 2008. “Does Mentoring Reduce Turnover and
Improve Skills of New Employees? Evidence from Teachers in
New York City.” Working Paper No. 13868, National Bureau of
Economic Research, Cambridge, MA.
Ryan, Richard. 1982. “Control and Information in the Intrapersonal
Sphere: An Extension of Cognitive Evaluation eory.”
Journal of Personality and Social Psychology 63: 397–427.
Ryan, Richard, and Edward L. Deci. 1996. “When Paradigms Clash:
Comments on Cameron and Pierce’s Claim at Rewards Do
Not Undermine Intrinsic Motivation.” Review of Educational
Research 66 (1): 33–38.
Ryan, Richard, Richard Koestner, and Edward Deci. 1991. “Ego-
Involved Persistence: When Free-Choice Behavior Is Not
Intrinsically Motivated.” Motivation and Emotion 15: 185–205.
Shapka, Jennifer D., and Daniel P. Keating. 2003. “Eects of a Girls-
Only Curriculum during Adolescence: Performance,
Persistence, and Engagement in Mathematics and Science.”
American Educational Research Journal 40 (4): 929–960.
Snyder, omas D., and Sally A. Dillow. 2010. “Digest of Education
Statistics 2009 (NCES 2010-013).” National Center for
Education Statistics, Institute of Education Sciences, U.S.
Department of Education, Washington, DC.
Springer, Matthew G., Dale Ballou, Laura S. Hamilton, Vi-Nhuan
Le, J. R. Lockwood, Daniel F. McCarey, et al. 2010. “Teacher
Pay for Performance: Experimental Evidence from the Project
on Incentives in Teaching.” Conference paper, National Center
on Performance Incentives, Nashville, TN.
Swanson, Christopher. 2009. “Cities in Crisis 2009: Closing the
Graduation Gap.” Editorial Projects in Education, Bethesda,
MD. Accessed from http://www.americaspromise.org/Our-
Work/Dropout-Prevention/Cities-in-Crisis.aspx.
ernstrom, Abigail. 1992, September. “e Drive for Racially
Inclusive Schools.” Annals of the American Academy of
Political and Social Science 523. Armative Action Revisited:
131–143.
Vigdor, Jacob L. 2008. “Teacher Salary Bonuses in North Carolina.”
Conference paper, National Center on Performance
Incentives, Nashville, TN.
Wong, Kenneth L., and Francis X. Shen. 2002. “Do School District
Takeovers Work? Assessingthe Electiveness of City and State
Takeovers as a School Reform Strategy.” State Education
Standard 3 (2): 19–23.
Wong, Kenneth L., and Francis X. Shen. 2005. “When Mayors Lead
Urban Schools: Assessing the Eects of Takeover.” In Besieged:
School Boards and the Future of Education Politics, edited
by William G. Howell, 81–101. Washington, DC: Brookings
Institution Press.

GEORGE A. AKERLOF
Koshland Professor of Economics
University of California at Berkeley
ROGER C. ALTMAN
Founder & Chairman
Evercore Partners
HOWARD P. BERKOWITZ
Managing Director
BlackRock
ALAN S. BLINDER
Gordon S. Rentschler Memorial Professor
of Economics & Public Affairs
Princeton University
TIMOTHY C. COLLINS
Senior Managing Director
& Chief Executive Officer
Ripplewood Holding, LLC
ROBERT CUMBY
Professor of Economics
Georgetown University
JOHN DEUTCH
Institute Professor
Massachusetts Institute of Technology
KAREN DYNAN
Vice President & Co-Director
of Economic Studies
Senior Fellow, The Brookings Institution
CHRISTOPHER EDLEY, JR.
Dean and Professor, Boalt School of Law
University of California, Berkeley
MEEGHAN PRUNTY EDELSTEIN
Senior Advisor
The Hamilton Project
BLAIR W. EFFRON
Founding Partner
Centerview Partners LLC
JUDY FEDER
Professor of Public Policy
Georgetown University
Senior Fellow, Center for American Progress
ROLAND FRYER
Robert M. Beren Professor of Economics
Harvard University and CEO, EdLabs
ADVISORY COUNCIL
MARK GALLOGLY
Managing Principal
Centerbridge Partners
TED GAYER
Senior Fellow & Co-Director
of Economic Studies
The Brookings Institution
RICHARD GEPHARDT
President & Chief Executive Officer
Gephardt Government Affairs
MICHAEL D. GRANOFF
Chief Executive Officer
Pomona Capital
ROBERT GREENSTEIN
Executive Director
Center on Budget and Policy Priorities
CHUCK HAGEL
Distinguished Professor
Georgetown University
Former U.S. Senator
GLENN H. HUTCHINS
Co-Founder and Co-Chief Executive
Silver Lake
JIM JOHNSON
Vice Chairman
Perseus LLC
LAWRENCE KATZ
Elisabeth Allison Professor of Economics
Harvard University
MARK MCKINNON
Vice Chairman
Public Strategies, Inc.
ERIC MINDICH
Chief Executive Officer
Eton Park Capital Management
SUZANNE NORA JOHNSON
Former Vice Chairman
Goldman Sachs Group, Inc.
PETER ORSZAG
Vice Chairman of Global Banking
Citigroup, Inc.
RICHARD PERRY
Chief Executive Officer
Perry Capital
PENNY PRITZKER
Chairman of the Board
TransUnion
ROBERT REISCHAUER
President
The Urban Institute
ALICE RIVLIN
Senior Fellow & Director
Greater Washington Research at Brookings
Professor of Public Policy
Georgetown University
ROBERT E. RUBIN
Co-Chair, Council on Foreign Relations
Former U.S. Treasury Secretary
DAVID RUBENSTEIN
Co-Founder & Managing Director
The Carlyle Group
LESLIE B. SAMUELS
Partner
Cleary Gottlieb Steen & Hamilton LLP
RALPH L. SCHLOSSTEIN
President & Chief Executive Officer
Evercore Partners
ERIC SCHMIDT
Chairman & CEO
Google Inc.
ERIC SCHWARTZ
76 West Holdings
THOMAS F. STEYER
Senior Managing Member
Farallon Capital Management, L.L.C.
LAWRENCE H. SUMMERS
Charles W. Eliot University Professor
Harvard University
LAURA D’ANDREA TYSON
S.K. and Angela Chan Professor of
Global Management, Haas School of
Business University of California, Berkeley
MICHAEL GREENSTONE
Director

W W W . H A M I L T O N P R O J E C T . O R G
W W W . H A M I L T O N P R O J E C T . O R G
1775 Massachusetts Ave., NW
Washington, DC 20036
(202) 797-6279
Printed on recycled paper.
Highlights
Brad Allan of EdLabs and Roland Fryer of Harvard University and EdLabs
propose a series of best practices for schools that wish to implement
student incentive programs to boost student achievement using financial
and nonfinancial rewards for behaviors that increase learning.
The Proposal
Student incentives based on goals that have been proven effective.
Experiments with student incentives have shown that students respond
well to incentives, and that incentives based on inputs such as reading
books or doing homework are more effective than incentives based on
outputs such as test scores or grades.
Programs tailored to and implemented by individual schools and
districts. Student incentive programs are most effectively implemented
on a local level, by teams working within districts or even schools. In
this way, schools can find the incentives that work best for them, and no
larger new infrastructure is needed.
Promising new directions for even larger benefits.
Early results show that incentives may be even more effective when
students, parents, and teacher are all encouraged to work together
toward the same goal. There remain many exciting approaches to
incentives that have not yet been explored.
Benefits
Widespread implementation of incentive programs can boost
student achievement where they are needed most, especially among
disadvantaged students where many interventions have been tried and
have failed. Incentives are not a panacea, but they could play a significant
role in the larger solution.
