
Important drivers for customer
satisfaction – a Swedish
crisis reflection
Jacob Hallencreutz
Department of Civil and Industrial Engineering, Faculty of Science and
Technology, Uppsala University, Uppsala, Sweden
Johan Parmler
EPSI Rating Group, Stockholm, Sweden, and
Love Westin
Academy of Innovation, Mälardalen University, Eskilstuna, Sweden
Abstract
Purpose – The purpose of this study is to examine crisis effects on customer satisfaction and underlying
drivers by adding a new set of data to previous research. The core questions are: are the findings from
Hallencreutz and Parmler (2019, 2021) sustained or can new customer demands, needs, expectations and
behaviours be traced in the wake of the ongoing crisis?
Design/methodology/approach – A first study covering 2005–2017 was completed in 2018, published
online in 2019 and in print in 2021 (Hallencreutz and Parmler, 2021). This new study adds the years 2018–2023
to the data set and reuses the partial least squares (PLS) approach to structural equation models, also known
as PLS path modelling.
Findings – This additional study sustains the results from the initial study (Hallencreutz and Parmler, 2019,
2021). The variable product quality has been substituted by service quality as one of the most crucial drivers for
customer satisfaction together with brand image, and the current state of permacrisis has not changed that.
Research limitations/implications – The study is built on Swedish data from the EPSI Rating
Initiative (Eklöf and Westlund 2002) covering customer perceptions in banking, insurance (life and non-life),
telco (mobile operators, broadband and Pay-tv) and energy (trade, distribution and heating) over the years
2005–2023.
Practical implications – The study emphasizes the importance of understanding how customer
satisfaction drivers evolve over time in different industries and societal sectors, especially during crises. This
additional study sustains the paradigm shift in the studied industries – product quality has been substituted
by service quality as one of the most crucial drivers for customer satisfaction, and the current state of
economic downturn has not changed that.
Social implications – Society will have to learn to live with political and economic instability and
unpredictability for the foreseeable future. To recognize the increasing value deriving from firms’ intangible
assets while providing flawless deliveries seems to be a way forward in troublesome times. This is also a
catalyst for existing societal trends: the necessary reforms to master sustainable transformations will require
an ongoing adaptation process, with both winners and losers across continents.
© Jacob Hallencreutz, Johan Parmler and Love Westin. Published by Emerald Publishing Limited.
This article is published under the Creative Commons Attribution (CC BY 4.0) licence. Anyone may
reproduce, distribute, translate and create derivative works of this article (for both commercial and
non-commercial purposes), subject to full attribution to the original publication and authors. The full
terms of this licence may be seen at http://creativecommons.org/licences/by/4.0/legalcode
Customer
satisfaction
Received21 December 2023
Revised 27February 2024
Accepted8 April 2024
International Journal of Lean Six
Sigma
Emerald Publishing Limited
2040-4166
DOI 10.1108/IJLSS-12-2023-0224
The current issue and full text archive of this journal is available on Emerald Insight at:
https://www.emerald.com/insight/2040-4166.htm

Originality/value – The world has coped with a global pandemic, and Europe is currently experiencing a
humanitarian, political and economic crises caused by a war in Ukraine. This extended period of global
instability and insecurity could be called a permacrisis (Collins dictionary, 2022). This study offers a unique
quantitative analysis built on Swedish data from EPSI Rating initiative.
Keywords Customer perception, Customer satisfaction, Customer loyalty, Image, Expectations,
Value, Product quality, Service quality, Permacrisis
Paper type Research paper
Introduction
In 2019, the authors of this paper published a study showing a paradigm shift in crucial drivers
for customer satisfaction during the past decade (
Hallencreutz and Parmler, 2021). The study
was built on Swedish data from the EPSI Rating Initiative (Eklöf and Westlund, 2002)covering
customer perceptions in banking, insurance (life and non-life), telco (m obile operators,
broadband and Pay-tv) and energy (trade, distribution, and heating) over the years 2005–2017.
EPSI, formerly known as the European Satisfaction Index, is a well-known adoption from the
Swedish Customer Satisfaction Barometer (Fornell, 1992). The EPSI measurement model
framework encapsulates the customer experience into five drivers of brand image, customer
expectations, product quality, service quality and perceived value, which creates customer
satisfaction and loyalty. The study, using EPSIs measurement model, unravelled that that the
variable product quality during the past decade has been substituted by servic e qual ity as a core
driver for customer satisfaction, together with brand image. It showed that both private and
business customers in the studied industries in general are enlightened, conscious and
purposeful. Aspects such as social responsibility, sustainability, ethics and conduct are critical
and have been so for a long time. In a digital world, the average customer has also been
strongly affected and influenced by (social) media newsfeeds. Moreover, the study concluded
that service quality in practice is about closeness, simplicity and personal relations. Another
fundamental service quality aspect shown was the ability to proactively provide swift
responses to shifting customer needs, demands and expectations.
However, since that first publication, the world has coped with a global pandemic, and Europe
is cu rrently experiencing a humanitarian, political and economic crises caused by a war in
Ukraine. Compared to the relatively stable decades after the fall of the Berlin Wall, we now seem
to be living in a volatile “new normal”, with one challenge seamlessly followed by the next. This
extended period of global instability and insecurity could be called a permacrisis (
Collins
dictionary, 2022), in the sense that society at large will have to cope with crisis consequences for
years to come. The economic impact of the permacrises is structural, not cyclical, so effects will
persist over time. This state is also a catalyst for existing societal trends: the necessary reforms to
master sustainable transformations will require an ongoing adaptation process, with both
winners and losers across continents. The Covid-19 crises was a great wake-up call, because it
demonstrated how fragile business is (Sheth, 2020). It created disruption in supply chains both
domestically and globally, which has been further deepened during the past years.
This follow-up study focuses on developments in Sweden. The past decade has been
characterized by economic stability, and during the pandemic years 2020–2021, the Swedish
economy stood relatively strong. However, the GDP growth in Sweden was merely 2.6% 2022, and
forecasts indicate a stalemate in 2023. Customers have during the past two years faced economic
uncertainty, perhaps most recognizable in the rising inflation, rapid changes in central bank policies
and an extended energy demand, which have resulted in major spikes in energy prices (scb.se).
In times of crisis, new trends in consumer behaviour emerge (Loxton et al., 2020).
Research shows that customers generally re-evaluate behaviours during crisis. For example,
IJLSS

customers are likely to be more stressed and feel like they have lost their sense of control
(
Herzenstein et al.,2015). There has also been much anecdotal evidence on how a crisis such
as a global pandemic impacts an individual’s psyche, but a coherent research effort is still
lacking (Kordostrami and Kordostrami, 2021). In addition, previous research shows that
individual differences exist in responses to crisis. Thomson et al. (2011) demonstrated that
individuals’ cognitive and emotional responses to threatening messages depend on their
predispositions, such as whether they see themselves as vulnerable or not.
Thus, it is reasonable to assume that the past years troublesome developments have
affected customer behaviours and perceptions in many aspects. Could such changes also be
traced in EPSI’s customer perception data?
In this business environment, financial and non-financial performance measurements
capturing past, present and future performance seems even more critical than before.
Sisodia et al. (2007) documented that companies that take care of multiple stakeholders such
as employees, suppliers, community and customers financially outperform as compared to
companies that are only shareholder-driven. This symbiotic relationship between different
stakeholders will probably become increasingly important as crisis threats now create
greater uncertainty for businesses to operate and survive financially.
A critical stakeholder is the customer (Hallencreutz et al., 2020). The quality movement
has long been customer-oriented, and aspects of customer focus and satisfaction have been
widely discussed for decades, and regarded as fundamental building blocks of different
quality management concepts such as Lean and Six Sigma (Bergman et al., 2022). Among
the non-financial measurements, customer satisfaction is recognized as the performance
indicator that is the most widespread (Birch-Jensen et al.,2018; Bititci et al.,2012;
Hallencreutz et al.,2020; Iveroth and Hallencreutz, 2015; Taticchi et al.,2010).
The term customer focus has also been used to describe the desired starting point of
organisations’ improvement efforts (
Hellsten and Klefsjö, 2000; Sousa, 2003). It is shown that
satisfied customers have a positive effect on financial results as well as company image,
market shares and customer loyalty (Birch-Jensen et al.,2018; Fornell et al., 1996; Fornell
et al.,2016; Kristensen and Westlund, 2003; Eklöf et al.,2017, 2018). Customer satisfaction is
also recognized as an important predictive indicator for future financial performance (Bititci
et al.,2012; Eskildsen et al., 2003; Fornell et al., 1996; Stern, 2006).
The purpose of this study is to examine crisis effects on customer satisfaction and
underlying drivers by adding a new set of data to previous research. The core questions are:
are the findings from
Hallencreutz and Parmler (2019, 2021) sustained or can new customer
demands, needs, expectations and behaviours be traced in the wake of the ongoing crisis?
Methodology and data
The original study was completed in 2018, published online in 2019 and in print in 2021
(
Hallencreutz and Parmler, 2021). The study findings were further elaborated and discussed
by Iveroth and Hallencreutz (2020) and commented by Gremyr et al. (2020) as well as
Bergman and Klefsjö (2020).
This new study adds the years 2018–2023 to the data set and reuses the partial least
squares (PLS) approach to structural equation models, also known as PLS path modelling
(PLS-PM). Essentially, PLS-PM is made of a system of interdependent equations based on
simple and multiple regressions. Such a system estimates the network of relations among
the latent variables as well as the links between the manifest variables and their own latent
variables. In the EPSI model, applied in this and previous study, seven interrelated latent
variables are used, see Figure 1
, which is based on well-established theories and approaches
in customer behaviour (Eklöf and Westlund, 2002).
Customer
satisfaction
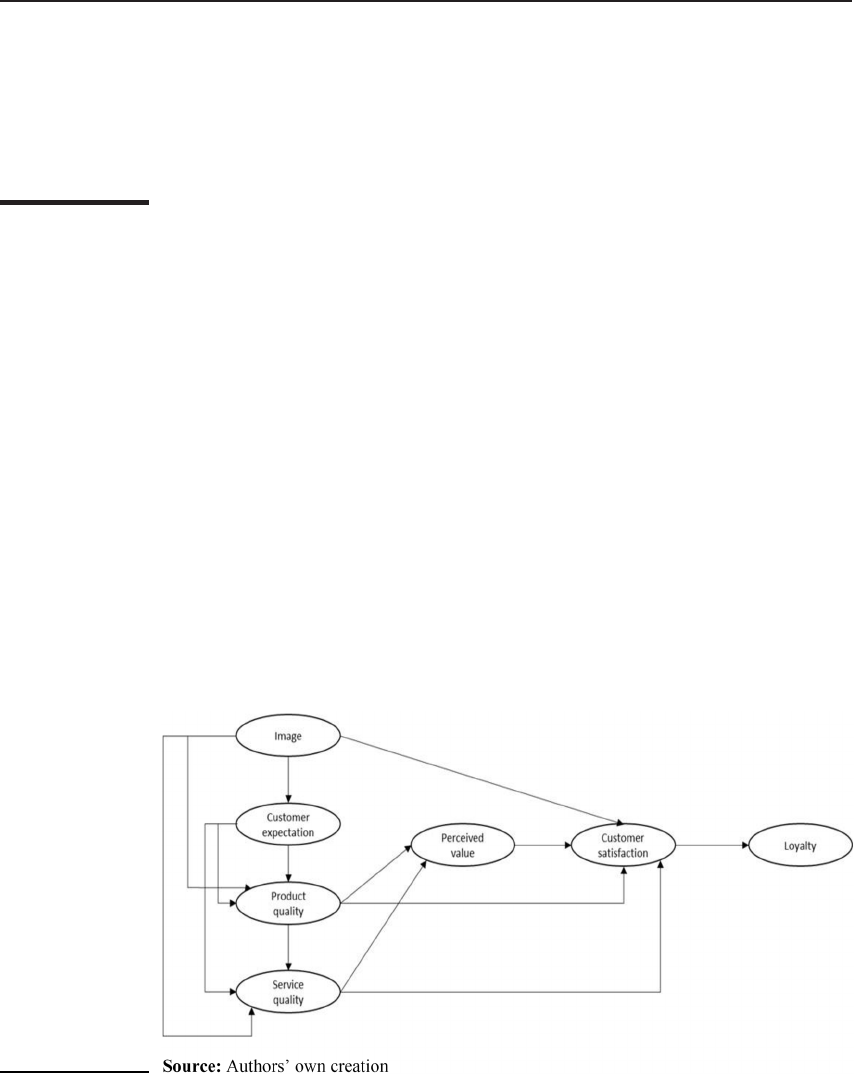
The latent variables on the left-hand side of the model are to be seen as drivers
explaining customer satisfaction and loyalty. Main causal relationships are indicated by the
arrows. A set of manifest variables is associated with each of the latent variables. This
structure is the foundation of the EPSI model. The entire model is important for determining
the main result variable, being customer satisfaction:
Image relates to the brand name and what kind of associations the customers get from the
product/brand/company.
Customer expectations relate to the prior anticipations of the said product in the eyes of the
customer. Such expectations are the result of active company/product promotion as well as
hearsay and prior experience from the product/provider.
The perceived quality concept includes two parts (“product” and “service”). With the “product”
component is meant the quality of the product as such (in the eyes of the customer), while
“service” relates to associated service quality like guarantees given, after sale service provision,
availability, engagement, reception etc.
Perceived value concerns the “value-for-money” aspect as experienced by the customer. It is here
seen to be affected by perceived quality and indirectly by image and expectations.
Customer satisfaction is measured by three standard items, overall satisfaction, fulfilment of
expectations and how well do you think “your provider” compares with your ideal provider.
Perceived loyalty relates to repurchase, word-of-mouth and recommendation.
The additional data set has been collected mainly through computer-assisted telephone
interviews (CATI) based on a structural questionnaire, as outlined in Appendix
.
Respondents have been asked to rate all variables between 1 and 10, and the EPSI model
then transforms the output to index values between 0 and 100. As previously described and
discussed, a customer satisfaction score above 75 indicates a high level of satisfaction, while
a score below 60 indicates customer dissatisfaction. Respondents may also leave open
comments for further text analysis.
The study aggregates cross-sectional data from several industries conducted by the
Swedish operation of EPSI Rating Group known as Svenskt Kvalitetsindex. Focus is on the
relationship between the estimated latent variables, and not on examining each industry’s
measurement model. The study data comprises 708,542 customer interviews, including both
Figure 1.
The EPSI model is a
model designed to
measure the cause–
effect relationships
specified in the
model. Customer
satisfaction and
loyalty are seen as
result of the driving
latent variables on
the left-hand side of
the model
IJLSS

private and corporate customers, covering the years 2005–2023. It includes numerical values
on the EPSI model latent variables for the following industries:
banking;
insurance (life and non-life);
telco (mobile operators, broadband and pay-tv); and
energy (trade, distribution and heating).
The analysis in this study followed the same process as in Hallencreutz and Parmler (2021)
and was executed as follows:
(1) a gross compilation of the result variable “customer satisfaction” was derived from the
total set of interviews is presented for the studied period providing an index trend;
(2) the data on latent level was used to estimate the path in the network of latent variables;
(3) from the estimation, the total effect between drivers and the result variable
customer satisfaction was calculated for each year following the steps:
a. gather customer survey data on latent-level from selected industries; and
b. estimate the inner model and calculate the total effect and relative importance on:
i. image to customer satisfaction;
ii. product quality to customer satisfaction;
iii. service quality to customer satisfaction; and
iv. perceived value to customer satisfaction.
c. Normalize each of the total impacts in step b. by making the sum of b. i to b.
iv equal to 1.
d. Step a. to c. is iterated over time.
(4) the results are presented as relative impact scores. Hence, the relative impact from
the network of latent variables on the target variable, customer satisfaction, was
calculated. Higher value indicates higher importance.
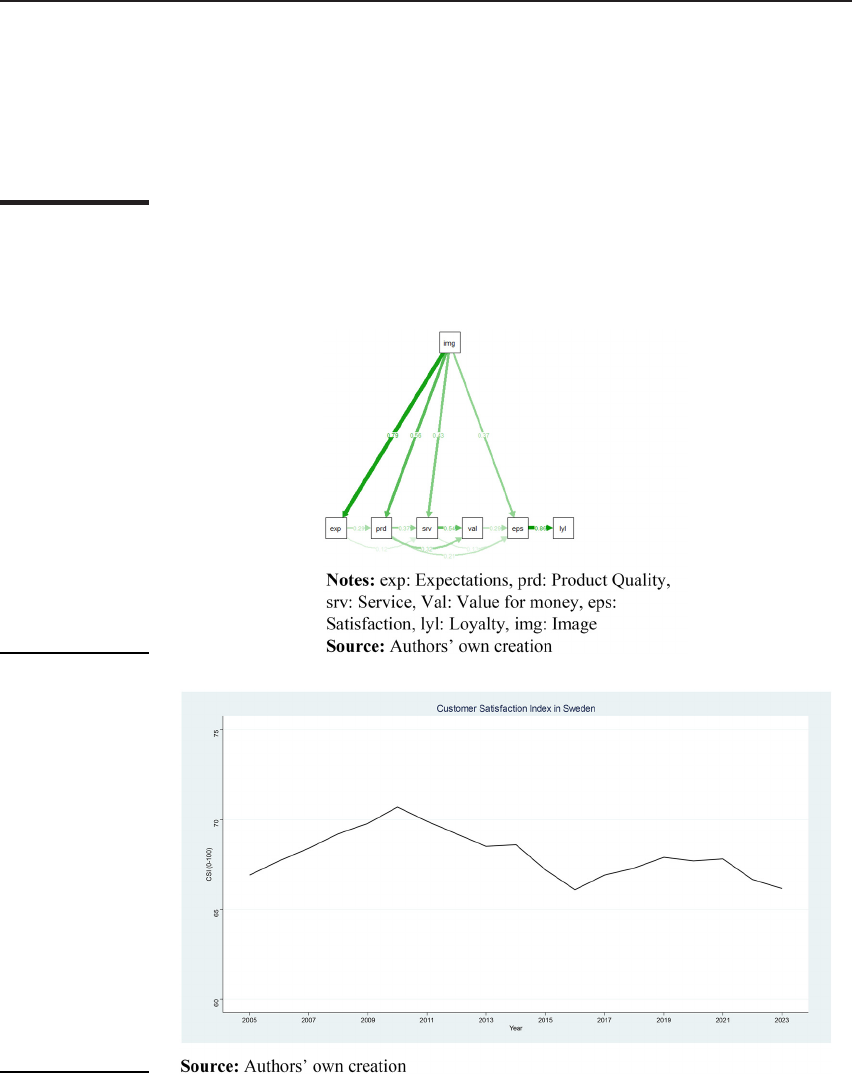
To exemplify, Figure 2 presents an estimated inner model for year 2022. The path
coefficients were used to calculate the total effect and relative importance by the steps
above. This procedure was repeated for every year studied.
Results and findings
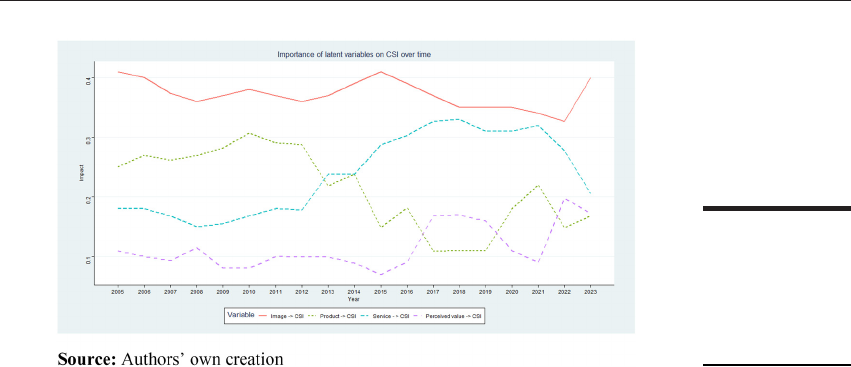
The chart below presents the general customer satisfaction trend between 2005 and 2023.
The data is a compilation of the studied industries [1]
.
The following general findings can be noted in Figure 3:
the customer satisfaction index shows a positive trend 2005–2010;
customer satisfaction peaked in 2010 but declined till 2016, mainly due to lagging
effects from the financial crisis 2008–2009;
a recovery is seen between 2017 and 2021. Thus, no negative “pandemic effect” can
be traced in this data’ and
a downturn from 2022 is noted, linked to the economic crisis not unlike the dip in 2011.
Figure 4 presents the analysis of the relative importance of each of the latent variables
considering the impact on customer satisfaction, with a specific focus on the additional
years 2018–2023. The following general findings can be noted:
Customer
satisfaction
the latent variable image has in all years been the most important driver. The trend
in the recent years is slightly negative but still the highest in impact despite current
crisis. A trusted brand is crucial in uncertain times;
product quality was stable until 2010, but the importance of this latent variable has
been reduced significantly since then. Current crisis has not changed that, although
an upturn was seen in 2020–2021, but the relative importance is from 2022 back to
pre-pandemic levels;
service quality has increased significantly over the past ten years, although a
downturn can be noted from 2022; and
the variable perceived value has been low on the importance-scale but has increased
significantly from 2022. the relative importance of perceived value (of purchased
goods and services) is over time also affected by inflation, which is in line with
Figure 3.
The general customer
satisfaction trend
derived from the
studied data
Figure 2.
PLS structural
equation modelling to
estimate the impact of
latent variables
IJLSS
previous research findings (Jonung and Laidler, 1988). It can be noted that this
variable correlates with the Swedish inflation rate during the years of this study
(coefficient 0.57).
Discussion
Based on data presented in this study, previous research and discussions with clients and
colleagues, the following reflections can be articulated:
customer satisfaction in the measured Swedish industries has recovered since 2016 but is
currently under pressure. During the past decade, consumers have become more
conscious, critical and demanding. Questions about sustainability, social commitment,
business ethics and conduct today influence the choice of con scious customers more than
before, in all studied industries. This trend was accelerated during the pandemic and
further enhanced by the crisis caused by the war in Ukraine, followed by a general global
instability. It can also be seen that customers’ purchasing behaviours change as social
media interaction and digital netw orking grows, which is in line with previous research,
summarized by Iveroth and Hallencreutz (2020). Speed, simplicity and convenience are
key elements. Poor digital platforms cannot be compensated. Consumers and companies
will expect a consistent experience across all channels and platforms, in real time.
Shopping hey days seem to be over for now, but in general, despite many uncertainties,
most organisations in the studied industries have succeeded in both managing a stable
basic delivery and responding to changing customer needs, requirements, expectations
and behaviours. The customer satisfact ion indices are after all relatively stable over time,
but it is reasonable to assume prolonged crisis effects in the years to come;
the importance of brand image is strengthened. Because the latent variable image
remains strong, it can be concluded that intangible assets (such as brand awareness, trust
and reputation) have a sustai ned impact on customers percepti ons also during periods of
crisis. Trust’s importance has also been stressed in previous research (Drewniak and
Karaszewski, 2016). Customers are likely to purchase products and services based on
specificfeaturesofabrand(moorman et al.,1993). In times of uncertainty, people tend to
turn to big, stable and strong brands. Customers with one single provider are again more
satisfied. Now is not the time for experiments and risk-taking;
Figure 4.
The latent variables
relative importance
on customer
satisfaction over time
Customer
satisfaction

product quality aspects still have less impact on customer satisfaction. product
specifications and features seem to have a very volatile effect on customer
satisfaction, although a certain positive effect could be noted 2020–2021, mainly due
to the relative importance of seamless digital platforms and services during the time
of lock down and remote working. Basic features and digital functionality are now
fundamental quality aspects in the era of digitalization, but softer service quality
aspects still stand out as more important. However, it should be emphasized that
this finding differs between industries;
service quality still breeds customer satisfaction. It has been stated by market
researchers that customer satisfaction is mainly based upon the level of service
quality provided (lee et al., 2000), and service quality acts as determinant of
customer satisfaction (Wilson et al., 2008). This study sustains these statements.
The new data tells that the variable service quality has in general a greater impact
on customer satisfaction than product quality. The shift took place in 2013, and
since then, the gap has remained, although a decline can be noted from 2022. Thus,
it is crucial to focus on the customer end of the supply chain also during crises. A
fundamental service quality aspect in a volatile business environment is to
proactively provide swift responses to shifting customer needs, demands,
expectations and behaviours; and
price is important again. After a period of relative economic stability characterized
by low interest rates and low inflation, the Swedish economy is now experiencing a
cost explosion, which recalls the economic crisis of the early 1990s. Consequently,
the latent EPSI model variable perceived value has gained a greater relative impact
on customer satisfaction from 2022, and this variable will most likely remain
prominent in future studies, given the economic development.
In conclusion, this study emphasizes the importance of understanding how customer
satisfaction drivers evolve over time in different industries and societal sectors, especially
during crises. This additional study sustains the paradigm shift in the studied industries –
product quality has been substituted by service quality as one of the most crucial drivers for
customer satisfaction – although certain crisis effects can be seen such as the relative
importance of price and perceived value.
In general, most organizations have coped with the instability and unpredictability that
this new era entails. Despite major uncertainties, the studied industries have succeeded in
both managing a stable basic delivery and responding to changing customer needs,
requirements, expectations and behaviours. The most dramatic development was perhaps
within the Swedish energy sector. Loud political debate, threats of electricity shortages,
extreme price variation and cost crisis obviously left a mark. In a year like 2022, both the
media, neighbours, friends and business acquaintances have influenced the customer
experience, as well as the direct contact with the electricity supplier. Customer dialogues in
the energy sector have, in some cases, been about pure crisis management, but the situation
has been stabilized during 2023, and to some extent, substituted by a debate about grocery
prices and provoking profit margins in the banking sector. How will things go forward?
Does anyone dare say anything? An educated guess is that society will have to learn to live
with political and economic instability and unpredictability for the foreseeable future – the
term permacrisis is therefore painfully relevant.
Customer focus has been on the quality management (QM) agenda for decades, and the
need for further research on the integration of customer orientation with core business
processes has been stressed for long, see for instance
Hellsten and Klefsjö (2000). Although
IJLSS

the topic has been thoroughly discussed, there is still a gap between academic theories,
political rhetoric and actual implementation in practice (Isaksson, 2019). Moreover, it has
been argued that quality management tools and practices must be developed to support
sustainability considerations from a stakeholder perspective (Siva et al., 2016; Antony et al., 2024).
The authors therefore suggest further conceptual work and research on stakeholder management
to connect quality management to sustainable development in practice. Our contribution to this
development could be to emphasise the need to measure and understand different perspectives on
stakeholder perceptions, with a specific focus on the customer.
Lastly, more research is needed to extend these findings to different industries in a
European context as well as strengthening the understanding on how to provide reliable
indications for future financial and non-financial performance. To recognize the increasing
value deriving from firms’ intangible assets while providing flawless deliveries seems to be
a way forward in troublesome times.
Note
1. More information on different studies can be found at
www.kvalitetsindex.se and www.epsi-rating.com
References
Antony, J., Bhat, S., Sony, M., Fundin, A., Sorqvist, L. and Molteni, R. (2024), “Sustainable development
through quality management: a multiple-case study analysis of triumphs, trials and
tribulations”, The TQM Journal,doi:10.1108/TQM-12-2023-0424.
Bergman, B. and Klefsjö, B. (2020), Kvalitet Från Behov till Användning, Studentlitteratur, Lund, Sweden.
Bergman, B., Bäckström, I., Garvare, R. and Klefsjö, B. (2022), Quality from Customer Needs to
Customer Satisfaction, Studentlitteratur, Lund, Sweden.
Birch-Jensen, A., Gremyr, I., Hallencreutz, J. and Rönnbäck, Å. (2018), “Use of customer satisfaction
measurements to drive improvements”, Total Quality Management and Business Excellence,
Vol. 31 Nos 5/6, doi: 10.1080/14783363.2018.1436404.
Bititci, U., Garengo, P., Dörfler, V. and Nudurupati, S.S. (2012), “Performance measurement: challenges
for tomorrow”, International Journal of Management Reviews, Vol. 14 No. 3, pp. 305-327.
Collins Dictionary (2022), available at:
www.collinsdictionary.com/dictionary/english
Drewniak, R. and Karaszewski, R. (2016), “Brand management in a situation of an economic crisis:
methods of strengthening the brand value in the scope of emerging markets”, Asia Pacific
Journal of Marketing and Logistics, Vol. 28 No. 4, pp. 743-758.
Eklöf, J. and Westlund, A. (2002), “The pan-European customer satisfaction index programme-current
work and the way ahead”, Total Quality Management, Vol. 13 No. 8, pp. 1099-1106.
Eklöf, J., Hellström, K., Malova, A., Parmler, J. and Podkorytova, O. (2017), “Custom er perception measures
driving financial performance”, Measuring Business Excellence, Vol. 21 No. 3, pp. 51-57.
Eklöf, J., Podkorytova, O. and Malova, A. (2018), “Linking customer satisfaction with financial
performance: an empirical study of Scandinavian banks”, Total Quality Management and
Business Excellence, Vol. 31 No 15/16, doi: 10.1080/14783363.2018.1504621.
Eskildsen, J., Westlund, A., H. and Kristensen, K. (2003), “The predictive power of intangibles”,
Measuring Business Excellence, Vol. 7 No. 2, pp. 46-54.
Fornell, C. (1992), “A national customer satisfaction barometer: the Swedish experience”, Journal of
Marketing, Vol. 56 No. 1, pp. 6-21.
Fornell, C. , Johns on, M.D. , Ande rson, E .W., C ha, J. and Bryant, B.E. (1996), “The American
customer satis faction index: nature, purpose, and findings”, Journal of Marketing,Vol.60
No. 4, pp. 7-18.
Customer
satisfaction

Fornell, C., Morgeson, F., Hult, G. and Tomas, M. (2016), “Stock returns on customer satisfact ion do beat
the market: gauging the effect of a marketing intangible”, Journal of Marketing,Vol.80No.5,doi:
10.1509/jm.15.0229.
Gremyr, I., Bergquist, B. and Elg, M. (2020), Quality Management: An Introduction, Studentlit teratur, Lund.
Hallencreutz, J. and Parmler, J. (2021), “Important drivers for customer satisfaction – from product focus
to image and service quality”, Total Quality Management and Business Excellence, Vol. 32
Nos. 5/6, pp. 501-510.
Hallencreutz, J., Deleryd, M. and Fundin, A. (2020), “Decoding sustainable success”, Total Quality
Management and Business Excellence,doi:10.1080/14783363.2020.1863779.
Hellsten, U. and Klefsjö, B. (2000), “TQM as a management system consisting of values, techniques, and
tools”, The TQM Magazine, Vol. 12 No. 4, pp. 238-244.
Herzenstein, S., Horsky, S. and Posavac, S. (2015), “Living with terrorism or withdrawing in terror:
perceived control and consumer avoidance”, Journal of Consumer Behaviour, Vol. 14,
pp. 228-236.
Isaksson, R. (2019), “Excellence for sustainability – maintaining the license to operate”, Total Quality
Management and Business Excellence,doi:10.1080/14783363.2019.1593044.
Iveroth, E. and Hallencreutz, J. (2015), Effective Organizational Change: Leading through Sensemaking,
Routledge, New York, NY.
Iveroth, E. and Hallencreutz, J. (2020), Leadership and Digital Change, Routledge, New York, NY.
Jonung, L. and Laidler, D. (1988), “Are perceptions of inflation rational? Some evidence for Sweden”,
The American Economic Review, Vol. 78 No. 5, pp. 1080-1087.
Kristensen, K. and Westlund, A. (2003), “Valid and reliable measurements for sustainable non-financial
reporting”, Total Quality Management and Business Excellence, Vol. 14 No. 2, pp. 161-170.
Lee, H., Lee, Y. and Yoo, D. (2000), “The determinants of perceived service quality and its relationship
with satisfaction”, Journal of Services Marketing, Vol. 14 No. 3, pp. 217-231.
Moorman, C., Deshpande, R. and Zalman, G. (1993), “Factors affecting trust in market research
relationships
”, Journal of Marketing, Vol. 57 No. 1, p. 81.
Sheth, J. (2020), “Business of business is more than business: managing during the covid crisis”,
Industrial Marketing Management, Vol. 88, pp. 261-264.
Sisodia, R., Wolfe, D. and Sheth, J. (2007), Firms of Endearment: The Pursuit of Purpose and Profit,:
Wharton Publishing Group, Upper Saddle River, NJ.
Siva, V., Gremyr, I., Bergquist, B., Garvare, R., Zobel, T. and Isaksson, R. (2016), “The support of quality
management to sustainable development: a literature review”, Journal of Cleaner Production,
Vol. 138, doi: 10.1016/j.jclepro.2016.01.020.
Sousa, R. (2003), “Linking quality management to manufacturing strategy: an empirical investigation of
customer focus practices”, Journal of Operations Management, Vol. 21 No. 1, pp. 1-18.
Stern, L.D. (2006), A Guide to Global Acquisitions, Fultus Corporation Palo Alto, CA.
Taticchi, P., Tonelli, F. and Cagnazzo, L. (2010), “Performance measurement and management: a literature
review and a research agenda”, Measuring Business Excellence, Vol. 14 No. 1, pp. 4-18.
Wilson, A., Zeithaml, V.A., Bitner, M.J. and Gremler, D.D. (2008), Services Marketing,McGraw–Hill Education.
Further reading
Amalia, P., Mihaela, D. and Ionut , P. (2012), “From market orientation to the community orientation for
an open public administration: a conceptual framework”, Procedia - Social and Behavioral
Sciences, Vol. 62, pp. 871-875.
IJLSS

Andreassen,T.andW.,Lindestad,B.(1998),“Customer loyalty and complex services: the impact of
corporate image on quality, consumer satisfaction and loyalty for customers with varying degree of
service expertise”, Intern ation al Journal of Service Indust ry Management,Vol.9No.1,pp.7-23.
Arvidsson, S. (2011), “Disclosure of non-financial information in the annual report: a management-team
perspective”, Journal of Intellectual Capital, Vol. 12 No. 2, pp. 277-300.
Bennett, R. and Barkensio, A. (2005), “Relationship quality, relationship marketing, and client
perceptions of the levels of service quality of charitable organisations”, International Journal of
Service Industry Management, Vol. 16 No. 1, pp. 81-106.
Bititci, U.S., Carrie, A.S. and McDevitt, L.G. (1997), “Integrated performance measurement systems: a
development guide”, International Journal of Operations and Production Management, Vol. 17
No. 5, pp. 522-535.
Bollen, K.A. (1989), Structural Equations with Latent Variables, Wiley, New York, NY.
Crosby, P. (1979), Quality is Free, McGraw-Hill, New York, NY.
Deming, W.E. (1986), Out of the Crisis, Cambridge University Press, Cambridge.
Deming, W.E. (1993), The New Economics for Industry, Government and Education, MIT, Cambridge.
Donthu, N. and Gustafsson, A. (2020), “Effects of covid-19 on business and research”, Journal of
Business Research, Vol. 117 No. 1, pp. 284-289.
Feigenbaum, A.V. (1951), Total Quality Control, McGraw-Hill, New York, NY.
Foley, K.J. (2005), Meta Management, Standards Australia, Sydney.
Juran, J.M. (1999), Juran’s Quality Handbook, McGraw-Hill, New York, NY.
Kaplan, D. (2000), Structural Equation Modeling: foundations and Extension s, Sage, Thousands Oaks, CA.
Kordrostami, M. and Kordrostami, E. (2021), “I got this!” a comprehensive framework for customer
behaviour during a pandemic crisis”, Journal of Customer Behaviour, Vol. 20 No. 1, doi: 10.1362/
147539221X16356770010730.
Martensen, A., Kristensen, K. and Gronholdt, L. (2000), “Customer satisfaction measurement at post
Denmark: results of application of the European customer satisfaction index methodology”,
Total Quality Management, Vol. 11 No. 7, pp. 1007-1015.
Oakland, J.S. (1999), Total Quality Management, Butterworth-Heinemann, London.
Pantano, E., Pizzi, G., Scarpi, D. and Dennis, C. (2020), “Competing during a pandemic? Retailers’ ups
and downs during the covid19 outbreak
”, Journal of Business Research, Vol. 116 No. 2020,
pp. 209-213.
SCB – Statistics Sweden (2023), “Scb.se/en”.
Tenenhaus, M. (2008), “Component-based structural equation modelling”, Total Quality Management
and Business Excellence, Vol. 19 Nos 7/8, pp. 871-886.
Thompson, S., Schlehofer, M., Gonzalez, A. and Bayardelle, E. (2011), “Reactions to a health threat:
dispositional threat orientations and message characteristics”, British Journal of Health
Psychology, Vol. 16 No. 2, pp. 344-358.
Customer
satisfaction

Appendix
Corresponding author
Jacob Hallencreutz can be contacted at:
For instructions on how to order reprints of this article, please visit our website:
www.emeraldgrouppublishing.com/licensing/reprints.htm
Table A1.
Latent variables Manifest variables
Image It can be trusted in what it says and does
It is stable and firmly established
It has a social contribution for the society
It is concerned with customers
It is innovative and forward-looking
Customer
expectations
Expectations for the overall quality of “your provider” at the moment you became
customer of this provider
Expectations for “your provider” to provide products and services to meet your
personal need
How often did you expect that things could go wrong at “your provider”
Perceived product
quality
Overall perceived quality
Technical quality
Range of services and products offered
Reliability and accuracy of the products and services provided
Perceived service
quality
Customer service and personal advice offered
Quality of the services you use
Clarity and transparency of information provided
Perceived value Given the quality of the products and services how would you rate the fees and
prices that you pay for them?
Given the fees and prices that you pay, how would you rate the quality of the
products and services offered?
Customer
satisfaction
Overall satisfaction
Fulfilment of expectations
How well do you think “your provider” compares with your ideal provider?
Customer loyalty If you would need to choose a provider, how likely is it that you would choose
“your provider” again?
How to you usually talk about “your provider”? In a negative or positive way?
If a friend or colleague asks you for advice, how likely is it that you would
recommend “your provider”?
Source: Authors’ own creation
IJLSS
