
Original Paper
Applying Machine Learning to Daily-Life Data From the
TrackYourTinnitus Mobile Health Crowdsensing Platform to Predict
the Mobile Operating System Used With High Accuracy:
Longitudinal Observational Study
Rüdiger Pryss
1
, PhD, Prof Dr; Winfried Schlee
2
, PhD; Burkhard Hoppenstedt
3
, MSc; Manfred Reichert
3
, PhD, Prof
Dr; Myra Spiliopoulou
4
, PhD, Prof Dr; Berthold Langguth
2
, PhD, Prof Dr; Marius Breitmayer
3
, MSc; Thomas Probst
5
,
PhD, Prof Dr
1
Institute of Clinical Epidemiology and Biometry, University of Würzburg, Würzburg, Germany
2
Department of Psychiatry and Psychotherapy, University of Regensburg, Regensburg, Germany
3
Institute of Databases and Information Systems, Ulm University, Ulm, Germany
4
Faculty of Computer Science, Otto von Guericke University of Magdeburg, Magdeburg, Germany
5
Department for Psychotherapy and Biopsychosocial Health, Danube University Krems, Krems, Austria
Corresponding Author:
Rüdiger Pryss, PhD, Prof Dr
Institute of Clinical Epidemiology and Biometry
University of Würzburg
Josef-Schneider-Str 2
Würzburg, 97080
Germany
Phone: 49 931 20146471
Email: ruediger.pryss@uni-wuerzburg.de
Abstract
Background: Tinnitus is often described as the phantom perception of a sound and is experienced by 5.1% to 42.7% of the
population worldwide, at least once during their lifetime. The symptoms often reduce the patient’s quality of life. The
TrackYourTinnitus (TYT) mobile health (mHealth) crowdsensing platform was developed for two operating systems (OS)—Android
and iOS—to help patients demystify the daily moment-to-moment variations of their tinnitus symptoms. In all platforms developed
for more than one OS, it is important to investigate whether the crowdsensed data predicts the OS that was used in order to
understand the degree to which the OS is a confounder that is necessary to consider.
Objective: In this study, we explored whether the mobile OS—Android and iOS—used during user assessments can be predicted
by the dynamic daily-life TYT data.
Methods: TYT mainly applies the paradigms ecological momentary assessment (EMA) and mobile crowdsensing to collect
dynamic EMA (EMA-D) daily-life data. The dynamic daily-life TYT data that were analyzed included eight questions as part of
the EMA-D questionnaire. In this study, 518 TYT users were analyzed, who each completed at least 11 EMA-D questionnaires.
Out of these, 221 were iOS users and 297 were Android users. The iOS users completed, in total, 14,708 EMA-D questionnaires;
the number of EMA-D questionnaires completed by the Android users was randomly reduced to the same number to properly
address the research question of the study. Machine learning methods—a feedforward neural network, a decision tree, a random
forest classifier, and a support vector machine—were applied to address the research question.
Results: Machine learning was able to predict the mobile OS used with an accuracy up to 78.94% based on the provided EMA-D
questionnaires on the assessment level. In this context, the daily measurements regarding how users concentrate on the actual
activity were particularly suitable for the prediction of the mobile OS used.
Conclusions: In the work at hand, two particular aspects have been revealed. First, machine learning can contribute to EMA-D
data in the medical context. Second, based on the EMA-D data of TYT, we found that the accuracy in predicting the mobile OS
used has several implications. Particularly, in clinical studies using mobile devices, the OS should be assessed as a covariate, as
it might be a confounder.
J Med Internet Res 2020 | vol. 22 | iss. 6 | e15547 | p. 1http://www.jmir.org/2020/6/e15547/
(page number not for citation purposes)
Pryss et alJOURNAL OF MEDICAL INTERNET RESEARCH
XSL
•
FO
RenderX

(J Med Internet Res 2020;22(6):e15547) doi: 10.2196/15547
KEYWORDS
mHealth; crowdsensing; tinnitus; machine learning; mobile operating system differences; ecological momentary assessment;
mobile phone
Introduction
Background
Mobile health (mHealth) uses smart mobile devices to address
various questions in the context of neuroscience, psychology,
and medicine. New paradigms, such as ecological momentary
assessment (EMA), mobile crowdsourcing, and mobile
crowdsensing, as well as mHealth apps, in general, have enabled
data collection procedures that surpass many existing methods
in gathering valuable medical data by several orders of
magnitude [1]. Among others, by using smart mobile devices,
data can be gathered in everyday life, on a cost-effective basis,
and by adding contextual information sources, such as Twitter
or Facebook. As many medical phenomena pose daily variations
[2], mHealth technology is predestined to be utilized in this
context. Along these trends, many insights have been presented
by researchers that show that smart mobile devices can help to
establish new data sources in many scenarios [3].
In these data collection scenarios, which are built on the usage
of mobile devices and their sensors, one dimension has been
less considered so far. It refers to the question of whether the
operating system (OS) of the mobile technology being used (eg,
iOS or Android) constitutes a valuable information source or
confounder for medical data analyses. Or, as another example,
is it possible to derive insights if a patient changes the OS during
a study when using mHealth apps? As Android and iOS
dominate the mobile OS market [4]—with a market share of
99.32% in May 2020 (72.52% Android and 26.80% iOS)—any
insights gained based on differences from users regarding these
OS types could provide a representative picture for the OS
market. Following this, data that were gathered with the
TrackYourTinnitus (TYT) mHealth crowdsensing platform for
tinnitus patients over 5 years of age are analyzed in this paper.
TYT is an mHealth crowdsensing platform that offers iOS and
Android apps that can empower patients to learn more about
their tinnitus symptoms over time. Tinnitus is the phantom
perception of a sound and it is experienced by 5.1% to 42.7%
of the population worldwide at least once during their lifetime
[5]. The symptoms often reduce the patient’s quality of life. As
tinnitus constitutes a chronic condition for which currently no
cure or general treatment exists, patients suffering from it crave
for new treatment procedures or at least new medical insights.
With the idea of EMA, also known as ambulatory assessment
or experience sampling, and mobile crowdsensing techniques
in mind, TYT was developed by an interdisciplinary team of
medical experts, psychologists, and computer scientists.
The development of TYT was motivated by the clinical
experience that among many tinnitus patients, tinnitus loudness
and tinnitus annoyance vary over time and that patients’
experiences differ in the pattern of these fluctuations. Therefore,
the variations are considered to provide new valuable insights
in the pathophysiological mechanisms of this chronic condition
[6]. To learn more about these fluctuations, TYT applies EMA
and mobile crowdsensing to capture them. In EMA, the variable
in question (eg, a symptom) is assessed repeatedly in daily life
[7]. In mobile crowdsensing, only mobile devices are used for
the data collection procedure, while their sensors are used to
capture, for example, the GPS position or the external sound
level [8]. In contrast, in mobile crowdsourcing, tasks are
proposed by a crowdsourcer to a group of individuals, who
voluntarily undertake tasks. The undertaking of the task always
entails mutual benefit. The user will receive the satisfaction of
a given type of need, while the crowdsourcer will obtain and
utilize to their advantage what the user has brought to the
venture [9]. In contrast to mobile crowdsourcing, mobile
crowdsensing relies solely on mobile technology and integrates
sensors to collect data. Two recent works that discuss mobile
crowdsensing in the context of health care can be found in Kraft
et al [1] and Pryss [10]. In TYT, the users fill in a registration
questionnaire (ie, static data) and can provide repeated
assessments in daily life (ie, dynamic data) afterward [11].
Objectives
Compared to the existing studies on TYT, this work investigates
repeatedly provided EMA datasets from TYT users (ie, dynamic
data) and their relation to the mobile OS used. While this study
analyzes this dynamic data, a previous study focused on
differences between Android and iOS users in the static data
given at registration [12]. Contrary to the Android versus iOS
comparison of the SmokeFree28 (SF28) smoking cessation app
[13], in our study we found no differences in gender, but we
did find differences in age for TYT users. However, in Pryss et
al [12], we found differences that might be of interest for
medical purposes. More specifically, we revealed that Android
users reported a significantly longer tinnitus duration than did
iOS users, cross-sectionally. Future longitudinal research is
necessary to address the question of whether users with longer
tinnitus duration prefer Android to iOS or whether users of
Android tend to develop longer tinnitus durations than iOS
users. In another recent work [14], we investigated differences
in Android and iOS users of the TrackYourHearing (TYH)
mHealth crowdsensing platform. This platform aims to measure
fluctuations in hearing of users with hearing loss. In the TYH
study, we found no differences in gender or age, but significant
differences were revealed in three questions of the dynamic data
that were repeatedly provided. This shows that the dynamic
data in combination with the OS are worth being investigated
more deeply.
As another current trend, the application of machine learning
techniques in different fields is promising. In the medical field,
there is a remarkable discrepancy between huge expectations
in the potential of machine learning on one side and the current
application of this technique on the other [15-19]. Importantly,
there is an increasing consensus about its potential in the context
of mobile technology [20-23]. However, the application of
J Med Internet Res 2020 | vol. 22 | iss. 6 | e15547 | p. 2http://www.jmir.org/2020/6/e15547/
(page number not for citation purposes)
Pryss et alJOURNAL OF MEDICAL INTERNET RESEARCH
XSL
•
FO
RenderX
machine learning to a large group of users of an mHealth
crowdsensing platform that gathers EMA datasets is still rare
[19,24-27]. As we already found relevant differences between
Android and iOS pertaining to the TYT users’ static
characteristics at registration [12], this work investigates the
following research question: Is it possible to predict the mobile
OS used based on dynamic TYT data with high accuracy using
machine learning methods? More specifically, is it possible to
predict the mobile OS used based on the repeatedly given daily
data provided by the TYT users with high accuracy using
machine learning methods? To the best of our knowledge, thus
far, no other work has considered this research question in the
given context.
Methods
Overview
TYT was developed to track the individual tinnitus perception
of users in their daily lives [28]. In this context, the procedure
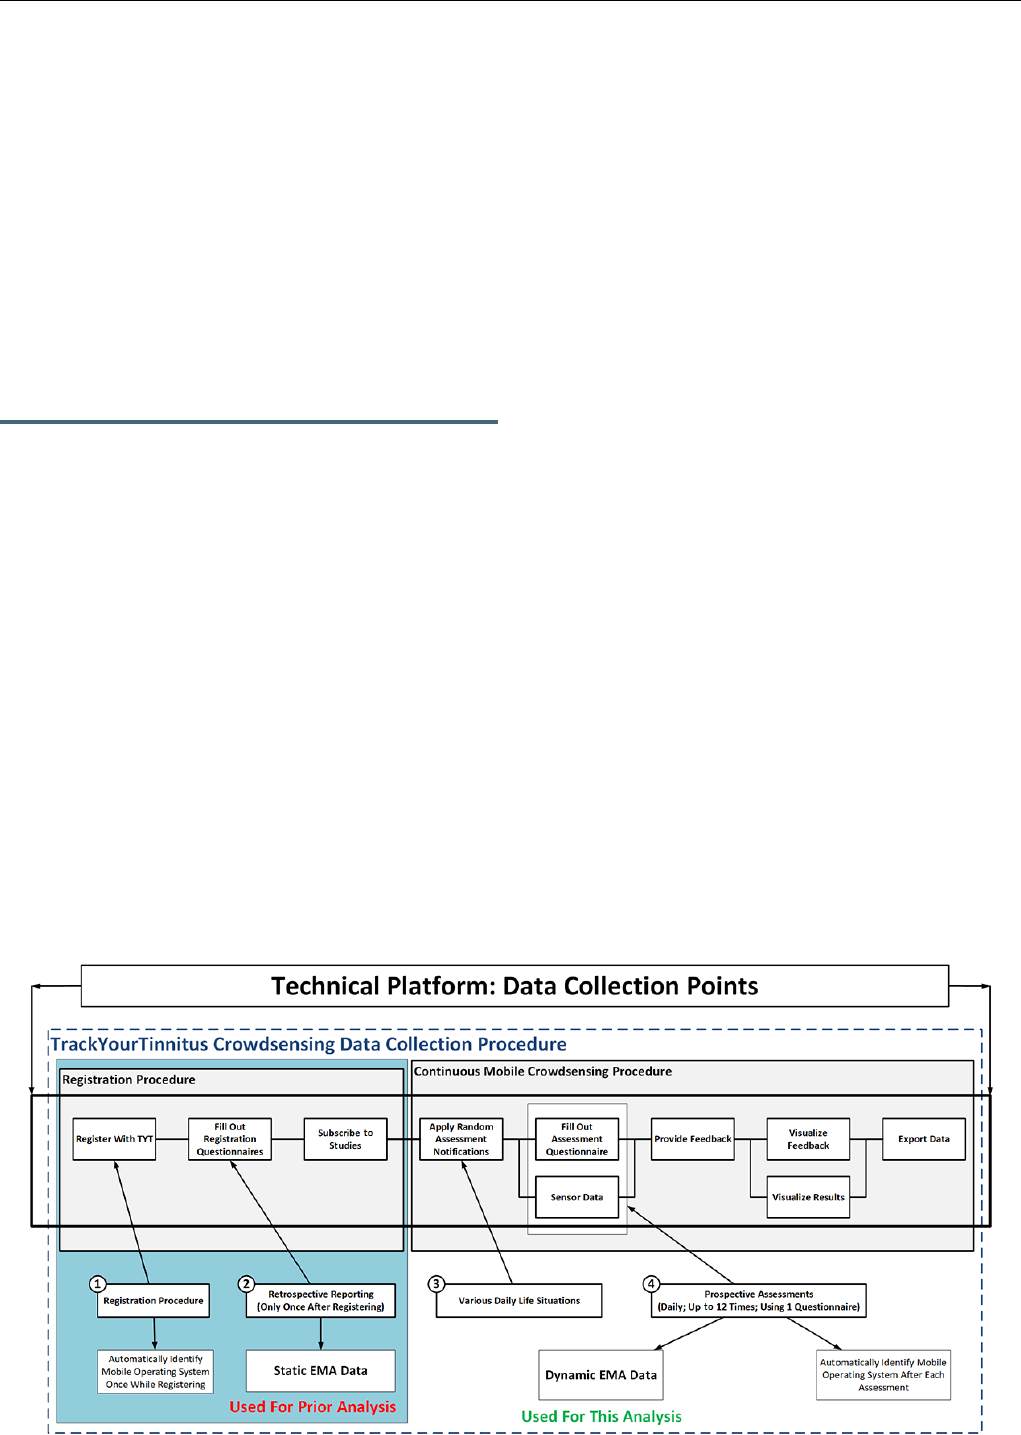
shown in Figure 1 is applied to all TYT users. In general, TYT
pursues three major goals.
First, dynamic EMA (EMA-D) data shall be collected during
the continuous mobile crowdsensing procedure (see Figure 1,
box #4). Importantly, a crowdsensing user shall not foresee the
times he or she is asked to provide the data (see Figure 1, box
#3). This is ensured by asking the crowdsensing users for data
in various daily-life situations by the use of smartphone
notifications. When a user clicks on such a notification, the
tinnitus-tracking questionnaire is presented to a user, consisting
of eight EMA-D questions. Table 1 lists the eight questions of
the EMA-D questionnaire.
Note that the questionnaire appears visually on both mobile OS
types in the same way. For more information on the
questionnaire shown in Table 1 and how it appears on the mobile
devices, see Pryss et al [11].
Second, the collected data shall enable innovative data analyses,
such as juxtaposing the prospectively assessed EMA-D and
retrospectively assessed static EMA (EMA-S) at registration
(see Figure 1, box #2; [11]). Third, gathered data shall be used
to provide feedback to the mobile crowdsensing users [29].
When initially designing the user procedure of TYT, we had
not yet considered comparing users based on the mobile OS
they used. The initial intention to collect information about the
mobile OS used (see Figure 1, box #1) when filling out a
questionnaire had been to quickly identify technical issues that
could emerge with the large variety of mobile OS versions and
mobile devices used. However, it turned out that the information
can be also used for innovative analyses. For interested readers,
more technical information of the platform can be found in
Pryss et al [28,29].
A further note is provided to distinguish between static and
dynamic data in the procedure shown in Figure 1. Usually,
existing works distinguish between questionnaire, sensor, and
behavioral data when utilizing mHealth crowdsensing
approaches [30-32]. However, our distinction between static
trait (ie, EMA-S) or dynamic state EMA data (ie, EMA-D) is
done less frequently by other works. This is remarkable, as the
distinction between trait (ie, static) and state (ie, dynamic)
variables is fundamental in clinical and psychological research.
As an example, trait data are expected to have a closer
association with genetic information as compared to state data,
which depend more strongly on environmental factors.
The experimental protocols were approved by the Ethics
Committee of the University Clinic of Regensburg, Germany.
All methods were carried out in accordance with the relevant
guidelines and regulations. The users of the app were informed
that their gathered data will be used for scientific analyses;
informed consent was given.
Figure 1. TrackYourTinnitus (TYT) mobile crowdsensing collection procedure. EMA: ecological momentary assessment.
J Med Internet Res 2020 | vol. 22 | iss. 6 | e15547 | p. 3http://www.jmir.org/2020/6/e15547/
(page number not for citation purposes)
Pryss et alJOURNAL OF MEDICAL INTERNET RESEARCH
XSL
•
FO
RenderX

Table 1. Questions from the dynamic ecological momentary assessment (EMA-D) questionnaire.
Answer typeQuestion (Q)Number
Yes or noDid you perceive the tinnitus right now?Q1
Slider
a
How loud is the tinnitus right now?Q2
SliderHow stressful is the tinnitus right now?Q3
Manikins
b
How is your mood right now?Q4
ManikinsHow is your arousal right now?Q5
SliderDo you feel stressed right now?Q6
SliderHow much did you concentrate on the things you are doing right now?Q7
Yes or noDo you feel irritable right now?Q8
a
Each slider has a different range; the slider for Q2, for example, ranges from not audible to maximal loudness.
b
We made use of the Self-Assessment Manikin (SAM) scales, which are a pictorial rating system to obtain self-assessments of experienced emotions
on the dimensions affective valence, dominance, and arousal.
Data Source
The TYT platform includes a website, uses a relational database,
and includes an iOS and Android app. The latter are
implemented as native apps. Users can register with the platform
by using the website or the mobile apps. After that, three
registration questionnaires must be completed—EMA-S
questionnaires, which can be filled out using the website or the
mobile apps—before users can provide the EMA-D data
repeatedly in daily life—this is denoted as the EMA-D
questionnaire, which can only be filled out using the mobile
apps. After completing the registration questionnaires, users
must decide whether they want to use the default notification
schema for the EMA-D questionnaire. The default setting means
users would receive random notifications up to eight times per
day. This setting can be changed by a user in many ways. The
user can reduce the notification number to a minimum value of
three or a maximum value of 12 notifications per day. In
addition, a user can select specific days of the week when no
notifications shall appear. Finally, a user can switch to the fixed
notification mode, in which he or she specifies exact notification
points. Note that in this analysis, it is not distinguished which
mode has been selected by a user. Finally, if the user clicks on
a notification, the EMA-D questionnaire appears. A detailed
description can be found in Pryss et al [11]. Finally, note that
users can fill out the EMA-D questionnaire in a user-initiated
manner as well (ie, without getting a notification to fill out a
questionnaire).
Another feature is offered to the TYT users. They can obtain
their results of all answered EMA-D questionnaires through the
apps or the website. For this purpose, two options are provided:
first, they can visualize the results via the website or the mobile
apps; or second, they can download a CSV (comma-separated
values) file, only via the website, for further personal
evaluations.
Participants
The analysis was conducted in March 2020. At this time, the
TYT platform had 4835 registered users. From them, 2584 users
completed the EMA-D questionnaire at least once and, in total,
75,278 EMA-D questionnaires were available. To get an
impression of how TYT is used worldwide, the country
distribution was determined; it shows the number of completed
EMA-D questionnaires (ie, all eight items filled in) from 2065
users from the 12 countries with the most completed EMA-D
questionnaires out of the 2584 users who completed the
questionnaires. This resulted in 67,789 EMA-D questionnaires
from 2065 users. The worldwide distribution is shown in Table
2.
The OS distribution of the 2584 users who completed the
EMA-D questionnaire at least once is as follows: 40.02%
(1034/2584) of the data were provided by iOS users, while
59.98% (1550/2584) were provided by Android users. The OS
distribution of all completed EMA-D questionnaires in TYT is
as follows: 32.00% (24,089/75,278) of the data were provided
by iOS users, while 68.00% (51,189/75,278) were provided by
Android users.
The data preparation steps for the machine learning analysis,
including use of a scikit-learn function [33] to compare the same
number of EMA-D questionnaires from Android and iOS users,
can be seen in Figure 2.
For the final study sample of 297 Android users and 221 iOS
users, Table 3 shows statistical comparisons between the
Android and iOS users in terms of gender, age, and numbers of
completed EMA-D questionnaires (chi-square test and t tests
for independent samples, two-sided). Age was set to missing if
users provided invalid entries.
Finally, Figure 3 shows the histogram for the number of
completed EMA-D questionnaires for the 518 investigated TYT
users (see Figure 2).
J Med Internet Res 2020 | vol. 22 | iss. 6 | e15547 | p. 4http://www.jmir.org/2020/6/e15547/
(page number not for citation purposes)
Pryss et alJOURNAL OF MEDICAL INTERNET RESEARCH
XSL
•
FO
RenderX

Table 2. Country distribution of TrackYourTinnitus (TYT) users (n=2065) in ascending order.
Completed dynamic ecological momentary assessment (EMA-D) questionnaires
(n=67,789), n (%)
CountryNumber
535 (0.79)Australia1
819 (1.21)Belgium2
1026 (1.51)Italy3
1076 (1.59)Russia4
1110 (1.64)Austria5
1159 (1.71)Norway6
2113 (3.12)Canada7
3202 (4.72)Great Britain8
5229 (7.71)Switzerland9
6917 (10.20)Netherlands10
9117 (13.45)United States11
35,486 (52.35)Germany12
J Med Internet Res 2020 | vol. 22 | iss. 6 | e15547 | p. 5http://www.jmir.org/2020/6/e15547/
(page number not for citation purposes)
Pryss et alJOURNAL OF MEDICAL INTERNET RESEARCH
XSL
•
FO
RenderX
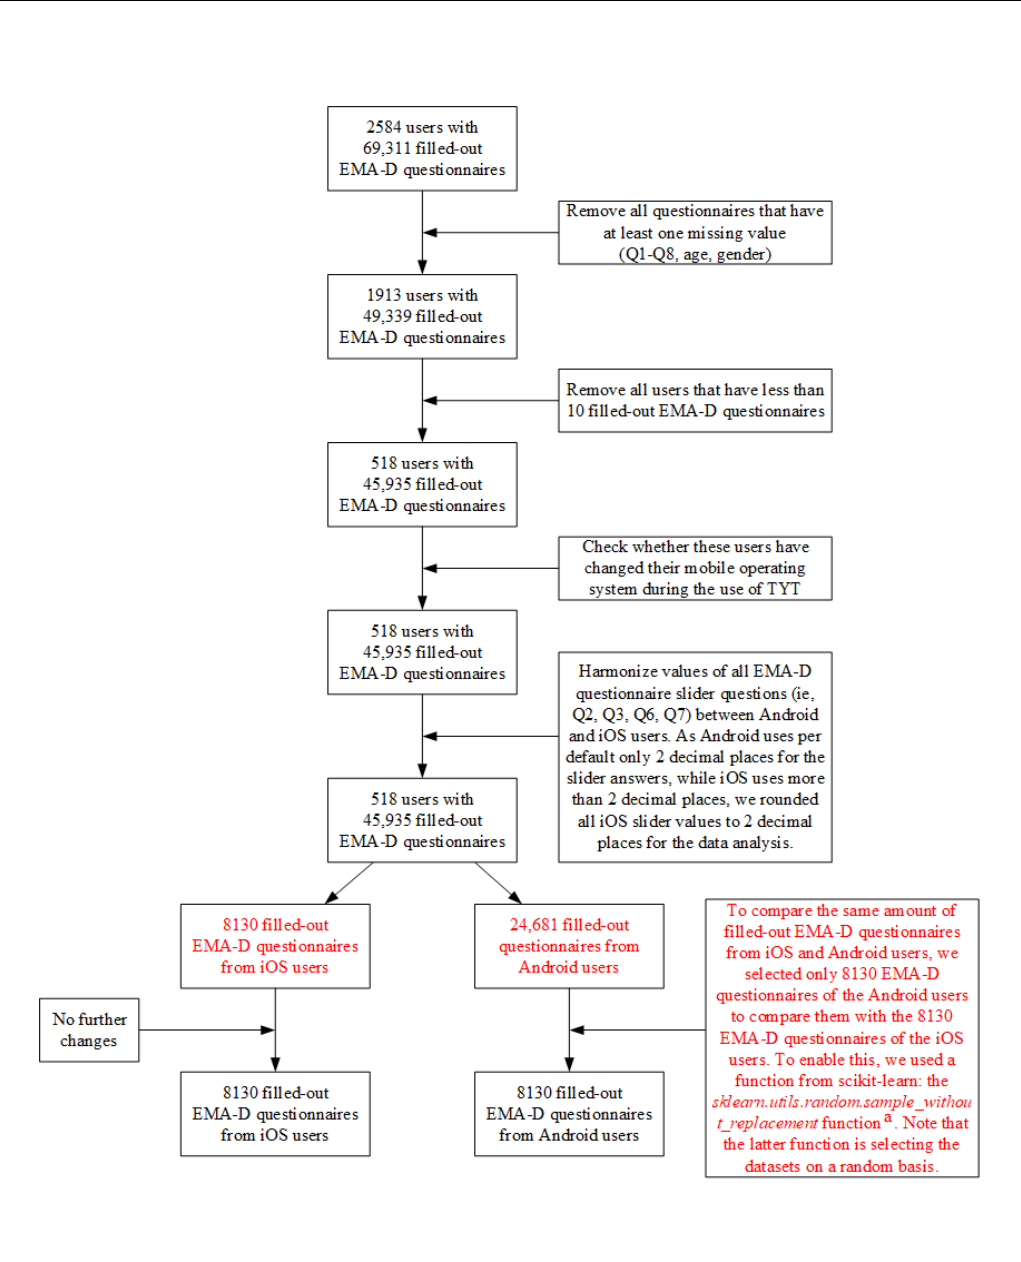
Figure 2. Data preparation steps for the machine learning analysis.
a
Information about the scikit-learn function can be found on the scikit-learn website
[33]. EMA-D: dynamic ecological momentary assessment; Q: question; TYT: TrackYourTinnitus.
J Med Internet Res 2020 | vol. 22 | iss. 6 | e15547 | p. 6http://www.jmir.org/2020/6/e15547/
(page number not for citation purposes)
Pryss et alJOURNAL OF MEDICAL INTERNET RESEARCH
XSL
•
FO
RenderX
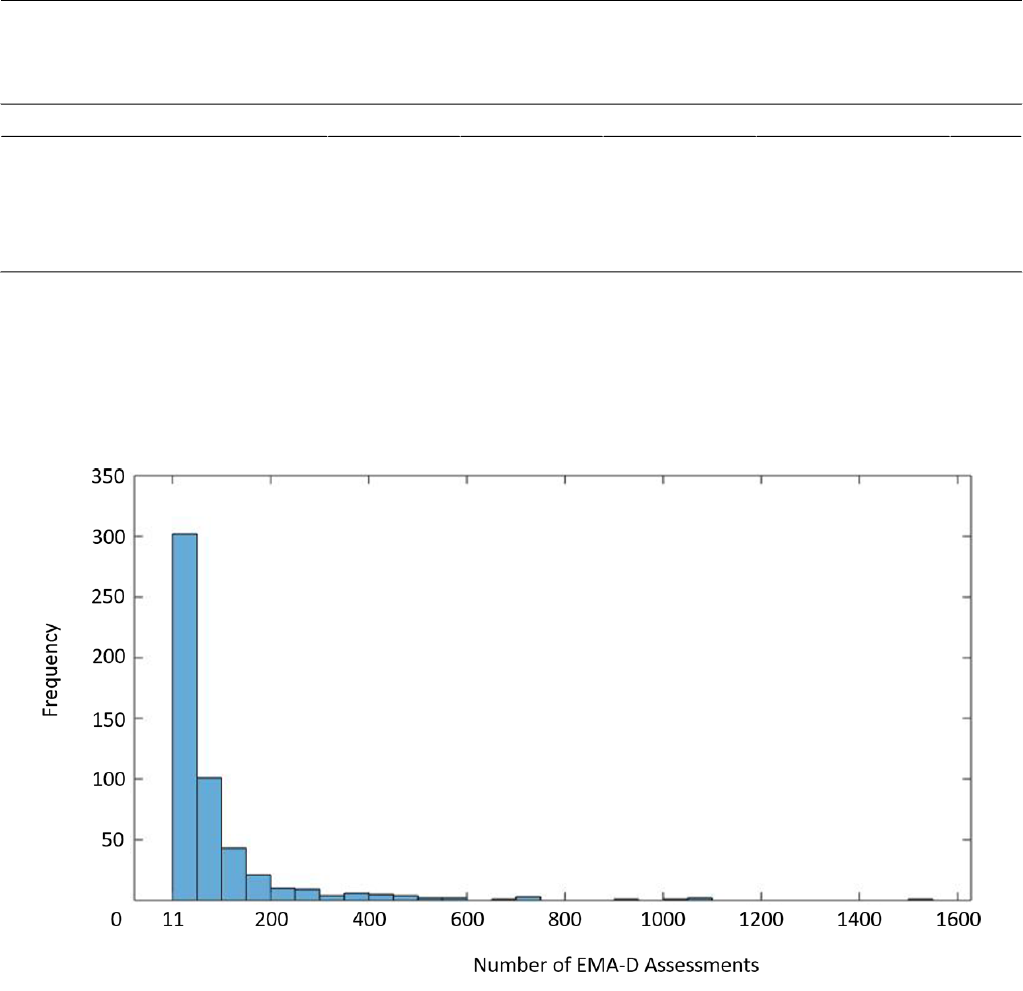
Table 3. Comparisons between iOS and Android users regarding gender, age, and number of completed dynamic ecological momentary assessment
(EMA-D) questionnaires.
P valueTwo-tailed t test (df)Chi-square (df)iOSAndroidVariable
.27
N/A
b
1.2 (1)147 (66.5)221 (74.4)
Gender
a
(male), n (%)
.48–0.71 (497)N/A50.57 (13.09)49.76 (12.29)
Age
c
(years), mean (SD)
.06–1.87 (516)N/A66.55 (125.92)49.52 (80.32)
Number of completed EMA-D questionnaires
d
(ie, all eight questions completed), mean (SD)
a
Sample sizes for gender are n=297 for Android and n=221 for iOS.
b
N/A: not applicable.
c
Sample sizes for age are n=295 for Android and n=204 for iOS.
d
Sample sizes for number of completed EMA-D questionnaires are n=297 for Android and n=221 for iOS.
Figure 3. Frequencies of completed questionnaires of the investigated TrackYourTinnitus (TYT) users (n=518). EMA-D: dynamic ecological momentary
assessment.
Machine Learning Analysis
We applied machine learning approaches with the goal to predict
the OS—Android or iOS—of a provided assessment of the
EMA-D data. For this purpose, four machine learning
approaches were applied to the dataset: a feedforward neural
network (FNN), a decision tree (DT), a support vector machine
(SVM), and a random forest classifier (RFC). All approaches
were chosen because they are appropriate for high-dimensional
datasets, which is the case for the given EMA-D questionnaires
of the TYT users. This is supported by similar works [34,35].
Concerning the dataset in general, it is noteworthy that the
machine learning approaches were applied on the assessment
level of the EMA-D questionnaires. This means that assessments
from one user can be in both the training and the validation
datasets. Performing a separation on assessment level has
advantages and disadvantages. As the main disadvantage, it can
be argued that if a participant is in both datasets, then there
might be a bias. On the other hand, if users of the training phase
are separated from the validation phase users, then it must be
ensured that the user characteristics between the training and
validation phases generate no bias. In an EMA-driven approach,
where daily assessments on a random and voluntary basis are
the main goal, it is difficult to be able to evaluate a large group
of users with similar assessment characteristics. However, in
future work, it will be a further goal to also separate the dataset
on the user level in a reasonable manner. That individual users
play an important role in health care studies is emphasized by
the emerging paradigm of N-of-1 studies [36].
Concerning the validation procedure, the following has been
accomplished: in a first step, the validation was based on a
10-fold cross-validation approach [34,35] (ie, for the SVM, the
DT, and the RFC). Here, the entire dataset was distributed into
10 equal parts. Nine of these parts were used for the training
phase, while the remaining one part was used for the testing
phase. The whole procedure was repeated 10 times and the
average values were then calculated over all 10 runs. To foster
our results, another validation was performed for the SVM, the
J Med Internet Res 2020 | vol. 22 | iss. 6 | e15547 | p. 7http://www.jmir.org/2020/6/e15547/
(page number not for citation purposes)
Pryss et alJOURNAL OF MEDICAL INTERNET RESEARCH
XSL
•
FO
RenderX

DT, and the FNN. We conducted a leave-one-out approach on
the user level, for all of the 518 included users, combined with
a majority vote for the EMA-D questionnaires from the user
that was left out, to see whether the prediction differs if the
EMA-D questionnaires from the user who was left out are
excluded. In conclusion, there was no obvious difference
observed.
For all analyses, the following technical environment was used:
a laptop with an i7 core (2.60 GHz); MATLAB, version R2017a
(MathWorks); the Statistics and Machine Learning Toolbox
(MathWorks); and scikit-learn, open source machine learning
library, for Python (Python Software Foundation). For all
applied methods, we used the default parameters of the technical
environment. In MATLAB, the FNN, the SVM, and the DT
were calculated, while in Python scikit-learn, the RFC was
calculated.
Results
Overview
The four applied machine learning approaches showed different
results for the research question. In general, the prediction
accuracies were unexpectedly high.
Feedforward Neural Network
The FNN was the worst-performing candidate. Here, for 72.67%
of the EMA-D questionnaires, the mobile OS could be correctly
predicted. In the MATLAB toolbox that was used, the essential
parameter for the calculation was feedforwardnet(10).
Decision Tree
The DT, in turn, performed as the third-best candidate. It was
applied with a 10-fold cross-validation and it predicted the
correct mobile OS for 76.36% of the EMA-D questionnaires.
Importantly, the resulting DT has a depth of 379, showing that
the prediction can be categorized into a high-dimensional
calculation. In the MATLAB toolbox that was used, the essential
parameter for the calculation was fitctree(X,Y,'CrossVal','on').
Random Forest Classifier
The RFC performed as the best candidate; the mobile OS could
be predicted correctly for 78.94% of the EMA-D questionnaires.
In the Python scikit-learn method that was used, the essential
parameter for the calculation was as follows:
RandomForestClassifier(n_estimators=100, bootstrap=True,
max_features='sqrt', random_state=42). In addition to the
prediction results, Table 4 shows the importance of the eight
EMA-D questions for the overall prediction result of 78.94%;
here, we used the model.feature_importances_feature of Python
scikit-learn. Importantly, question 7 and then question 2 are the
most important questions for the prediction result of 78.94%.
Table 4. Importance of the eight dynamic ecological momentary assessment (EMA-D) questions for the random forest classifier prediction. Question
1 (Q1): Did you perceive the tinnitus right now? (yes or no); Q2: How loud is the tinnitus right now? (slider); Q3: How stressful is the tinnitus right
now? (slider); Q4: How is your mood right now? (manikins); Q5: How is your arousal right now? (manikins); Q6: Do you feel stressed right now?
(slider); Q7: How much did you concentrate on the things you are doing right now? (slider); and Q8: Do you feel irritable right now? (yes or no).
Q7Q2Q6Q3Q4Q5Q8Q1Question Number
0.211940.192470.174250.172460.09130.087280.039850.03043Percentage of Importance
Support Vector Machine
The SVM performed as the second-best candidate. Overall,
using all eight questions, the mobile OS could be predicted
correctly for 78.65% of the EMA-D questionnaires. For the
SVM, detailed results for single questions and question
combinations are discussed in more detail. This will show that
all eight questions are needed to get a prediction result with an
accuracy that shows that the OS might be a confounder that
should be further considered. The same detailed discussion
could be accomplished for the other approaches, such as the
RFC. We opted for the SVM for a more detailed discussion and
to compare the results to other approaches to see if they deviate
significantly from each other. More specifically, prediction
results for combinations of two questions as well as single
questions are shown in Table 5. Seven results will be further
discussed. The discussion will show that the accuracies vary
among the eight EMA-D questions on one hand. One the other
hand, it will show that despite the observed variances, the overall
achieved accuracy is high for different questions and their
combinations.
First, we consider question 7—How much did you concentrate
on the things you are doing right now? (slider)—and question
8—Do you feel irritable right now? (yes or no). They performed
as the two best single questions for the prediction. Each of them
has an accuracy of 58.80%. This result is only partly confirmed
by the RFC. For the RFC, question 7 is also very important, but
question 8 is less important for the RFC.
Second, question 5—How is your arousal right now?
(manikins)—performed with the third-best result for a single
question; here, an accuracy of 57.14% was attained. This
question is like question 8, in that it is less important in the case
of the RFC.
Third, the combination of question 7—How much did you
concentrate on the things you are doing right now? (slider)—and
question 8—Do you feel irritable right now? (yes or
no)—performed as the best candidate for two-question
combinations; in this case, an accuracy of 63.95% was achieved.
This result is again only partly supported by the RFC (ie, for
the RFC, question 8 was less important; see Table 4).
Fourth, the worst result was achieved when only using question
4—How is your mood right now? (manikins)—as the predictor.
For question 4, an accuracy of 54.07% was achieved. Again,
this deviates from the result of the RFC, where question 1 was
the worst candidate.
J Med Internet Res 2020 | vol. 22 | iss. 6 | e15547 | p. 8http://www.jmir.org/2020/6/e15547/
(page number not for citation purposes)
Pryss et alJOURNAL OF MEDICAL INTERNET RESEARCH
XSL
•
FO
RenderX

Fifth, when solely combining yes or no questions (ie, question
1—Did you perceive the tinnitus right now?—and question
8—Do you feel irritable right now?), the mobile OS could be
predicted correctly for 63.37% of the user assessments. This
result also shows that without slider questions, a meaningful
accuracy can be achieved.
Sixth, when looking at question-question combinations that
include only sliders as answer types, the highest accuracies were
achieved by the combination of question 2—How loud is the
tinnitus right now? (slider)—and question 7—How much did
you concentrate on the things you are doing right now? (slider).
Here, an accuracy of 59.86% was achieved. This, in turn, is
supported by the result of the RFC.
Seventh, it is remarkable that the overall prediction result with
all eight questions is considerably higher than with single
questions or combinations of two questions.
Finally, Table 6 represents the confusion table for the SVM
calculations. Note that the values are for all eight EMA-D
questions of the considered 14,708 Android questionnaires as
well as 14,708 iOS EMA-D questionnaires.
Table 5. Prediction accuracies of the support vector machine (SVM) based on the eight dynamic ecological momentary assessment (EMA-D) questions
and their combinations.
Accuracy for each question (Q) combination, %
Question
a
(Q)
Q8Q7Q6Q5Q4Q3Q2Q1
———————55.69Q1
——————55.9059.18Q2
—————56.6156.8058.53Q3
————54.0758.2857.8956.37Q4
———57.1460.1061.3161.0859.55Q5
——56.2862.8358.6956.3557.2758.59Q6
—58.8059.3362.3860.1959.4059.8661.24Q7
58.8063.9562.6761.5760.1863.5762.3263.37Q8
a
Q1: Did you perceive the tinnitus right now? (yes or no); Q2: How loud is the tinnitus right now? (slider); Q3: How stressful is the tinnitus right now?
(slider); Q4: How is your mood right now? (manikins); Q5: How is your arousal right now? (manikins); Q6: Do you feel stressed right now? (slider);
Q7: How much did you concentrate on the things you are doing right now? (slider); and Q8: Do you feel irritable right now? (yes or no).
Table 6. Confusion table for the support vector machine (SVM) calculations over all eight dynamic ecological momentary assessment (EMA-D)
questions.
Actual classPredicted class
AndroidiOS
True negatives, nFalse positives, nFalse negatives, nTrue positives, n
N/A1967
N/A
a
13,002iOS
12,741N/A1706N/AAndroid
a
N/A: not applicable.
Importance of Questions
In general, the question emerges as to why some of the eight
EMA-D questions are better suited than others to correctly
predict the mobile OS. One possible explanation refers to the
answering behavior of the users of the two mobile OS types.
To illustrate this, Figures 4 and 5 show, as examples, histograms
of question 3—How stressful is the tinnitus right now?
(slider)—and question 5—How is your arousal right now?
(manikins). It is obvious that Android and iOS users answer
differently.
J Med Internet Res 2020 | vol. 22 | iss. 6 | e15547 | p. 9http://www.jmir.org/2020/6/e15547/
(page number not for citation purposes)
Pryss et alJOURNAL OF MEDICAL INTERNET RESEARCH
XSL
•
FO
RenderX
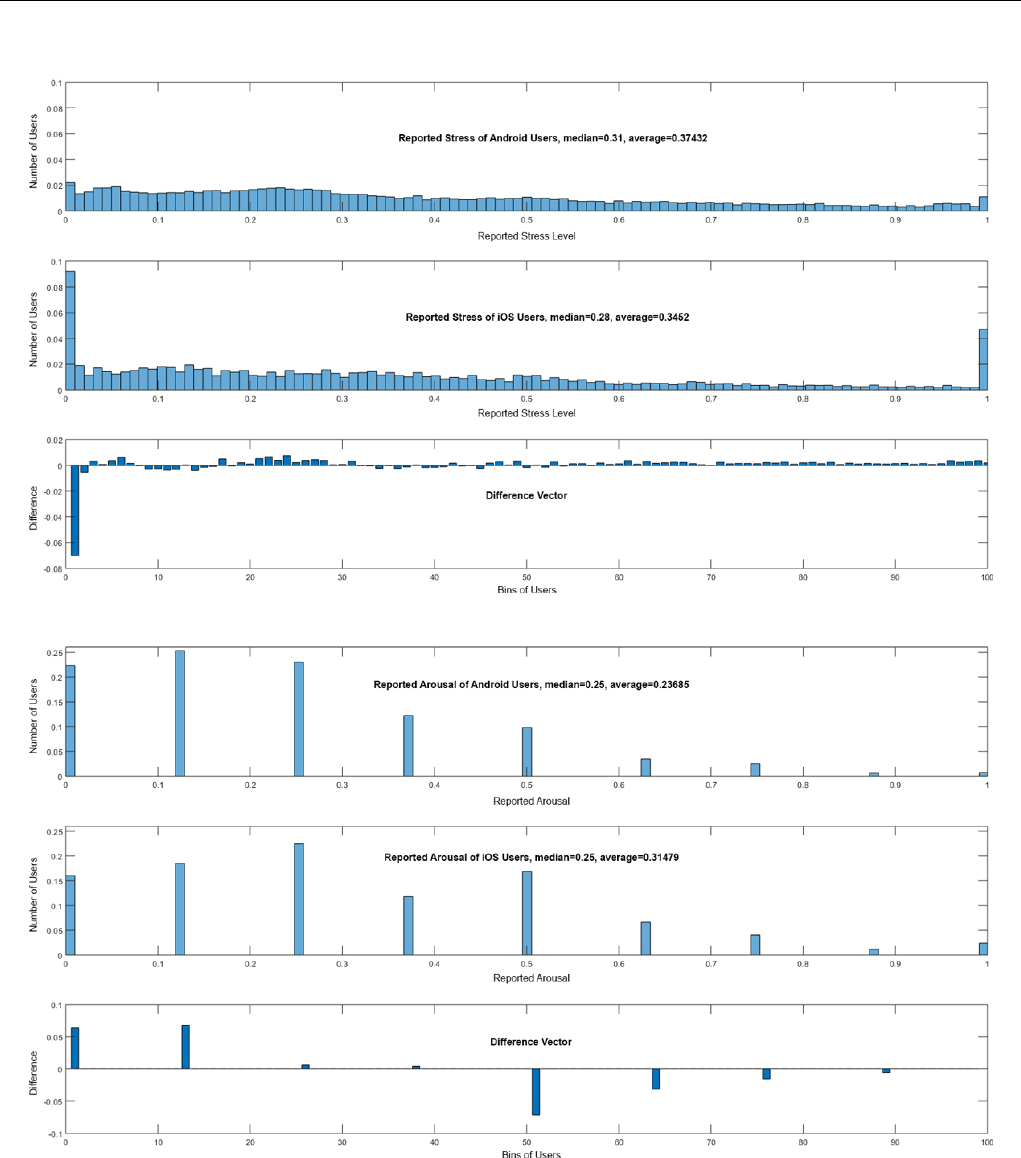
Figure 4. Answers to question 3—How stressful is the tinnitus right now? (slider)—and the difference vector of Android and iOS users.
Figure 5. Answers to question 5 ”How is your arousal right now? (manikins)” and the difference vector of Android and iOS users.
Question 3 and question 5 have been chosen as examples, as
they differ in their importance between the machine learning
approaches: question 3 is the fourth-most important in SVM
versus the third-most important in RFC, while question 5 is the
third-most important in SVM versus the sixth-most important
in RFC. In addition, other questions are more suitable for the
overall prediction. Although they differ and other questions are
better, they still show striking differences between assessments
from Android and iOS users. To support this result, further
consider Figures 6 and 7; they each show data for 100 users in
total, distributed among Android and iOS. The data were
randomly selected out of the entire dataset. This subset was
chosen for the sake of clarity; if all data points were shown, less
could be visually observed. In Figure 6, for question 2—How
loud is the tinnitus right now? (slider)—in combination with
question 3—How stressful is the tinnitus right now?
(slider)—shown on the left-hand side of the figure, or question
6—Do you feel stressed right now? (slider)—shown on the
right-hand side of the figure, the blue dots show the answers
from the Android users, while the red dots show answers from
the iOS users. It is striking that Android and iOS users answer
differently. Furthermore, in Figure 7, for question 4—How is
your mood right now? (manikins)—in combination with
question 3—How stressful is the tinnitus right now?
J Med Internet Res 2020 | vol. 22 | iss. 6 | e15547 | p. 10http://www.jmir.org/2020/6/e15547/
(page number not for citation purposes)
Pryss et alJOURNAL OF MEDICAL INTERNET RESEARCH
XSL
•
FO
RenderX
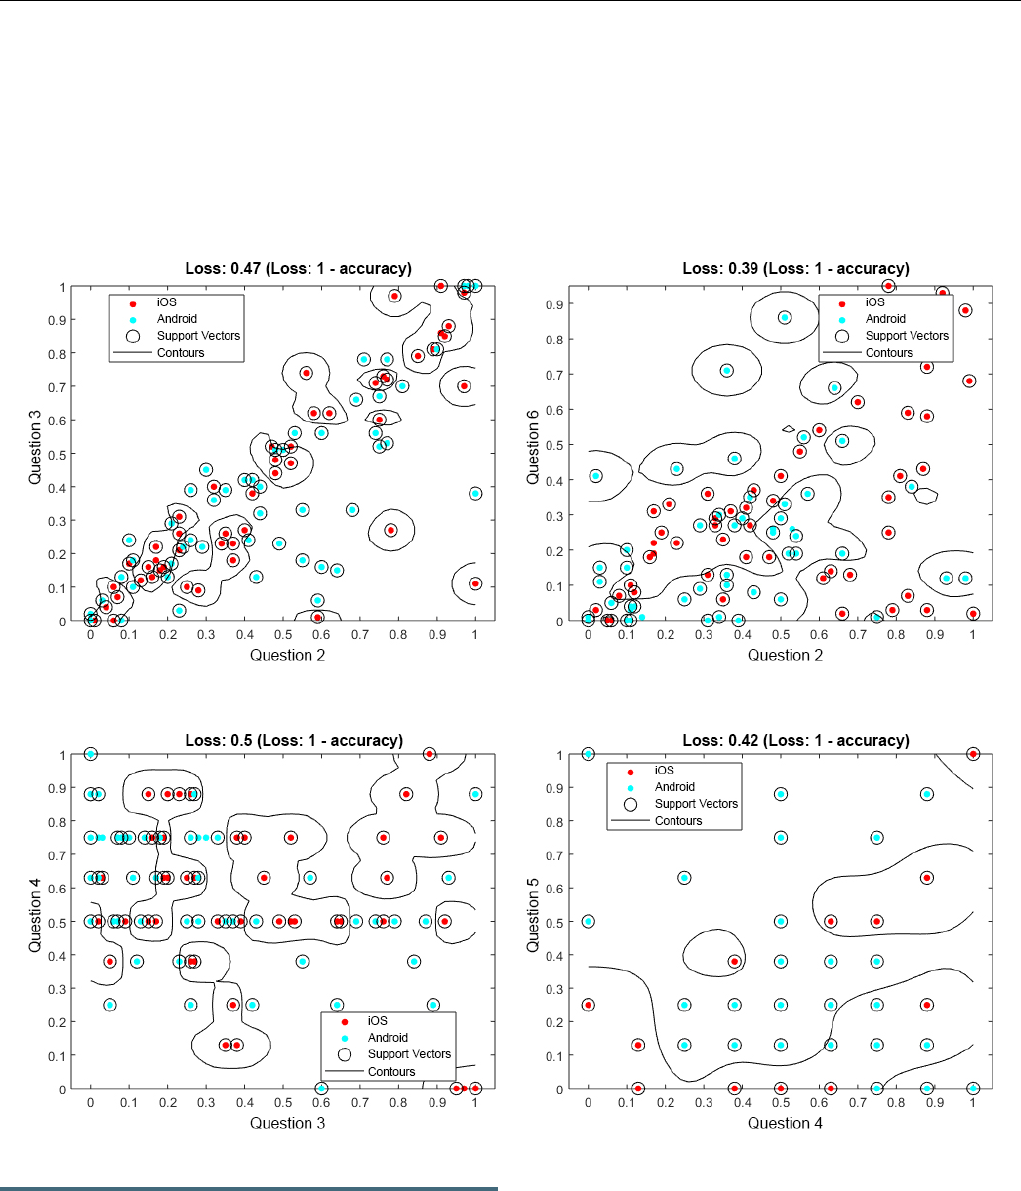
(slider)—shown on the left-hand side of the figure, or question
5—How is your arousal right now? (manikins)—shown on the
right-hand side of the figure, the same can be observed.
Importantly, Figures 6 and 7 are not representative of the entire
dataset, but it is nevertheless notable that Android and iOS users
answer differently. Further note that in Figures 6 and 7, we do
not illustrate the achieved predictions. Instead, the attained loss
is shown (ie, 1-loss denotes the achieved accuracy).
Furthermore, these combinations have been selected as they
also show clear differences between Android and iOS
assessments, although other questions have higher prediction
accuracies.
Figure 6. Support vector machine (SVM) results for question 2 (Q2), combined with question 3 (Q3) and question 6 (Q6), from 100 data entries. Q2:
How loud is the tinnitus right now? (slider); Q3: How stressful is the tinnitus right now? (slider); and Q6: Do you feel stressed right now? (slider).
Figure 7. Support vector machine (SVM) results for question 4 (Q4), combined with question 3 (Q3) and question 5 (Q5), from 100 data entries. Q3:
How stressful is the tinnitus right now? (slider); Q4: How is your mood right now? (manikins); and Q5: How is your arousal right now? (manikins).
Discussion
Principal Findings
This study evaluated whether it is possible to predict the mobile
OS used by respondents for a provided EMA-D questionnaire
based on the eight daily tinnitus questions included in the
questionnaire, which was administered via TYT. Although the
applied machine learning approaches showed different
prediction results, in general, the achieved accuracies indicate
that the mobile OS is a confounder that must be further
considered. This confirms the investigated research question.
We are able to predict the mobile OS used with high accuracy
based on the dynamic daily assessment data. Compared to Pryss
et al [12], the users’ ages were no longer different between
Android and iOS users, which might be explained by the
selection of the sample for this study: only users with more than
10 completed EMA-D questionnaires were selected. In addition
to our prior works [12,14], this study shows that the mobile OS
not only reveals insights into the tinnitus characteristics of the
users, but it is possible to predict the mobile OS based on the
provided daily TYT data. On top of this, widely used machine
learning approaches with commonly used frameworks and
without parameter tuning are able to predict the mobile OS with
high accuracy. Note that the RFC achieved the highest prediction
result of 78.94%, with default parameter settings using Python
scikit-learn. In this context, question 7—How much did you
concentrate on the things you are doing right now? (slider)—of
J Med Internet Res 2020 | vol. 22 | iss. 6 | e15547 | p. 11http://www.jmir.org/2020/6/e15547/
(page number not for citation purposes)
Pryss et alJOURNAL OF MEDICAL INTERNET RESEARCH
XSL
•
FO
RenderX

the EMA-D questionnaire, which measures the concentration
level of a TYT user at the moment, has especially revealed a
high accuracy for the RFC prediction. In summary, four
important results were found. First, the research question can
be answered positively. We are able to predict the mobile OS
used for a given EMA-D questionnaire with high accuracy using
machine learning methods. Second, the prediction is possible
with well-known machine learning methods and frameworks
without parameter tuning. Third, machine learning indicates
promising results on the EMA-D from TYT users. Therefore,
this result should be exploited for further analyses. Fourth, when
using mobile devices to collect clinically relevant data, the
mobile OS used might be a confounder. Therefore, this
information should be collected for each measurement and could
be a relevant covariate in data analyses.
Strengths and Limitations
In general, as a strength of this work, it could be shown that the
technical peculiarities of different mobile OS types must be
considered for the collection of clinically relevant data. As
another positive aspect of this work, it could be shown that the
types of answers for the questions do not necessarily indicate
that a particular answer type, such as a slider, is used a priori
with a bias. Otherwise, sliders or any other answer type would
be more important than others. In general, we aimed at
technically implementing TYT in a way that made sure the
questionnaires looked identical on Android and iOS devices as
well as having no default setting [11,28,29]. Despite this way
of implementing the questionnaires visually, a potential bias
cannot be excluded. Therefore, further investigations are
required. For example, the sliders on Android and iOS have
different numbers of decimal places. On Android, only 2 decimal
places are stored, while on iOS, more than 2 decimal places are
stored. For the investigation in this paper, the scales of all sliders
were harmonized, but such differences must also be further
investigated.
For the aspect of whether EMA-D can be used to predict not
only the TYT assessments but the TYT users in general, we are
conducting another study, in which we investigate whether we
are able to predict the mobile OS used on the user level instead
of on the assessment level. However, such investigation requires
many more considerations. For example, how can we ensure
that the training dataset users have similar characteristics as the
users for which we apply the trained classifier? Note that such
an investigation requires efforts regarding the frameworks used
and their provided features.
Conclusions
This work has shown opportunities on one hand and limitations
on the other. A particular strength of this study is that TYT has
a unique dataset, which is able to comprehensively compare
Android and iOS OS types in a medical context. However, the
different results between different machine learning approaches
showed that it is difficult to predict which questions and answer
types are, in general, appropriate for predictions. If a new
platform shall be realized and one goal of the platform
constitutes using machine learning methods for a prediction,
this analysis has not revealed general guidelines that can be
followed. Thus, these results can only be seen as a particular
outcome for TYT. In addition, when gathering additional
contextual information from the TYT users, such as geospatial
data, new investigations become possible. In a recent work [27],
for example, we investigated geospatial data of mobile
crowdsensing users and whether their movement behavior could
be a predictor for their current stress situation. As this work
also revealed promising results, in the next version of TYT,
GPS data can be gathered while filling out the EMA-D
questionnaire, if a user allows this measurement.
In future work, we will further address the following three
aspects. First, more studies must confirm the results of this
work. Second, the results of TYT must be compared to other
similar EMA datasets in order to confirm the results between
different scenarios. Third, we need to conduct this study again
based on the user level instead of on the assessment level.
However, if future work can confirm the presented results, then
the combination of EMA, mobile crowdsensing, and machine
learning seems to be a worthwhile research endeavor.
Nevertheless, we are far from using the results of this work in
clinical practice. On the other hand, together with
already-revealed medical insights on TYT [6,37-40], the results
of this work show that new opportunities are possible in the
broader EMA and mobile crowdsensing contexts. In particular,
EMA data that were gathered by mobile devices, as well as the
crowdsensing paradigm, seem to be promising targets for the
application of machine learning algorithms.
Acknowledgments
This work was supported by the University of Würzburg within the funding program Open Access Publishing.
Authors' Contributions
RP substantially contributed to the TYT platform, study design, data analysis, and data interpretation and wrote as well as revised
the manuscript. WS substantially contributed to the TYT platform and data interpretation and revised the manuscript. BH
substantially contributed to the TYT platform, study design, data analysis, and data interpretation and drafted as well as revised
the manuscript. MR substantially contributed to the TYT platform and revised the manuscript. MS substantially contributed to
data interpretation and revised the manuscript. BL substantially contributed to data interpretation and revised the manuscript.
MB substantially contributed to the data analysis and data interpretation and revised the manuscript. TP substantially contributed
to the TYT platform, study design, data analysis, and data interpretation and wrote as well as revised the manuscript.
J Med Internet Res 2020 | vol. 22 | iss. 6 | e15547 | p. 12http://www.jmir.org/2020/6/e15547/
(page number not for citation purposes)
Pryss et alJOURNAL OF MEDICAL INTERNET RESEARCH
XSL
•
FO
RenderX

Conflicts of Interest
None declared.
References
1. Kraft R, Schlee W, Stach M, Reichert M, Langguth B, Baumeister H, et al. Combining mobile crowdsensing and ecological
momentary assessments in the healthcare domain. Front Neurosci 2020;14:164 [FREE Full text] [doi:
10.3389/fnins.2020.00164] [Medline: 32184708]
2. Baksa D, Gecse K, Kumar S, Toth Z, Gal Z, Gonda X, et al. Circadian variation of migraine attack onset: A review of
clinical studies. Biomed Res Int 2019;2019:4616417 [FREE Full text] [doi: 10.1155/2019/4616417] [Medline: 31534960]
3. Menictas M, Rabbi M, Klasnja P, Murphy S. Artificial intelligence decision-making in mobile health. Biochem (Lond)
2019;41(5):20. [doi: 10.1042/BIO04105020]
4. Statcounter Global Stats. Mobile operating system market share worldwide: May 2019 - May 2020 URL: https://gs.
statcounter.com/os-market-share/mobile/worldwide [accessed 2020-06-03]
5. Langguth B. A review of tinnitus symptoms beyond 'ringing in the ears': A call to action. Curr Med Res Opin 2011
Aug;27(8):1635-1643. [doi: 10.1185/03007995.2011.595781] [Medline: 21699365]
6. Schlee W, Pryss RC, Probst T, Schobel J, Bachmeier A, Reichert M, et al. Measuring the moment-to-moment variability
of tinnitus: The TrackYourTinnitus smart phone app. Front Aging Neurosci 2016;8:294 [FREE Full text] [doi:
10.3389/fnagi.2016.00294] [Medline: 28018210]
7. Trull TJ, Ebner-Priemer U. Ambulatory assessment. Annu Rev Clin Psychol 2013;9:151-176 [FREE Full text] [doi:
10.1146/annurev-clinpsy-050212-185510] [Medline: 23157450]
8. Guo B, Wang Z, Yu Z, Wang Y, Yen N, Huang R, et al. Mobile crowd sensing and computing: The review of an emerging
human-powered sensing paradigm. ACM Comput Surv 2015 Sep 29;48(1):1-31. [doi: 10.1145/2794400]
9. Estellés-Arolas E, González-Ladrón-de-Guevara F. Towards an integrated crowdsourcing definition. J Inf Sci 2012 Mar
09;38(2):189-200. [doi: 10.1177/0165551512437638]
10. Pryss R. Mobile crowdsensing in healthcare scenarios: Taxonomy, conceptual pillars, smart mobile crowdsensing services.
In: Baumeister H, Montag C, editors. Digital Phenotyping and Mobile Sensing: New Developments in Psychoinformatics.
Cham, Switzerland: Springer International Publishing; Nov 01, 2019:221-234.
11. Pryss R, Probst T, Schlee W, Schobel J, Langguth B, Neff P, et al. Prospective crowdsensing versus retrospective ratings
of tinnitus variability and tinnitus–stress associations based on the TrackYourTinnitus mobile platform. Int J Data Sci Anal
2018 Mar 12;8(4):327-338. [doi: 10.1007/s41060-018-0111-4]
12. Pryss R, Reichert M, Schlee W, Spiliopoulou M, Langguth B, Probst T. Differences between Android and iOS users of the
TrackYourTinnitus mobile crowdsensing mHealth platform. In: Proceedings of the 31st International Symposium on
Computer-Based Medical Systems. New York, NY: IEEE; 2018 Jul 23 Presented at: 31st International Symposium on
Computer-Based Medical Systems; June 18-21, 2018; Karlstad, Sweden p. 411-416 URL: https://ieeexplore.ieee.org/
abstract/document/8417273/authors#authors [doi: 10.1109/CBMS.2018.00078]
13. Ubhi HK, Kotz D, Michie S, van Schayck OCP, West R. A comparison of the characteristics of iOS and Android users of
a smoking cessation app. Transl Behav Med 2017 Jun;7(2):166-171 [FREE Full text] [doi: 10.1007/s13142-016-0455-z]
[Medline: 28168609]
14. Pryss R, Schlee W, Reichert M, Kurthen I, Giroud N, Jagoda L, et al. Ecological momentary assessment-based differences
between Android and iOS users of the TrackYourHearing mHealth crowdsensing platform. In: Proceedings of the Annual
International Conference of the IEEE Engineering in Medicine and Biology Society. New York, NY: IEEE; 2019 Oct 07
Presented at: Proceedings Annual International Conference of the IEEE Engineering in Medicine and Biology Society;
July 23-27, 2019; Berlin, Germany p. 3951-3955 URL: https://ieeexplore.ieee.org/abstract/document/8857854 [doi:
10.1109/embc.2019.8857854]
15. Mohr DC, Zhang M, Schueller SM. Personal sensing: Understanding mental health using ubiquitous sensors and machine
learning. Annu Rev Clin Psychol 2017 May 08;13:23-47 [FREE Full text] [doi: 10.1146/annurev-clinpsy-032816-044949]
[Medline: 28375728]
16. Boyer EW, Smelson D, Fletcher R, Ziedonis D, Picard RW. Wireless technologies, ubiquitous computing and mobile
health: Application to drug abuse treatment and compliance with HIV therapies. J Med Toxicol 2010 Jun;6(2):212-216
[FREE Full text] [doi: 10.1007/s13181-010-0080-z] [Medline: 20623215]
17. Colombo D, Palacios AG, Alvarez JF, Patané A, Semonella M, Cipresso P, et al. Current state and future directions of
technology-based ecological momentary assessments and interventions for major depressive disorder: Protocol for a
systematic review. Syst Rev 2018 Dec 13;7(1):233 [FREE Full text] [doi: 10.1186/s13643-018-0899-y] [Medline: 30545415]
18. Torous J, Larsen ME, Depp C, Cosco TD, Barnett I, Nock MK, et al. Smartphones, sensors, and machine learning to advance
real-time prediction and interventions for suicide prevention: A review of current progress and next steps. Curr Psychiatry
Rep 2018 Jun 28;20(7):51. [doi: 10.1007/s11920-018-0914-y] [Medline: 29956120]
19. Dwyer DB, Falkai P, Koutsouleris N. Machine learning approaches for clinical psychology and psychiatry. Annu Rev Clin
Psychol 2018 May 07;14:91-118. [doi: 10.1146/annurev-clinpsy-032816-045037] [Medline: 29401044]
J Med Internet Res 2020 | vol. 22 | iss. 6 | e15547 | p. 13http://www.jmir.org/2020/6/e15547/
(page number not for citation purposes)
Pryss et alJOURNAL OF MEDICAL INTERNET RESEARCH
XSL
•
FO
RenderX

20. Boonstra TW, Nicholas J, Wong QJ, Shaw F, Townsend S, Christensen H. Using mobile phone sensor technology for
mental health research: Integrated analysis to identify hidden challenges and potential solutions. J Med Internet Res 2018
Jul 30;20(7):e10131 [FREE Full text] [doi: 10.2196/10131] [Medline: 30061092]
21. Jake-Schoffman DE, Silfee VJ, Waring ME, Boudreaux ED, Sadasivam RS, Mullen SP, et al. Methods for evaluating the
content, usability, and efficacy of commercial mobile health apps. JMIR Mhealth Uhealth 2017 Dec 18;5(12):e190 [FREE
Full text] [doi: 10.2196/mhealth.8758] [Medline: 29254914]
22. Torous J, Andersson G, Bertagnoli A, Christensen H, Cuijpers P, Firth J, et al. Towards a consensus around standards for
smartphone apps and digital mental health. World Psychiatry 2019 Feb;18(1):97-98 [FREE Full text] [doi:
10.1002/wps.20592] [Medline: 30600619]
23. Delgadillo J. ISRCTN Registry. 2018. StratCare trial: Pragmatic randomised controlled trial of a stratified care model for
depression and anxiety URL: http://www.isrctn.com/ISRCTN11106183 [accessed 2020-06-03]
24. Boukhechba M, Cai L, Chow P, Fua K, Gerber M, Teachman B, et al. Contextual analysis to understand compliance with
smartphone-based ecological momentary assessment. In: Proceedings of the 12th EAI International Conference on Pervasive
Computing Technologies for Healthcare. New York, NY: Association for Computing Machinery (ACM); 2018 Presented
at: 12th EAI International Conference on Pervasive Computing Technologies for Healthcare; May 21-24, 2018; New York,
NY p. 232-238 URL: https://dl.acm.org/doi/10.1145/3240925.3240967 [doi: 10.1145/3240925.3240967]
25. Muniandi LP, Schlee W, Pryss R, Reichert M, Schobel J, Kraft R, et al. Finding tinnitus patients with similar evolution of
their ecological momentary assessments. In: Proceedings of the 31st International Symposium on Computer-Based Medical
Systems. New York, NY: IEEE; 2018 Presented at: 31st International Symposium on Computer-Based Medical Systems;
June 18-21, 2018; Karlstad, Sweden p. 112-117 URL: https://ieeexplore.ieee.org/document/8417222 [doi:
10.1109/cbms.2018.00027]
26. Unnikrishnan V, Beyer C, Matuszyk P, Niemann U, Pryss R, Schlee W, et al. Entity-level stream classification: Exploiting
entity similarity to label the future observations referring to an entity. Int J Data Sci Anal 2019 Feb 22;9(1):1-15. [doi:
10.1007/s41060-019-00177-1]
27. Pryss R, John D, Reichert M, Hoppenstedt B, Schmid L, Schlee W, et al. Machine learning findings on geospatial data of
users from the TrackYourStress mHealth crowdsensing platform. In: Proceedings of the 20th International Conference on
Information Reuse and Integration for Data Science. New York, NY: IEEE; 2019 Presented at: 20th International Conference
on Information Reuse and Integration for Data Science; July 30-August 1, 2019; Los Angeles, CA p. 350-355 URL: https:/
/ieeexplore.ieee.org/abstract/document/8843454 [doi: 10.1109/iri.2019.00061]
28. Pryss R, Reichert M, Langguth B, Schlee W. Mobile crowd sensing services for tinnitus assessment, therapy, and research.
In: Proceedings of the 3rd International Conference on Mobile Services. New York, NY: IEEE; 2015 Presented at: 3rd
International Conference on Mobile Services; June 27-July 2, 2015; New York, NY p. 352-359 URL: https://ieeexplore.
ieee.org/abstract/document/7226711 [doi: 10.1109/mobserv.2015.55]
29. Pryss R, Schlee W, Langguth B, Reichert M. Mobile crowdsensing services for tinnitus assessment and patient feedback.
In: Proceedings of the International Conference on AI & Mobile Services (AIMS). New York, NY: IEEE; 2017 Presented
at: International Conference on AI & Mobile Services (AIMS); June 25-30, 2017; Honolulu, HI p. 22-29 URL: https:/
/ieeexplore.ieee.org/abstract/document/8027265 [doi: 10.1109/aims.2017.12]
30. Xiong H, Huang Y, Barnes L, Gerber M. Sensus: A cross-platform, general-purpose system for mobile crowdsensing in
human-subject studies. In: Proceedings of the 2016 ACM International Joint Conference on Pervasive and Ubiquitous
Computing. New York, NY: Association for Computing Machinery (ACM); 2016 Presented at: 2016 ACM International
Joint Conference on Pervasive and Ubiquitous Computing; September 12-16, 2016; Heidelberg, Germany p. 415-426 URL:
https://dl.acm.org/doi/10.1145/2971648.2971711 [doi: 10.1145/2971648.2971711]
31. Chow P, Bonelli W, Huang Y, Fua K, Teachman BA, Barnes LE. DEMONS: An integrated framework for examining
associations between physiology and self-reported affect tied to depressive symptoms. In: Proceedings of the 2016 ACM
International Joint Conference on Pervasive and Ubiquitous Computing: Adjunct. New York, NY: Association for Computing
Machinery (ACM); 2016 Presented at: 2016 ACM International Joint Conference on Pervasive and Ubiquitous Computing:
Adjunct; September 12-16, 2016; Heidelberg, Germany p. 1139-1143 URL: https://dl.acm.org/doi/10.1145/2968219.2968300
[doi: 10.1145/2968219.2968300]
32. Beierle F, Tran VT, Allemand M, Neff P, Schlee W, Probst T, et al. What data are smartphone users willing to share with
researchers? J Ambient Intell Humaniz Comput 2019 Jun 20;11(6):2277-2289. [doi: 10.1007/s12652-019-01355-6]
33. scikit-learn. sklearn.utils.random.sample_without_replacement URL: https://scikit-learn.org/stable/modules/generated/
sklearn.utils.random.sample_without_replacement.html [accessed 2020-06-08]
34. Santhanam T, Padmavathi M. Application of k-means and genetic algorithms for dimension reduction by integrating SVM
for diabetes diagnosis. Procedia Comput Sci 2015;47:76-83. [doi: 10.1016/j.procs.2015.03.185]
35. Burns MN, Begale M, Duffecy J, Gergle D, Karr CJ, Giangrande E, et al. Harnessing context sensing to develop a mobile
intervention for depression. J Med Internet Res 2011 Aug 12;13(3):e55 [FREE Full text] [doi: 10.2196/jmir.1838] [Medline:
21840837]
J Med Internet Res 2020 | vol. 22 | iss. 6 | e15547 | p. 14http://www.jmir.org/2020/6/e15547/
(page number not for citation purposes)
Pryss et alJOURNAL OF MEDICAL INTERNET RESEARCH
XSL
•
FO
RenderX

36. Percha B, Baskerville EB, Johnson M, Dudley JT, Zimmerman N. Designing robust N-of-1 studies for precision medicine:
Simulation study and design recommendations. J Med Internet Res 2019 Apr 01;21(4):e12641 [FREE Full text] [doi:
10.2196/12641] [Medline: 30932871]
37. Probst T, Pryss R, Langguth B, Schlee W. Emotional states as mediators between tinnitus loudness and tinnitus distress in
daily life: Results from the "TrackYourTinnitus" application. Sci Rep 2016 Feb 08;6:20382 [FREE Full text] [doi:
10.1038/srep20382] [Medline: 26853815]
38. Schlee W, Kraft R, Schobel J, Langguth B, Probst T, Neff P, et al. Momentary assessment of tinnitus—How smart mobile
applications advance our understanding of tinnitus. In: Baumeister H, Montag C, editors. Digital Phenotyping and Mobile
Sensing: New Developments in Psychoinformatics. Cham, Switzerland: Springer International Publishing; Nov 01,
2019:209-220.
39. Probst T, Pryss R, Langguth B, Schlee W. Emotion dynamics and tinnitus: Daily life data from the "TrackYourTinnitus"
application. Sci Rep 2016 Aug 04;6:31166 [FREE Full text] [doi: 10.1038/srep31166] [Medline: 27488227]
40. Probst T, Pryss RC, Langguth B, Rauschecker JP, Schobel J, Reichert M, et al. Does tinnitus depend on time-of-day? An
ecological momentary assessment study with the "TrackYourTinnitus" application. Front Aging Neurosci 2017;9:253
[FREE Full text] [doi: 10.3389/fnagi.2017.00253] [Medline: 28824415]
Abbreviations
CSV: comma-separated values
DT: decision tree
EMA: ecological momentary assessment
EMA-D: dynamic ecological momentary assessment
EMA-S: static ecological momentary assessment
FNN: feedforward neural network
mHealth: mobile health
OS: operating system
RFC: random forest classifier
SF28: SmokeFree28
SVM: support vector machine
TYH: TrackYourHearing
TYT: TrackYourTinnitus
Edited by G Eysenbach; submitted 18.07.19; peer-reviewed by A González, EM Messner, M Zolnoori; comments to author 21.10.19;
revised version received 23.12.19; accepted 29.02.20; published 30.06.20
Please cite as:
Pryss R, Schlee W, Hoppenstedt B, Reichert M, Spiliopoulou M, Langguth B, Breitmayer M, Probst T
Applying Machine Learning to Daily-Life Data From the TrackYourTinnitus Mobile Health Crowdsensing Platform to Predict the
Mobile Operating System Used With High Accuracy: Longitudinal Observational Study
J Med Internet Res 2020;22(6):e15547
URL: http://www.jmir.org/2020/6/e15547/
doi: 10.2196/15547
PMID: 32602842
©Rüdiger Pryss, Winfried Schlee, Burkhard Hoppenstedt, Manfred Reichert, Myra Spiliopoulou, Berthold Langguth, Marius
Breitmayer, Thomas Probst. Originally published in the Journal of Medical Internet Research (http://www.jmir.org), 30.06.2020.
This is an open-access article distributed under the terms of the Creative Commons Attribution License
(https://creativecommons.org/licenses/by/4.0/), which permits unrestricted use, distribution, and reproduction in any medium,
provided the original work, first published in the Journal of Medical Internet Research, is properly cited. The complete bibliographic
information, a link to the original publication on http://www.jmir.org/, as well as this copyright and license information must be
included.
J Med Internet Res 2020 | vol. 22 | iss. 6 | e15547 | p. 15http://www.jmir.org/2020/6/e15547/
(page number not for citation purposes)
Pryss et alJOURNAL OF MEDICAL INTERNET RESEARCH
XSL
•
FO
RenderX
