2020-2021
NJDEP Community Water Monitoring Program Road Salt Monitoring Snapshot Tier 1 SOP
1
Road Salt Monitoring
Snapshot
Standard Operating
Procedure
Effective Date: 12/01/2021
The NJ Watershed Watch Network is a Program of
The Watershed Institute
and
NJ Dept.
of Environmental Protection. Community-based Water Monitoring promotes a sense of
stewardship and provides the community with the opportunity to become actively
involved in the health of their local waterbodies.
Visit us on the web for more info
https://www.state.nj.us/dep/wms/bears/comm_water_monitoring.htm
and
https://njwatershedwatch.org/road-salt/
Community Water Monitoring Tier 1

2020-2021
NJDEP Community Water Monitoring Program Road Salt Monitoring Snapshot Tier 1 SOP
2
1. Project Name
Road Salt Monitoring Snapshot
2. Project Coordination
NJ Watershed Watch Network: Erin Stretz
The Watershed Institute
31 Titus Mill Road, Pennington, NJ 08534
609-737-3735
thewatershed.org
njwatershedwatch.org
NJDEP Community Water Monitoring: Deborah Kratzer
Bureau of Environmental Analysis, Restoration, & Standards
NJDEP Division of Water & Monitoring and Standards
PO Box 420 (Mail Code 401-04I)
401 East State Street
Trenton, New Jersey 08625-0420
609-633-1441
3. Project Description
3.1 Background
The practice of using sodium chloride for de-icing roads began about 1941 in New Hampshire. The
improved winter driving safety led to a nationwide increasing trend in road salt use. However, the use of
road de-icers is leading to freshwater salinization, which negatively affects aquatic species at all trophic
levels from biofilms to fish (Fay and Shi, 2012; Hintz and Relyea, 2019). In addition, the increased
corrosivity can leach metals from soils and drinking water pipes which can impact human health
(Kaushal et al., 2018). Water quality assessments by NJDEP, USGS and other researchers have observed
exceedances of surface water quality standards for total dissolved solids (TDS) and chloride in winter
following use of road de-icers (NJDEP, September 2019; Moore et al., 2019). In addition to these high
levels immediately following winter storms, year-round median TDS and chlorides concentrations are
trending upwards, indicating that salt is building up in the soils and not returning to background levels
before the next winter season (NJDEP, September 2019; Moore et al., 2019).
While there is no surface water quality standard for conductivity or salinity, there are standards for TDS
and chloride by which we can indicate stream impairment (NJDEP, April 2020).
3.2 Purpose
The objective of this project is to use the NJ Watershed Watch Network to create a snapshot of winter
chloride levels in New Jersey’s freshwater streams as an indicator of road salt impacts. Data from this
project is suitable for educational purposes and is not sufficiently accurate for regulatory purposes.
3.3 Schedule
Field measurements will be collected between December 1, 2020 and April 30, 2021.

2020-2021
NJDEP Community Water Monitoring Program Road Salt Monitoring Snapshot Tier 1 SOP
3
Dry weather (no winter runoff) measurements will be taken when there has been at least 72 hours
without snow, snowmelt, or de-icing application and preferably 72 hours after any significant rain. At
least two, and preferably three, dry measurements should be collected at least one week apart during
the project period.
Wet weather (winter runoff) measurements will be taken as soon as practical and safe after a winter
weather event that involves road salt application, when snow/ice is melting. This should be within 48
hours of the start of a winter weather event.
3.4 Sampling Network and Design
Monitoring sites will be located on freshwater streams in New Jersey. Community partners will select
sites that are of most importance to their organization and that are accessible in winter. Sites will be
distributed across Watershed Management Areas and regions and at sites with varying degrees of urban
development.
3.5 Safety Considerations
• NJDEP is not liable for any event that occurs during monitoring.
• Participants should not monitor alone for safety reasons.
• Visibility: Reflective “safety” vests should be worn when working on bridges or near traffic.
• Slip/fall hazards: On land and in streams, be aware of branches, logs, rocks, and slippery
surfaces. Do not sample DURING a winter weather event.
• Wear disposable gloves when sampling.
• Samples should be collected without entering the water during cold weather.
4. Data Quality
Each batch of test strips is calibrated by the manufacturer and values are accurate within 10% (2% of the
scale of 10 on the titrator) or less (Hach, 4/16/2020). Additional information about the method is
provided in the appendix.
To ensure quality, test strips must be stored in an airtight container before use. Each strip is used once.
Use the data conversion card that comes with the test strips to determine the chloride value that
corresponds to the white mark on the test strip. The conversion card are specific to each batch of test
strips.
5. Sampling Procedures
Chloride Test Procedures with Hach Chloride Test Strip
1. Find a clean small glass or plastic cup.
2. Using water from the stream, rinse out your cup 3 times.
3. Fill the cup with about an inch of stream water. (The test will not work
if the top half of the test strip is submerged.)
4. Place the chloride test strip into the cup with the “quantab” label at the top.
5. Leave the strip sitting in the cup until the horizontal orange line at the top turns a dark
blue or black (up to 10 minutes).
2020-2021
NJDEP Community Water Monitoring Program Road Salt Monitoring Snapshot Tier 1 SOP
4
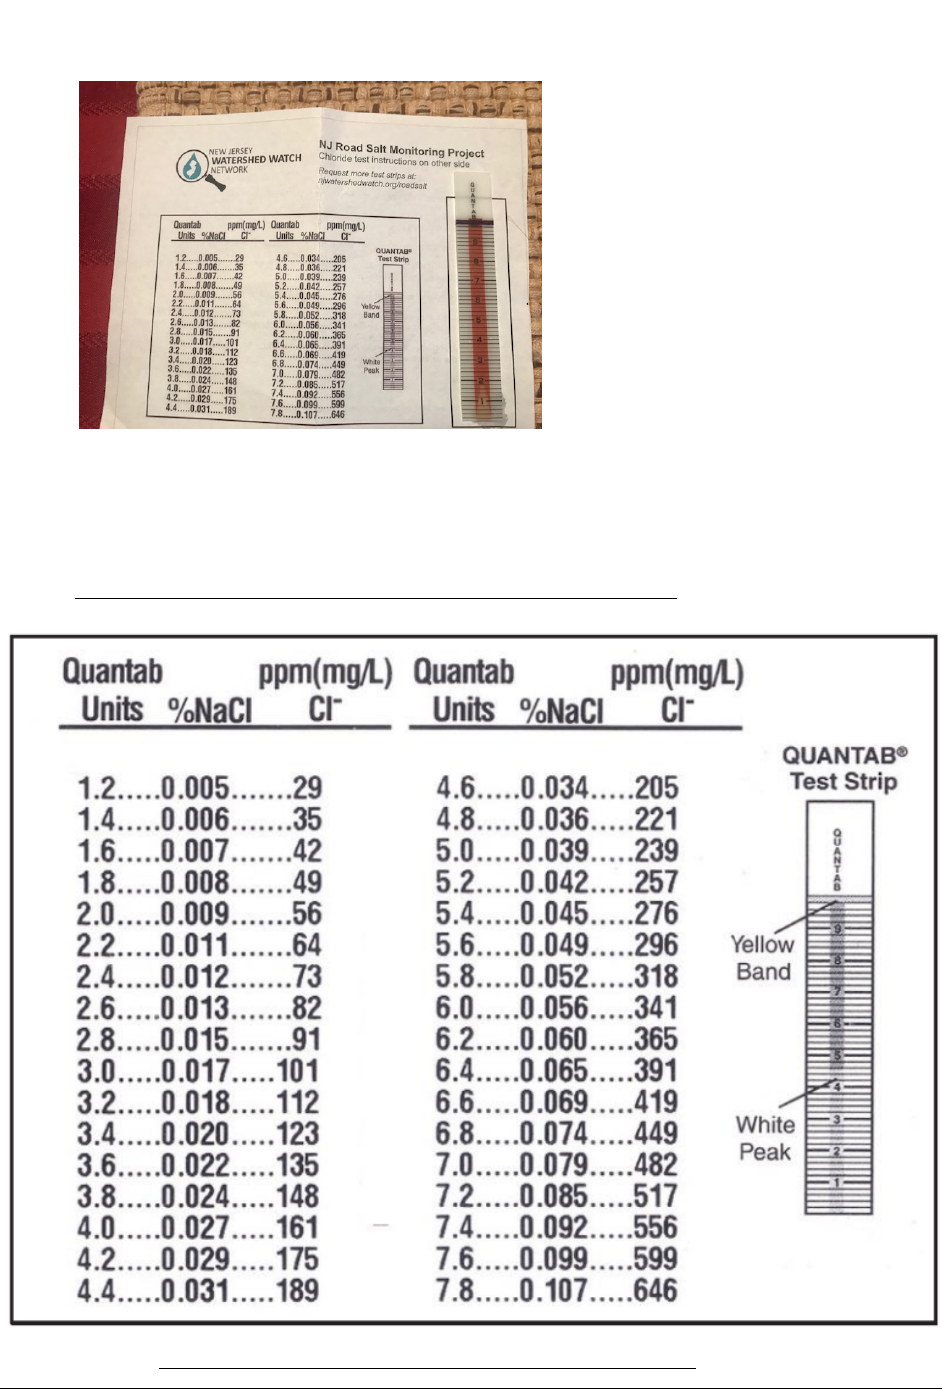
6. Take a picture of your test strip on a white background. Include the conversion card in the
photo. Example:
7. To read the test strip, locate where the tip of the white peak falls on the scale.
You can convert these units to parts per million (ppm) with the conversion table provided with
each batch of test strips. An example conversion table is shown below.
8. Upload your picture and data to the NJ Watershed Watch Network.
Thank you to the Izaak Walton League of America Winter Salt Watch Program for sharing their methods!
2020-2021
NJDEP Community Water Monitoring Program Road Salt Monitoring Snapshot Tier 1 SOP
5
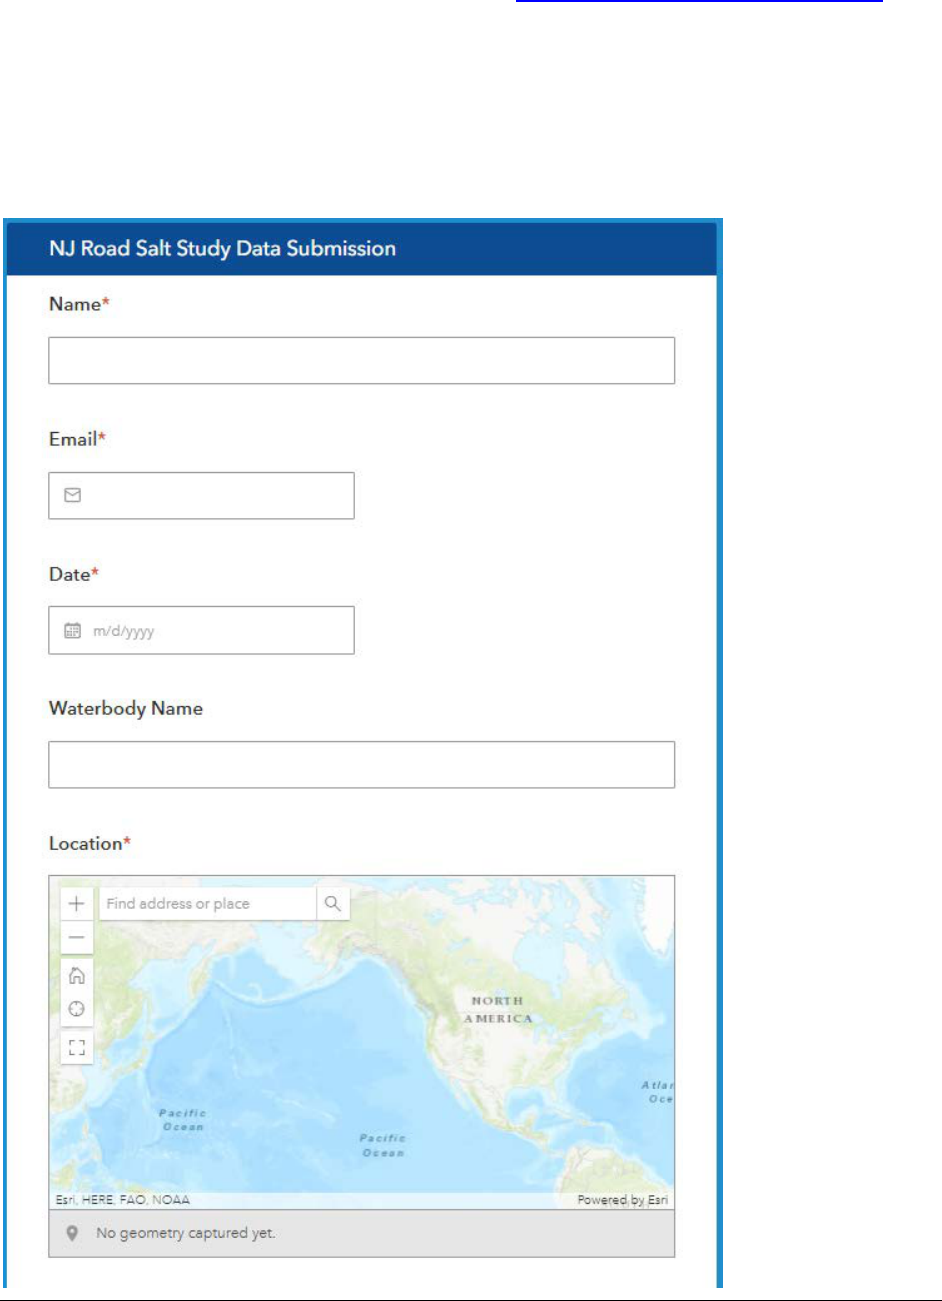
6. Data Reporting
Participants will report their data using an online form at https://njwatershedwatch.org/road-salt/. Each
site visit should be reported separately. For example, if two sites are visited on the same day, fill out two
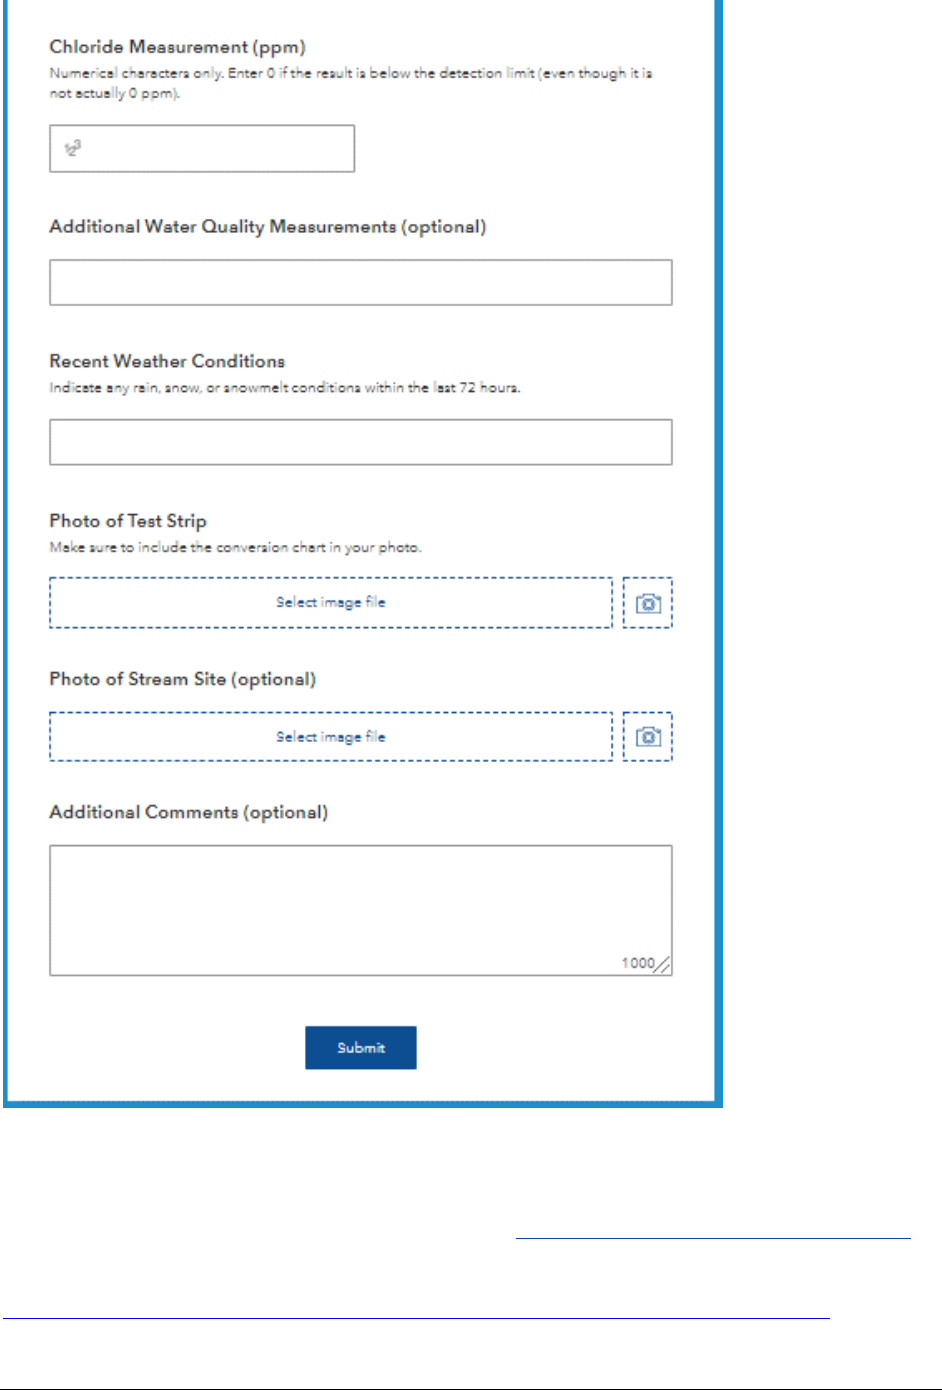
Data Submission forms. A screenshot is copied below for reference.
Make sure the photo of the test strip also includes the conversion card, which is specific to each batch of
test strips.
You may use the comments section to describe weather or site conditions. For example, you might
enter, “2 inches of snow fell on previous day and snow is melting.”
2020-2021
NJDEP Community Water Monitoring Program Road Salt Monitoring Snapshot Tier 1 SOP
6
7. References
Fay, Laura and Xianming Shi. Environmental Impacts of Chemicals for Snow and Ice Control: State of the
Knowledge. Water Air Soil Pollut (2012) 223:2751–2770. https://doi.org/10.1007/s11270-011-1064-6
Hach. 4/16/2020. What is the accuracy of the Quantab® Chloride titration test strips?
https://support.hach.com/app/answers/answer_view/a_id/1028012/loc/en_US#__highlight

2020-2021
NJDEP Community Water Monitoring Program Road Salt Monitoring Snapshot Tier 1 SOP
7
Hach. 8/23/2018. How are the Chloride QuanTab® test strips calibrated?
https://support.hach.com/app/answers/answer_view/a_id/1008032/loc/en_US#__highlight
Hach. 1/18/2018. Is it possible to interpret Quantab Chloride test strip results that exceed the Quantab
Unit on the bottle label?
https://support.hach.com/app/answers/answer_view/a_id/1020916/loc/en_US#__highlight
Hintz, William D. and Rick A. Relyea. A review of the species, community, and ecosystem impacts of road
salt salinisation in fresh waters. Freshwater Biology. 2019;64:1081–1097. DOI: 10.1111/fwb.13286
Kaushal, Sujay S., Gene E. Likens, Michael L. Pace, Ryan M. Utz, Shahan Haq, Julia Gorman, and Melissa
Grese. Freshwater salinization syndrome on a continental scale. Proceedings of the National Academy of
Sciences Jan 2018, 115 (4) E574-E583; DOI: 10.1073/pnas.1711234115
www.pnas.org/cgi/doi/10.1073/pnas.1711234115
Moore, Joel, Rosemary M. Fanelli and Andrew J. Sekellick. High-Frequency Data Reveal Deicing Salts
Drive Elevated Specific Conductance and Chloride along with Pervasive and Frequent Exceedances of the
U.S. Environmental Protection Agency Aquatic Life Criteria for Chloride in Urban Streams. Environ. Sci.
Technol. 2019, XXXX, XXX, XXX-XXX. https://doi.org/10.1021/acs.est.9b04316
NJDEP. April 2020. N.J.A.C. 7:9B Surface Water Quality Standards. Last Amended – April 6, 2020 (52
N.J.R.711(a)). Courtesy copy available online at: https://www.nj.gov/dep/rules/rules/njac7_9b.pdf
NJDEP, Division of Water Monitoring and Standards, Bureau of Environmental Analysis, Restoration and
Standards. September 2019. 2016 New Jersey Integrated Water Quality Assessment Report.
https://www.nj.gov/dep/wms/bears/assessment.htm
8. Appendix
Hach FAQ sheets
Okay
SUPPORT HOME ANSWERS CONTACT US LOGIN
Email this page Print
What is the accuracy of the Quantab® Chloride
titration test strips?
Document
ID TE12484
Published
Date 04/16/2020
Customer Support
Live Chat
Can’t nd what
you’re looking for?
Chat with us.
Have Sales Contact
Me
Request to be
contacted by a
sales person.
Ask a Question
Submit a question
to our support
team.
View Products
Question
What is the accuracy of the Quantab® Chloride titration test strips?
Summary
Statement of accuracy for Quantab® Chloride titration test strips.
Answer
The QA personnel use a well-documented procedure for testing each lot of Quantab® Chloride
titrator strips. First a calibration curve is constructed by developing ten strips for each of either
ve or six levels of Sodium Chloride concentration (more information on this can be found here:
How are the Chloride Quantab® test strips calibrated?). ) Data for each level must show a
standard deviation of 0.2 Quantab Units (2% of the scale of 10 on the titrator) or less.
New test solutions are prepared for the testing of four accuracy levels of sodium chloride. Each
accuracy level is tested with nine strips selected at random from the lot. The average of the
nine values must be within 10% of the standard value (from the calibration curve). If this test
fails at a particular Sodium Chloride level, six strips are sampled from each of six locations
within the lot, and all 36 strips are used to test the failing level. The aver of the 36 results must
be within 10% of the standard value.
The purpose of these QA test is to be sure that lots failing either of these tests do not ship.
There is also a brief testing step for the chemically impregnated pater before it is laminated and
made into titrator test strips. Thus the Quantab® Chloride titrator test strips are certied to
have an accuracy of ±10%. Precision could be inferred from the required standard deviation for
each Sodium Chloride level of the calibration data (0.20 Quantab Units). The percent Sodium
Chloride vs Quantab Units curve is not linear, and a given variation in Quantab Units
corresponds to a greater variation in percent Sodium Chloride at the high end of the range
compared to the lower part of the range. From the appearance of the plot, the precision
expressed as a fraction (standard deviation over percent Sodium Chloride value) seems not to
vary much from ~±10%. There are additional specication ensuring that the Quantab peak has
an acceptable appearance and that the lamination is of good quality.
This information is applicable for Product # 2744940 and 2751340
Attachments
Was this answer helpful?
Yes
No
This website uses cookies to ensure you get the best experience on our website. Learn more
Search...
Test Strips
Test Kits and Strips
United States
▼
Australia ▼
Canada ▼
India ▼
Ireland ▼
MENA ▼
New Zealand ▼
Singapore ▼
United Kingdom ▼
Rate Content

Okay
SUPPORT HOME ANSWERS CONTACT US LOGIN
Email this page Print
How are the Chloride QuanTab® test strips calibrated?
Document
ID TE6583
Published
Date 08/23/2018
Customer Support
Live Chat
Can’t nd what
you’re looking for?
Chat with us.
Have Sales Contact
Me
Request to be
contacted by a
sales person.
Ask a Question
Submit a question
to our support
team.
View Products
Question
How are the Chloride QuanTab® test strips calibrated?
Summary
Calibration of Chloride QuanTab® test strips
Answer
The Chloride QuanTab® Test Strips, 300-6000 mg/L (Product # 2751340) and Chloride
QuanTab® Test Strips, 30-600 mg/L (Product # 2744940) are calibrated with Chloride standards
that are made by synthesis from ACS grade sodium chloride. The assay requirement for ACS
grade sodium chloride is >=99.0%. The standards are made in 1 liter class A volumetric
glassware. The tolerance for this piece of glassware is 1000 mL ± 0.04%.
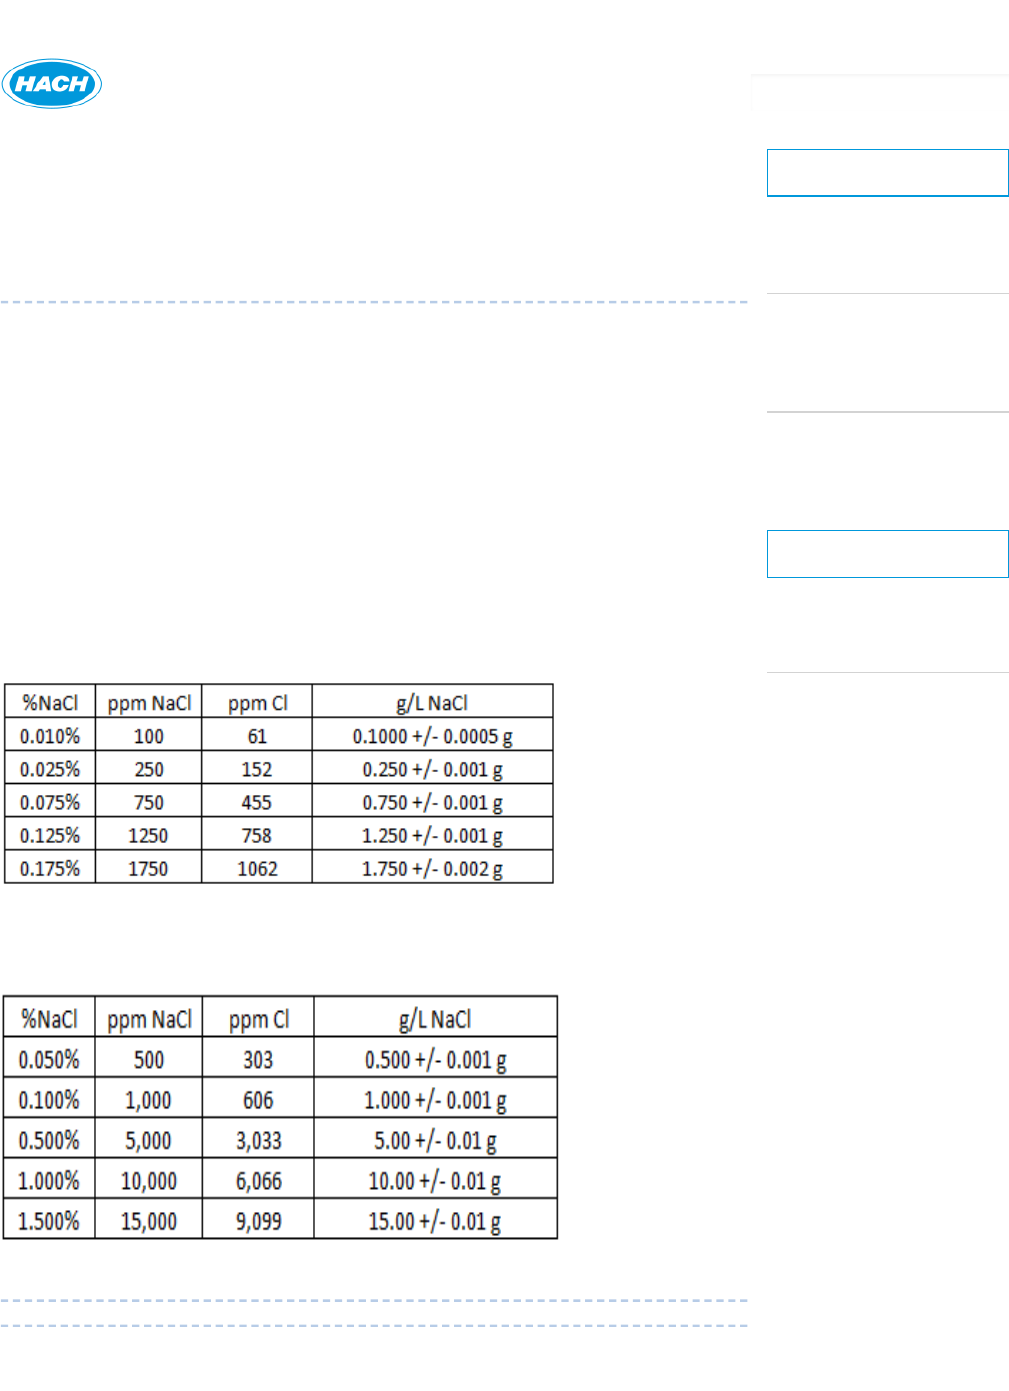
The table below shows the weight tolerances listed in our procedure for the Chloride
QuanTab® Test Strips, 30-600 mg/L (Product # 2744940):
The table below shows the weight tolerances listed in our procedure for the Chloride
QuanTab® Test Strips, 300-6000 mg/L (Catalog Number/ Order Code 2751340):
Was this answer helpful?
This website uses cookies to ensure you get the best experience on our website. Learn more
Search...
Test Kits
Test Kits and Strips
United States
▼
Australia ▼
Canada ▼
India ▼
Ireland ▼
MENA ▼
New Zealand ▼
Singapore ▼
United Kingdom ▼

Okay
SUPPORT HOME ANSWERS CONTACT US LOGIN
Email this page Print
Is it possible to interpret Quantab Chloride test strip
results that exceed the Quantab Unit on the bottle
label?
Document
ID TE9232
Published
Date 01/18/2018
Customer Support
Live Chat
Can’t nd what
you’re looking for?
Chat with us.
Have Sales Contact
Me
Request to be
contacted by a
sales person.
Ask a Question
Submit a question
to our support
team.
View Products
Question
Is it possible to interpret Quantab Chloride test strip results that exceed the Quantab Unit on
the bottle label?
Summary
Interpretingover rangeQuantab Chloride test strip results
Answer
The relationship between the quantab unit (QU) andparts per millionconcentration (ppm) is
both lot specic and non-linear. Because of this there is no way to determine the what ppm
concentration is of anyQU that is not on the label, only it's relative result tovalues that are on
the label.
For exampleusing the below label;the numbers on that label are likely different from the label
on a bottle that was recently ordered and received. That is because the example is a from a
different lot. IfaQU result of7.1 is obtained using the example lot, it's not possible to determine
thespecic ppm result, onlythat it isbetween 542 ppm and 583 ppm.
This website uses cookies to ensure you get the best experience on our website. Learn more
Search...
Test Strips
United States
▼
Australia ▼
Canada ▼
India ▼
Ireland ▼
MENA ▼
New Zealand ▼
Singapore ▼
United Kingdom ▼
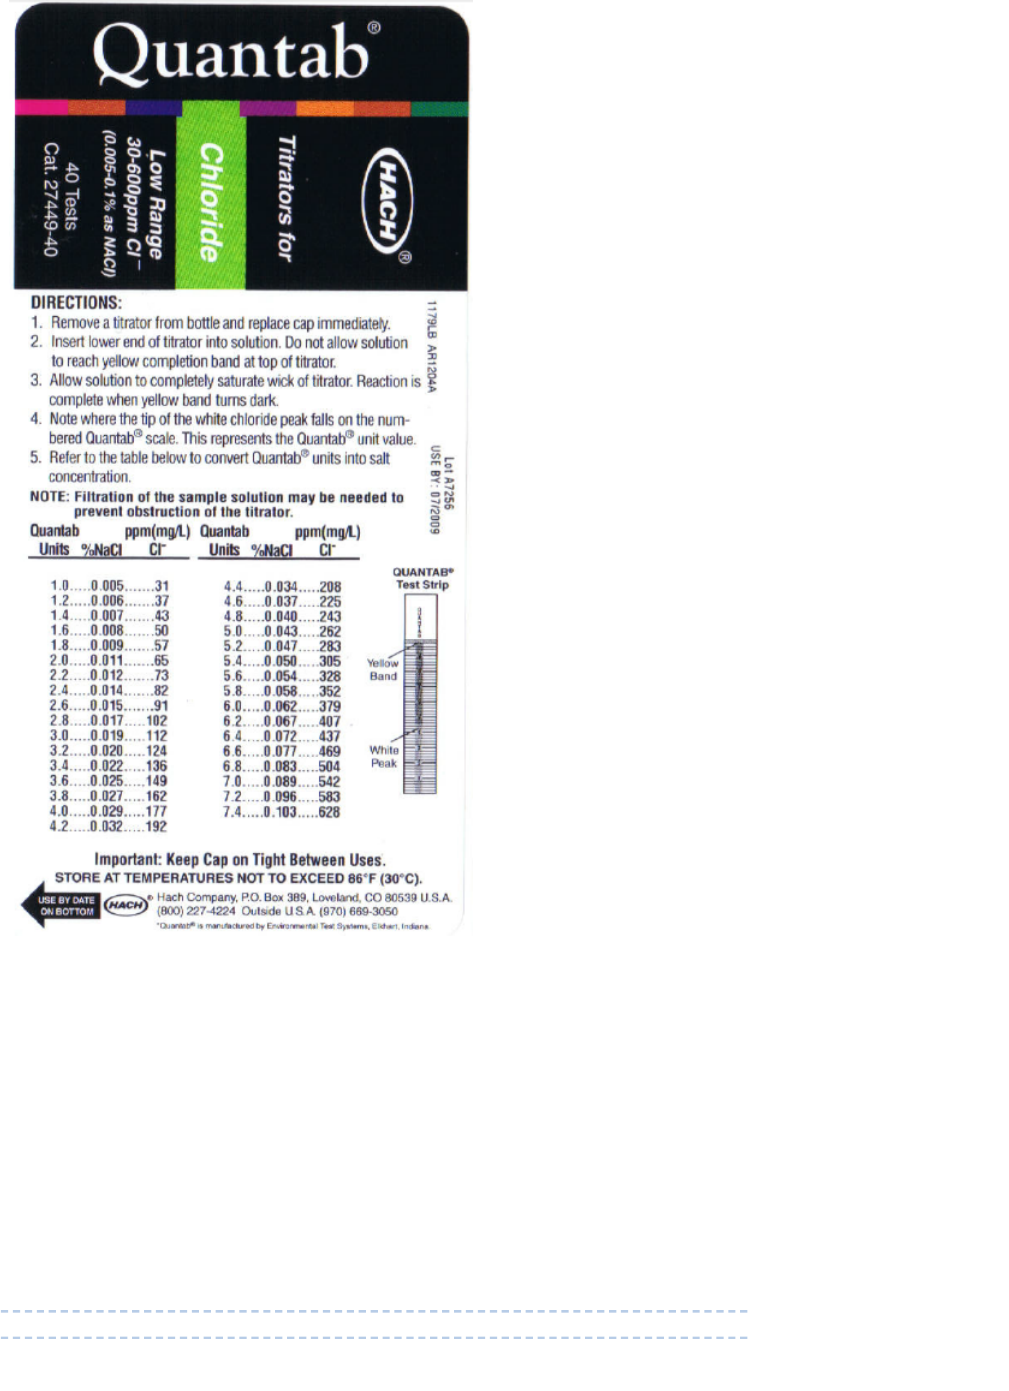
The listed range for the example which is Chloride QuanTab® Test Strips (Product # 2744940) is
30-600 ppm , the lowest number on the bottle is 1 QU=31 ppm and the highest number in this
case 7.4 QU=628 ppm which are both ~30 and ~600 ppm. So for any result over 7.4 QU(whether
it be 8 QU or 8.5 QU),report theresult as > 628 ppm and over the range of the test strip.
The reason that the numbers on the strip go up tonear 10is because theQU that is
approximately equal to 600 ppm will vary between test strip lots. On some strips~600 ppmas
low as 7.5 QU like the example, for others it could be as high as9.0 QU.
If a QU result is abovethe highest QU on the label, the options are:
1. Accept that the ppm concentration is over range and an exact concentration cannot
be reported
2. If using low range test strips, redo the test with higher range test strips.
3. Ifusing high range test strips,the sample can bediluted and the resultmultiplied by
the dilution factor.