
A cross-cultural study of reference point adaptation: Evidence from China, Korea,
and the US
q
Hal R. Arkes
a,
*
, David Hirshleifer
b
, Danling Jiang
c
, Sonya S. Lim
d
a
Department of Psychology, The Ohio State University, OH, United States
b
Paul Merage School of Business, University of California, Irvine, CA, United States
c
College of Business, The Florida State University, FL, United States
d
The Kellstadt Graduate School of Business, DePaul University, IL, United States
article info
Article history:
Received 25 September 2008
Accepted 21 February 2010
Available online 25 March 2010
Accepted by William Bottom
Keywords:
Prospect theory
Cross-cultural differences
Reference point adaptation
Mental accounting
Security trading
abstract
We examined reference point adaptation following gains or losses in security trading using participants
from China, Korea, and the US. In both questionnaire studies and trading experiments with real money
incentives, reference point adaptation was larger for Asians than for Americans. Subjects in all countries
adapted their reference points more after a gain than after an equal-sized loss. When we introduced a
forced sale intervention that is designed to close the mental account for a prior outcome, Americans
showed greater adaptation toward the new price than their Asian counterparts. We offer possible expla-
nations both for the cross-cultural similarities and the cross-cultural differences.
Ó 2010 Elsevier Inc. All rights reserved.
Introduction
Prospect theory (Kahneman & Tversky, 1979) is one of the – if
not the – most prominent descriptive theories of decision making
under uncertainty. Although originally designed as a static model,
it has been widely applied to dynamic settings in economics and
business research to understand work effort, brand choices, capital
budgeting, stock returns, trading volumes, and option exercises
(e.g., Barberis & Huang, 2001; Grinblatt & Han, 2005; Hardie, John-
son, & Fader, 1993; Heath, Huddart, & Lang, 1999; Heath, Larrick, &
Wu, 1999; Keasey & Moon, 1996; Mas, 2006). An important pre-
mise of these applications of prospect theory is that reference
points shift over time, but only recently have scholars started to
explore systematically the dynamic properties of reference points.
Furthermore, research that examines such properties across differ-
ent cultures is almost non-existent. Given the large body of re-
search showing that culture affects individual judgment and
decisions, a primary purpose of this manuscript was to ascertain
whether reference point adaptation exhibits cross-cultural varia-
tions, and if so, what are the possible causes of these variations.
A natural hypothesis for the dynamics of reference point adapta-
tion is that the reference point moves in a manner consistent with
the prior outcome, shifting upward following a gain and downward
following a loss. Using subjects from the US, Arkes, Hirshleifer, Jiang,
and Lim (2008) found that reference points adapt asymmetrically:
such adaptation was significantly larger following a gain than fol-
lowing a loss.
1
They also found that when the initial paper gain or loss
is realized, adaptation both to losses and gains appeared to be en-
hanced. The current paper applied the measurement approach of
Arkes et al. to encompass both East-Asian and US subjects. In addition,
we employed two additional questionnaire designs to estimate refer-
ence points. In all approaches we identified both cross-cultural simi-
larities and differences in reference point adaptation.
Performing cross-cultural studies in reference point adaptation
was motivated by recent research that has documented important
differences in several judgment and decision making phenomena
across countries. East-Asians, who live in collectivist societies, ex-
hibit behavioral differences in many aspects from Americans, who
live in an individualist society. Research has shown that, relative to
Americans, East-Asians appear to be more overconfident (Yates,
Lee, & Shinotsuka, 1996), more risk seeking in the financial domain
(Hsee & Weber, 1999), more holistic than analytic, more likely to
0749-5978/$ - see front matter Ó 2010 Elsevier Inc. All rights reserved.
doi:10.1016/j.obhdp.2010.02.002
q
The order of the authors is alphabetical. Each author contributed fully and
equally to the project.
* Corresponding author. Address: Department of Psychology, Ohio State Univer-
sity, 240 N Lazenby Hall, Columbus, OH 43210-1222, United States. Fax: +1 614 688
3984 (H.R. Arkes).
1
In a somewhat similar spirit, Strahilevitz and Loewenstein (1998) conjectured
that ‘‘... adaptation to losses takes longer than adaptation to gains and would
therefore require a greater time interval to observe.”
Organizational Behavior and Human Decision Processes 112 (2010) 99–111
Contents lists available at ScienceDirect
Organizational Behavior and Human Decision Processes
journal homepage: www.elsevier.com/locate/obhdp

attribute outcomes to contextual rather than to internal factors
(Morris & Peng, 1994), more prone to detect stronger associations
between events and apt to place less value on having personal con-
trol (Ji, Peng, & Nisbett, 2000), and more likely to expect that
changes that have occurred in the past will reverse in the future
(Ji, Nisbett, & Su, 2001). All of these factors represent potential
influences on the determination of reference points.
Cross-cultural study of reference point adaptation can help us
to understand the potential sources of variations in financial mar-
ket behavior across the world. Scholars have used prospect theory
to understand a number of anomalous stock market phenomena,
including excess volatility, the equity premium puzzle, the value
effect, the momentum effect, the disposition effect, and IPO under-
performance (e.g., Barberis & Huang, 2001; Barberis & Xiong, 2009;
Bernartzi & Thaler, 1995; Shefrin & Statman, 1985). There is evi-
dence that the high equity premium, the value effect, the momen-
tum effect, and the disposition effect are present outside the
United States to varying extents.
2
The issue of reference point
updating is potentially important for applications of prospect theory
to these empirical findings.
Motivation and literature review
Reference point adaptation in prospect theory
Kahneman and Tversky (1979) proposed prospect theory as an
alternative to the normative theory of expected utility maximiza-
tion. There are three main elements of prospect theory: First, peo-
ple derive utility from gains and losses relative to a reference point,
while traditional utility theory assumes that people derive utility
from total wealth or consumption. Although the reference point
is generally one’s current wealth (Kahneman & Tversky, 1979),
aspiration levels or norms can also serve this function (Heath,
Larrick, et al., 1999; Kahneman & Tversky, 1979, p. 286). Second,
the value function is concave in the domain of gains and convex
in the domain of losses. The shape of the function captures ‘‘dual
risk attitudes”: individuals tend to be risk averse in the gain do-
main but risk seeking in the loss domain. Third, the effect of a loss
on utility is much larger than that of a gain of the same size (‘‘loss
aversion”).
Prospect theory has most commonly been applied to static deci-
sion environments. In dynamic applications such as stock trading,
repeated bargaining and negotiation, work efforts, and firm invest-
ments, it is important to understand how reference points are up-
dated after individuals experience outcomes over time.
Consider the prospect theory value function depicted in Fig. 1.If
a loss has occurred, the decision maker is at point L in Fig. 1a. If a
subsequent decision is to be made and the reference point has not
adapted to the initial loss, the decision maker will likely be risk
seeking, in that a further loss will cause only a small decrease on
the y-axis, whereas a further gain will result in a larger increase.
However if the decision maker adapts fully to the initial loss, then
Fig. 1b depicts this situation. Now the decision maker will be less
risk seeking, because the ‘‘re-centering” of the origin of the graph
on the current state of affairs causes a loss to be more painful than
it would have been in Fig. 1a. Thus, if the reference point does not
budge following a loss, then the decision maker is likely to become
risk seeking and to try to recover the loss, leading to such phenom-
ena as the sunk cost effect (Arkes & Blumer, 1985) or the disposi-
tion effect (Shefrin & Statman, 1985). On the other hand, if the
reference point adapts downward following a loss, the decision
maker is able to ‘‘make peace” with this loss and will be less likely
to ‘‘throw good money after bad.”
There are a very few cross-cultural studies pertaining to the sta-
tic aspects of prospect theory. However, we know of no cross-cul-
tural research on its dynamic aspects, which are the focus of our
study. There are a very few studies testing the dynamic aspects
of prospect theory using US subjects. Using both hypothetical out-
comes depicted in questionnaire studies and monetary outcomes
from a coin-toss game, Chen and Rao (2002) found that the order
in which two equal but opposite events (gain/loss) occurred af-
fected the subject’s final affective state, suggesting that a shift in
the reference point must have occurred after the first event. They
also found that adding a time lapse between the two events gener-
ated results consistent with greater shift in reference points. How-
ever, their method does not allow estimates of the location of new
reference points. Gneezy (2005) endowed subjects with a stock
and then queried them about their willingness to hold or sell it
as its price varied over several trading periods. Gneezy assumed
that subjects are most willing to sell when the current price is
equal to the reference point, and showed that assuming a stock’s
peak price to be the reference point best explained subjects’ will-
ingness to sell that stock. Gneezy’s method can position the refer-
ence point relative to prior stock prices only when the subject sells
the stock. Baucells, Weber, and Welfens (2010) estimated the ref-
erence point by asking subjects which selling price would make
them neither happy nor unhappy after they observed a stock price
path. By regressing the reference point indicated by the subject on
the purchase price, the current price, and the intermediate prices,
Baucells et al. showed that the reference point is most heavily
influenced by the first and the last observed stock price.
All of these studies suggest that reference points are path-
dependent: past prices, in addition to the purchase price, appear
to have significant impacts on the current reference point. This im-
plies that reference points adapt to outcome payoffs. However,
these studies do not estimate the exact magnitude of reference
point adaptation after a gain or loss. They therefore do not allow
comparative analyses such as the test of gain-loss asymmetry.
Arkes et al. (2008) estimated the changes in reference point
location following stock trading gains and losses using both ques-
tionnaires and real money incentives. They found that the refer-
ence point adapts to prior gains to a greater extent than to prior
losses
using
two main procedures, which we adopted and will ex-
plain in detail in the current Studies 1 and 3. Also, when subjects
were forced to sell a stock and then repurchase it at the same price
at which it had been sold (Weber & Camerer, 1998), Arkes et al.
found that reference point adaptation was accelerated; reference
points moved closer towards the new purchase price.
Fig. 1. (left): No adaptation to the loss that is depicted at point L. (right): Full
adaptation to the loss that is depicted at point L.
2
E.g., Fama and French (1998), Rouwenhorst (1998), Grinblatt and Keloharju
(2001), Chui, Titman, and Wei (2010), Feng and Seasholes (2005), and Dimson, Marsh,
& Staunton (2008).
100 H.R. Arkes et al. / Organizational Behavior and Human Decision Processes 112 (2010) 99–111

Cross-cultural differences in decision making
Weber and Hsee (1998) and Hsee and Weber (1999) showed
that Chinese are less risk averse than Americans in their financial
decisions, but not in other domains such as medical and academic
decisions. Weber and Hsee (1998) found that, under a general risk-
return framework, the perception of the riskiness of financial
investment options is lower among Chinese than Americans, and
argue that this difference in risk perception can explain cross-cul-
tural differences in risk preferences. Hsee and Weber (1999) sug-
gest that Chinese are less risk averse because a financial
‘‘cushion” that is available in a collectivist culture makes Chinese
less afraid of risk. Consistent with this hypothesis, they found that
the cross-cultural differences between the Chinese and Americans
in perceived financial risks became insignificant once they con-
trolled for social network variables, such as the number of people
an individual could rely on for financial assistance.
Ji et al. (2001) documented greater expectation of reversals by
Asians than Americans. In five studies, Ji et al. (2001) showed that
Chinese students were more likely to predict change from an initial
trend than were Americans. In the research mostly closely related
to our studies, Ji, Zhang, and Guo (2008) presented North American
and Chinese subjects – both college students and experienced
investors – with graphs illustrating upward, downward, or stable
price trends of various stocks. Compared to the North American
subjects, the Chinese participants were more likely to buy stocks
whose prices were decreasing and sell stocks whose prices were
increasing. Protocol analyses indicated that this contrarian ten-
dency on the part of the Chinese was due to their belief that a
change was likely in the future. Thus, compared to Americans, Chi-
nese subjects – or Asian subjects in general – might be more likely
to predict that gains would be followed by losses, and conversely.
Any such difference would have important implications for the val-
uation and willingness to continue holding a stock following an ini-
tial price movement.
In this paper, we employed the experimental designs used in
Arkes et al. (2008) and two additional methods to infer reference
points. We have four goals in mind. First, we measured reference
point adaptation among East-Asians to ascertain if the greater adap-
tation to gains than losses was present across cultures, as was doc-
umented among US participants in Arkes et al. (2008). Second, we
examined if there is a cross-cultural difference in the magnitude
of reference point adaptation between East-Asians and Americans.
Third, we ascertained whether the intervention of the sale and
repurchase of stocks accelerated reference point adaptation in the
Asian culture, as was previously demonstrated in the American
sample. Finally, we explored the possible explanations for the ob-
served cross-cultural variation in reference point adaptation.
Study 1: questionnaire study of reference point adaptation
following Arkes et al. (2008)
In this questionnaire study we asked subjects to indicate a stock
price today that would generate the same utility as a previous stock
price change. Assume that the first stock price P
1
resulted in a level
of utility V(P
1
R
0
), which is a function of the difference between
the first stock price P
1
and the reference point R
0
. Subjects indicate
the price of the stock today P
that would generate the same utility
as the previous price. Assuming a constant shape of the prospect va-
lue function, we have V(P
R
1
)=V(P
1
R
0
). Thus the distance be-
tween the indicated stock price and the new reference point must
be equal to the distance between the prior stock price and the old
reference point: P
R
1
= P
1
R
0
. So the reference point adaptation
R
1
R
0
= P
P
1
. That is, reference point adaptation can be inferred
from the subject’s indication of the stock price today that would
generate the same utility as the previous price change.
Method
Subjects
The participants were undergraduate students at Florida State
University in the United States (81 subjects), Nanjing University
in China (89 subjects), and Korea University in Korea (81 subjects).
All subjects were business majors, either college sophomores or ju-
niors, and the American and Asian groups contained a similar per-
centage of males (66% male in the US, and 70% in Asia).
The subjects answered brief questionnaires in a classroom set-
ting. All students voluntarily filled out the questionnaires for a raf-
fle prize within each class. The raffle prizes were adjusted to ensure
a similar monetary incentive across three countries from the per-
spective of an average subject. In the US, the prize was $20. Accord-
ing to official exchange rates when the experiment was conducted,
this amount was equivalent to 20,000 Korean Won (KRW), which
served as the prize for our Korean subjects. The prize for our Chi-
nese participants was ¥80, which was the equivalent of $10
according to the official exchange rate. However the three coun-
tries’ prizes were chosen to be similar in purchasing power, be-
cause the raffle prize could pay for approximate 3–4 equivalent
McDonalds meals in each local market.
3
Procedure
We conducted a questionnaire study where we asked two ques-
tions regarding reference point adaptation, similar to those used in
Arkes et al. (2008). In one question, subjects were asked to indicate
the stock price that would make them just as happy with the stock’s
price this month as they were when they learned the stock had ri-
sen from $30 to $36. In the other, they indicated the stock price that
would make them just as sad as when they learned the stock had
dropped from $30 to $24 last month. To ensure that original mean-
ings were preserved during translation, the questionnaire was first
translated into Chinese or Korean by one person and then back-
translated into English by a different person, and we made minor
corrections when there were discrepancies (Brislin, 1986).
The US payoff numbers were multiplied by 1000 in Korea, be-
cause one US dollar was about 1000 KRW in Korea. In China, we
opted to use the same US figures but in local currency. In other
words, we replaced $30 with ¥30, and so forth. In our later stock
trading study, we also used the same practice to reflect the fact
that most prices range from ¥5 to ¥50 in Chinese stock markets.
For simplicity in reporting, we later do not distinguish the numbers
in $ from those in ¥, but refer to all of them in $ instead. The refer-
ence point adaptation of Korean subjects was divided by 1000 so
that we could compare the results across countries.
Results
We report the results in Table 1. Two observations from Asian
countries (one from China, the other from Korea) were deleted
due to entry errors. Since we found no statistical difference be-
tween the risk taking behaviors between Chinese and Koreans,
we aggregated them into one factor, namely Asian culture.
3
The exchange rate between the US dollar and Korea Won is close to the ratio of
the purchasing powers of two currencies. However, there is a discrepancy between
the exchange rate and the purchasing power ratio for the US dollars and China ¥. For
instance, an equivalent McDonald meal or an hour of math tutoring costs roughly 2–3
times more in the US than in China. Therefore, for the Chinese subjects we made an
adjustment to their prize based on the relative price of a McDonald meal or payment
for tutoring services in the two markets. This strategy ensured similar incentives from
the perspective of an average subject across all countries.
H.R. Arkes et al. / Organizational Behavior and Human Decision Processes 112 (2010) 99–111
101

The responses to the two reference point adaptation questions
yielded a finding similar to that of Arkes et al. (2008): reference
points adapted to gains to a greater extent than to losses of equal size.
Table 1 shows that the implied adaptation to a $6 gain minus that to a
$6 loss, calculated as
D
RP(G)
D
RP(L), is positive and statistically
significant both in Asia and the US. Our evidence suggests that asym-
metric adaptation in reference points is a general phenomenon in
individual decision making and can be generalized across cultures.
4
However we observed some cross-cultural variations in adapta-
tion. First, Asians appear to adapt more to prior outcomes
than Americans, as measured by the average adaptation
[
D
RP(G) +
D
RP(L)]/2. On average, Asians adapt $5.18 to a $6 prior
outcome while Americans adapt $3.10, a $2.08 difference. Second,
the asymmetric adaptation seems larger among Asians than among
Americans. On average, reference points adapt $1.94 more to gains
than to losses among Asians, but only $1.07 among Americans.
5
Using an ANOVA 2 (gain/loss) 2 (cultures) design, we find evi-
dence consistent with our observations. First, the gain/loss factor is
significant [F(1, 247) = 37.2, p < .01], suggesting that the asymmet-
ric adaptation exists across the two cultures. The culture factor is
significant [F(1, 247) = 29.9, p < .01], indicating greater adaptation
among Asians than among Americans. The interaction term (gain/
loss culture) is marginally significant [F(1, 247) = 3.11, p = .079].
Study 2: estimating prospect theory value function parameters
In a later experiment we will examine individual reference
point adaptation in experimental stock trading settings, in which
subjects’ trading profits were tied to monetary payoffs, following
the procedure employed by Arkes et al. (2008). Since that experi-
ment requires the estimates of the loss aversion parameter (k)
and the exponent (
a
) in the cumulative prospect theory value func-
tion (Tversky & Kahneman, 1992), we first estimated those param-
eters for each culture in Study 2. It should be noted that k
represents the extent to which the loss portion of the value func-
tion is steeper than the gain portion, and
a
represents the curva-
ture of the value function.
VðxÞ¼
x
a
x > 0
kðxÞ
a
x < 0
ð1Þ
Tversky and Kahneman (1992) modeled the nonlinearity (curva-
ture) for gains and losses using two different parameters. However,
their experimental data yielded the same median estimates for the
two parameters, 0.88 (T versky & Kahneman, 1992, p. 311). Thus we
will use the same curvature parameter value for both gains and losses.
The existing estimates for the loss aversion parameter (k) and
the exponent (
a
) are based on experiments using western subjects.
For instance Tversky and Kahneman (1992) estimated the loss
aversion parameter to be 2.25 and the exponent
a
to be 0.88 using
US subjects. However, nowhere in the existing literature are there
such estimates for Asians subjects. Since these could differ from
those for US subjects, it is important that we estimate these values.
Our questionnaires followed Kahneman and Tversky (1979) and
Tversky and Kahneman (1992). We used the same range of hypo-
thetical payoffs as the range of the real monetary payoffs used in
our stock trading experiment.
Method
Subjects
Part 1 of Study 2 was designed to estimate the loss aversion
coefficient. It was run together with Study 1. Thus, the participants
and procedures were the same as described in Study 1, but the
number of observations differs slightly. Among our Korean sub-
jects, three persons did not provide answers to the loss aversion
questions, and the data from one US subject were deleted due to
a preposterous value provided by that individual.
Part 2 of Study 2, which was designed to estimate the exponent
of the value function (
a
), was run online. We sent out e-mails to
undergraduate students enrolled in selected business classes and
also made in-class announcements asking for participation. For
the online survey, the raffle prize was three $20 prizes in the US,
two $50 prizes in Korea, and three $20 prizes in China. Though
the prize in the US is smaller than that in Korea and China, the
US subjects were given one extra credit for filling out the survey,
which served as an additional incentive. One hundred eighteen
subjects from Florida State University in the United States, 92 sub-
jects from Sun Yat-Sen University in China, and 88 subjects from
Korea University in Korea participated in the online survey.
Materials
In Part 1 of Study 2, there were three questions for each subject,
each asking for the size of the gain prospect of a gamble that would
make a participant indifferent between a sure outcome of zero and
the gamble. The three gambles differed in the magnitude of the
loss prospect. As described in Study 1, the numbers were converted
into Korean currency of equivalent amounts by an approximate ra-
tio based on the exchange rates, and in China by changing the label
of the currency. The questions in Part 1 were adapted from Tversky
and Kahneman (1992), and the loss aversion coefficient of an indi-
vidual was measured by the indicated gain prospect, X, divided by
the corresponding loss prospect.
Part 1: Loss aversion
Option A: No gain or loss;
Option B: Win $X or lose $25/$50/$100 with equal probability of
50%
Indicate the dollar value of X that will make you indifferent
between Options A and B: $____________
Similarly, in Part 2, there were two pairs of questions per
subject, one for the gain domain and one for the loss domain,
which estimated the exponent of the value function (
a
).
Part 2: Exponent
You are expected to give the dollar value of X to make option B
just as attractive as option A. In other words, please indicate the
Table 1
Reference point adaptation to gains and losses (Study 1).
N
D
RP(G)
D
RP(L) [
D
RP(G) +
D
RP(L)]/2
D
RP(G)
D
RP(L)
t-Stat.
Asia 168 Mean 6.15 4.21 5.18 1.94 6.49
Std. dev. 3.74 3.26 2.93 3.87
US 81 Mean 3.63 2.56 3.10 1.07 3.08
Std. dev. 2.67 3.27 2.54 3.12
All 249 Mean 5.33 3.67 4.50 1.66 7.14
Std. dev. 3.62 3.35 2.97 3.66
Note:
D
RP(G), defined as R
1
R
0
= P
36, measures the reference point adaptation
to a $6 gain.
D
RP(L), defined as R
0
R
1
=24 P
, measures the reference point
adaptation to a $6 loss. The t-stat tests whether the asymmetric adaptation,
D
RP(G)
D
RP(L), is different from zero.
4
Throughout our studies, we have relied on the prospect theory postulate that
individuals derive utilities from absolute (dollar amount) deviations from the
reference point. There is, however, an alternative interpretation of our results if
individuals focus on proportional deviation (e.g., Bartels, 2006). We conjecture that
whether absolute or proportional thinking dominates may heavily depend on the
framing of questions. To test this, we did a study (details not reported here) with
American subjects that framed questions in terms of stock returns, not in dollar
amount of price changes. Again, we found greater adaptation to gains than to losses.
5
Arkes et al. (2008) estimated that the asymmetry is equal to $1.73 for their US
subjects, larger than our US estimate of $1.07. We used a within-subject design
instead of a between-subject design used by Arkes et al. (2008), which might have
possibly reduced the asymmetry.
102 H.R. Arkes et al. / Organizational Behavior and Human Decision Processes 112 (2010) 99–111

dollar value of X that will make you exactly indifferent between
the two options.
Option A: Win (Lose) $X for sure.
Option B: Win (Lose) $50/$100 or win (lose) nothing with equal
probability of 50%
Indicate the dollar value of X that will make you indifferent
between Options A and B: $______
Since the value of the sure outcome (Option A) must be equal to
the expected value of the risky gamble (Option B) when a subject is
indifferent between the two options, the indicated amount X must
satisfy V(X) = 0.5V(0) + 0.5V(P), where P is equal to $50 or $100
depending on the question. Using the prospect theory value func-
tion in Eq. (1), the exponent
a
is equal to log(2)/log(P/X), where P
refers to the gain or loss prospect ($50 or $100) of the risky gamble.
Results and discussion
Table 2 contains the mean loss aversion and the exponent esti-
mates for each culture. The mean loss aversion coefficient across
the three loss prospects is 1.66 for Asia (1.69 for China, 1.61 for
Korea) and 1.86 for the US. The estimates indicate that the US sub-
jects are more loss averse than the Asians. The difference in loss
aversion between the two cultures was marginally significant
[t(150) = 1.73, p = .087]. Again, we found no statistically signifi-
cant differences between Chinese and Koreans, so they are aggre-
gated into an Asian culture group.
The alpha estimates from a pair of questions (one pertains to a
gain of $50/$100 and the other a loss of the same magnitude) were
averaged for each subject, then across subjects within each culture.
Some subjects indicated certain payoffs that are equal to one of the
possible payoffs of the gamble or greater than the non-zero possi-
ble payoff, in which case we could not solve for
a
.
6
Our estimate of the alpha based on the average over the two
pairs of questions is 0.84 for Americans, close to the estimate of
0.88 by Tversky and Kahneman (1992). The mean alpha estimate
is 0.97 for Asians. The difference between the two cultures in their
alpha estimates was marginally significant [t(104) = 1.67,
p = .098]. A lower loss aversion coefficient and a higher exponent
estimate for Asians compared to those of Americans are broadly
consistent with the findings of Weber and Hsee (1998) and Hsee
and Weber (1999) that Asians are less risk averse compared to
Americans.
We then proceeded to test reference point adaptation to out-
come payoffs. As discussed previously, we employed the experi-
mental design of Arkes et al. (2008) to test whether (a) reference
points adapt faster to gains than to losses, and (b) a forced sale/
repurchase event helps foster adaptation among Asian subjects.
Furthermore, we looked for possible cultural differences in these
adaptation patterns.
Study 3: reference point adaptation in a stock trading game
with a monetary incentive
Method
Participants
The participants were 176 subjects from DePaul University,
Florida State University, and The Ohio State University in the US,
94 subjects from Sun Yat-Sen University in China, and 116 subjects
from Yonsei University in Korea. We recruited undergraduate busi-
ness majors through e-mails, fliers, and in-class announcements.
The study occurred outside of class time.
Like Studies 1 and 2, we adjusted the range of the possible final
payoff to ensure similar monetary incentives from the perspective
of a college student. The subjects were promised a $20 base pay-
ment in the US, ¥60 in China, and 20,000 KRW in Korea for their
participation. In addition, subjects were told that their trading
profit or loss would be added to the participation fee to yield their
final payment. Specifically, we told them that two stocks out of all
stocks they had traded would be randomly drawn and their trading
profits on those stocks would count toward their final payoff. This
Table 2
Parameter estimates of the value function (Study 2).
Amount of loss prospect Within-subject average Within-subject std. dev.
$25 $50 $100
Panel A: Loss aversion coefficient (k)
Asia Mean 1.55 1.64 1.78 1.66 0.20
Std. dev. 0.77 0.84 1.13 0.85
N 167 167 167 167 167
US Mean 1.89 1.78 1.91 1.86 0.23
Std. dev. 1.13 0.76 1.00 0.88
N 80 80 80 80 80
X = $50 X = $100
Gain
domain
Loss
domain
Within-subject
average
Within-subject std. dev. Gain
domain
Loss
domain
Within-subject
average
Within-subject std. dev.
Panel B: Exponent of the value function (
a
)
Asia Mean 0.92 0.94 0.93 0.25 1.03 0.97 1.00 0.27
Std. dev. 0.49 0.75 0.53 0.59 0.52 0.43
N 155 145 139 139 162 159 152 152
US Mean 0.86 0.66 0.83 0.50 0.82 0.78 0.79 0.42
Std. dev. 0.94 0.95 0.61 1.15 0.77 0.77
N 96 90 79 79 104 95 90 90
Note: The loss aversion coefficient is defined as the reported amount of the gain prospect divided by the pre-specified loss prospect ($25, $50, or $100) in a 50:50 gamble such
that a subject is indifferent between the gamble and a sure outcome of zero. The exponent of the value function (
a
) is defined as
a
= log(2)/log($50/X), or
a
= log(2)/log($100/
X), where X refers to the reported dollar amount that would make subjects indifferent between a sure amount of X and a 50:50 gamble of a zero and a $50/$100 gain/loss. N is
6
We only included subjects that have a pair of solvable alpha estimates for a given
magnitude ($50 or $100). The number of respondents for which we could not obtain
parameter estimates for both $50 and $100 magnitudes was 27 for Asia (15%) and 16
for the US (13.6%). The number of respondents for which we could not obtain a
parameter estimate for either $50 or $100 magnitude is 42 for Asia (23.3%) and 41 for
the US (34.7%).
H.R. Arkes et al. / Organizational Behavior and Human Decision Processes 112 (2010) 99–111
103

created a pecuniary incentive for the participants to follow the
optimal strategy in each round of trading. Further, since trading
profits were not cumulative across rounds, their decision on each
round should not have been influenced by their decisions from
prior outcomes. The final payoffs ranged from $15–$25 in the US,
¥40–¥80 in China, and 15,000–25,000 KRW in Korea, all equivalent
to about 2–3 h of math tutoring services or 2–4 McDonald’s meals
in local markets.
Procedure
We used the stock trading game procedure of Arkes et al. (2008,
Experiment 6), which is based on the Becker, DeGroot, and Mars-
chak (1964) procedure (BDM). The same procedure was used with
our participants in China, Korea, and the US.
Subjects traded one stock in each of four trading rounds. The
timeline of the trading game is displayed in Fig. 2. Each round con-
sisted of three dates and two periods. At the beginning of the trad-
ing round, subjects were told that they had previously purchased a
stock at a certain price (P
0
) and had held the stock for a week. They
were then informed of the current price P
1
, which was either high-
er or lower than their purchase price P
0
. Also, they were informed
of the two future possible prices of the stock in the next trading
period (P
2
). Before the realization of the second period price P
2
,
subjects had a chance to sell the stock to the experimenter by stat-
ing their minimum selling price. Following the BDM procedure, a
buying price was drawn from a uniform distribution of prices at
10-cent intervals between the two possible future prices P
H
2
and
P
L
2
, which correspond to the high and low future price possibilities,
respectively. If the randomly drawn buying price exceeded or
equaled the subject’s minimum selling price, the subject sold the
stock at the randomly drawn buying price. If the buying price
was less than the minimum selling price, the subject held the stock
and sold it at the next trading period’s price P
2
which was to be
determined by a coin flip.
Under the BDM procedure, it is optimal for the subjects to set
their minimum selling price equal to their valuation of the gamble.
Thus, the BDM procedure reveals through subjects’ minimum sell-
ing prices their certainty equivalents of risky gambles, given their
new reference point.
Among the four stocks, two were winners and two were losers.
The price paths used in the US experiments were as follow: The
winner stocks, which were purchased at $20, went up to $26 after
the first period. The subjects were informed that the stocks would
have to be sold at either $30 or $22 with equal probability in the
next trading period. The loser stocks were purchased at $20 and
dropped to $14 with a future price of either $18 or $10 with equal
probability. The BDM valuation procedure was used to solicit sub-
jects’ minimum selling prices after we informed the subjects of the
next trading period stock prices.
One winner and one loser stock had the intervention consisting
of the sale and repurchase of that stock at the same price at which
it had just been sold. After subjects were informed of the first per-
iod price movement, they had to sell the stock and repurchase it for
the same price after a time delay. During the time delay, the sub-
jects traded other stocks that were not involved in this experiment.
This time delay ranged between 20 and 30 min, and was designed
to help subjects segregate the prior outcome—a gain or a loss—
from the upcoming BDM procedure. Arkes et al. (2008) hypothe-
sized that this forced sale and repurchase would help close the
mental account occasioned by the prior price movement
(P
1
P
0
). After subjects repurchased a stock, they learned the pos-
sible future prices of the stock and submitted their minimum sell-
ing prices.
Following Arkes et al. (2008), we explicitly instructed subjects
about why it was optimal for subjects to ask their true valuation
of the stock. We included illustrative examples showing how ask-
ing above or below one’s true valuation causes suboptimal out-
comes. All subjects in each session had a chance to gain
experience in two practice rounds. Arkes et al. (2008) reported that
the subjects showed good understanding of the procedure and the
optimal strategy.
7
Like Studies 1 and 2, the stock prices presented to subjects in
China were the same as the numbers used in the US, and the num-
bers presented to subjects in Korea were the US prices multiplied
by 1000. The reference points inferred from Korean subjects’ min-
imum selling prices were divided by 1000 so that we could com-
pare the results across countries.
Results and discussion
The reference point at time 1 is the value R
that equates the
utility from selling the stock for P
min
to the expected utility from
retaining the stock and bearing the risk of an up or down
movement:
VðP
min
R
Þ¼0:5VðP
H
2
R
Þþ0:5VðP
L
2
R
Þ; ð2Þ
where P
min
is the dollar amount a subject indicates for the mini-
mum selling price, and R
is the implicit reference point. After solv-
ing Eq. (2) with the function forms in Eq. (1) for the reference point,
the adaptation is defined as the deviation of the new reference point
from the original reference point, assumed to be the purchase price,
toward the direction of the prior outcome.
For the value function in Eq. (2), we used the average loss coef-
ficient estimated in Study 2 using payoff amounts similar to what
we used in this study ($25; the first column in Table 2); 1.55 for
Asia, 1.89 for the US. The results, however, are similar if we use
the mean loss coefficient across the $25 and $50 scenarios. We
could not use the estimates for
a
from Study 2 because the refer-
ence point was solvable only for 20–30% of the observations using
our estimates for
a
. Instead we use
a
= 0.5 which gave us a reason-
able number of usable observations (96–99% for Asians and 80–
85% for Americans, depending on the stock). In the Appendix A,
we show that our results are robust with respect to parameter val-
ues (including the choice of alphas and lambdas, and the use of the
Tversky and Kahneman (1992) probability weighting function). We
defined the amount of reference point adaptation as R
P
0
when
there was a prior gain and P
0
R
when there was a prior loss.
For a comparison with our questionnaire study findings, we first
focused on the data generated without the sale/repurchase inter-
vention. We wanted to ascertain whether the three findings from
the questionnaires were also present in the stock trading data:
overall asymmetric adaptation plus greater adaptation and greater
asymmetry among Asians compared to Americans. We performed
a 2 (culture: Asia, US) 2 (outcome: win, loss) ANOVA on the mag-
P
2
= P
2
H
if heads
= P
2
L
if tails
P
0
P
1
Coin Flip
t = 0
t = 1
t = 2
Submit
minimum
sellin
g
price
Fig. 2. Time-line of the trading game used in Study 3.
7
Subjects gave an average 5.3/6 rating to their understanding of the experimental
procedure, and an average rating of 3.8/5 to their acceptance of the optimal strategy
under the BDM mechanism in Arkes et al. (2008).
104 H.R. Arkes et al. / Organizational Behavior and Human Decision Processes 112 (2010) 99–111

nitude of adaptation. For very high or low minimum selling prices,
we were not able to solve for reference points, so we ended up with
172 subjects from Asia and 119 subjects from the US with usable
data for the two stocks, one with a prior $6 gain and the other with
a $6 loss.
Table 3 reports the average reference point adaptation for the
four stocks. According to the 2 2 ANOVA using the two stocks
with a prior gain or loss but without the sale/repurchase interven-
tion, the outcome effect was highly significant [F(1, 289) = 112.86,
p < .001] due to the greater adaptation following gains compared to
losses. The between-subject factor, culture, was significant
[F(1, 289) = 8.063, p = .005], indicating that Asians show greater
adaptation than do Americans. The culture outcome interaction
term was marginally significant [F(1, 289) = 3.59, p = .059]. Asians,
however, exhibited smaller asymmetry than Americans, which is
the opposite of what we found in Study 1.
For a comparison with the findings by Arkes et al. (2008),we
also performed a 2 (culture: Asia, US) 2 (outcome: win, loss) 2
(sale/repurchase intervention: yes, no) ANOVA on the magnitude
of reference point adaptation. Culture was the only between-sub-
jects factor.
We found greater adaptation to gains than losses in both cultures.
As can be seen in Table 3, for both cultures the mean adaptation fol-
lowing a loss is always less than that of the corresponding gain, illus-
trating the outcome main effect, which was significant
[F(1, 242) = 120.43, p < .001]. This evidence replicates the US findings
of Arkes et al. (2008) and extends this conclusion to other cultures.
When the sale/repurchase intervention is added to the analysis,
there is evidence that the magnitude of this asymmetry differed
across countries, as the culture outcome interaction term was
again marginally significant [F(1, 242) = 3.478, p = .063]. The sale/
repurchase culture interaction was significant [F(1, 242) =
11.73, p = .001]. Whereas the sale/repurchase intervention caused
a small increase in adaptation among the Americans, replicating
Arkes et al. (2008), it caused a decrease in adaptation among the
Asians. For the Americans the sale/repurchase intervention re-
sulted in a higher mean adaptation following both gains and losses,
but for the Asians, the intervention resulted in a lower mean adap-
tation following both gains and losses. The culture main effect was
no longer significant [F(1, 242) = 0.958, p = .329] when we included
reference point adaptations after the sale/repurchase intervention.
Recall that the culture effect was significant when we examined
the base case only, with Asians showing significantly greater adap-
tation than Americans, but the difference became non-significant
after including stocks with intervention. The increase of adaptation
for Americans and the decrease of adaptation for Asians due to the
sale/repurchase intervention narrowed the difference between the
two cultures.
Study 4: questionnaire study of reference point adaptation:
comparing two price paths
A possible criticism of Study 3 is that it relies on the particular
functional form of the cumulative prospect theory value function
(
Tversky & Kahneman, 1992).
Even
if a subject’s preference shows
the three characteristics of prospect theory (reference dependence,
loss aversion, and dual risk attitude), her preferences may not be
best described by the power function we employed. This can be
one of the reasons why we could not solve for the reference point
for some subjects.
A further possible criticism is that, as past studies have pointed
out, the BDM procedure can elicit certainty equivalents of all lot-
teries if and only if the preference relation is represented by an ex-
pected utility framework. However, this problem is not just limited
to the BDM procedure but to all other experimental procedures
(e.g., Nth price auctions). For instance, Karni and Safra (1987) show
that any experimental procedure would fail to elicit the certainty
equivalent of some lotteries for some reasonable preference rela-
tions. If the BDM procedure fails to solicit the certainty equivalent
of the gamble accurately for some subjects, it can also contribute to
the unsolvable observations we had in Study 3.
In Studies 4 and 5, we used two new questionnaire designs as
alternative ways to elicit reference points. Both designs do not rely
on the particular form of prospect value functions to solve for refer-
ence points. In one, we inferred reference points in a way similar to
Study 1 but used a benchmark scenario. In the other, we directly
solicited subjects’ reference points using a question similar to that
of Baucells et al. (2010). Although we do not need the value function
parameters to estimate the reference points in Studies 4 and 5, we
verified our previous findings in Study 2 using the same subject pool.
Method
Subjects
The participants were undergraduate students at Florida State
University and DePaul University in the United States (154 sub-
jects), Ximen University and Guizhou Normal University in China
(82 subjects), and Chosun University in Korea (46 subjects). All
subjects were business majors, either college sophomores or ju-
niors. The data from three US subjects and two Korean subjects
were deleted either due to suspected entry errors or missing obser-
vations for one of the pair questions. After deleting these subjects,
54.8% of the Asian subjects (69 out of 126) and 59.6% of the US sub-
jects (90 out of 151) were male.
The subjects answered brief questionnaires in an online survey
or in a classroom setting. All students voluntarily filled out the
questionnaires for a raffle prize within each class. In the US, the
prize was $20. In Korea, this amount was 50,000 KRW (Korean
Won), and in China, it was ¥100 (RMB). These amounts were deter-
mined by communicating with local professors to ensure a suffi-
cient number of participants. As in Studies 1–3, the numbers in
the questionnaires of Studies 4 and 5 were converted into Korean
currency by multiplying them by 1000, and into Chinese currency
by changing the label of the currency.
Materials
Each subject answered a pair of questions (gain and loss) per-
taining to either the base case (1) or the intervention case (2).
We also asked subjects questions that were used in Study 2 about
loss aversion and risk aversion in the gain/loss domains.
(1) Base case scenario (parentheses for the loss case)
The following two possible scenarios describe the stock price
2 months ago, 1 month ago, and then today. In each scenario, we
Table 3
Mean reference point adaptation to $6 gain/loss: base and intervention (Study 3).
Gain
(base)
Loss
(base)
Gain
(intervention)
Loss
(intervention)
Requiring observations for the base case only
Asia (n = 172) 6.66 5.50
US (n = 119) 6.61 4.94
Total 6.64 5.27
Requiring observations for both the base and the intervention cases
Asia (n = 148) 6.65 5.54 6.41 5.10
US (n = 96) 6.62 4.92 6.77 5.06
Total 6.64 5.30 6.55 5.08
Note: These mean reference point adaptations are calculated using the mean loss
aversion coefficients (k) for each culture (1.55 for Asia, 1.89 for the US; see Table 2)
and
a
= 0.5.
H.R. Arkes et al. / Organizational Behavior and Human Decision Processes 112 (2010) 99–111
105

are interested in the emotional impact on you of learning the final
stock price.
Scenario I:
Two months ago: You purchased 100 shares of stock A for $50
per share.
One month ago: You found out that Stock A’s price was $60
($40) per share.
Today: You find out that Stock A’s price is $X per share.
Scenario II:
Two months ago: You purchased 100 shares of stock A for $50
per share.
One month ago: You found out that Stock A’s price did not
change; it was still trading at $50 per share.
Today: You find out that Stock A’s price is $55 ($45) per share.
Indicate the price of A today ($X) in Scenario I that would make
you feel equally (dis)satisfied as the stock price of $55 ($45) in
Scenario II.
(2) With the sale intervention: the question is the same as the
base case in (1) except for Scenario I (change indicated in
italics):
Two months ago: You purchased 100 shares of stock A for $50
per share.
One month ago: You found out that Stock A’s price was $60
($40) per share. You sold 100 shares of stock A for $60 ($40) per
share, locking in the gain (realizing the loss). Then you purchased
100 shares of another stock, C, for $60 ($40) per share.
Today: You find out that Stock C’s price is $X per share.
Indicate the price of C today ($X) in Scenario I that would make
you feel equally (dis)satisfied as the stock A’s price of $55 ($45)
in Scenario II.
Results and discussion
If R
1
is the reference point with a prior gain/loss (Scenario I) and
R
0
is the reference point without a prior outcome (Scenario II), we
can set up the following equation, since subjects feel equally about
the final stock price in Scenarios I and II:
VðX R
1
Þ¼Vð55 R
0
Þ for the gain scenario;
¼ Vð45 R
0
Þ for the loss scenario:
Like Study 1, we can compute the change in the reference point
assuming that the shape of the value function is constant:
X R
1
¼ 55ð45ÞR
0
) R
1
R
0
¼ X 55 ð45Þ
Again the change in reference points after losses is multiplied
by -1 to obtain adaptation to past losses. Table 4 reports the aver-
age reference point adaptation from four questions (base/interven-
tion, gain/loss). First, we focused on the data generated without the
stock sale intervention to compare the result with that of Study 1.
We performed a 2 (culture: Asia, US) 2 (outcome: gain, loss) AN-
OVA on the magnitude of adaptation. The outcome effect was sig-
nificant [F(1, 158) = 4.753, p = .031], indicating greater adaptation
following gains compared to losses. Asians show greater adapta-
tion than do Americans as the between-subject factor, culture,
was significant [F(1, 158) = 8.841, p = .003]. We also performed a
2 (culture: Asia, US) 2 (outcome: gain, loss) 2 (sale interven-
tion: yes, no) ANOVA on the magnitude of reference point adapta-
tion. Culture and the sale intervention were between-subjects
factors.
Again, we found greater adaptation to gains than losses: the
outcome main effect was significant [F(1, 273) = 13.69, p < .001].
The sale intervention culture interaction was significant
[F(1, 273) = 7.64, p = .006]. The sale intervention increased the
average adaptation among the Americans while decreasing it
among the Asians. As a result, the difference in adaptation between
the two cultures became smaller and the culture main effect was
no longer significant [F(1, 273) = 0.869, p = .352]. The results are
consistent with what we found in Study 3.
We also found that the loss aversion parameter was smaller
among Asians than among Americans in this subject pool, replicat-
ing our finding in Study 2. The average loss aversion was 1.88 for
Asians and 2.88 for Americans, with the difference being statisti-
cally significant [t(266) = 2.98, p = .003]. The exponent (alpha) esti-
mate is closer to 1.0 for Asians than for Americans, although the
difference between the two cultures is not statistically significant
(0.86 for both gain and loss domain among Asians, 0.80 in the gain
domain and 0.70 in the loss domain among Americans), similar to
our findings in Study 2.
Study 5: questionnaire study of reference point adaptation
following Baucells et al. (2010)
Study 5 questions were adopted from Baucells et al. (2010) who
deemed the reference point to be the selling price the makes the
subject neither happy nor unhappy about the sale of a stock.
Method
Subjects
Study 5 was run together with Study 4 in China and Korea, so
the Asian subjects of Study 5 are identical to those in Study 4. In
the US 172 undergraduate students at Florida State University
and DePaul University participated in the study. A subset of the
US subjects in Study 5 also participated in Study 4 (130 out of
172). The data from three US subjects and two Korean subjects
were deleted due to a suspected entry error or missing observa-
tions for one of the pair questions. Of the US subjects 55.6% were
male (94 out of 169), comparable to the percentage of male sub-
jects (54.8%) in Asia. Like Study 4, the subjects answered brief
questionnaires in an online survey or in a classroom setting for a
raffle prize of $20 (US), 50,000 KRW (Korea), and ¥100 (China).
Materials
(1) Base case
A few days ago, you purchased stock A at $30 per share and
went on vacation on the same day. During your vacation you could
not monitor the price of the stock.
Today, while waiting for your 14-h flight home, you see on the
airport TV that the current price of stock A is $35 ($25) per share!
You ask yourself how you would feel if you were going to sell stock
A when you return home.
At what selling price would you feel neither happy nor unhappy
about the sale of stock A? In other words, please indicate the sell-
Table 4
Mean reference point adaptation: base and intervention (Study 4).
Gain
(base)
Loss
(base)
Gain
(intervention)
Loss
(intervention)
Asia 6.30 4.54 6.34 2.70
(n = 67) (n = 59)
US 3.41 2.52 6.71 4.77
(n = 93) (n = 58)
Total 4.62 3.36 6.52 3.73
Note: Each subject answered either the base case scenarios or the intervention
scenarios.
106 H.R. Arkes et al. / Organizational Behavior and Human Decision Processes 112 (2010) 99–111

ing price at which you would neither have positive nor negative
emotions about the sale of stock A.
(2) With the sale intervention
The question is the same as in (1) except that, after ‘‘you see on
the airport TV that the current price of stock A is $35 ($25) per
share,” we added ‘‘You call your broker and tell him to sell stock A
at $35 ($25) per share and buy stock B that is also trading at $35
($25) per share.” For approximately half of the subjects we replaced
‘‘Stock A” with ‘‘Stock B” in the final two sentences.
Results and discussion
Subjects’ answers to the question can be interpreted as their
reference points after a $5 gain/loss per share. Therefore we com-
pute the magnitude of reference point adaptation as (X 30) for
the gain scenario and (30 X) for the loss scenario, where X is
the selling price that makes the subject neither happy nor unhap-
py. Table 5 reports the average adaptation.
The ANOVA showed that most results from Study 5 are qualita-
tively the same as those of Studies 1, 3, and 4: There was a signif-
icant asymmetry in adaptation, Asians showing greater adaptation
than Americans in the base case, but the difference disappeared
when we add the reference point adaptation data with the inter-
vention. Using the data generated by the base case without the sale
intervention, a 2 (culture: Asia, US) 2 (outcome: gain, loss) ANO-
VA showed a significant outcome effect [F(1, 133) = 24.54, p < .001]
and also a significant culture effect [F(1, 133) = 4.055, p = .046].
After adding the data on the magnitude of reference point adap-
tation with the intervention, a 2 (culture: Asia, US) 2 (outcome:
gain, loss) 2 (sale intervention: yes, no) ANOVA showed a signif-
icant outcome effect [F(1, 291) = 58.56, p < .001], a significant
sale culture interaction effect [F(1, 291) = 5.63, p = .018], but an
insignificant culture main effect [F(1, 291) = 0.045, p = .832]. Con-
sistent with the findings in Studies 1 and 4, adding the sale inter-
vention increased the reference point adaptation significantly
more for Americans than for Asians. However, in this case, adding
the reference point adaptation did not decrease the adaptation for
Asians, as compared to the case without the sale intervention.
The loss aversion parameter is again smaller among Asians
(1.88) than among Americans (2.83) in this subject pool
[t(285) = 2.89, p = .004]. The exponent again follows a similar pat-
tern as in Studies 2 and 4 (0.86 among Asians in both gain and loss
domains, 0.75 for the gain domain and 0.72 for the loss domain
among Americans).
General discussion
There were three main results in our studies. First, the asym-
metric adaptation found in American students by Arkes et al.
(2008) was also found in the Asian participants as well as our
new US subjects. Thus this result appears to generalize across
cultures.
The asymmetric adaptation to gains and losses, according to
Arkes et al. (2008), can be caused by fundamental hedonic pro-
cesses. Specifically, faster adaptation to gains than to losses results
from hedonic benefits of segregating intertemporal gains and inte-
grating intertemporal losses (Thaler,
1985,
1999).
After a gain, updating the reference point modestly upward to
capture part of the gain generates an immediate hedonic benefit
from recognizing the gain, at the cost of reducing any remaining
gains to be experienced. However the increase in the immediate
gain from 0 is in the steep portion of the value function, whereas
the reduction in future gains is from a gently sloping part of the va-
lue function. So due to the concavity of the value function within
the region of gains, this is a net utility increase. For losses, simi-
larly, recognizing part of a loss immediately has an immediate he-
donic cost, and by the convexity of the value function in the realm
of losses, this cost outweighs the benefit of reducing future losses.
So no updating is preferred to updating after losses. While the he-
donic maximization suggests a partial adaptation after a gain and
no adaptation after a loss, the sense of reality is likely to encourage
adaptation toward the current state in both directions. Therefore
we are likely to see some extent of adaptation in both directions,
with a greater adaptation after a gain than after a loss.
The goal of such ‘‘affective engineering” is hedonic maximiza-
tion. We hypothesize that culture would have a minimal role to
play in the pursuit of this goal. Thus we expect to observe asym-
metric adaptation to gains and losses in all countries.
The second main finding was that, without the sales and repur-
chase intervention, adaptation to prior outcomes was greater
among Asians than among Americans. This result may be caused
by different impacts of culture on balancing the two forces deter-
mining the new reference point—recognizing the current state
and deviating from it in order to maximize hedonic utility.
We conjecture that there are two culture-related reasons that
influence this balance. First, faster adaptation among Asians can
be attributed to the smaller loss aversion among Asians that
encourages greater adaptation to increase hedonic utility. Based
on the model of reference point updating explained above, smaller
loss aversion facilitates adaptation to a loss since segregation of a
prior loss is now less painful. It also encourages adaptation to a
gain since it reduces the negative impact of a possible subsequent
loss; updating of the reference point means that a subsequent loss
will occur in the flatter portion of the gain function rather than in
the relatively steep portion close to the origin of the graph where a
person would be if no updating had occurred.
8
Second, cross-cultural research has shown that in many respects
East-Asians hold a fundamentally different viewpoint than Ameri-
cans (e.g., Nisbett, 2004), a viewpoint which might encourage
Asians to move the new reference point closer to the current stock
price than Americans would do. East-Asians view the world as com-
plex and highly changeable with interrelated components where
individuals are less able to impact the course of an event. In con-
trast, Americans view the world consisting of discrete, indepen-
dent, and stable objects where each individual is in control of
their own behavior and the consequence of such behavior (Ji
et al., 2000). Such viewpoints lead to Asians’ more malleable and
Americans’ more stable preferences and personalities (Norenzayan,
Table 5
Mean reference point adaptation: base and intervention (Study 5).
Gain
(base)
Loss
(base)
Gain
(intervention)
Loss
(intervention)
Asia 4.05 0.43 4.69 1.44
(n = 59) (n = 67)
US 1.65 1.12 4.89 2.66
(n = 76) (n = 93)
Total 2.70 0.82 4.81 2.15
Note: Each subject answered either the base case scenarios or the intervention
scenarios.
8
It was suggested that cross-cultural differences in reference point adaptation
might be caused by cultural differences in the cognitive ability of the subjects. In an
unreported study using US participants (available upon request), we found no
significant relationship between the magnitude/asymmetry of reference point
adaptation and a measure of cognitive ability (Frederick, 2005). Therefore a difference
in cognitive ability is unlikely to be responsible for the cultural differences we report
here
H.R. Arkes et al. / Organizational Behavior and Human Decision Processes 112 (2010) 99–111
107
Choi, & Nisbett, 2002). As Hsu (1981, p. 13) noted, ‘‘the Chinese
tends to mobilize his thought and action for the purpose of con-
forming to the reality, while the American tends to do so for the
purpose of making the reality conform to him.” These cultural dif-
ferences suggest that, in the tradeoff between conforming to reality
and hedonic maximization that involves personal control, Asians
are likely to be dictated by the former while Americans by the lat-
ter. Thus, reference points tend to adapt more readily among Asians
than among Americans.
As for the third finding, the insertion of the stock sale interven-
tion facilitated adaptation in the US significantly more than that in
the two Asian countries. This cross-cultural difference is reflected
in a Chinese proverb, ‘‘A good fortune may forebode bad luck,
which may in turn disguise a good fortune,” that describes the be-
lief of Chinese in reversals. This effect is particularly strong in Stud-
ies 3 and 4, where Asians’ reference point adaptation is decreased
when the intervention is introduced while that of Americans is in-
creased. In Study 5, however, the intervention slightly increased
the adaptation of Asians while increasing adaptation of Americans
to a greater extent. In other words, although the intervention
caused greater adaptation in the Americans – again replicating
Arkes et al. (2008) – it had a much milder, sometimes an opposite
effect, among Asians. We hypothesize that two factors are respon-
sible for this result.
The first factor is the one that motivated the use of this inter-
vention. Arkes et al. (2008) hypothesized that by having the subject
sell the stock and realize the paper gain/loss, the new price at
which their gain or loss occurs becomes more salient. This encour-
ages adaptation from the original price toward that new price at
which the sale and new purchase occurs. Indeed, that is what hap-
pened in the American sample in Arkes et al. (2008) and consis-
tently occurs to our American sample in this manuscript.
The second factor is discussed by Ji, Peng, et al. (2000) and Ji,
Nisbett, et al. (2001). Ji, Peng, et al. (2000) showed that compared
to Americans, Asians thought that there were stronger associations
between objects, consistent with the notion that East-Asians pay
more attention to the field and the interaction between objects.
In contrast, Americans viewed objects as more independent identi-
ties. In our experimental setting the two outcomes – one being the
prior outcome payoff and the other being the new gain or loss –
may be viewed by Americans as relatively independent. Thus, the
outcome payoff in the old mental account becomes distant and less
relevant once the new mental account is established, with the new
purchase price serving as a salient cue for the new reference point.
In contrast, while East-Asians may also close the old and open the
new mental account to some extent, they are likely to feel the tug
of the prior reference point more than the Americans would and
not dismiss it as an independent and irrelevant separate entity.
Depending how a scenario is framed and presented, a strong
contrarian view in prediction among Asians can be triggered. Ji
et al. (2001) demonstrated in a very wide variety of assessment
tasks that Chinese persons, to a significantly greater extent than
Americans, anticipated that circumstances would change. For
example, Chinese subjects, more than Americans, expected a chess
champion to lose the next match, bickering children to eventually
become lovers, and dating couples to break up. Ji et al. (2008)
showed that this contrarian tendency also applied strongly to Chi-
nese participants’ beliefs about future stock prices. Such a belief
would foster exactly the results we obtained, namely less adapta-
tion to the new price when it is emphasized via a sale and new pur-
chase manipulation. This is due to the fact that in our experimental
setting the sale intervention makes that outcome more salient and
thus more strongly triggers the contrarian prediction of Asians. If
the first price change is positive, Asian participants will have a
somewhat greater expectation of an adverse outcome. Therefore,
they will be unwilling to adapt their reference point upward sub-
stantially; by adapting sluggishly, they add a cushion to their men-
tal account against the greater possibility of a future loss. In the
case with a prior loss, Asians will expect a greater likelihood of a
future gain. By adapting less aggressively to the prior loss, Asians
will anticipate this future gain and use part of it to offset part of
the prior loss. Thus we expect Asian subjects to adapt less to either
prior outcome than Americans after a sale and new purchase inter-
vention, due to the contrarian tendency demonstrated by Ji et al.
(2008).
Within the stock trading experiment in Study 3, subjects were
informed of possible up and down states of future prices. In Sce-
nario II of Study 4 subjects were presented in the gain frame, for
example, with no change in the $50 price from the first to the
second period and then a gain to $55 for the third period ($50–
$50–$55). Subjects also read Scenario I in which there was a gain
from $50 to $60 from the first to the second period. They were
then asked what price during the third period of Scenario I would
make then just as happy as the third period price of $55 in Sce-
nario II ($50–$60–?). To answer this question subjects would
have to consider the possibility of a reversal, that is, a lowering
of the third period price in Scenario I. By presenting cues of a
possible
future
price reversal, we hypothesize that the contrarian
predilection of Asians is likely to be strengthened under either
the Studies 3 or 4 methodologies. Thus, the sale intervention
would impede adaptation to the new outcome for Asians, as we
explained above. In Study 5, however, no future or alternate pros-
pect whatsoever is specified, so the contrarian tendency of Asians
is likely to be weaker. Therefore in Study 5 use of the new pur-
chase price as the reference point can eclipse the Asians’ usual
contrarian view to some extent, thereby resulting in a slight in-
crease in reference point adaptation. Nevertheless, in all studies,
the increase in adaptation is much greater for Westerners than
for Easterners, suggesting that for Americans the dominant factor
is the realization of paper gains/losses which helps close the old
mental account and shifts the new reference point toward the
new purchase price.
We suggest that reference point adaptation is influenced by
many external and internal factors. Its cross-cultural variations
encompass a broad set of causes and consequences. Despite the
several new findings presented in this manuscript, our knowledge
of cross-cultural patterns in the static and dynamic properties of
prospect theory or other reference-dependent preferences re-
mains quite limited. Therefore this domain seems ripe for future
research. In particular, it may be helpful to study reference point
updating and its effects using field data such as investor trading
records, aggregate market prices, and analysts’ forecasts of
earnings.
Acknowledgments
We appreciate the helpful comments of David Budescu, David
Cooper, and participants at the Society for Judgment and Decision
Making annual conference in Houston, Texas in November of 2006,
the Carnegie-Mellon Department of Social and Decision Science
colloquium, The Ohio State University SBIG colloquium in the
Department of Psychology, the Experimental Social Science Re-
search group at Florida State University, and the Behavioral Deci-
sion Research in Management conference hosted by UCSD Rady
School of Management in April of 2008. We thank Michelle Qu
and McKay Price for helpful research assistance and Jin Wan Cho,
Joon Ho Hwang, Yun-Yong Hwang, Dong Wook Lee, Hyunhan Shin,
Chaopeng Wu, Shujun Zhang, Wei Zhao, Yan Wei, and Zilong Xie
for their coordination in recruiting subjects. We are grateful for
the financial support from the Program in Decision, Risk, and Man-
agement Science at the National Science Foundation (0339178 and
0339052).
108 H.R. Arkes et al. / Organizational Behavior and Human Decision Processes 112 (2010) 99–111
Appendix A
A.1. Robustness check of results in Study 3
We reported three major findings from Study 3. First, reference
points adapted more to a gain than to an equal-sized loss. Second,
adaptation to a prior outcome was greater among Asians than
Americans when there was no sale and repurchase intervention.
Third, the sale/repurchase intervention appeared to increase adap-
tation among Americans but decrease it among Asians. The results
from our stock trading data are obtained using
a
= 0.5 and culture-
specific mean loss aversion (1.55 for Asians, 1.89 for Americans) for
the value function. In this Appendix, we assess whether our results
are robust to our assumptions concerning the parameter values.
Do the choices of
a
and k matter?
We used k estimated from Study 1 and
a
= 0.5 to obtain a sizable
dataset in Study 3. Our choice of parameters can raise a concern be-
cause our estimates for k may contain some estimation errors and
using
a
that is rather small compared to our estimates and also
those of other studies. For robustness, we also calculated implied
adaptation based on various combinations of
a
and k for each cul-
ture to check if our findings are sensitive to parameter values. The
a
ranges from 0.2 to 0.9 with 0.1 increments and the k ranges from
1.25 to 2.50 with 0.25 increments, resulting in a total of 8 6=48
combinations for each culture. We summarize the findings below.
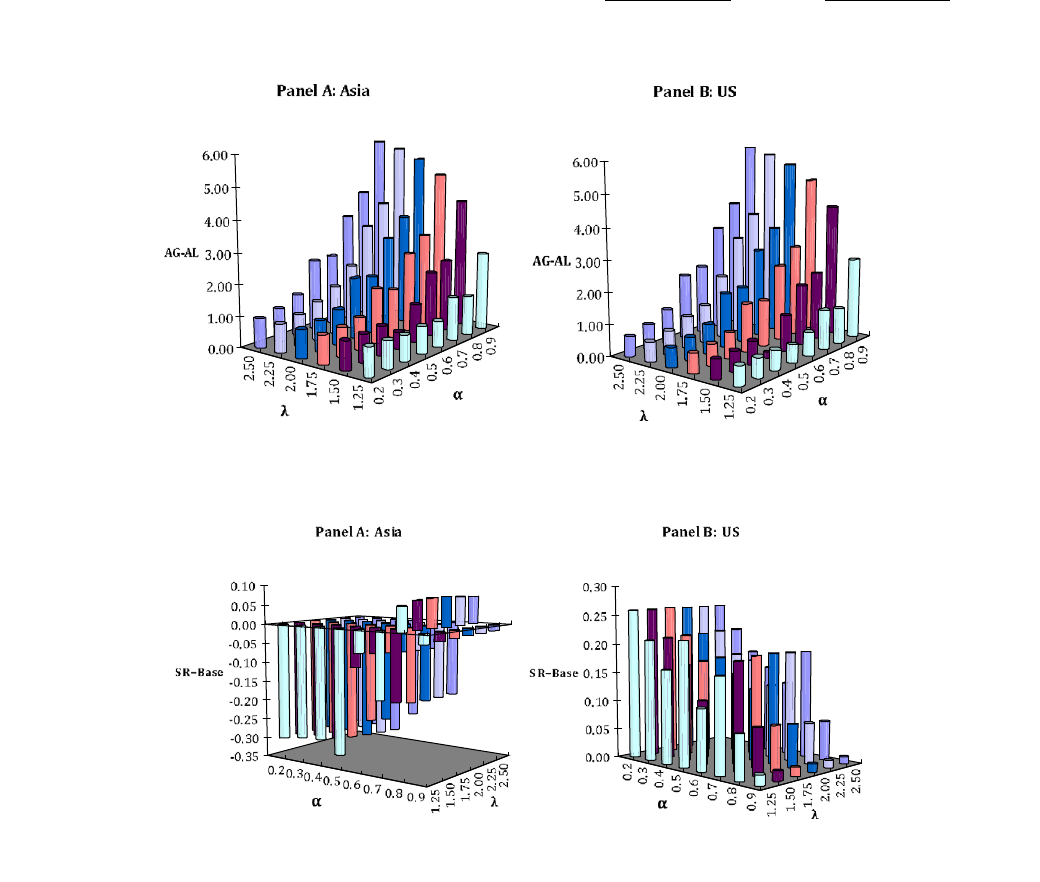
First, we find asymmetric adaptation for all parameter combi-
nations and in both cultures (Fig. A1). However, the percentage
of solvable observations decreases from over 90% to less than
10% as
a
increases from 0.2 to 0.9. Second, the intervention in-
creases adaptation among the US subjects in all parameter combi-
nations, while it decreases adaptation among Asian subjects in all
parameter combinations except when
a
= 0.8 (Fig. A2). Third, in the
base case, the average adaptation to prior outcomes is greater
among Asians than among Americans, except for the very high va-
lue of alpha (0.8 and 0.9; Fig. A3). However, the solvable observa-
tions are only 20–30% of the full sample within that very high
range of alpha, which makes the inference within that range less
reliable. When an alpha is less than 0.6, the results are similar. This
is the case even if we allow for the slight difference in the alphas
for the gain versus the loss domain. Overall, the results show that
our conclusions are generally quite robust to variations of the
parameter values.
Does the use of the probability weighting function matter?
Tversky and Kahneman (1992) suggest that individuals use
probability weighting functions, instead of the actual probability,
to weight different prospect outcome payoffs. The probability
weighting functions take the following form:
w
þ
ðpÞ¼
p
c
ðp
c
þð1 pÞ
c
Þ
1=
c
; w
ðpÞ¼
p
d
ðp
d
þð1 pÞ
d
Þ
1=d
;
Fig. A2. The effect of the sale/repurchase intervention on reference point adaptation in Study 3 using different values of k and
a
, separately for Asians (Panel A) and for
Americans (Panel B). The effect of sale/repurchase intervention is measured by SR-Base, which refers to the difference between the adaptation with the sale/repurchase
intervention and that in the base case averaged across the gain and loss cases. k refers to the culture-specific loss aversion coefficient, and
a
refers to the culture-specific.
Fig. A1. Asymmetry in reference point adaptation (AG-AL) in the base case of Study 3 using different values of k and
a
separately for Asians (Panel A) and for Americans
(Panel B). The asymmetry in reference point adaptation is defined as the adaptation to gains minus the adaptation to losses (AG-AL). k refers to the culture-specific loss
aversion coefficient, and
a
refers to the cultural-specific exponent.
H.R. Arkes et al. / Organizational Behavior and Human Decision Processes 112 (2010) 99–111
109
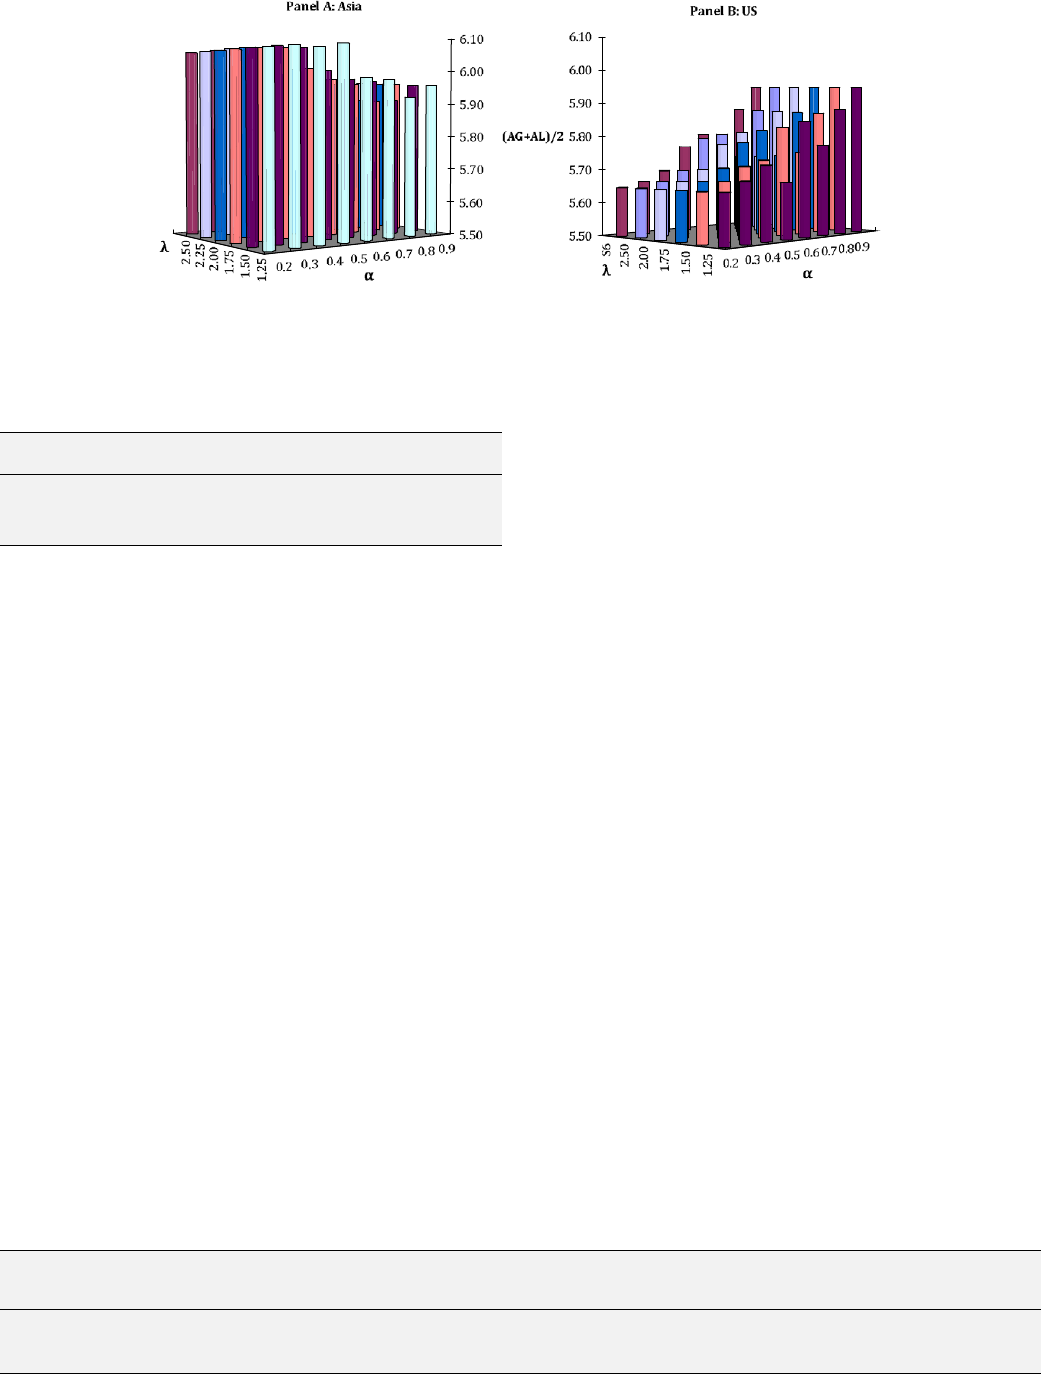
where
c
is estimated as 0.61, and d as 0.69. In our context, subjects
dealt with a positive prospect with probability 0.5, implying a
weight of 0.32, and a negative prospect with the same probability,
implying a weight of 0.37. Shown in Table A1, the results are similar
to those in Table 3. Using a 2 (culture: Asia, US) 2 (outcome: win,
loss) 2 (sale/repurchase intervention: yes, no) ANOVA on the
magnitude of adaptation, we found that the outcome main effect
was significant [F(1, 311) = 98.616, p < .001] as was the sale/repur-
chase culture interaction [F(1, 311) = 18.91, p < .001]. Also, the
culture main effect was significant [F(1, 311) = 4.067, p = .045].
Does individual heterogeneity in loss aversion and the exponent
matter?
We observed some degree of heterogeneity among subjects in
our questionnaire studies on the parameter estimates (Study 2).
However, the questionnaire studies and the stock trading experi-
ments were conducted at different times with different subjects.
Therefore, to infer their reference points, we had to apply the mean
parameters for each culture from Study 2 on all subjects of the
same culture in Study 3. We examine whether or not our results
are robust to possible individual heterogeneity within each culture.
We employed simulations to assess the sensitivity of our results
to individual heterogeneity. Specifically, for each subject, we ran-
domly drew
a
from a uniform distribution [0.1, 0.9] and k from a
uniform distribution [1.5, 2.5]. Using individual-specific parame-
ters, we solved for their reference points, and calculated the mean
adaptation across subjects for each stock within each culture. For
comparison, we computed the mean of the randomly generated
a
and k across subjects within each culture for each simulation,
and used those mean parameters to solve for individual adaptation
and mean adaptation within a culture. In other words, the former
method follows an ideal approach that applies individual parame-
ters, while the latter mirrors our procedures that applies the same
parameter values to all individuals within each culture. If the latter
generates results similar to the former, we can safely conclude that
our results are robust to possible individual heterogeneity within
each culture. We tested for the validity of our three main re-
sults—the presence of the asymmetry of adaptation in both cul-
tures, greater adaptation to prior outcomes among Asians than
Americans, and the opposite impacts of the sale/repurchase event
on the two cultures.
We summarize our results based on 1000 simulations. First, for
all simulations, and using both methods of assigning parameter
values on each individual, we obtained greater adaptation to gains
than losses in both cultures. Second, for all simulated results we
found greater adaptation among Asians using either method, sug-
gesting that greater adaptation of Asians compared to the Ameri-
cans is quite robust even we consider individual heterogeneity.
Third, both methods show that the sales-repurchase intervention
accelerated adaptation for Americans but decreased adaptation for
Asians for 99.1% of simulations (see Table A2). For the remaining
0.9% of the simulations, the results using individual parameters
indicated that the intervention increased (0.2%) or decreased
(0.7%) adaptation for both cultures, while the results using cul-
ture-mean parameters indicated that the intervention increased
adaptation for Americans but decreased adaptation for Asians.
Thus the results suggest that using group-mean parameters may
have slightly strengthened the opposite effects of the intervention
on adaptation between the two cultures, but the possible effect is
likely to be within a margin of error (only 0.9%).
Table A1
Reference point adaptation with probability weighting function (Study 3).
Gain
(base)
Loss
(base)
Gain
(intervention)
Loss
(intervention)
Asia (n = 175) 6.60 5.53 6.38 5.18
US (n = 138) 6.14 5.23 6.30 5.45
Total 6.39 5.40 6.35 5.30
Note: These mean reference point adaptations are calculated using the mean loss
aversion coefficients (k) for each culture (1.55 for Asia, 1.89 for the US; see Table 2),
a
= 0.5, and the probability weighting function that gives the positive prospect with
probability 0.5 the weight 0.32, and the negative prospect with probability 0.5 the
weight 0.37.
Table A2
Reference point adaptation with individual parameters vs. country mean parameters: the intervention effect (Study 3).
Intervention accelerates adaptation
for Asians, using individual
parameters
Intervention accelerates
adaptation for Asians, using
culture-mean parameters
Intervention accelerates
adaptation for Americans,
using individual parameters
Intervention accelerates adaptation
for Americans, using culture-mean
parameters
# Simulations (Total: 1000)
NNNY7
N N Y Y 9991
YNYY2
Fig. A3. The average of adaptation to a gain and adaptation to a loss, (AG+AL)/2, in the base case in Study 3 using different values of k and
a
, separately for Asians (Panel A)
and for Americans (Panel B). k refers to the culture-specific loss aversion coefficient, and
a
refers to the culture-specific exponent.
110 H.R. Arkes et al. / Organizational Behavior and Human Decision Processes 112 (2010) 99–111
References
Arkes, H. R., & Blumer, C. (1985). The psychology of sunk cost. Organizational
Behavior and Human Decision Processes, 35, 124–140.
Arkes, H. R., Hirshleifer, D., Jiang, D., & Lim, S. S. (2008). Reference point adaptation:
Tests in the domain of security trading. Organizational Behavior and Human
Decision Processes, 105, 67–81.
Barberis, N., & Huang, M. (2001). Mental accounting, loss aversion, and individual
stock returns. Journal of Finance, 56, 1247–1292.
Barberis, N., & Xiong, W. (2009). What drives the disposition effect? An analysis of a
long-standing preference-based explanation. Journal of Finance, 64, 751–784.
Bartels, D. M. (2006). Proportion dominance: The generality and variability of
favoring relative savings over absolute savings. Organizational Behavior and
Human Decision Processes, 100, 76–95.
Baucells, M., Weber, M., & Welfens, F. (2010). Reference point formation and
updating: Theory and experiments. Working paper, University of Mannheim.
Becker, G. M., DeGroot, M. H., & Marschak, J. (1964). Measuring utility by a single-
response sequential method. Behavioral Science, 9, 226–232.
Bernartzi, S., & Thaler, R. H. (1995). Myopic loss aversion and the equity premium
puzzle. Quarterly Journal of Economics, 110, 73–92.
Brislin, R. (1986). The wording and translation of research instruments. In W. J.
Lonner & J. W. Berry (Eds.), Field methods in cross-cultural research methodology
series (pp. 137–164). Beverly Hills, CA: Sage Publications.
Chen, H., & Rao, A. (2002). Close encounters of two kinds: False alarms and dashed
hopes. Marketing Science, 21, 178–196.
Chui, A. C. W., Titman, S., & Wei, K. C. J. (2010). Individualism and momentum
around the world. Journal of Finance, 65, 361–392.
Dimson, E., Marsh, P., & Staunton, M. (2008). Worldwide equity premium: A smaller
puzzle. In R. Mehra (Ed.), Handbook of the equity risk premium (pp. 467–514).
Amsterdam: Elsevier.
Fama, E. F., & French, K. R. (1998). Value versus growth: The international evidence.
Journal of Finance, 53, 1975–1999.
Feng, L., & Seasholes, M. S. (2005). Do investor sophistication and trading experience
eliminate behavioral biases in financial markets? Review of Finance, 9, 305–351.
Frederick, S. (2005). Cognitive reflection and decision making. Journal of Economic
Perspectives, 19(4), 25–42.
Gneezy, U. (2005). Updating the reference point: Experimental evidence. In R. Zwick
& A. Rapoport (Eds.). Experimental business research marketing, accounting and
cognitive perspectives (Vol. III, pp. 263–284). Dordrecht, The Netherlands:
Springer.
Grinblatt, M., & Han, B. (2005). Prospect theory, mental accounting, and
momentum. Journal of Financial Economics, 78, 311–339.
Grinblatt, M., & Keloharju, M. (2001). What makes investors trade? Journal of
Finance, 56, 589–616.
Hardie, B. G. S., Johnson, E. J., & Fader, P. S. (1993). Modeling loss aversion and
reference dependence effects on brand choice. Marketing Science, 12(4),
378–394.
Heath, C., Huddart, S., & Lang, M. (1999). Psychological factors and stock option
exercise. Quarterly Journal of Economics, 114, 601–627.
Heath, C., Larrick, R. P., & Wu, G. (1999). Goals as reference points. Cognitive
Psychology, 38, 79–109.
Hsee, C. K., & Weber, E. U. (1999). Cross-national differences in risk preference and
lay predictions. Journal of Behavioral Decision Making, 12, 165–179.
Hsu, F. L. K. (1981). Americans and Chinese: Passage to differences (3rd ed.). Honolulu:
University of Hawaii Press.
Ji, L.-J., Nisbett, R. E., & Su, Y. (2001). Culture, change, and prediction. Psychological
Science, 12, 450–456.
Ji, L.-J., Peng, K., & Nisbett, R. E. (2000). Culture, control, and perception of
relationships in the environment. Journal
of
Personality and Social Psychology, 78,
943–955.
Ji, L.-J., Zhang, Z., & Guo, T. (2008). To buy or to sell: Cultural differences in stock
market decisions based on price trends. Journal of Behavioral Decision Making,
21, 399–413.
Kahneman, D., & Tversky, A. (1979). Prospect theory: An analysis of decision under
risk. Econometrica, 47, 263–292.
Karni, E., & Safra, Z. (1987). Preference reversals and the observability of preference
by experimental methods. Econometrica, 55, 675–685.
Keasey, K., & Moon, P. (1996). Gambling with the house money in capital
expenditure decisions: An experimental analysis. Economics Letters, 50,
105–110.
Mas, A. (2006). Pay, reference points, and police performances. Quarterly Journal of
Economics, 121, 783–821.
Morris, M. W., & Peng, K. (1994). Culture and cause: American and Chinese
attributions for social and physical events. Journal of Personality and Social
Psychology, 67, 949–971.
Nisbett, R. E. (2004). The geography of thought: How Asians and Westerners think
differently... and why. New York: Free Press, Simon & Schuster, Inc.
Norenzayan, A., Choi, I., & Nisbett, R. E. (2002). Cultural similarities and differences
in social inference: Evidence from behavioral predictions and lay theories of
behavior. Personality and Social Psychology Bulletin, 28, 109–120.
Rouwenhorst, K. G. (1998). International momentum strategies. Journal of Finance,
53, 267–284.
Shefrin, H., & Statman, M. (1985). The disposition to sell winners too early and ride
losers too long: Theory and evidence. Journal of Finance, 40, 777–790.
Strahilevitz, M. A., & Loewenstein, M. (1998). The effect of ownership history on the
valuation of objects. Journal of Consumer Research, 25, 276–289.
Thaler, R. H. (1985). Mental accounting and consumer choice. Marketing Science, 4,
199–214.
Thaler, R. H. (1999). Mental accounting matters. Journal of Behavioral Decision
Making, 12, 183–206.
Tversky, A., & Kahneman, D. (1992). Advances in prospect theory: Cumulative
representation of uncertainty. Journal of Risk and Uncertainty, 5, 297–
323.
Weber, M., & Camerer, C. F. (1998). The disposition effect in securities trading: An
experimental analysis. Journal of Economic Behavior & Organization, 33,
167–184.
Weber, E. U., & Hsee, C. K. (1998). Cross-cultural differences in risk perception, but
cross-cultural similarities in attitudes towards risk. Management Science, 44,
1205–1217.
Yates, J. F., Lee, J.-W., & Shinotsuka, H. (1996). Beliefs about overconfidence,
including its cross-national variation. Organizational Behavior and Human
Decision Processes, 65, 138–147.
H.R. Arkes et al. / Organizational Behavior and Human Decision Processes 112 (2010) 99–111
111
