
2022 Annual Report
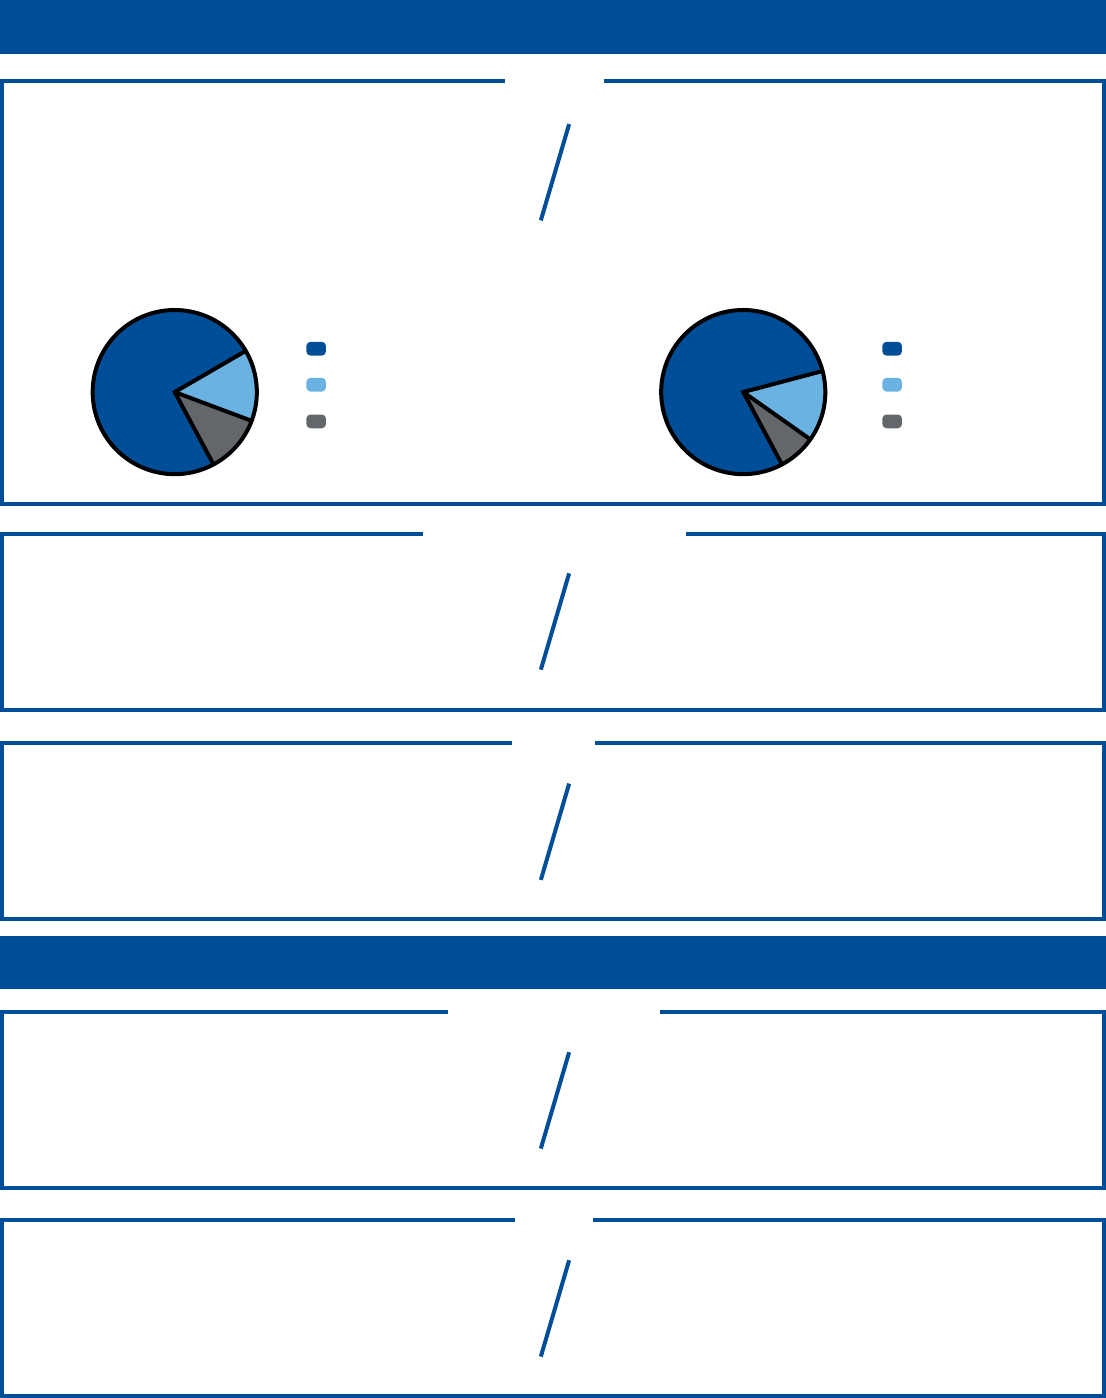
2022 AT A GLANCE | REPORTED RESULTS
Sales by Segment Sales by Geography
MILLION v PY
v PY
v PY
v PY
v PY
Off Road United States
On Road International
Marine Canada
$8,589
22.8%
12.5%
$10.04
$10.40
+15%
-72
bps
-33bps
+27%
+15%
2022 AT A GLANCE | ADJUSTED RESULTS
14%
11%
75% 79%
14%
7%
Sales
Gross Prot Margin
EPS*
EBITDA Margin
EPS*
*from Continuing Operations

UNITED STATES
SECURITIES AND EXCHANGE COMMISSION
Washington, D.C. 20549
FORM 10-K
☒ANNUAL REPORT PURSUANT TO SECTION 13 OR 15(d) OF THE SECURITIES EXCHANGE ACT OF 1934
For the fiscal year ended December 31, 2022
OR
☐TRANSITION REPORT PURSUANT TO SECTION 13 OR 15(d) OF THE SECURITIES EXCHANGE ACT OF 1934
Commission file number 001-11411
POLARIS INC.
(Exact name of registrant as specified in its charter)
Minnesota 41-1790959
(State or other jurisdiction of incorporation or organization) (I.R.S. Employer Identification No.)
2100 Highway 55, Medina, Minnesota 55340
(Address of Principal Executive Offices) (Zip Code)
Registrant's telephone number, including area code: (763) 542-0500
Securities registered pursuant to Section 12(b) of the Act:
Title of each class Trading Symbol(s) Name of each exchange on which registered
Common Stock, $.01 par value PII New York Stock Exchange
Securities registered pursuant to Section 12(g) of the Act: None
Indicate by check mark if the registrant is a well-known seasoned issuer, as defined in Rule 405 of the Securities Act. Yes ☒ No ☐
Indicate by check mark if the registrant is not required to file reports pursuant to Section 13 or Section 15(d) of the Act. Yes ☐ No ☒
Indicate by check mark whether the registrant (1) has filed all reports required to be filed by Section 13 or 15(d) of the Securities Exchange Act of
1934 during the preceding 12 months (or for such shorter period that the registrant was required to file such reports), and (2) has been subject to
such filing requirements for the past 90 days. Yes ☒ No ☐
Indicate by check mark whether the registrant has submitted electronically every Interactive Data File required to be submitted pursuant to
Rule 405 of Regulation S-T (§ 232.405 of this chapter) during the preceding 12 months (or for such shorter period that the registrant was required
to submit such files). Yes ☒ No ☐
Indicate by check mark whether the registrant is a large accelerated filer, an accelerated filer, a non-accelerated filer, a smaller reporting company,
or an emerging growth company. See the definitions of “large accelerated filer,” “accelerated filer,” “smaller reporting company” and “emerging
growth company” in Rule 12b-2 of the Exchange Act.
Large accelerated filer ☒Accelerated filer ☐Non-accelerated filer ☐Smaller reporting company ☐Emerging growth company ☐
If an emerging growth company, indicate by check mark if the registrant has elected not to use the extended transition period for complying with
any new or revised financial accounting standards provided pursuant to Section 13(a) of the Exchange Act. ☐
Indicate by check mark whether the registrant has filed a report on and attestation to its management’s assessment of the effectiveness of its
internal control over financial reporting under Section 404(b) of the Sarbanes-Oxley Act (15 U.S.C. 7262(b)) by the registered public accounting
firm that prepared or issued its audit report. ☒
If securities are registered pursuant to Section 12(b) of the Act, indicate by check mark whether the financial statements of the registrant included
in the filing reflect the correction of an error to previously issued financial statements. ☐
Indicate by check mark whether any of those error corrections are restatements that required a recovery analysis of incentive-based compensation
received by any of the registrant’s executive officers during the relevant recovery period pursuant to §240.10D-1(b). ☐
Indicate by check mark whether the registrant is a shell company (as defined in Rule 12b-2 of the Act). Yes ☐ No ☒
The aggregate market value of the registrant’s common stock held by non-affiliates of the registrant was approximately $5,911,815,000 as of
June 30, 2022, based upon the last sales price per share of the registrant’s Common Stock, as reported on the New York Stock Exchange on such
date. As of February 10, 2023, 57,076,372 shares of Common Stock, $.01 par value, of the registrant were outstanding.
DOCUMENTS INCORPORATED BY REFERENCE:
Portions of the definitive Proxy Statement for the registrant’s Annual Meeting of Shareholders to be held on or about April 27, 2023, to be filed
with the Securities and Exchange Commission within 120 days after the end of the fiscal year covered by this report (the “2023 Proxy
Statement”), are incorporated by reference into Part III of this Form 10-K.

POLARIS INC.
2022 FORM 10-K ANNUAL REPORT
TABLE OF CONTENTS
PART I
Item 1. Business . . . . . . . . . . . . . . . . . . . . . . . . . . . . . . . . . . . . . . . . . . . . . . . . . . . . . . . . . . . . . . . . . . . . . . . . . . . 3
Item 1A. Risk Factors . . . . . . . . . . . . . . . . . . . . . . . . . . . . . . . . . . . . . . . . . . . . . . . . . . . . . . . . . . . . . . . . . . . . . . . . 11
Item 1B. Unresolved Staff Comments . . . . . . . . . . . . . . . . . . . . . . . . . . . . . . . . . . . . . . . . . . . . . . . . . . . . . . . . . . . . 19
Item 2. Properties . . . . . . . . . . . . . . . . . . . . . . . . . . . . . . . . . . . . . . . . . . . . . . . . . . . . . . . . . . . . . . . . . . . . . . . . . . 20
Item 3. Legal Proceedings . . . . . . . . . . . . . . . . . . . . . . . . . . . . . . . . . . . . . . . . . . . . . . . . . . . . . . . . . . . . . . . . . . . . 20
Item 4. Mine Safety Disclosures . . . . . . . . . . . . . . . . . . . . . . . . . . . . . . . . . . . . . . . . . . . . . . . . . . . . . . . . . . . . . . . 21
PART II
Item 5.
Market for Registrant’s Common Equity, Related Stockholder Matters and Issuer Purchases of Equity
Securities . . . . . . . . . . . . . . . . . . . . . . . . . . . . . . . . . . . . . . . . . . . . . . . . . . . . . . . . . . . . . . . . . . . . . . . . . . . 22
Item 6. [Reserved] . . . . . . . . . . . . . . . . . . . . . . . . . . . . . . . . . . . . . . . . . . . . . . . . . . . . . . . . . . . . . . . . . . . . . . . . . . 23
Item 7. Management’s Discussion and Analysis of Financial Condition and Results of Operations . . . . . . . . . . . 24
Item 7A. Quantitative and Qualitative Disclosures about Market Risk . . . . . . . . . . . . . . . . . . . . . . . . . . . . . . . . . . . 35
Item 8. Financial Statements and Supplementary Data . . . . . . . . . . . . . . . . . . . . . . . . . . . . . . . . . . . . . . . . . . . . . . 37
Item 9. Changes in and Disagreements with Accountants on Accounting and Financial Disclosure . . . . . . . . . . . 71
Item 9A. Controls and Procedures . . . . . . . . . . . . . . . . . . . . . . . . . . . . . . . . . . . . . . . . . . . . . . . . . . . . . . . . . . . . . . . 71
Item 9B. Other Information . . . . . . . . . . . . . . . . . . . . . . . . . . . . . . . . . . . . . . . . . . . . . . . . . . . . . . . . . . . . . . . . . . . . 71
Item 9C. Disclosure Regarding Foreign Jurisdictions that Prevent Inspections . . . . . . . . . . . . . . . . . . . . . . . . . . . . 71
PART III
Item 10. Directors, Executive Officers and Corporate Governance . . . . . . . . . . . . . . . . . . . . . . . . . . . . . . . . . . . . . 72
Item 11. Executive Compensation . . . . . . . . . . . . . . . . . . . . . . . . . . . . . . . . . . . . . . . . . . . . . . . . . . . . . . . . . . . . . . . 72
Item 12. Security Ownership of Certain Beneficial Owners and Management and Related Stockholder Matters . . 72
Item 13. Certain Relationships and Related Transactions, and Director Independence . . . . . . . . . . . . . . . . . . . . . . 72
Item 14. Principal Accounting Fees and Services . . . . . . . . . . . . . . . . . . . . . . . . . . . . . . . . . . . . . . . . . . . . . . . . . . . 72
PART IV
Item 15. Exhibit and Financial Statement Schedules . . . . . . . . . . . . . . . . . . . . . . . . . . . . . . . . . . . . . . . . . . . . . . . . 73
Item 16. Form 10-K Summary . . . . . . . . . . . . . . . . . . . . . . . . . . . . . . . . . . . . . . . . . . . . . . . . . . . . . . . . . . . . . . . . . 73
Signatures . . . . . . . . . . . . . . . . . . . . . . . . . . . . . . . . . . . . . . . . . . . . . . . . . . . . . . . . . . . . . . . . . . . . . . . . . . 80
Page
2

PART I
Item 1. Business
Polaris Inc., formerly known as Polaris Industries Inc., a Minnesota corporation, was formed in 1994 and is the successor
to Polaris Industries Partners LP. The terms “Polaris,” the “Company,” “we,” “us,” and “our” as used herein refer to the
business and operations of Polaris Inc., its subsidiaries and its predecessors, which began doing business in 1954. We
design, engineer and manufacture powersports vehicles which include: off-road vehicles (“ORV”), including all-terrain
vehicles (“ATV”) and side-by-side vehicles; snowmobiles; motorcycles; moto-roadsters; quadricicycles; and boats. We
also design and manufacture or source parts, garments and accessories (“PG&A”), which includes aftermarket
accessories and apparel. Our products are sold online and through dealers and distributors principally located in the
United States, Canada, Western Europe, Australia, and Mexico.
Business Segments
We operate in three business segments; Off Road, On Road, and Marine. Our products are sold through a network of
over 2,500 independent dealers in North America, over 1,500 independent international dealers through over 25
subsidiaries, and over 90 independent distributors in over 100 countries outside of North America. A majority of our
dealers and distributors are multi-line and also carry competitor products, however some dealers carry our full line of
products and, while relatively consistent, the actual number of dealers carrying our products can vary from time to time.
Off Road:
The Off Road segment primarily consists of ORVs and snowmobiles. ORVs are four-wheel vehicles designed for off-
road use and traversing a wide variety of terrain, including dunes, trails, and mud. The vehicles can be multi-passenger or
single passenger, are used for recreation in such sports as fishing and hunting and for trail and dune riding, and for utility
purposes on farms, ranches, and construction sites. The ORV industry is comprised of ATVs and side-by-side vehicles.
Internationally, ATVs and side-by-sides are sold primarily in Western European countries by similar manufacturers as in
North America.
Estimated North America and worldwide ORV industry retail sales are summarized as follows:
Estimated* Approximate Industry Sales (in units) 2022 2021 2020
North America ATV retail sales . . . . . . . . . . . . . . . . . . . . . . . . . . . . . . . . . . . 255,000 285,000 345,000
North America side-by-side retail sales . . . . . . . . . . . . . . . . . . . . . . . . . . . . . 515,000 560,000 640,000
North America ORV retail sales . . . . . . . . . . . . . . . . . . . . . . . . . . . . . . . . . . . 770,000 845,000 985,000
Worldwide ATV retail sales . . . . . . . . . . . . . . . . . . . . . . . . . . . . . . . . . . . . . . 360,000 415,000 465,000
Worldwide side-by-side retail sales . . . . . . . . . . . . . . . . . . . . . . . . . . . . . . . . 570,000 620,000 690,000
Worldwide ORV retail sales . . . . . . . . . . . . . . . . . . . . . . . . . . . . . . . . . . . . . . 930,000 1,035,000 1,155,000
*Estimates are unaudited and based on internally generated management estimates, including estimates based on extrapolations from third party
surveys of the industries in which we compete. See Market and Industry Data section for additional information.
Twelve months ended December 31,
The side-by-side market has been consistently strong over the past several years primarily due to continued innovation
by manufacturers. In 2022, we continued to be the North America market share leader in off-road vehicles. Our ORV
lineup includes the RZR sport side-by-side, the RANGER utility side-by-side, the GENERAL
crossover side-by-side, and
the Sportsman
ATV. The full line spans 91 models, including two-, four- and six-wheel drive general purpose and
recreational vehicles. In many of our segments, we offer youth, value, mid-size, premium and extreme-performance
vehicles, which come in both single passenger and multi-passenger seating arrangements. Key 2022 ORV product
introductions included the RANGER CREW XP 1000 NorthStar Big Game Edition, GENERAL XP 1000 Sport, and
GENERAL 1000 Sport.
We design, engineer, produce or supply a variety of replacement parts and Polaris Engineered Accessories for our ORVs.
ORV accessories include winches, bumper/brushguards, plows, racks, wheels and tires, pull-behinds, cab systems,
lighting and audio systems, cargo box accessories, tracks and oil. We also market a full line of gear and apparel related to
our ORVs, including helmets, jackets, gloves, pants and hats. Gear and apparel is designed to our specifications,
purchased from independent vendors and sold by us through our dealers, distributors, and online.
3
We sell our ORVs directly to a network of over 1,400 dealers in North America and over 1,100 international dealers.
Many of our ORV dealers and distributors are also authorized snowmobile dealers. We produce and deliver our products
throughout the year based on dealer, distributor, and customer orders. ORV retail sales activity at the dealer level drives
orders which are incorporated into each product’s production scheduling. International distributor ORV orders are taken
throughout the year. We utilize our Retail Flow Management (“RFM”) ordering system for ORV dealers, which allows
dealers to order daily and create a segment stocking order which helps to reduce order fulfillment times.
The ORV industry in the United States, Canada and other global markets is highly competitive. As an ORV original
equipment manufacturer (“OEM”), our competition primarily comes from North American and Asian manufacturers.
Competition in such markets is based upon a number of factors, including price, quality, reliability, styling, product
features and warranties and a manufacturer’s ability to timely produce vehicles in response to increased consumer
demand.
Snowmobiles have been manufactured under the Polaris name since 1954. We estimate that worldwide industry sales of
snowmobiles totaled approximately 130,000, 135,000, and 125,000 units for the 12 month seasons ended March 31,
2022, 2021, and 2020, respectively.
For the 12 month season ended March 31, 2022, we held the number two market share position for North America. We
produce a full line of snowmobiles consisting of 68 models, ranging from youth models to utility and economy models to
performance and competition models. Polaris snowmobiles are sold principally in the United States, Canada, and
Northern Europe.
Key model introductions in 2022 included the new Patriot Boost Indy VR1, Patriot Boost Switchback Assault, 9R Pro
RMK Slash, and 9R RMK Khaos Slash. We also launched the ProStar S4 engine available for Indy, Voyageur and Titan
snowmobiles. We also manufacture a snow bike conversion kit system under the Timbersled brand and in 2022 we
launched the ARO 3 Gen 2 Platform, Quick Drive Timbersled (QDT) belt drive system, and more trim levels and
options.
We design, engineer, produce or supply a variety of replacement parts and Polaris Engineered Accessories for our
snowmobiles and snow bike conversion kits. Snowmobile accessories include covers, traction products, reverse kits,
electric starters, tracks, bags, windshields, oil and lubricants. We also market a full line of gear and apparel for our
snowmobiles, including helmets, goggles, jackets, gloves, boots, bibs, pants and hats. Gear and apparel is purchased
from independent vendors and sold by us through our dealers, distributors, and online.
We sell our snowmobiles directly to a network of over 580 dealers in North America, primarily located in the snowbelt
regions of the United States and Canada, and over 300 international dealers. We offer a pre-order SnowCheck program
in the spring for our customers that assists us in production planning. This program allows our customers to order a true
factory-customized snowmobile by selecting various options, including chassis, track, suspension, colors and
accessories. Manufacturing of snowmobiles generally commences in late winter of the previous season and continues
through late autumn or early winter of the current season.
The global snowmobile industry is primarily comprised of North American and Japanese competitors. Competitive
market share position is driven heavily by product news (styling, technology, performance) and attractiveness of
promotional incentives.
Our commercial and government/defense businesses design and manufacture vehicles that support various commercial
and government applications for transporting people and hauling equipment, as well as tactical defense vehicles. Our
defense vehicles, which include ATVs and side-by-side vehicles with features specifically designed for military
applications, provide versatile mobility for up to nine passengers, and include our DAGOR, Sportsman MV and MRZR
models. We offer 39 models across our brands.
Our commercial and government/defense businesses each have their own distribution networks outside of our traditional
dealer channels through which their respective vehicles are distributed. ProXD, one of our vehicle brands, is sold through
a growing network of over 190 dealers and also direct to customer where permitted.
4

The Off Road segment also designs and sells various PG&A related to its vehicles and aftermarket products. These
products include our OEM brands as well as other portfolio brands including Kolpin, Pro Armor, Klim, 509, and Trail
Tech. Kolpin, Pro Armor and Trail Tech serve various accessory related needs, where Kolpin is a lifestyle brand
specializing in purpose-built and universal-fit accessories for a variety of off-road vehicles and off-road outdoor
enthusiasts and Pro Armor offers a lineup that specializes in accessories for performance side-by-side vehicles,
snowmobiles and ATVs. Brands in our Apparel category include Klim, which specializes in premium technical riding
gear for snowmobile and off-road activities, and 509, which is an aftermarket leader in snowmobile and off-road apparel,
helmets and goggles. Kolpin, Pro Armor and Trail Tech are marketed through Apex Product Group, a unified sales,
customer service, distribution and vertically integrated manufacturing organization. Apex allows us to access customers
through strategic retail and e-commerce marketplaces, as well as dealerships (Polaris and non-Polaris), to reach owners
of Polaris and other OEM’s products. Klim and 509 each have their own dealer/distributor networks.
On Road:
Our On Road segment designs and manufactures motorcycles, moto-roadsters, light duty hauling, and passenger
vehicles.
Motorcycles are utilized as a mode of transportation as well as for recreational purposes. The industry is comprised of
several segments. We currently compete in three segments: cruisers, touring (including three-wheel), and standard
motorcycles. Competition in these segments of the motorcycle industry is based on a number of factors, including
styling, price, quality, reliability and the dealer network supporting the brand.
Estimated combined 900cc and above cruiser, touring, and standard market segments (including the moto-roadster
Slingshot
®
) motorcycle industry sales in North America and worldwide are summarized as follows:
Estimated* Industry Sales (in units) 2022 2021 2020
North America 900cc cruiser, touring, and standard retail sales . . . . . . . . . . 195,000 220,000 190,000
Worldwide 900cc cruiser, touring, and standard retail sales . . . . . . . . . . . . . 315,000 350,000 330,000
*Estimates are unaudited and based on internally-generated management estimates, including estimates based on extrapolations from third party
surveys of the industries in which we compete. See Market and Industry Data section for additional information.
Twelve months ended December 31,
In 2022, we held the number two position in North America market share for the 900cc+ category. Our motorcycles
lineup includes Indian Motorcycle and Slingshot, a three-wheel open air roadster. Our 2023 model year line of
motorcycles for Indian Motorcycle and Slingshot consists of 35 models. In 2022, Indian Motorcycle launched its all-new
2023 lineup featuring enhanced style and technology with its groundbreaking FTR lineup and three new limited edition
Elite motorcycles. Polaris Slingshot launched its all-new 2023 lineup, including the Slingshot ROUSH® Edition as a
new partnership collaboration with ROUSH® Performance.
We design, engineer, produce or source a variety of replacement parts and accessories for our motorcycles. Motorcycle
accessories include saddle bags, handlebars, backrests, exhausts, windshields, seats, oil and various chrome accessories.
We also market a full line of gear and apparel for our motorcycles, including helmets, jackets, leathers and hats. Gear
and apparel is purchased from independent vendors and sold by us through our dealers, distributors, and online under our
brand names.
Indian Motorcycle and Slingshot are distributed directly through independently owned dealers and distributors. Indian
Motorcycles are sold through a network of over 200 dealers in North America and over 350 international dealers.
Slingshot currently has over 350 dealers globally. We utilize our RFM ordering system for motorcycle dealers, which
allows dealers to order daily and create a segment stocking order which helps to reduce order fulfillment times.
We also design and manufacture vehicles that support various commercial and industrial work applications and include
products in the light-duty hauling, industrial and urban/suburban commuting sub-sectors. Our vehicle brands include
Goupil and Aixam which are primarily marketed in Western Europe. We offer 14 models across these brands. These
businesses each have their own distribution networks through which their respective vehicles are distributed. Goupil and
Aixam sell directly to customers in France, through subsidiaries in certain Western European countries and through
several dealers and distributors for markets outside such countries.
5
The On Road segment also designs and sells various PG&A related to its vehicles and aftermarket products. These
products include our OEM brands as well as other portfolio brands including Klim.
Marine:
Our Marine segment designs and manufactures boats which are designed to compete in key segments of the recreational
marine industry, specifically pontoon and deck boats. Inclusive of the segments in which we compete, we estimate total
U.S. 2022 powerboats market sales were approximately $14.0 billion, with pontoon being one of the larger segments
therein.
Our brands include Bennington, Godfrey, and Hurricane, which together provide a full offering of pontoon and deck
boats. These brands are strategically positioned with over 500 base models across a range of price points. We also offer
custom layouts and features and work with most engine manufacturers enabling customers to build a boat that meets
their specifications. We believe that the combination of our Bennington and Godfrey brands is projected to be the market
share leader in pontoon boats.
In 2022, Polaris Marine launched the MY 2023 boats for the Bennington, Godfrey and Hurricane brands. Notable
launches include Bennington’s LX Sport that introduced sleek rails, sport furniture, and intuitive helm design features
normally found on premium models on this mid-range boat at an attractive price; Godfrey’s Mighty G cruising and
fishing series designed to be powered by electric or gas propulsion; Hurricane’s refreshed lineup of Fun Deck models
(1960, 2260, 2360) and the Hurricane SunDeck 2600 OB deck boat as the flagship model with its spacious design, plush
interior, and power action tower.
Our extensive, experienced and loyal network of over 550 active dealers is a competitive advantage, helping to generate
steady demand. Concentrated primarily in North America, this dealer network is organized into distinct sales territories
supported by experienced sales representatives and leadership. Through the use of offseason incentive programs, we
adhere to level production throughout the year, minimizing disruption to the workforce and vendor network.
Polaris Adventures
Our Polaris Adventures business partners with local outfitters to deliver unique ride experiences leveraging many of our
global vehicle platforms. The Polaris Adventures network completed over 350,000 rides in over 190 locations in 2022.
The financial results of the Polaris Adventures business is included within the Off Road and On Road segments, based
on the related vehicle.
Financial Services Arrangements
Floor plan financing. We have arrangements with Polaris Acceptance (United States), a joint venture between Polaris
and a subsidiary of Wells Fargo Bank, N.A., Wells Fargo affiliates (Australia, Canada, France, Germany, the United
Kingdom, China and New Zealand), and a subsidiary of Huntington Bancshares Incorporated to provide floor plan
financing for many of our dealers. A majority of our sales of ORVs, snowmobiles, motorcycles, boats, and related
PG&A are financed under these arrangements whereby we receive payment within a few days of shipment of our
product. We participate in the cost of dealer financing and have agreed to repurchase products from the finance
companies under certain circumstances and subject to certain limitations. No material losses have been incurred under
these agreements during the periods presented. See Note 11 of Notes to Consolidated Financial Statements for a
discussion of these financial services arrangements.
Customer financing. We do not offer consumer financing directly to the end users of our products. Instead, we have
agreements in place with third-party financing companies to provide financing services to those end consumers. We have
no material contingent liabilities for residual value or credit collection risk under these agreements.
Manufacturing and Distribution Operations
Our products are primarily assembled at our 19 global manufacturing facilities, many of which are shared across
business segments. We are vertically integrated in several key components of our manufacturing process, including
plastic injection molding, precision machining, welding, clutch assembly and painting. Raw materials and other
component parts are purchased from third-party vendors. We have a long-term supply contract with a boat engine
manufacturer, which requires a certain volume of total engine purchases, and includes favorable pricing, as well as
various growth and volume incentives.
6
Contract carriers ship our products from our manufacturing and distribution facilities to our customers. We maintain
several leased wholegoods distribution centers where final set-up and up-fitting is completed for certain models before
shipment to dealers, distributors, and customers.
Our products are distributed to our dealers, distributors, and customers through a network of over 40 distribution centers,
including third-party providers.
Sales and Marketing
Our marketing activities are designed primarily to promote and communicate with consumers to enable the marketing
and selling efforts of our dealers and distributors globally. We make available and advertise discount or rebate programs,
retail financing or other incentives for our dealers and distributors to remain price competitive to accelerate retail sales to
consumers. We advertise our brands directly to consumers via digital, television, print, out of home, radio, events and
sponsorships. We utilize public relations and partnerships to drive earned media. We provide advertising assets and
content and partially underwrite dealer and distributor advertising to a degree and on terms which vary by brand and
from year to year. We also provide print materials, signage and other promotional items for use by dealers. We spent
$480.8 million, $458.2 million and $429.8 million for sales and marketing activities in 2022, 2021 and 2020,
respectively. Our corporate headquarters facility is in Medina, Minnesota, and we maintain numerous sales and
administrative facilities across the world.
Engineering, Research and Development, and New Product Introduction
We have over 1,400 employees who are engaged in the development and testing of existing products and research and
development of new products and improved production techniques, located primarily in Roseau, Minnesota, Wyoming,
Minnesota, Elkhart, Indiana, Burgdorf, Switzerland, and Bangalore, India.
We utilize internal combustion engine testing facilities to design engine configurations for our products. We utilize
specialized facilities for matching engine, exhaust system and clutch performance parameters in our products to achieve
desired fuel consumption, power output, noise level and other objectives. Further, we are currently executing an
electrification initiative to position the Company as a leader in powersports electrification. Our engineering department is
equipped to make small quantities of new product prototypes for testing and for the planning of manufacturing
procedures. In addition, we maintain numerous facilities where each of the products is extensively tested under actual use
conditions. We utilize our Wyoming, Minnesota facility for engineering, design and development personnel for our line
of engines and powertrains, ORVs, and motorcycles, and our Roseau, Minnesota facility for our snowmobile, ATV and
powertrain research and development. We utilize our Elkhart, Indiana facility for engineering, design and development
for our boats research and development. We also own Swissauto Powersports Ltd., an engineering company that
develops high-performance and high-efficiency engines and innovative vehicles.
Intellectual Property
Our products are marketed under a variety of valuable trademarks. Some of the more important trademarks used in our
global operations include POLARIS, RANGER, RZR, GENERAL, SPORTSMAN, INDIAN MOTORCYCLE,
SLINGSHOT, BENNINGTON, and KLIM. We protect these marks as appropriate through registrations in the United
States and other jurisdictions. Depending on the jurisdiction, trademarks are generally valid as long as they are in use or
their registrations are properly maintained and they have not been found to have become generic. Registrations of
trademarks can also generally be renewed indefinitely for as long as the trademarks are in use.
We continue our focus on developing and marketing innovative, proprietary products, many of which use proprietary
expertise, trade secrets, and know-how. We consider the collective rights under our various patents, which expire from
time to time, a valuable asset, but we do not believe that our businesses are materially dependent upon any single patent
or group of related patents.
Product Safety & Regulatory Affairs
Federal, state/provincial and local governments around the world have promulgated and/or are considering promulgating
laws and regulations relating to product safety and consumer use. For example: (i) the United States, the Consumer
Product Safety Commission (“CPSC”) has federal oversight over product safety issues related to snowmobiles, snow-
bikes and off-road vehicles; (ii) the National Highway Traffic Safety Administration (“NHTSA”) has federal oversight
over product safety issues related to motorcycles and Slingshot; and (iii) and the U.S. Coast Guard and its foreign
equivalents have oversight over the marine safety regulations for our marine products. In addition, we design our
products to comply with various applicable voluntary safety standards promulgated by industry associations. While we
7
are currently effectively managing compliance with these various regulatory schemes and standards around the world,
changes in the regulatory climate in any of the jurisdictions where we operate could have a material adverse effect on our
total sales, financial condition, profitability, or cash flows. For a more detailed discussion of these risks, please see Item
1A. Risk Factors of this Annual Report.
Human Capital Management
Best Team, Best Culture is a Polaris guiding principle. Our greatest asset is our employee base. We are committed to
providing an inclusive and engaging work environment, and we aim to leverage our Polaris values to drive a positive
culture. Our employees are also among our largest shareholder groups, driven by our Employee Stock Ownership Plan
(“ESOP”) and our equity compensation program.
Headcount. Due to the seasonality of our business and changes in production cycles, total employment levels vary
throughout the year. Despite such variations in employment levels, employee turnover has not been materially disruptive
to operations. As of December 31, 2022, we had approximately 16,200 full-time employees globally, with approximately
5,100 in salaried roles. Our employees are based in 19 countries with approximately 45% of our employees located
outside of the United States.
Commitment to diversity, equity, and inclusion. Our commitment to diversity, equity, and inclusion is foundational to our
success. We have committed to a multi-year strategy, R.I.D.E. Together, that defines and progresses our commitment to
Respect, Inclusion, Diversity, and Equity, with our assertion that we will make meaningful progress leveraging our full
workforce (“Together”). The composition of our Board of Directors reflects our actions to make diversity a key priority.
In the last four years, the Company has added three new directors resulting in a Board with a comprehensive skillset
relevant to our industry and future including adding two diverse directors.
Our leaders are equipped to foster a diverse and inclusive workplace through unconscious bias training and access to
similar tools to drive inclusive team conversations. We engaged an external firm to review our performance management
and talent acquisition processes for any unintended biases and are leveraging the findings to inform and reinforce our
market-leading practices in these areas. As members of the Corporate Partnership Council of the Society of Women
Engineers (“SWE”) and the Women in Manufacturing Association (“WiM”), we have enabled team development
opportunities and a pipeline for future talent. We have also created partnerships with People of Color Careers,
RippleMatch, Women in Business (“WIB”), Disability Solutions, DoD Skillbridge and others to further our ability to
reach a diverse candidate base. Our relationship with Code2College is helping us create a non-traditional talent pipeline
for technical talent, and our early career leadership development programs are a catalyst for future diverse leaders.
Employee engagement. As a core element of our human capital management strategy, in 2021 we deployed our bi-annual
engagement survey of global salaried employees. In 2021, 96% of our employees participated in the survey, and the
positive responses rated Polaris in the top quartile compared with a best-in-class global normative database, on par with
high performing company norms. We furthered our employee listening strategy by deploying a new hire feedback survey
across our global salaried employees, soliciting feedback from employees throughout the first 18 months of employment.
In 2022, our teams have been actively working to evaluate and implement opportunities for improvement identified by
these sources of employee feedback.
Leadership development. As a part of our growth strategy, we are committed to strategically and intentionally developing
our current employees to become the next generation of leaders through external partnerships and employee development
programs such as Succeeding as a Polaris Leader and Polaris Leadership Development 1 and 2. These programs provide
high potential employees opportunities to grow and prepare for next-level roles. In 2022, we expanded that investment
with virtual and in-person leadership trainings across a large number of leaders and we deployed additional manager and
employee skill trainings aligned to organizational capabilities. We have bolstered our succession and development
processes for senior leadership, partnering with top executives to improve our pipeline for critical executive roles.
Attracting and developing early career talent remains a key element of our talent strategy. We returned to in-person
internships in 2022 and leveraged our learnings from remote internships to create agile development opportunities
culminating with a 3-day summit event in Minnesota providing an opportunity to learn from executives, network with
other interns, participate in professional development, and ride Polaris products. Our internship programs are a key
pipeline to our early career leadership development programs across engineering, operations, sales, marketing, finance,
human resources and information technology. Our first leadership development program launched over 20 years ago, and
the structured rotations and formal development within the programs have proven successful in bolstering our functional
and management leadership succession
8
Employee well-being. We believe the holistic focus on well-being, including our employees’ health, safety, and financial
security drives our success and is a key focus of our guiding principles. We offer our employees a total rewards package
that includes competitive base pay, annual incentives, product discounts, comprehensive health and wellness benefits,
and equity compensation plans that include the ESOP, Employee Stock Purchase Plan (“ESPP”), and additional incentive
equity grants (for certain levels). Employees are provided with customized comprehensive total rewards statements and a
guide to understanding the various pay and benefits elements of our total rewards program. Over the past year, our strong
safety culture remained a primary focus as our office teams transitioned back onsite. We have continued to evolve our
safety controls to protect employees working onsite. The agility of our employee base remained an advantage, with our
office teams shifting to a hybrid work environment and optimizing the benefits of remote and in-person work. Wellness
is a significant focus with the personalized well-being model that provides employees with the tools to manage their
situations better. Financial well-being has been a focus in a multifaceted way, including an expanded 401(k) investment
lineup. We also offer financial wellness education via an award-winning investment advisory firm, which teaches our
employees about the navigation of market volatility and provides inflation and free one-on-one counseling sessions to
employees. We expect to launch an employee relief program in 2023 that supports employees in need due to unforeseen
crises. We view a comprehensive total rewards package such as this with a broad focus on employee well-being as
instrumental in our ability to attract, motivate and retain quality candidates and employees to drive our strategic mission
to be the global leader in powersports.
Market and Industry Data
We have obtained the market and industry data presented in this Annual Report from a combination of internal surveys,
third-party information and estimates by management. There are limited sources that report on our markets and
industries. As such, much of the market and industry data presented in this Annual Report is based on internally-
generated management estimates, including estimates based on extrapolations from third-party surveys of the industries
in which we compete. While we believe internal surveys, third-party information and our estimates are reliable, we have
not verified them, nor have they been verified by any independent sources and we have no assurance that the information
contained in third party websites is current, up-to date, or accurate. While we are not aware of any misstatements
regarding the market and industry data presented in this Annual Report, whether any such future-looking data will be
accurate involves risks and uncertainties and are subject to change based on various factors, including those factors
discussed under the “Forward-Looking Statements” and in our “Risk Factors.”
Available Information
Our Internet website is http://www.polaris.com. We make available free of charge, on or through our website, our
annual, quarterly and current reports, and any amendments to those reports, as soon as reasonably practicable after
electronically filing such reports with the Securities and Exchange Commission. We also make available through our
website our corporate governance materials, including our Corporate Governance Guidelines, the charters of the Audit
Committee, Compensation Committee, Corporate Governance and Nominating Committee and Technology Committee
of our Board of Directors, our Code of Business Conduct and Ethics, and our Corporate Responsibility Report. Any
shareholder or other interested party wishing to receive a copy of these corporate governance materials should write to
Polaris Inc., 2100 Highway 55, Medina, Minnesota 55340, Attention: Investor Relations or email
[email protected]. Information contained on our website is not part of this report. In addition, the
SEC maintains an internet site that contains reports, proxy and information statements, and other information regarding
issuers that file electronically with the SEC and state the address of that side (http://www.sec.gov).
Forward-Looking Statements
This Annual Report contains not only historical information, but also “forward-looking statements” intended to qualify
for the safe harbor provisions of the Private Securities Litigation Reform Act of 1995. These “forward-looking
statements” can generally be identified as such because the context of the statement will include words such as we or our
management “believes,” “anticipates,” “expects,” “estimates” or words of similar import. Similarly, statements that
describe our future plans, objectives or goals, such as future sales, shipments, future cash flows and capital requirements,
operational initiatives, supply chain, tariffs, currency fluctuations, interest rates, and commodity costs, are forward-
looking statements that involve certain risks and uncertainties that could cause actual results to differ materially from
those forward-looking statements, are also forward-looking. Forward-looking statements may also be made from time to
time in oral presentations, including telephone conferences and/or webcasts open to the public.
Potential risks and uncertainties include such factors as Company’s ability to successfully source necessary parts and
materials on a timely basis; the ability of the Company to manufacture and deliver products to dealers to meet demand;
9
the Company’s ability to identify and meet optimal dealer inventory levels; the Company’s ability to accurately forecast
and sustain consumer demand; the Company’s ability to mitigate increasing input costs through pricing or other
measures; the Company’s ability to successfully implement its manufacturing operations strategy and supply chain
initiatives; product offerings, promotional activities and pricing strategies by competitors that make our products less
attractive to consumers; economic conditions that impact consumer spending, including recessionary conditions; the
severity and duration of the COVID-19 pandemic and the resulting impact on the Company’s business, supply chain, and
the global economy; disruptions in manufacturing facilities; product recalls and/or warranty expenses; product rework
costs; impact of changes in Polaris stock price on incentive compensation plan costs; foreign currency exchange rate
fluctuations; environmental and product safety regulatory activity; effects of weather; commodity costs; freight and tariff
costs (tariff relief or ability to mitigate tariffs); changes to international trade policies and agreements; uninsured product
liability claims and other litigation expenses incurred due to the nature of the Company’s business; uncertainty in the
consumer retail and wholesale credit markets; performance of affiliate partners; changes in tax policy; relationships with
dealers and suppliers; and the general overall global economic, social and political environment. The risks and
uncertainties discussed in this report are not exclusive and other factors that we may consider immaterial or do not
anticipate may emerge as significant risks and uncertainties.
Any forward-looking statements made in this report or otherwise speak only as of the date of such statement, and we
undertake no obligation to update such statements to reflect actual results or changes in factors or assumptions affecting
such forward-looking statements. We advise you, however, to consult any further disclosures made on related subjects in
future quarterly reports on Form 10-Q and current reports on Form 8-K that are filed with or furnished to the Securities
and Exchange Commission.
10

Information about our Executive Officers
Set forth below are the names of our executive officers as of February 17, 2023, their ages, titles, the year first appointed
as an executive officer, and employment for the past five years:
Michael T. Speetzen
Chief Executive Officer
53 Mr. Speetzen was appointed Chief Executive Officer in April 2021;
proceeding this, Mr. Speetzen was Interim Chief Executive Officer since
January 2021. Mr. Speetzen joined Polaris in August 2015 as Executive
Vice President and Chief Financial Officer.
Lucy Clark Dougherty
Senior Vice President, General
Counsel and Corporate Secretary
53 Ms. Clark Dougherty joined Polaris in January 2018 as Senior Vice
President—General Counsel, Compliance Officer and Corporate Secretary.
Michael D. Dougherty
President of On Road and
International
55 Mr. Dougherty was appointed President of On Road and International in
December 2019. Prior to this, Mr. Dougherty was President of
International since September 2015.
Benjamin D. Duke
President of Marine
50 Mr. Duke was appointed President of Marine in May 2022. Prior to this,
Mr. Duke was General Manager of Godfrey and Hurricane Boats since
joining Polaris in 2019. Prior to joining Polaris, Mr. Duke was President of
the Job Site and Standby Power Group at Briggs and Stratton.
Stephen L. Eastman
President of PG&A and
Aftermarket
58 Mr. Eastman was appointed President of PG&A and Aftermarket in
September 2015. Prior to this, Mr. Eastman was Vice President of PG&A
since joining Polaris February 2012.
Robert P. Mack
Chief Financial Officer and
Executive Vice President of
Finance and Corporate
Development
53 Mr. Mack was appointed Chief Financial Officer in April 2021. Mr. Mack
also serves as Executive Vice President of Finance and Corporate
Development. Prior to this, Mr. Mack was Interim Chief Financial Officer
since January 2021 and Senior Vice President of Corporate Development
and Strategy, and President of Global Adjacent Markets and Marine.
Steven D. Menneto
President of Off Road
57 Mr. Menneto was appointed President of Off Road in December 2019.
Prior to this, Mr. Menneto was President of Motorcycles since September
2015.
Kenneth J. Pucel
Executive Vice President—Global
Operations and Chief Technology
Officer
56 Mr. Pucel joined Polaris in December 2014 as Executive Vice President—
Global Operations, Engineering, and Lean.
James P. Williams
Senior Vice President and Chief
Human Resources Officer
60 Mr. Williams joined Polaris in April 2011 as Senior Vice President and
Chief Human Resources Officer.
Name and Position Age Business Experience During the Last Five or More Years
Executive officers of the Company are elected at the discretion of the Board of Directors with no fixed terms. There are
no family relationships between or among any of the executive officers or directors of the Company.
Item 1A. Risk Factors
The following are factors known to us that could materially adversely affect our business, financial condition, cash
flows, or operating results, as well as adversely affect the value of an investment in our common stock.
Macroeconomic Risks
Our business may be sensitive to economic conditions, including those that impact our customers’ spending.
Our results of operations may be sensitive to changes in overall economic conditions, primarily in North America and
Europe, that impact spending on our products, including discretionary spending. Weakening of, and fluctuations in,
economic conditions affecting disposable consumer income or our customers’ budgets, such as employment levels,
inflation, business conditions, the level of governmental financial assistance, changes in housing market conditions,
capital markets, tax rates, savings rates, interest rates, fuel and energy costs, the economic impacts of natural disasters or
other severe weather conditions, acts of war, including the conflict between Russia and Ukraine, and acts of terrorism,
the availability of consumer credit could reduce overall spending or reduce spending on our products. A general
reduction in consumer spending or a reduction in consumer spending on powersports, boats and aftermarket products
11

could adversely affect our sales growth and profitability. A general reduction in spending by our customers for
commercial equipment or a reduction in government budgets could adversely affect our related sales.
Adverse changes in these factors could lead to a decreased level of demand for our products, which could negatively
impact our business, results of operations, financial condition and cash flows.
In addition, we have financial services partnership arrangements with subsidiaries of Wells Fargo Bank, N.A. and a
subsidiary of Huntington Bancshares Incorporated that require us to repurchase products financed and repossessed by the
partnership, subject to certain limitations. If adverse changes to economic conditions result in increased defaults on the
loans made by this financial services partnership, our repurchase obligation under the partnership arrangement could
adversely affect our liquidity and harm our business.
Shortages or increases in the cost of raw materials, commodities, component parts, and transportation could
negatively impact our business.
The primary commodities used in manufacturing our products are aluminum, steel, petroleum-based resins and certain
rare earth metals used in our charging systems, as well as diesel fuel to transport products. Our profitability has been
affected by fluctuations in the prices of the raw materials and commodities we use in our products and in the cost of
freight and shipping to source materials, commodities, and other component parts necessary to assemble our products.
We have experienced significant increases in the cost of these commodities and materials due generally to an inflationary
environment driven by high demand and supply chain disruptions. Additionally, fluctuating policies and the
implementation of trade regulations and trade agreements could further disrupt our supply chain or increase the cost of
raw materials and commodities necessary to manufacture our products. The impact from tariffs or other trade regulations
could require us to shift our manufacturing footprint or result in decreased demand for our products or restructuring
actions that could impact our work force and/or our investments in research and development or other growth initiatives.
All of these could increase our operational costs and materially and adversely affect our results of operations and
financial condition.
Market and Competitive Risks
We face intense competition in all product lines. Failure to compete effectively against competitors could negatively
impact our business and operating results.
The markets in which we operate are highly competitive. Competition in such markets is based upon several factors,
including price, quality, reliability, styling, product features and warranties. At the dealer level, competition is based on
additional factors, including product availability, sales and marketing support programs (such as financing and
cooperative advertising), and dealer and customer perception. Certain of our competitors are more diversified and have
advantageous manufacturing footprints, and may invest more heavily in intellectual property, product development,
promotions and advertising. If we are not able to compete with new or enhanced products or models of our competitors,
our ability to retain and attract customers and future business performance may be materially and adversely affected.
Internationally, our products typically face more competition where certain foreign competitors manufacture and market
products in their respective countries. This allows those competitors to sell products at lower prices, which could
adversely affect our competitiveness. In addition, our products compete with many other recreational, utility, and work
products for the discretionary spending of our customers. A failure to effectively compete with these other competitors or
adjust pricing to offset inflation or increased supply chain costs could materially and adversely affect our financial results
and have a material adverse effect on our performance.
If we are unable to continue to enhance existing products and develop and market new or enhanced products that
respond to customer needs and preferences, we may experience a decrease in demand for our products and our
business could suffer.
Our sales from new products in the past have represented a significant component of our sales and are expected to
continue to represent a significant component of our future sales. We may not be able to compete as effectively in the
market, and ultimately satisfy the needs and preferences of our customers, unless we can continue to enhance existing
product, execute on our electrification strategy, and develop new and innovative products in the global markets in which
we compete. Product development requires significant financial, technological and other resources. There can be no
assurance that our level of investment in research and development will be a sufficient competitive advantage in product
innovation, which could cause our business to suffer. Product improvements and new product introductions also require
significant engineering, planning, design, development, and testing at the technological, product, and manufacturing
process levels and we may not be able to timely develop product improvements or new products. Our competitors’ new
12
products may be of a better quality, beat our products to market, and be more attractive in terms of features and price
than our products.
Our continued success is dependent on positive perceptions of our Polaris brands which, if impaired, could adversely
affect our sales.
We believe the strength of our Polaris brands is one of the reasons our customers choose our products. To be successful,
we must preserve our reputation. Reputational value is based in large part on perceptions and opinions, and broad access
to social media makes it easy for anyone to provide public feedback that can influence perceptions of our company. It
may be difficult to control negative publicity, regardless of whether it is accurate. While reputations may take decades to
build, any negative incidents can quickly erode trust and confidence, particularly if they result in negative mainstream
and social media publicity, governmental investigations, or litigation. Negative incidents, such as quality and safety
concerns or incidents related to our products or actions or statements of our employees, suppliers or dealers, could lead to
tangible adverse effects on our business, including lost sales or employee retention and recruiting difficulties. In addition,
the reputation of our vendors and others with whom we choose to do business may affect our reputation.
Increased negative public perception of our products or any increased restrictions on the access or the use of our
products in certain locations could materially adversely affect our business or results of operations.
Demand for the Company’s products depends in part on their social acceptability. Public concerns about the
environmental impact of the Company’s products or their perceived safety could result in diminished public perception
of the products we sell. Government, media, or activist pressure to limit emissions or perceived land and water impacts
could also negatively impact consumers’ perceptions of the Company’s products or limit access to areas where
customers can use our products. Any decline in the social acceptability of the Company’s products could negatively
impact sales or lead to changes in laws, rules and regulations that prevent their access to certain locations or restrict their
use or manner of use in certain areas or during certain times, which could also negatively impact sales. Any material
decline in the social acceptability of the Company’s products could impact the Company’s ability to retain existing
customers or attract new ones which, in turn, could have a material adverse effect on its business, results of operations or
financial condition.
From time to time, we manage our portfolio and grow our business through acquisitions, non-consolidating
investments, alliances and new joint ventures and partnerships, which could be risky and could harm our business.
From time to time, we drive growth in our businesses and accelerate opportunities to expand our global presence and
customer base through targeted acquisitions, non-consolidating investments, alliances, and new joint ventures and
partnerships (each a “Strategic Transaction”) that we believe add value to our existing brands and product portfolio.
Alternatively, we may not be able to identify an attractive Strategic Transaction. The benefits of a Strategic Transaction
may take more time than expected to develop or integrate into our operations, and we cannot guarantee that any Strategic
Transaction will ultimately produce the expected benefits.
There can be no assurance that Strategic Transactions will be completed or that, if completed, they will be successful.
Strategic Transactions pose risks with respect to our ability to project and evaluate market demand, potential synergies
and cost savings, make correct accounting estimates and achieve anticipated business goals and objectives. As we
continue to grow, in part, through Strategic Transactions, our success depends on our ability to anticipate and effectively
manage these risks. If acquired businesses do not achieve forecasted results or otherwise fail to meet projections, it could
affect our results of operations.
In many cases, Strategic Transactions present a number of integration risks. For example, the acquisition may: disrupt
operations in core, adjacent or acquired businesses; require more time or resources than anticipated to be fully integrated
into our operations and systems; create more costs than projected; divert management attention; create the potential of
losing customer, supplier or other critical business relationships; and pose difficulties retaining employees. The inability
to successfully integrate new businesses may result in higher production costs, lost sales or otherwise negatively affect
earnings and financial results.
Potential divestiture activity poses similar risks, including the potential to: disrupt operations in core, adjacent or
acquired businesses; require more time or resources than anticipated to be fully completed; deleverage manufacturing
operations or reduce sourcing efficiencies; reduce gross profit if the Company is not able to reduce fixed cost (including
corporate overhead); not deliver the value anticipated for shareholders; divert management attention; create the potential
of losing customer, supplier or other critical business relationships; and pose difficulties retaining employees. The
13

inability to successfully manage the risks associated with the Company’s divestiture activity may result in higher
production costs, lost sales or otherwise negatively affect earnings and financial results.
Operational Risks
Disruption in our suppliers’ operations could disrupt our production schedule.
Our operations and ability to maintain production is dependent upon our suppliers delivering sufficient quantities of
systems, components, raw materials and parts on time to manufacture our products and meet our production schedules.
For example, we have continued to experience supply disruptions and sourcing challenges for various components
critical to the manufacture of our products.
In some instances, we purchase systems, components, raw materials and parts that are ultimately derived from a single
source or geography and may be at an increased risk for supply disruptions. If necessary, we may not be able to develop
alternate sourcing quickly or at all. Any number of factors, including labor disruptions, catastrophic weather events, the
occurrence of a contagious disease or illness, contractual or other disputes, unfavorable economic or industry conditions,
port, rail, or truck delivery delays or other performance problems or financial difficulties or solvency problems, could
disrupt our suppliers’ operations and lead to uncertainty in our supply chain or cause supply disruptions for us, which
could, in turn, disrupt our operations.
Material disruptions of our production schedule caused by a worsening, prolonged, or other unexpected shortage of
systems, components, raw materials or parts have caused, and could continue to cause, us to not be able to meet customer
demand, to alter production schedules, to delay product launch schedules, or to suspend production entirely, which could
cause a loss of revenues, which could materially and adversely affect our results of operations. These disruptions have
had and may continue to have in the future an adverse impact on our prospects and operating results.
We manufacture our products at, and distribute our products from, several locations in North America and
internationally. An unforeseen increase in demand for our products or any disruption at any of these facilities or
manufacturing delays could adversely affect our business and operating results.
We assemble vehicles at various facilities around the world. Our facilities are typically designed to produce particular
models for particular geographic markets. No single facility is designed to manufacture our full range of vehicles. We
also have several locations that serve as wholegoods and PG&A distribution centers, warehouses and office facilities. In
addition, we have agreements with other third-party manufacturers to manufacture products on our behalf. Should these
or other facilities become unavailable either temporarily or permanently for any number of reasons, including supply
chain constraints, labor disruptions, the occurrence of a contagious disease or illness or catastrophic weather events
(including events caused by climate change), the inability to manufacture at the affected facility may result in harm to
our reputation, increased costs, lower revenues and the loss of customers. We may not be able to easily shift production
to other facilities or to make up for lost production. In addition, our ability to meet customer demand has been
constrained by our ability to manufacture product driven largely by supply chain constraints, among other factors. There
can be no assurance that our current or future manufacturing footprint will be sufficient to meet customer demand or that
we will be able to successfully expand or contract our manufacturing capacity to meet demand, which could result in loss
of revenue and market share.
Although we maintain insurance for damage to our property and disruption of our business from casualties, such
insurance may not be sufficient to cover all of our potential losses. Any disruption in our manufacturing capacity could
have an adverse impact on our ability to produce sufficient inventory of our products or may require us to incur
additional expenses in order to produce sufficient inventory, and therefore, may adversely affect our net sales and
operating results. Disruptions or delays at our manufacturing facilities could impair our ability to meet the demands of
our customers, and our customers may cancel orders or purchase products from our competitors, which could adversely
affect our business and operating results.
We depend on suppliers, financing sources and other strategic partners who may be sensitive to economic conditions
that could affect their businesses in a manner that adversely affects their relationship with us.
We source component parts and raw materials through numerous suppliers and have relationships with a limited number
of product financing sources for our dealers and consumers. Our sales growth and profitability could be adversely
affected if deterioration of economic or business conditions results in a weakening of the financial condition of our
suppliers or financing sources, or if uncertainty about inflation, the economy or the demand for our products causes these
business partners to voluntarily or involuntarily reduce or terminate their relationship with us.
14
Failure to establish and maintain the appropriate level of dealers and distributor relationships or weak economic
conditions impacting those relationships may negatively impact our business and operating results.
We distribute our products through numerous dealers and distributors and rely on them to retail our products to our end
customers and provide service on these products. Our sales growth and profitability could be adversely affected if
deterioration of business conditions or reputational harm results in a weakening of the financial condition of our dealers
and distributors. Additionally, weak demand for, or quality issues with, our products may cause dealers and distributors
to voluntarily or involuntarily reduce or terminate their relationship with us. Further, if we fail to establish and maintain
an appropriate level of dealers and distributors for each of our products, we may not obtain adequate market coverage for
the desired level of retail sales of our products.
Our operations require significant management attention and financial resources, expose us to difficulties presented
by global economic, political, regulatory, accounting, and business factors, and may not be successful or produce
desired levels of sales and profitability.
Investments to increase our global presence, including adding employees and dealers and continuing to invest in business
infrastructure and operations, might not produce the returns we expect, which could adversely affect our profitability.
Our operations and sales are also subject to risks related to political and economic instability, including those caused by
the war between Russia and Ukraine, increased costs of customizing products for foreign countries, labor market
conditions, the imposition of tariffs and other trade barriers or costs, the impact of government laws and regulations, the
effects of income and withholding taxes, governmental expropriation and differences in business practices in different
markets, and multiple, changing, and often inconsistent enforcement of laws, rules, and regulations, including rules
relating to environmental, health, and safety matters. The realization of any of these risks or unfavorable changes in the
political, regulatory and business climate in any of the jurisdictions where we operate could have a material adverse
effect on our total sales, financial condition, profitability, or cash flows.
Weather conditions may reduce demand and negatively impact net sales and production of certain of our products.
Unfavorable weather conditions may reduce demand and negatively impact sales of certain of the Company’s products.
Unfavorable weather, including conditions caused in part by climate change, in any particular geographic region may
have an adverse effect on sales of the Company’s products in that region. For example, lack of snowfall during winter
may materially adversely affect snowmobile sales; excessive rain before and during spring and summer may materially
adversely affect sales of off-road vehicles ATVs, and boats; a lack of rain in certain areas may limit boat usage and may
materially adversely affect sales of boats; and wild fires can limit areas where our customers ride our off-road vehicles
and ATVs. There can be no assurance that weather conditions or natural disasters will not have a material effect on our
sales, production capability or component supply continuity for any of our products.
Our operations are dependent upon attracting and retaining senior executives and skilled employees. Our future
success depends on our continuing ability to identify, hire, develop, motivate, retain and promote skilled personnel for
all areas of our organization and to retain or provide for adequate succession planning for our senior executives.
Our success depends on attracting and retaining qualified personnel. Our ability to sustain and grow our business
requires us to hire, retain and develop a highly skilled and diverse management team and workforce. Many members of
the Company’s management team and other key employees have extensive experience in the Company’s industry and
with its business, products and customers. The unplanned loss of members of the Company’s management team or other
key employees, particularly if combined with difficulties in finding qualified replacements, could negatively affect the
Company’s ability to develop and pursue its business strategy, which could materially adversely affect the Company’s
business, results of operations or financial condition. In addition, the Company’s success depends to a large extent upon
its ability to attract and retain skilled employees. There is intense competition for qualified and skilled employees, and a
failure to recruit, train and retain such employees could have a material adverse effect on its business, results of
operations or financial condition.
The demand, supply, and operational challenges associated with the actual or perceived effects of COVID-19 and the
related widespread impact on global supply chains may negatively impact our business and operating results.
Our business has been, and may continue to be, negatively impacted by the fear of exposure to or actual effects of the
COVID-19 pandemic in the United States and other countries where we operate or our dealers or suppliers are located.
Impacts on our operations include, but are not limited to:
• Reductions in demand or significant future volatility in demand for one or more of our products;
15

• Inability to meet our dealers’ or consumers’ demands due to disruptions in our manufacturing and supply
arrangements caused by the loss or disruption of essential manufacturing and supply elements such as raw
materials or other finished product components, transportation, workforce, or other manufacturing and
distribution capability;
• Failure of third parties on which we rely, including our suppliers, contract manufacturers, distributors, and
contractors to meet their obligations to the Company or to timely meet those obligations, which may be caused
by their own financial or operational difficulties and may adversely impact our operations;
These impacts may have a negative effect on our business, financial condition, results of operations and cash flows, as
well as the trading price of our securities. While we have seen increased demand for our products resulting in part from
effects of the COVID-19 pandemic, there can be no assurance that we can maintain or continue to expand demand for
products in a post-pandemic era. Furthermore, COVID-19 and related supply chain disruptions have impacted and may
further impact the broader economies of affected countries, including negatively impacting economic growth, the proper
functioning of financial and capital markets, foreign currency exchange rates, interest rates, and liquidity. Despite our
efforts to manage and remedy COVID-19 related impacts to the Company, their ultimate impact also depends on factors
beyond our knowledge or control, including the duration and severity of the COVID-19 pandemic, third-party actions
taken to contain its spread and mitigate its public health effects, including efficacy and distribution of available vaccines
to our employees and the general population, and the related impact on consumer confidence and spending.
Product-Specific Risks
A significant adverse determination in any material litigation claim against us could adversely affect our operating
results or financial condition.
The manufacture, sale and usage of products expose us to significant risks associated with product liability, economic
loss, and other claims. If our products are found to be defective or are used incorrectly by our customers, bodily injury,
property damage or other injury, including death, may result. This could give rise to material product liability or
economic loss claims against us or adversely affect our brand image or reputation. Any losses that we may suffer from
any such claims, and the effect that any such liability may have upon the reputation and marketability of our products,
may have a negative impact on our business and operating results.
The Company purchases excess insurance coverage for product liability claims for incidents occurring subsequent to the
policy date that exceed our self-insured retention levels. Disputes with insurers could impact our recoveries under these
policies. Furthermore, certain claims, such as economic loss claims, false marketing claims, and punitive damages, are
uninsured.
Product liability claims have not historically resulted in any material adverse effects on our financial statements,
however, no assurance can be given that this will not change or that material product liability or other claims against us
will not be made in the future. An unanticipated adverse determination of a material product liability claim or other
material claim (particularly an uninsured issue) made against us could materially and adversely affect our financial
condition.
Significant product repair and/or replacement costs due to product warranty claims or product recalls could have a
material adverse impact on our results of operations.
We generally provide limited warranties for our vehicles and boats. We may also provide longer warranties in certain
geographical markets as determined by local regulations and customary practice or related to certain promotional
programs. We also provide a limited emission warranty for certain emission-related parts in our ORVs, snowmobiles,
and motorcycles as required by the EPA and CARB. Our standard warranties require us, through our dealer network, to
repair or replace defective products during such warranty periods.
If a recall of our products were to be implemented, the repair and replacement costs we could incur in connection
therewith could materially and adversely affect our business. Past product recalls have harmed our reputation and caused
us to lose customers. Future product recalls could increasingly cause consumers to question the safety or reliability of our
products and could materially impact our results of operations and financial condition.
16

Regulatory, Intellectual Property, Privacy and Cybersecurity Risks
Our business, properties and products are subject to extensive United States federal and state and international safety,
environmental and other government regulation and any failure to comply with these regulations could harm our
reputation, expose us to damages and otherwise adversely affect our business.
Our business, properties, and products are subject to numerous international, federal, state, and other governmental laws,
rules, and regulations relating to, among other things: climate change; emissions to air; discharges to water; restrictions
placed on water and land usage and water availability; product and associated packaging; use of certain chemicals;
import and export compliance, including country of origin certification requirements; worker and product user health and
safety; consumer privacy; energy efficiency; product life-cycles; outdoor noise laws; and the generation, use, handling,
labeling, collection, management, storage, transportation, treatment, and disposal of hazardous substances, wastes, and
other regulated materials. We are unable to predict the ultimate impact of adopted or future laws, rules, and regulations
on our business, properties, or products.
Any of these laws, rules, or regulations may cause us to incur significant expenses to achieve or maintain compliance,
require us to modify our products, or modify our approach to our workforce, adversely affecting the price of or demand
for some of our products, and ultimately affect the way we conduct our operations. Failure to comply with any of these
laws, rules, or regulations could result in harm to our reputation and/or could lead to fines and other penalties, including
restrictions on the importation of our products into, and the sale of our products in, one or more jurisdictions until
compliance is achieved. In addition, changes to regulations may require us to incur expenses or modify product offerings
in order to maintain compliance with the actions of regulators and could decrease the demand for our products.
Our reliance upon patents, trademark laws, and contractual provisions to protect our proprietary rights may not be
sufficient to protect our intellectual property from others who may sell similar products and may lead to costly
litigation.
We hold patents and trademarks relating to various aspects of our products and believe that proprietary technical know-
how is important to our business. Proprietary rights relating to our products are protected from unauthorized use by third
parties only to the extent that they are covered by valid and enforceable patents or trademarks or are maintained in
confidence as trade secrets. We cannot be certain that we will be issued any patents from any pending or future patent
applications owned by or licensed to us or that the claims allowed under any issued patents will be sufficiently broad to
protect our technology. In the absence of enforceable patent or trademark protection, we may be vulnerable to
competitors who attempt to copy our products, gain access to our trade secrets and know-how or diminish our brand
through unauthorized use of our trademarks, all of which could adversely affect our business. Others may initiate
litigation to challenge the validity of our patents, or allege that we infringe their patents, or they may use their resources
to design comparable products that do not infringe our patents. We may incur substantial costs if our competitors initiate
litigation to challenge the validity of our patents, or allege that we infringe their patents, or if we initiate proceedings to
protect our proprietary rights. If the outcome of any such litigation is unfavorable to us, our business, operating results,
and financial condition could be adversely affected. Regardless of whether litigation relating to our intellectual property
rights is successful, the litigation could significantly increase our costs and divert management’s attention from operation
of our business, which could adversely affect our results of operations and financial condition. We also cannot be certain
that our products or technologies have not infringed or will not infringe the proprietary rights of others. Any such
infringement could cause third parties, including our competitors, to bring claims against us, resulting in significant
costs, possible damages and substantial uncertainty.
We may be subject to cybersecurity breaches and other disruptions to our information technology systems and
connected products that could adversely affect our business.
We use many information technology systems, some of which are managed by third parties, and manufacture connected
products (including connected vehicles), some of which are managed by third parties, in operating our business. Those
systems and products process potentially sensitive information, including intellectual property; proprietary business
information of Polaris and our dealers, suppliers, and other business partners; and personal information of consumers and
employees. Our systems and products, including those managed by third parties, have been, and could be in the future
vulnerable to breach, damage, disruption, or breakdown from various sources, including power loss, viruses, malware,
ransomware, phishing, denial of service, and other cyber-attacks that may be random, targeted, or the result of
misconduct of error by individuals with access to our systems. While we invest in layers of data and information
technology protection, and monitor continually evolving cybersecurity threats, there can be no assurance that our efforts
will prevent disruptions or breaches of our systems and connected products.
17

We have experienced cyber-attacks, as have third-parties who manage our information technology systems and other
third-party suppliers and service providers, but to our knowledge, we have not experienced any material disruptions or
breaches of our information technology systems, connected products, or operations as a result of such cyber-attacks. We
could, however, experience material disruptions or breaches in the future. Such disruptions or breaches of our
information technology systems and connected products could adversely affect our business by resulting in, among other
things: (i) disruption to our business operations; (ii) compromise or loss of the information processed by those systems
and products, such as intellectual property, proprietary information, or personal information; (iii) impact to the
performance and/or safety of our connected products; (iv) damage to our reputation; and (v) litigation or regulatory
proceedings. We are subject to laws and regulations in the United States and other countries concerning the handling of
personal information, including laws that require us to notify governmental authorities and/or affected individuals of data
breaches involving certain personal information. These laws and regulations include, for example, the European General
Data Protection Regulation (“GDPR”) and the California Consumer Privacy Act (“CCPA”). Regulatory actions or
litigation seeking to impose significant penalties could be brought against us in the event of a data breach or alleged non-
compliance with such laws and regulations.
Finance and Capital Structure Risks
Fluctuations in foreign currency exchange rates could result in declines in our reported sales and net earnings.
The changing relationships of the United States dollar to the Canadian dollar, Australian dollar, the Euro, the Swiss
franc, the Mexican peso, and certain other foreign currencies have from time to time had a negative impact on our results
of operations. Fluctuations in the value of the United States dollar relative to these foreign currencies can adversely
affect the price of our products in foreign markets, the costs we incur to import certain components for our products, and
the translation of our foreign balance sheets. In addition, with the recent strengthening of the United States dollar, we
have experienced a corresponding negative impact on our financial results with respect to our foreign operations. While
we actively manage our exposure to fluctuating foreign currency exchange rates by entering into foreign exchange
hedging contracts from time to time, these contracts hedge foreign currency denominated transactions, and any change in
the fair value of the contracts would be offset by changes in the underlying value of the transactions being hedged.
Retail credit market deterioration and volatility may restrict the ability of our retail customers to finance the purchase
of our products and adversely affect our income from financial services.
We have arrangements with third parties to make retail financing available to consumers who purchase our products in
the United States. Furthermore, some customers use financing from lenders who do not partner with us, such as local
banks and credit unions. There can be no assurance that retail financing will continue to be available in the same amounts
and under the same terms that had been previously available to our customers. If retail financing is not available to
customers on satisfactory terms, consumer demand could be materially impacted and our sales and profitability could be
adversely affected.
We have a significant amount of debt outstanding and must comply with restrictive covenants in our debt agreements.
Our credit agreement and other debt agreements contain financial and restrictive covenants that may limit our ability to,
among other things, borrow additional funds or take advantage of business opportunities. While we are currently in
compliance with the financial covenants, increases in our debt or decreases in our earnings could cause us to fail to
comply with these financial covenants. Failing to comply with such covenants could result in an event of default that, if
not cured or waived, could result in the acceleration of all our indebtedness or otherwise have a material adverse effect
on our financial position, results of operation and debt service capability.
Our level of debt and the financial and restrictive covenants contained in our credit agreement could have important
consequences on our financial position and results of operations, including increasing our vulnerability to increases in
interest rates because debt under our credit agreement bears interest at variable rates.
General Risks
Additional tax expense or tax exposure could impact our financial performance.
We are subject to income taxes and other business taxes in various jurisdictions in which we operate. Our tax liabilities
are dependent upon the earnings generated in these different jurisdictions. Our provision for income taxes and cash tax
liability could be adversely affected by numerous factors, including income before taxes being lower than anticipated in
jurisdictions with lower statutory tax rates and higher than anticipated in jurisdictions with higher statutory tax rates,
changes in the valuation of deferred tax assets and liabilities and changes in tax laws and regulations in various
18
jurisdictions. We also have negotiated and are party to certain tax incentives that require the Company comply with
certain covenants. We are also subject to the continuous examination of our income tax returns by various tax authorities.
The results of audits and examinations of previously filed tax returns and continuing assessments of our tax exposures or
the loss of any tax incentive may have an adverse effect on the Company’s provision for income taxes and cash tax
liability.
An impairment in the carrying value of goodwill and trade names could negatively impact our consolidated results of
operations and net worth.
Goodwill and indefinite-lived intangible assets, such as our trade names, are recorded at fair value at the time of
acquisition and are not amortized but are reviewed for impairment at least annually or more frequently if impairment
indicators arise. Our determination of whether goodwill impairment has occurred is based on a comparison of each of our
reporting units’ fair market value with its carrying value. Significant and unanticipated changes in circumstances, such as
significant and long-term adverse changes in business climate, negative perception of the Company’s brands and
tradenames, unanticipated competition, and/or changes in technology or markets, could require a provision for
impairment in a future period that could negatively impact our reported earnings and reduce our consolidated net worth
and shareholders’ equity.
Expectation relating to environmental, social and governance considerations expose us to potential liabilities,
increased costs, reputational harm and other adverse effects on our business.
Many governments, regulators, investors, employees, customers and other stakeholders are increasingly focused on
environmental, social and governance (“ESG”) considerations relating to businesses, including climate change and
greenhouse gas emissions, human capital and diversity, equity and inclusion. We make statements about our ESG goals
and initiatives through information provided on our website, press statements and other communications, including
through our “Geared for Good” ESG Report. Responding to these ESG considerations and implementation of these goals
and initiatives involves risks and uncertainties, including those described under “Forward-Looking Statements,” requires
investments and are impacted by factors that may be outside of our control. In addition, some stakeholders may disagree
with our goals and initiatives and the focus of stakeholders may change and evolve over time. Stakeholders also may
have very different views on where ESG focus should be placed, including differing views of regulators in various
jurisdictions in which we operate. Any failure, or perceived failure, by us to achieve our goals, further our initiatives,
adhere to our public statements, comply with federal, state or international ESG laws and regulations, or meet evolving
and varied stakeholder expectations and standards could result in legal and regulatory proceedings against us and
materially adversely affect our business, reputation, results of operations, financial condition and stock price.
Item 1B. Unresolved Staff Comments
Not Applicable.
19

Item 2. Properties
The following sets forth the Company’s material properties as of December 31, 2022:
Medina, Minnesota Headquarters Corp Owned 130,000
Roseau, Minnesota Wholegoods manufacturing and R&D Off Owned 813,000
Huntsville, Alabama Wholegoods manufacturing Off / On
Primarily
owned
1,355,000
Monterrey, Mexico Wholegoods manufacturing Off
Primarily
owned
2,000,000
Elkhart, Indiana Wholegoods manufacturing M
Primarily
owned
1,242,000
Opole, Poland Wholegoods manufacturing Off / On Leased 365,000
Spirit Lake, Iowa Wholegoods manufacturing On Owned 448,000
Chanas, France Wholegoods manufacturing On Owned 196,000
Shanghai, China Wholegoods manufacturing Off Leased 214,000
Bourran, France Wholegoods manufacturing and R&D On Leased 105,000
Aix-les-Bains, France Wholegoods manufacturing and R&D On Owned 98,000
Osceola, Wisconsin Component parts & engine manufacturing Off / On Owned 293,000
Monticello, Minnesota Component parts manufacturing Off / On Owned 109,000
Wyoming, Minnesota Research and development facility Off / On Owned 272,000
Fernley, Nevada Distribution center Off / On Owned 475,000
Wilmington, Ohio Distribution center Off / On Owned 658,000
Vermillion, South Dakota Distribution center Off / On Owned 610,000
Rigby, Idaho Distribution center and office facility Off / On Owned 108,000
Plymouth, Minnesota Office facility Corp
Primarily
owned
170,000
*Legend: Corp - Corporate (all segments), Off - Off Road, On - On Road, M - Marine
Location Facility Type/Use
Primary
Segment*
Owned or
Leased
Square
Footage
Including the material properties listed above and those properties not listed, we have over six million square feet of
global manufacturing and research and development space. Additionally, we have over six million square feet of global
warehouse and distribution center space. We also have international office facilities in Western Europe, Australia, Brazil,
India, China, Japan, and Mexico.
We own substantially all tooling and machinery used in the manufacture of our products. We make ongoing capital
investments in our facilities. These investments have increased production capacity for our products. We believe our
current manufacturing and distribution facilities are adequate in size and suitable for our present manufacturing and
distribution needs.
Item 3. Legal Proceedings
We are involved in a number of legal proceedings incidental to our business, none of which is presently expected to have
a material effect on the financial results of our business.
As of the date hereof, we are party to putative class actions brought by the same plaintiff’s counsel and largely repeating
the same allegations regarding various state consumer protection laws focused on rollover protection systems’
certifications for various Polaris off-road vehicles sold in California and Oregon. The first case brought related to this
matter—Guzman—was first reported in the Company’s Annual Report on Form 10-K for the year ended December 31,
2020. The district court granted summary judgment against both plaintiffs’ claims, which the plaintiffs appealed. The
Ninth Circuit recently issued two rulings that reversed the district court’s summary judgment rulings and remanded the
case to the district court with instructions to dismiss one plaintiff’s claims without prejudice. The plaintiff whose claims
were dismissed without prejudice refiled a putative class action in California State Court under the name Albright. The
second case—Hellman/Berlanga—was first reported in the Company’s quarterly report for the period ended June 30,
20
2021. Additional similar putative class actions on behalf of certain plaintiffs dismissed from the Hellman case have been
filed in Texas (Lollar), Nevada (Mitchell), and Oregon (Artoff), though the Lollar and Mitchell matters have since been
dismissed, and another plaintiff from the Hellman/Berlanga matter, Michael Hellman, has been dismissed.
As previously reported in the Company’s quarterly report on Form 10-Q for the period ended September 30, 2021, the
district court in In re Polaris dismissed half of the plaintiffs and their claims related to alleged fire hazards in certain
Polaris products. Plaintiffs’ counsel voluntarily dismissed the remaining plaintiffs to appeal. The Eighth Circuit affirmed
dismissal of the claims brought by plaintiffs who had appealed. On April 28, 2022, the In re Polaris plaintiffs’ counsel
filed a new, substantially similar putative class action in California State Court, seeking damages for alleged economic
loss: James DeBiasio v. Polaris Industries Inc. (County of Los Angeles, Ca.). We removed the matter to federal court in
June 2022 (C.D. Cal.) and have moved to dismiss the plaintiff’s claims; plaintiff filed a motion to remand the case. The
district court denied plaintiff’s motion to remand and granted our motion to dismiss, allowing plaintiff to file an amended
complaint. We recently moved to dismiss plaintiff’s amended complaint and the Court is scheduled to hold a hearing on
the motion in March 2023.
As previously reported in the Company’s quarterly report on Form 10-Q for the period ended September 30, 2021, the
district court in Johannessohn denied class certification related to plaintiffs’ claims of excessive heat hazards in
Sportsman ATVs. The Eighth Circuit subsequently affirmed that denial. On June 13, 2022, Johannessohn plaintiffs’
counsel filed a new, substantially similar putative class action in Minnesota state court, seeking damages for alleged
economic loss: Jay Miller, individually and on behalf of all others similarly situated v. Polaris Inc. (4
th
Dist. Minn.).
After we moved to dismiss, the Miller court dismissed plaintiff’s class claims with prejudice, leaving only his individual
claims for alleged economic loss.
With respect to each of these putative class action lawsuits, the Company is unable to provide any reasonable evaluation
of the likelihood that a loss will be incurred or any reasonable estimate of the range of possible loss.
Item 4. Mine Safety Disclosures
Not applicable.
21

PART II
Item 5. Market for Registrant’s Common Equity, Related Stockholder Matters and Issuer Purchases of Equity
Securities
Shares of common stock of Polaris Inc. trade on the New York Stock Exchange under the symbol PII. On February 10,
2023, there were 1,655 shareholders of record of the Company’s common stock and the last reported sale price for shares
of our common stock on the New York Stock Exchange was $115.20 per share. The Company has historically paid cash
dividends and expects to continue to pay comparable cash dividends in the future, subject to the approval of the
Company’s Board of Directors, which will depend on market and other conditions.
STOCK PERFORMANCE GRAPH
The following graph compares the five-year cumulative total return to shareholders (stock price appreciation plus
reinvested dividends) for the Company’s common stock with the comparable cumulative return of three indexes: S&P
Midcap 400 Index, S&P Composite 1500 Leisure Products Index, and Morningstar’s Global Recreational Vehicles
Index. The S&P Composite 1500 Leisure Products Index will replace the Morningstar Global Recreational Vehicles
Index in this analysis going forward as it includes companies that are more closely aligned with our industry and
strategic direction.
The graph assumes the investment of $100 at the close on December 31, 2017 in common stock of the Company and in
each of the indexes, and the reinvestment of all dividends since that date to December 31, 2022. Points on the graph
represent the performance as of the last business day of each of the years indicated.
Assumes $100 Invested at the close on December 31, 2017
Assumes Dividend Reinvestment
Fiscal Year Ended December 31, 2022
Polaris Inc. . . . . . . . . . . . . . . . . . . . . . . . . . . . $ 100.00 $ 63.24 $ 86.29 $ 83.01 $ 97.79 $ 91.90
S&P Midcap 400 Index . . . . . . . . . . . . . . . . . 100.00 88.92 112.21 127.54 159.12 138.34
S&P Composite 1500 Leisure Products Index 100.00 80.06 103.47 119.05 144.36 100.85
Morningstar Global Recreational Vehicles
Index . . . . . . . . . . . . . . . . . . . . . . . . . . . . . .
100.00 57.10 75.86 95.59 118.73 92.91
2017 2018 2019 2020 2021 2022
22
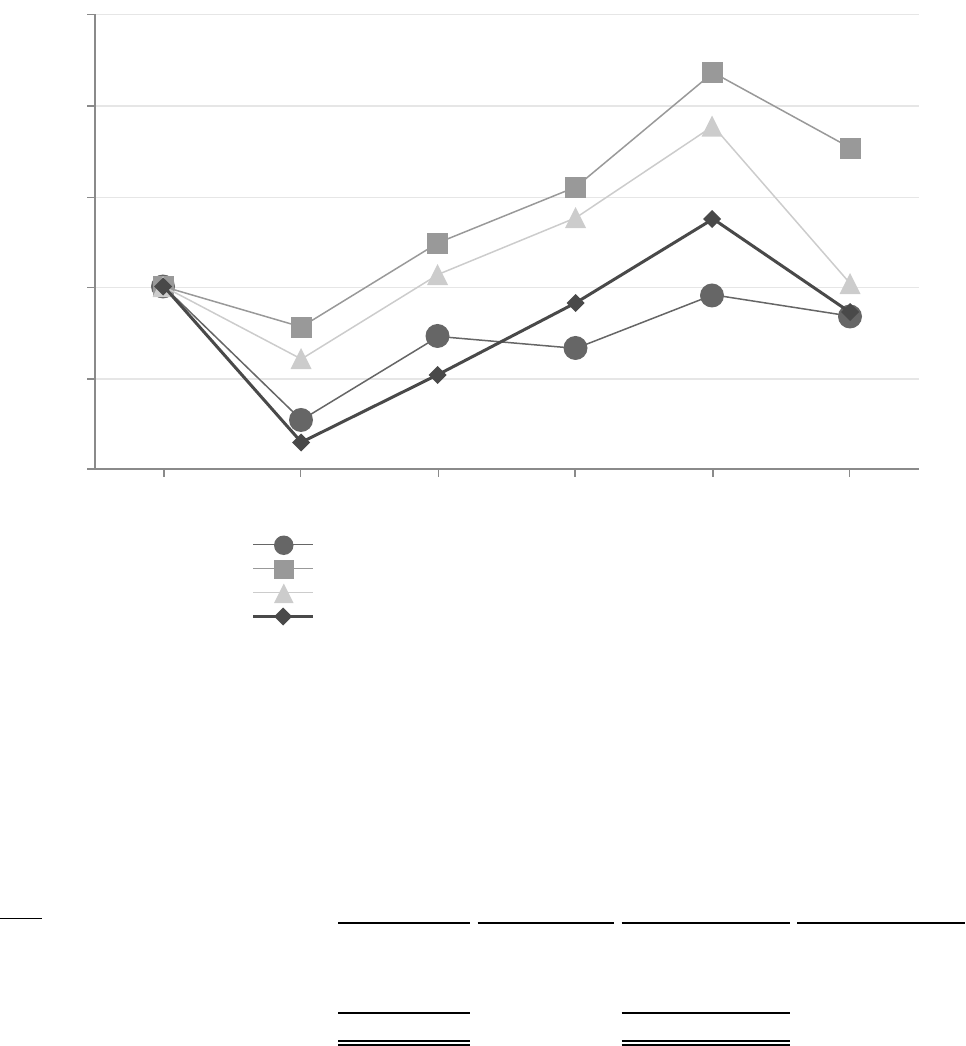
Comparison of 5-Year Cumulative Total Return Among Polaris Inc., S&P Midcap 400 Index, S&P Composite
1500 Leisure Products Index, and Morningstar’s Global Recreational Vehicles Index
Polaris Inc.
S&P Midcap 400 Index
S&P Composite 1500 Leisure Products Index
Morningstar Global Recreational Vehicles Index
2017 2018 2019 2020 2021 2022
50
75
100
125
150
175
This performance graph shall not be deemed “soliciting material” or “filed” with the SEC for purposes of Section 18 of
the Exchange Act, or otherwise subject to the liabilities under that Section, and shall not be deemed to be incorporated by
reference into any of our filings under the Securities Act or the Exchange Act.
The table below sets forth the information with respect to purchases made by or on behalf of Polaris of its own stock
during the fourth quarter of the fiscal year ended December 31, 2022.
Issuer Purchases of Equity Securities
October 1–31, 2022 . . . . . . . . . . . . . . . . 150,000 $ 101.40 150,000 $ 460,393,160
November 1–30, 2022 . . . . . . . . . . . . . . 750,000 $ 108.34 750,000 $ 379,143,259
December 1–31, 2022 . . . . . . . . . . . . . . . 275,000 $ 109.23 275,000 $ 349,109,019
Total . . . . . . . . . . . . . . . . . . . . . . . . . . . 1,175,000 $ 107.66 1,175,000
Period
Total Number of
Shares Purchased
Average Price Paid
per Share
Total Number of
Shares Purchased as
Part of Publicly
Announced Program
Approximate Dollar
Value of Shares That
May Yet Be Purchased
Under the Program
(1)
(1) In April 2021, the Company’s Board of Directors authorized the purchase of up to $1.0 billion of the Company’s
common stock (the “Program”), which replaced the previous share repurchase program. As of December 31, 2022,
the approximate value of shares that may yet to be purchased pursuant to the Program is $349.1 million. The
Program does not have an expiration date.
Item 6. [Reserved]
23
Item 7. Management’s Discussion and Analysis of Financial Condition and Results of Operations
The following discussion pertains to the results of operations and financial position of the Company and should be read
in conjunction with the Consolidated Financial Statements and the Notes thereto included elsewhere in this report. This
section of this Form 10-K generally discusses 2022 and 2021 items and year-to-year comparisons between 2022 and
2021. Discussions of 2020 items and year-to-year comparisons between 2021 and 2020 that are not included in this Form
10-K can be found in “Management’s Discussion and Analysis of Financial Condition and Results of Operations” in Part
II, Item 7 of our Annual Report on Form 10-K for the fiscal year ended December 31, 2021.
Overview
2022 was a record year for sales which totaled $8.6 billion, a 15 percent increase from 2021. The Company achieved
growth across all segments and regions driven primarily by favorable product mix and higher pricing compared to 2021.
The impact of the novel coronavirus (“COVID-19”) pandemic as well as other disruptive events have impacted the
global economy, disrupted global supply chains and created significant volatility and disruption of financial markets. The
impact of these factors has affected our business segments, employees, dealers, suppliers, and customers in a variety of
ways.
In 2021 and the first half of 2022 we saw strong retail demand for our products. Consistent with macroeconomic trends,
as we progressed through 2022, we have seen indicators of demand moderating. Due to the dynamics of the COVID-19
pandemic, heightened demand, natural disasters, and geopolitical events, including the conflict between Russia and
Ukraine and related sanctions, our supply chain and manufacturing operations have experienced inefficiencies caused by
production-limiting disruptions, including supplier labor shortages. Although these disruptions are moderating, we have
made pricing changes to address the resulting increase in production costs.
The duration of these trends and the magnitude of such impacts cannot be precisely estimated at this time, as they are
affected by a number of factors (some of which are outside management’s control), including those presented in Item 1A.
Risk Factors of this Annual Report.
Full year net income from continuing operations attributable to Polaris Inc. of $602.9 million increased 22 percent from
2021, with diluted earnings per share from continuing operations increasing from $7.92 to $10.04 per share. These
increases were primarily driven by higher pricing and favorable product mix.
On February 2, 2023, we announced that our Board of Directors approved a two percent increase in the quarterly cash
dividend to $0.65 per share for the first quarter of 2023, representing the 28th consecutive year of increased dividends to
shareholders.
24

Consolidated Results of Operations
The consolidated results of operations were as follows:
For the Years Ended December 31,
($ in millions except per share data) 2022 2021
Change
2022 vs. 2021 2020
Change
2021 vs. 2020
Sales . . . . . . . . . . . . . . . . . . . . . . . . . . . . . . . $ 8,589.0 $ 7,439.2 15 % $ 6,281.4 18 %
Cost of sales . . . . . . . . . . . . . . . . . . . . . . . . . $ 6,629.5 $ 5,688.3 17 % $ 4,745.7 20 %
Gross profit . . . . . . . . . . . . . . . . . . . . . . . . . . $ 1,959.5 $ 1,750.9 12 % $ 1,535.7 14 %
Percentage of sales . . . . . . . . . . . . . . . . . . 22.8 % 23.5 % -72 basis
points
24.4 % -91 basis
points
Operating expenses: . . . . . . . . . . . . . . . . . . .
Selling and marketing . . . . . . . . . . . . . . $ 480.8 $ 458.2 5 % $ 429.8 7 %
Research and development . . . . . . . . . . 366.7 328.7 12 % 288.1 14 %
General and administrative . . . . . . . . . . 355.9 305.8 16 % 296.1 3 %
Goodwill impairment . . . . . . . . . . . . . . . . — — 81.1 NM
Total operating expenses . . . . . . . . . . . . . . $ 1,203.4 $ 1,092.7 10 % $ 1,095.1 — %
Percentage of sales . . . . . . . . . . . . . . . . . . . . 14.0 % 14.7 % -68 basis
points
17.4 % -275 basis
points
Income from financial services . . . . . . . . . . . $ 48.4 $ 53.8 (10) % $ 80.4 (33) %
Operating income . . . . . . . . . . . . . . . . . . . . . $ 804.5 $ 712.0 13 % $ 521.0 37 %
Non-operating expense: . . . . . . . . . . . . . . . .
Interest expense . . . . . . . . . . . . . . . . . . . . $ 71.7 $ 44.2 62 % $ 66.8 (34) %
Other (income) expense, net . . . . . . . . . . . $ (28.6) $ 2.3 NM $ 3.8 (39) %
Loss on sale of businesses . . . . . . . . . . . . $ — $ 36.8 NM $ — NM
Income from continuing operations before
income taxes . . . . . . . . . . . . . . . . . . . . . . . . .
$ 761.4 $ 628.7 21 % $ 450.4 40 %
Provision for income taxes . . . . . . . . . . . . . . $ 158.0 $ 132.1 20 % $ 89.9 47 %
Effective income tax rate . . . . . . . . . . . . . 20.7 % 21.0 % -26 basis
points
20.0 % +106 basis
points
Net income from continuing operations . . . . $ 603.4 $ 496.6 22 % $ 360.5 38 %
Net income attributable to noncontrolling
interest . . . . . . . . . . . . . . . . . . . . . . . . . . . . . .
(0.5) (0.4) 25 % (0.1) NM
Net income from continuing operations
attributable to Polaris Inc. . . . . . . . . . . . . . . .
$ 602.9 $ 496.2 22 % $ 360.4 38 %
Diluted net income from continuing
operations per share attributable to Polaris
Inc. shareholders . . . . . . . . . . . . . . . . . . . . . .
$ 10.04 $ 7.92 27 % $ 5.75 38 %
Weighted average diluted shares outstanding 60.1 62.7 (4) % 62.6 — %
NM = not meaningful . . . . . . . . . . . . . . . . . .
25

Sales:
Sales were $8,589.0 million in 2022, a 15 percent increase from $7,439.2 million in 2021. The components of the
consolidated sales change were as follows:
2022 2021
Volume . . . . . . . . . . . . . . . . . . . . . . . . . . . . . . . . . . . . . . . . . . . . . . . . . . . . . . . 1 % 9 %
Product mix and price . . . . . . . . . . . . . . . . . . . . . . . . . . . . . . . . . . . . . . . . . . . . 16 8
Currency . . . . . . . . . . . . . . . . . . . . . . . . . . . . . . . . . . . . . . . . . . . . . . . . . . . . . . (2) 1
15 % 18 %
Percent change in total
Company sales compared to the prior year
Favorable product mix and higher pricing contributed a 16 percent increase to sales in 2022. Volume contributed a one
percent increase in 2022 driven by increased motorcycle and snowmobile shipments, partially offset by lower off-road
vehicle shipments. Currency rate movements drove a two percent decrease in sales for 2022.
Volume contributed a nine percent increase in 2021 driven by increased shipments in all segments, but most significantly
ORV, as well as higher PG&A sales. Product mix and price contributed an eight percent increase in 2021, primarily due
to lower promotional spending and increased product pricing. Currency rate movements contributed a one percent
increase for 2021.
Sales by geographic region were as follows:
($ in millions)
2022
Percent
of Total
Sales 2021
Percent
of Total
Sales
Percent
Change
2022 vs.
2021 2020
Percent
of Total
Sales
Percent
Change
2021 vs.
2020
United States . . . . . . . . . $ 6,809.2
79 %
$ 5,742.3
77 %
19 % $ 5,073.5
81 %
13 %
Canada . . . . . . . . . . . . . . 606.7
7 %
573.7
8 %
6 % 367.2
6 %
56 %
Other countries . . . . . . . . 1,173.1
14 %
1,123.2
15 %
4 % 840.7
13 %
34 %
Total sales . . . . . . . . . . . $ 8,589.0
100 %
$ 7,439.2
100 %
15 % $ 6,281.4
100 %
18 %
For the Years Ended December 31,
Sales in the United States for 2022 increased 19 percent during the year, primarily driven by favorable product mix,
higher pricing, and increased motorcycle and snowmobile shipments. Sales in the United States represented 79 percent of
total Company sales in 2022.
Sales in the United States for 2021 increased 13 percent, primarily driven by increased ORV and boat shipments, as well
as higher PG&A sales.
Sales in Canada for 2022 increased six percent during the year, primarily driven by favorable product mix and higher
pricing. Currency rate movements had an unfavorable impact of four percentage points on sales in 2022. Sales in Canada
represented seven percent of total company sales in 2022.
Sales in Canada for 2021 increased 56 percent, primarily driven by increased ORV shipments. Currency rate movements
had a favorable impact of eight percentage points on sales in 2021.
Sales in other countries, primarily in Europe, increased four percent during 2022, primarily driven by increased
motorcycle shipments and higher pricing. Currency rate movements had an unfavorable impact of nine percentage points
on sales in 2022. Sales in other countries represented 14 percent of total company sales in 2022.
Sales in other foreign countries increased 34 percent during 2021, primarily driven by increased ORV and motorcycle
shipments. Currency rate movements had a favorable impact of five percentage points on sales in 2021.
26

Cost of sales:
The following table reflects our cost of sales in dollars and as a percentage of sales:
($ in millions)
2022
Percent of
Total Cost
of Sales 2021
Percent of
Total Cost
of Sales
Change
2022 vs.
2021 2020
Percent of
Total Cost
of Sales
Change
2021 vs.
2020
Purchased materials
and services . . .
$ 5,606.4
84 %
$ 4,826.8
85 %
16 % $ 3,993.5
84 %
21 %
Labor and benefits 656.0
10 %
568.5
10 %
15 % 456.5
10 %
25 %
Depreciation and
amortization . . .
183.6
3 %
162.6
3 %
13 % 172.0
3 %
(5) %
Warranty costs . . . 183.5
3 %
130.4
2 %
41 % 123.7
3 %
5 %
Total cost of sales . $ 6,629.5
100 %
$ 5,688.3
100 %
17 % $ 4,745.7
100 %
20 %
Percentage of sales . 77.2 % 76.5 % +72 basis
points
75.6 % +91 basis
points
For the Years Ended December 31,
Cost of sales increased 17 percent in 2022 primarily due to changes in product mix, as well as higher warranty, labor,
raw materials, and logistics costs. Cost of sales increased 20 percent in 2021 primarily due to increased wholegood and
PG&A shipments, as well as higher labor, raw materials, and logistics costs.
Gross profit:
Gross profit for 2022, as a percentage of sales, decreased primarily due to higher input costs including logistics,
components, and commodity prices, plant inefficiencies related to supply chain constraints, and higher warranty costs,
partially offset by higher pricing and favorable product mix.
Gross profit for 2021, as a percentage of sales, decreased primarily due to higher input costs including logistics,
components, and commodity prices, as well as plant inefficiencies related to supply chain constraints. The decrease was
partially offset by higher sales volume, lower promotional costs and favorable pricing.
Operating expenses:
Operating expenses for 2022, in absolute dollars, increased compared to 2021, primarily due to higher research and
development and general and administrative expenses. Operating expenses for 2022, as a percent of sales, decreased
compared to 2021, primarily due to higher pricing and favorable mix which drove increased sales.
Operating expenses for 2021, in absolute dollars and as a percent of sales, decreased primarily due to the prior year
impairment of goodwill, partially offset by an increase in total operating expenses to levels commensurate with increases
in demand.
Income from financial services:
The following table reflects our income from financial services:
For the Years Ended December 31,
($ in millions) 2022 2021
Change
2022 vs. 2021 2020
Change
2021 vs. 2020
Income from Polaris Acceptance joint venture . . . . . . . $ 15.1 $ 7.7 96 % $ 18.5 (58) %
Income from retail credit agreements . . . . . . . . . . . . . . . 34.3 41.3 (17) % 58.7 (30) %
Net income (expense) from other financial services
activities . . . . . . . . . . . . . . . . . . . . . . . . . . . . . . . . . . .
(1.0) 4.8 NM 3.2 50 %
Total income from financial services . . . . . . . . . . . . . . . $ 48.4 $ 53.8 (10) % $ 80.4 (33) %
Percentage of sales . . . . . . . . . . . . . . . . . . . . . . . . . . . . . 0.6 % 0.7 % -16 basis
points
1.3 % -56 basis
points
Income from financial services decreased 10 percent for 2022, primarily due to lower retail credit income resulting from
lower retail sales, partially offset by higher wholesale financing income from Polaris Acceptance due to higher dealer
inventory levels.
27
Interest expense:
Interest expense increased for 2022 due to higher debt levels and higher interest rates.
Other (income) expense, net:
Other (income) expense is the result of currency exchange rate movements and the corresponding effects on currency
transactions related to our international subsidiaries. Also included in Other (income) expense, net in 2021 is a $7.7
million impairment charge related to an investment in a strategic partner that was associated with a divested business.
Loss on sale of businesses:
In the fourth quarter of 2021, we divested our GEM and Taylor-Dunn businesses which resulted in a $36.8 million loss.
Provision for income taxes:
The decrease in the effective income tax rate for 2022 was primarily due to an increased deduction for Foreign Derived
Intangible Income (“FDII”) and incremental foreign tax credits, partially offset by a decrease in research and
development credits, as well as the unfavorable impact of higher pretax income generated in the current period.
The increase in the effective income tax rate for 2021 was primarily due to the favorable impact of lower pretax income
generated in 2020 and the release of certain income tax reserves due to favorable federal tax examination developments
in 2020. The increase was partially offset by favorable income tax benefits in jurisdictions with lower tax rates, as well
as favorable income tax benefits from research and development credits in 2021.
Weighted average shares outstanding:
Weighted average diluted shares outstanding decreased in 2022 primarily due to share repurchases.
Segment Results of Operations
On January 1, 2022, the Company began management of its portfolio of businesses under a new basis as a result of the
divestiture of the GEM and Taylor-Dunn businesses. As a such, the Global Adjacent Markets segment was eliminated
and the results of the Company’s remaining businesses historically included within the Global Adjacent Markets segment
were reclassified to the Off Road and On Road segments. All historical segment results were reclassified for
comparability, including the divested businesses which are included in Corporate.
On June 30, 2022, the Company again began management of its portfolio of businesses under a new basis as a result of
the divestiture of TAP. As such, the Aftermarket segment was eliminated and the results of the Company’s remaining
aftermarket businesses historically included within the Aftermarket segment were reclassified to the Off Road and On
Road segments. All historical segment results were reclassified for comparability.
The summary that follows provides a discussion of the results of operations of each of our three reportable segments, Off
Road, On Road, and Marine. Each of these segments is comprised of various product offerings that serve multiple end
markets. We evaluate performance based on sales and gross profit. The Corporate amounts include revenues and costs of
businesses that were divested in 2021, as well as costs that are not allocated to segments, including certain unallocated
manufacturing costs. Businesses that are presented as discontinued operations are excluded from the tables below.
28

Our sales and gross profit by reporting segment, which includes the respective PG&A, were as follows:
($ in millions) 2022
Percent
of Sales 2021
Percent
of Sales
Percent
Change
2022 vs.
2021 2020
Percent
of Sales
Percent
Change
2021 vs.
2020
Off Road . . . . . . . . . . . . . . .
$ 6,436.2
75 %
$ 5,574.6
75 %
15 % $ 4,810.0
76 %
16 %
On Road . . . . . . . . . . . . . . .
1,163.4
14 %
1,031.8
14 %
13 % 806.7
13 %
28 %
Marine . . . . . . . . . . . . . . . .
989.4
11 %
760.2
10 %
30 % 603.4
10 %
26 %
Corporate . . . . . . . . . . . . . .
—
— %
72.6
1 %
NM 61.3
1 %
18 %
Total sales . . . . . . . . . . .
$ 8,589.0
100 %
$ 7,439.2
100 %
15 % $ 6,281.4
100 %
18 %
For the Years Ended December 31,
($ in millions) . . . . . . . . . . . . . . . 2022
Percent
of Sales 2021
Percent
of Sales
Percent
Change
2022 vs.
2021
2020
Percent
of Sales
Percent
Change
2021 vs.
2020
Off Road . . . . . . . . . . . . . . .
$ 1,523.4
23.7 %
$ 1,329.8
23.9 %
15 % $ 1,302.0
27.1 %
2 %
On Road . . . . . . . . . . . . . . .
206.3
17.7 %
160.7
15.6 %
28 % 95.5
11.8 %
68 %
Marine . . . . . . . . . . . . . . . .
222.5
22.5 %
170.6
22.4 %
30 % 116.4
19.3 %
47 %
Corporate . . . . . . . . . . . . . .
7.3 89.8 NM 21.8 NM
Total gross profit . . . . . . .
$ 1,959.5
22.8 %
$ 1,750.9
23.5 %
12 % $ 1,535.7
24.4 %
14 %
NM = not meaningful
For the Years Ended December 31,
Off Road:
Off Road sales, inclusive of PG&A sales, increased 15 percent in 2022 driven by favorable product mix and higher
pricing. Sales to customers outside of North America increased five percent in 2022 driven by higher pricing and
increased snowmobile shipments. The average per unit sales price for the Off Road segment increased approximately 18
percent, driven by higher pricing.
Additional information on our end markets for 2022:
• Polaris North America ATV unit retail sales down low-twenties percent
• Polaris North America side-by-side unit retail sales down mid-teens percent
• Total Polaris North America ORV unit retail sales down high-teens percent
• Estimated North America industry ORV unit retail sales down about 10 percent
• Total Polaris North America ORV dealer inventories up approximately 140 percent
• Polaris North America snowmobile unit retail sales for the 2022-2023 season-to-date period through December
31, 2022 down mid-single digits percent
• Estimated North America industry snowmobile unit retail sales for the 2022-2023 season-to-date period through
December 31, 2022 up low-single digits percent
• Total Polaris North America snowmobile dealer inventories up approximately 45 percent
Gross profit, as a percentage of sales, decreased in 2022 primarily due to higher input costs including logistics,
components, and commodity prices, plant inefficiencies related to supply chain constraints, and higher warranty costs,
mostly offset by higher pricing.
Off Road sales increased 16 percent in 2021 driven by broad-based demand and shipments across ATV and side-by-side
product lines, including PG&A, as well as increased pricing. Gross profit, as a percentage of sales, decreased in 2021
primarily due to higher input costs including logistics, components, and commodity prices, as well as plant inefficiencies
related to supply chain constraints, partially offset by favorable mix, lower promotional costs, and higher pricing.
29
On Road:
On Road sales, inclusive of PG&A sales, increased 13 percent in 2022 driven by higher pricing and increased shipments.
On Road sales to customers outside of North America increased four percent in 2022 driven by higher pricing, partially
offset by unfavorable foreign currency exchange rate movement. The average per unit sales price for the On Road
segment increased two percent, driven by favorable product mix and higher pricing.
Additional information on our On Road end markets for 2022:
• Indian Motorcycle North America unit retail sales down low-twenties percent
• Estimated North America industry 900cc cruiser, touring, and standard motorcycle unit retail sales down low-
double digits percent
• Polaris North America motorcycle dealer inventories up approximately 90 percent
Gross profit, as a percentage of sales, increased in 2022 primarily due to favorable product mix and lower promotional
costs, partially offset by higher input costs, warranty costs, and unfavorable foreign currency exchange rate movement.
On Road sales increased 28 percent in 2021 driven by increased Indian motorcycle and Slingshot shipments as a result of
strong retail sales, lower promotional costs, and higher PG&A sales. Gross profit, as a percentage of sales, increased in
2021 primarily due to lower promotional costs, partially offset by increased input costs related to supply chain
constraints.
Marine:
Marine sales increased 30 percent, primarily due to favorable product mix and increased shipments. The average per unit
sales price for the Marine segment increased 15 percent, driven by favorable product mix.
Additional information on our boat end markets for 2022:
• Polaris U.S pontoon unit retail sales down mid-twenties percent
• Estimated U.S. industry pontoon unit retail sales down high-single digits percent
Gross profit, as a percentage of sales, increased slightly primarily due to favorable product mix, mostly offset by higher
input costs and higher floor plan interest expense.
Marine sales increased 26 percent in 2021, primarily due to increased production levels driven by retail and demand, as
well as higher pricing and favorable mix. Gross profit, as a percentage of sales, increased in 2021, primarily due to
favorable product mix, partially offset by higher input costs related to supply chain constraints.
Liquidity and Capital Resources
Our primary sources of funds have been cash provided by operating and financing activities. Our primary uses of funds
have been for acquisitions, repurchases and retirement of common stock, capital investments, new product development,
and cash dividends to shareholders. The seasonality of production and shipments cause working capital requirements to
fluctuate during the year and year to year.
We believe that existing cash balances, cash flow to be generated from operating activities and borrowing capacity under
the credit facility arrangement will be sufficient to fund operations, new product development, cash dividends, share
repurchases, and capital requirements for at least the next 12 months and for the foreseeable future thereafter.
30

Cash Flows
The following table summarizes the cash flows from operating, investing and financing activities of continuing
operations:
($ in millions)
For the Years Ended December 31,
2022 2021
Change
2022 vs. 2021 2020
Change
2021 vs. 2020
Total cash provided by (used for):
Operating activities . . . . . . . . . . . . . . . . . . . . . . $ 534.5 $ 286.8 $ 247.7 $ 961.8 $ (675.0)
Investing activities . . . . . . . . . . . . . . . . . . . . . . (319.3) (288.4) (30.9) (141.1) (147.3)
Financing activities . . . . . . . . . . . . . . . . . . . . . . (363.2) (107.6) (255.6) (415.4) 307.8
Operating Activities:
The increase in net cash provided by operating activities of continuing operations in 2022 was primarily the result of
lower working capital additions and higher net income from continuing operations, partially offset by the impact of the
Tax Cuts and Jobs Act (the "Act") which, beginning in 2022, eliminated the option to deduct research and development
expenditures and instead capitalize and amortize such expenditures over future periods.
The decrease in net cash provided by operating activities of continuing operations in 2021 was primarily the result of
higher working capital additions due to increases in inventory driven by strong end-market demand and supply chain
inefficiencies, partially offset by higher net income.
Investing Activities:
The primary sources and uses of cash in 2022 and 2021 were for the purchase of property, equipment and tooling for
continued capacity and capability at our manufacturing and distribution facilities and for product development,
distributions from and contributions to Polaris Acceptance, as well as proceeds from the sale of businesses. Net cash
used for investing activities of continuing operations increased in 2022 due to a net a decrease in distributions from
Polaris Acceptance and an increase in property, equipment and tooling purchases, partially offset by proceeds from the
sale of businesses. Net cash used for investing activities of continuing operations increased in 2021 due to an increase in
property, equipment and tooling purchases.
Financing Activities:
The increase in net cash used for financing activities was primarily due to lower proceeds from stock issuances under
employee plans and decreased net borrowings under debt arrangements, finance lease obligations and notes payable. Net
borrowings totaled $257.7 million in 2022 compared $351.3 million in 2021. Higher share repurchases also contributed
to the increase.
Financing Arrangements:
We are party to an unsecured Master Note Purchase Agreement, as amended and supplemented, under which we have
issued senior notes. As of December 31, 2022, outstanding borrowings under the Master Note Purchase Agreement
totaled $350.0 million.
We are also party to an unsecured credit agreement, which includes a $1.0 billion variable interest rate Revolving Loan
Facility that matures in June 2026, under which we have unsecured borrowings. As of December 31, 2022, there were
borrowings of $312.9 million outstanding under the Revolving Loan Facility. Our credit agreement also includes a Term
Loan Facility, on which $828.0 million was outstanding as of December 31, 2022. Interest is charged at rates based on
adjusted Term SOFR for the credit facility. As of December 31, 2022, we had $679.6 million of availability on the
Revolving Loan Facility.
In December 2021, we amended the credit agreement to provide an unsecured incremental 364-day term loan (the
“Incremental Term Loan”) in the amount of $500 million, which was fully drawn on closing. In December 2022, we
further amended the unsecured credit facility to extend the maturity date of the Incremental Term Loan to December 15,
2023. There are no required principal payments prior to the maturity date. In addition to the payment of the $500 million
31
Incremental Term Loan, we are required to make principal payments under the Term Loan Facility totaling $45 million
over the next 12 months.
The credit agreements governing the facility and the Master Note Purchase Agreement contain covenants that require us
to maintain certain financial ratios, including minimum interest coverage and maximum leverage ratios. The agreements
require us to maintain an interest coverage ratio of not less than 3.00 to 1.00 and a leverage ratio of not more than 3.50 to
1.00 on a rolling four-quarter basis.
On July 2, 2018, pursuant to the Agreement and Plan of Merger dated May 29, 2018, the we completed the acquisition of
Boat Holdings, LLC, a privately held Delaware limited liability company, headquartered in Elkhart, Indiana which
manufactures boats (“Boat Holdings”). As a component of the Boat Holdings merger agreement, we have committed to
make a series of deferred payments to the former owners following the closing date of the mthrough July 2030. The
original discounted payable was for $76.7 million, of which $55.3 million was outstanding as of December 31, 2022.
As of December 31, 2022 and 2021, we were in compliance with all debt covenants. Our debt to total capital ratio was 65
percent and 60 percent as of December 31, 2022 and 2021, respectively. Additionally, as of December 31, 2022, we had
letters of credit outstanding of $38.5 million, primarily related to purchase obligations for raw materials.
Share Repurchases:
As of December 31, 2022, our Board of Directors has authorized us to repurchase up to an additional $349.1 million of
our common stock. We repurchased a total of 4.4 million shares of our common stock for $505.0 million during 2022,
which had a favorable impact on diluted net income from continuing operations per share of 33 cents.
Wholesale Customer Financing Arrangements:
We have arrangements with certain finance companies to provide secured floor plan financing for our dealers. These
arrangements provide liquidity by financing dealer purchases of our products without the use of our working capital. A
majority of the worldwide sales of snowmobiles, ORVs, motorcycles, boats and related PG&A are financed under
similar arrangements whereby we receive payment within a few days of shipment of the product. The amount financed
by worldwide dealers under these arrangements related to snowmobiles, ORVs, motorcycles, boats and related PG&A as
of December 31, 2022 and 2021, was approximately $1,893.9 million and $946.7 million, respectively. We participate in
the cost of dealer financing up to certain limits.
Under these arrangements, we have agreed to repurchase products repossessed by these finance companies. As of
December 31, 2022, the potential aggregate repurchase obligations were approximately $413.5 million. Our financial
exposure under these repurchase agreements is limited to the difference between the amounts unpaid by the dealer with
respect to the repossessed product plus costs of repossession and the amount received on the resale of the repossessed
product. No material losses have been incurred under these agreements during the periods presented.
Retail Customer Financing Arrangements:
We have agreements with third-party financing companies to provide financing options to end consumers of our
products. We have no material contingent liabilities for residual value or credit collection risk under these agreements.
During 2022, consumers financed 23 percent of our vehicles sold in the United States through these arrangements. The
volume of installment credit contracts written in calendar year 2022 with these institutions was $1,098.0 million, a one
percent increase from 2021.
Critical Accounting Policies and Critical Accounting Estimates
We have adopted various accounting policies to prepare the consolidated financial statements in accordance with U.S.
GAAP. Our significant accounting policies are described in Note 1 of the Notes to Consolidated Financial Statements.
Some of those significant accounting policies require us to make difficult, subjective, or complex judgments or estimates.
An accounting estimate is considered to be critical if it meets both of the following criteria: (i) the estimate requires
assumptions about matters that are highly uncertain at the time the accounting estimate is made, and (ii) different
estimates reasonably could have been used, or changes in the estimate that are reasonably likely to occur may have a
material impact on our financial condition or results of operations. The significant accounting policies that management
believes are the most critical to aid in fully understanding and evaluating our reported financial results include the
following: revenue recognition, sales promotions and incentives, product warranties, product liability, and goodwill and
indefinite-lived intangibles.
32
Revenue recognition. With respect to wholegood vehicles, boats, and PG&A, revenue is recognized when we transfer
control of the product to our customer (primarily dealers and distributors). With respect to services provided by us,
revenue is recognized upon completion of the service or over the term of the service agreement in proportion to the costs
expected to be incurred in satisfying the obligations over the term of the service period. Revenue is measured based on
the amount of consideration that we expect to be entitled to in exchange for the goods or services transferred. Sales,
value add, and other taxes collected from a customer concurrent with revenue-producing activities are excluded from
revenue. When the right of return exists, we adjust the consideration for the estimated effect of returns. We estimate
expected returns based on historical sales levels, the timing and magnitude of historical sales return levels as a percent of
sales, type of product, type of customer, and a projection of this experience into the future. We have agreed to repurchase
products repossessed by the finance companies up to certain limits. Our financial exposure is limited to the difference
between the amount paid to the finance companies and the amount received on the resale of the repossessed product.
Sales promotions and incentives. We accrue for estimated sales promotion and incentive expenses, which are recognized
as a component of sales in measuring the amount of consideration we expect to receive in exchange for transferring
goods or providing services. Examples of sales promotion and incentive programs include dealer and consumer rebates,
volume incentives, retail financing programs and sales associate incentives. Sales promotion and incentive expenses are
estimated based on current programs, planned programs, and historical rates for each product line. We record these
amounts as a liability in the consolidated balance sheet until they are ultimately paid. As of December 31, 2022 and
2021, accrued sales promotions and incentives were $127.0 million and $96.9 million, respectively. Actual results may
differ from these estimates if market conditions dictate the need to enhance or reduce sales promotion and incentive
programs or if the customer usage rate varies from historical trends. Adjustments to sales promotions and incentives
accruals are made as actual usage becomes known in order to properly estimate the amounts necessary to generate
consumer demand based on market conditions as of the balance sheet date.
Product warranties. We typically provide a limited warranty for our vehicles and boats for a period of six months to ten
years, depending on the product. We provide longer warranties in certain geographical markets as determined by local
regulations and customary practice and may also provide longer warranties related to certain promotional programs. Our
standard warranties require us, generally through our dealer network, to repair or replace defective products during such
warranty periods. The warranty reserve is established at the time of sale to the dealer or distributor based on
management’s best estimate using historical rates and trends. We record these amounts as a liability in the consolidated
balance sheet until they are ultimately paid. As of December 31, 2022 and 2021, the accrued warranty liability was
$172.9 million and $132.9 million, respectively. Adjustments to the warranty reserve are made based on actual claims
experience in order to properly estimate the amounts necessary to settle future and existing claims on products sold as of
the balance sheet date. The warranty reserve includes the estimated costs related to recalls, which are accrued when
probable and estimable. Factors that could have an impact on the warranty accrual include the following: changes in
manufacturing quality, shifts in product mix, changes in warranty coverage periods, impacts on product usage (including
weather), product recalls and changes in sales volume. Amounts estimated to be due and payable could differ materially
from what will ultimately transpire in the future and have a material adverse effect on our financial condition.
Product liability. We are subject to product liability claims in the normal course of business. In 2012, we began
purchasing excess insurance coverage for product liability claims. We self-insure product liability claims before the
policy date and up to the purchased insurance coverage after the policy date. The estimated costs resulting from any
losses are charged to operating expenses when it is probable a loss has been incurred and the amount of the loss is
reasonably estimable. There is significant judgment and estimation required in evaluating the possible outcomes and
potential losses of product liability matters. We utilize claims experience, historical trends and actuarial analysis, along
with an analysis of current claims, to assist in determining the appropriate loss reserve levels. As of December 31, 2022
and 2021, we had accruals of $107.5 million and $70.3 million, respectively, for the probable payment of pending claims
related to product liability litigation associated with our products. Adverse determination of material product liability
claims made against us could have a material adverse effect on our financial condition.
Goodwill. Goodwill is tested at least annually for impairment and is tested for impairment more frequently when events
or changes in circumstances indicate that the asset might be impaired. We complete our annual goodwill impairment test
as of the first day of the fourth quarter.
We may first perform a qualitative assessment to determine whether it is more likely than not that the fair value of each
reporting unit is less than its carrying amount. A qualitative assessment requires that we consider events or circumstances
including macroeconomic conditions, industry and market considerations, cost factors, overall financial performance,
changes in management or key personnel, changes in strategy, changes in customers, changes in the composition or
33
carrying amount of a reporting unit’s net assets, and changes in our stock price. If, after assessing the totality of events or
circumstances, it is determined that it is more likely than not that the fair value of the reporting unit is less than its
carrying amount, or if we elect to bypass the qualitative test and proceed to a quantitative test, then the quantitative
goodwill impairment test is performed. A quantitative test includes comparing the fair value of each reporting unit to the
carrying amount of the reporting unit, including goodwill. If the estimated fair value is less than the carrying amount of
the reporting unit, an impairment is recognized in an amount equal to the difference, limited to the total amount of
goodwill allocated to that reporting unit.
Under the quantitative goodwill impairment test, the fair value of each reporting unit is determined using a discounted
cash flow analysis and market approach. Determining the fair value of the reporting units requires the use of significant
judgment, including discount rates, assumptions in our long-term business plan about future revenues and expenses,
capital expenditures, and changes in working capital, which are dependent on internal forecasts, estimation of long-term
growth for each reporting unit, and determination of the discount rate. These plans take into consideration numerous
factors including historical experience, anticipated future economic conditions, changes in raw material prices and
growth expectations for the industries and end markets in which we participate. These assumptions are determined over a
five year long-term planning period. The five year growth rates for revenues and earnings before interest, taxes,
depreciation and amortization ("EBITDA") vary for each reporting unit being evaluated. Revenues and EBITDA beyond
five years are projected to grow at a terminal growth rate consistent with industry expectations. Actual results may
significantly differ from those used in our valuations. The forecasted future cash flows are discounted using a discount
rate developed for each reporting unit. The discount rates were developed using market observable inputs, as well as our
assessment of risks inherent in the future cash flows of the respective reporting unit.
In estimating fair value using the market approach, we identify a group of comparable publicly traded companies for
each reporting unit that are similar in terms of size and product offering. These groups of comparable companies are used
to develop multiples based on total market-based invested capital as a multiple of EBITDA. We determine our estimated
values by applying these comparable EBITDA multiples to the operating results of our reporting units. The ultimate fair
value of each reporting unit is determined considering the results of both valuation methods. Inputs used to estimate
these fair values included significant unobservable inputs that reflect our assumptions about the inputs that market
participants would use and, therefore, the fair value assessments are classified within Level 3 of the fair value hierarchy.
In the fourth quarter of 2022, we completed the annual impairment test. It was determined that goodwill was not
impaired as each reporting unit’s fair value exceeded its carrying value. We completed a qualitative assessment for all
reporting units.
Identifiable intangible assets. Our primary identifiable intangible assets include: dealer/customer relationships, brand/
trade names, developed technology, and non-compete agreements. Identifiable intangibles with finite lives are amortized
and those identifiable intangibles with indefinite lives are not amortized. Identifiable intangible assets that are subject to
amortization are evaluated for impairment whenever events or changes in circumstances indicate that the carrying
amount may not be recoverable. Identifiable intangible assets with indefinite lives are tested for impairment annually or
more frequently when events or changes in circumstances indicate that the asset might be impaired. We complete our
annual impairment test as of the first day of the fourth quarter each year for identifiable intangible assets with indefinite
lives.
Our identifiable intangible assets with indefinite lives include brand/trade names. The impairment test consists of a
comparison of the fair value of the brand/trade name with its carrying value. The fair value is determined using the relief-
from-royalty method. This method assumes the trade name has value to the extent that the owner is relieved of the
obligation to pay royalties for the benefits received from them. This method requires us to estimate the future revenue for
the related brands, the appropriate royalty rate and the discount rate. Forecasted revenues are derived from our annual
budget and long-term business plan and royalty rates were based on brand profitability. The discount rates are developed
using the market observable inputs used in the development of the reporting unit discount rates, as well as our
assessment of risks inherent in the future cash flows of the respective trade name.
In the fourth quarter of 2022, we completed the annual impairment test. It was determined that our indefinite lived
intangible assets were not impaired.
34

New Accounting Pronouncements
See Item 8 of Part II, “Financial Statements and Supplementary Data—Note 1—Organization and Significant
Accounting Policies—New accounting pronouncements.”
Item 7A. Quantitative and Qualitative Disclosures about Market Risk
Inflation, Foreign Exchange Rates, and Interest Rates
Inflation:
Rising costs, including wages, logistics, components, and commodity prices, are negatively impacting our gross profit
margins. We strive to minimize the effects of inflation through cost containment, productivity improvements and price
increases.
We are subject to market risk from fluctuating market prices of certain purchased commodities and raw materials,
including steel, aluminum, petroleum-based resins, certain rare earth metals and diesel fuel. In addition, we are a
purchaser of components and parts containing various commodities, including steel, aluminum, rubber and others, which
are integrated into our end products. While such materials are typically available from numerous suppliers, commodity
raw materials are subject to price fluctuations. We generally buy these commodities and components based upon market
prices that are established with the vendor as part of the purchase process. The total impact of commodities, had an
unfavorable impact on our gross profit margins for 2022 when compared to 2021. Based on our current outlook for
commodity prices, the total impact of commodities is expected to have a favorable impact on our gross profit margins for
2023 when compared to 2022.
Foreign Exchange Rates:
The changing relationships of the U.S. dollar to foreign currencies can have a material impact on our financial results.
Euro: We have operations in the Eurozone through wholly owned subsidiaries and distributors. We also purchase
components from certain suppliers directly for our U.S. operations in transactions denominated in Euros. Fluctuations in
the Euro to U.S. dollar exchange rate impacts sales, cost of sales, and net income.
Canadian Dollar: We operate in Canada through a wholly owned subsidiary. The relationship of the U.S. dollar in
relation to the Canadian dollar impacts both sales and net income.
Other currencies: We operate in various countries, principally in Europe, Mexico and Australia, through wholly owned
subsidiaries. We also sell to certain distributors in other countries. We also purchase components from certain suppliers
directly for our U.S. operations in transactions denominated in these foreign currencies. The relationship of the U.S.
dollar in relation to these other currencies impacts sales, cost of sales and net income.
Foreign exchange risk can be quantified by performing a sensitivity analysis assuming a hypothetical change in the value
of the U.S. dollar compared to other currencies in which we transact. We are most exposed to the Euro and Canadian
dollar. All other things being equal, at current annual volumes, a hypothetical 10 percent fluctuation of the U.S. dollar
compared to the Euro impacts annual operating income by approximately $20 million and a hypothetical 10 percent
fluctuation of the U.S. dollar compared to the Canadian Dollar impacts annual operating income by approximately $53
million.
We actively manage our exposure to fluctuating foreign currency exchange rates by entering into foreign exchange
hedging contracts. A portion of our foreign currency exposure is mitigated with the following open foreign currency
hedging contracts as of December 31, 2022:
Foreign Currency
Foreign currency hedging contracts
Currency Position
Notional amounts (in
millions of U.S. dollars)
Average exchange rate
of open contracts
Australian Dollar . . . . . . . . . . . . . . . . . . . . . . . . . . . . . . . . . . .
Long $ 13.7 $0.69 to 1 AUD
Canadian Dollar . . . . . . . . . . . . . . . . . . . . . . . . . . . . . . . . . . . . Long $ 93.3 $0.76 to 1 CAD
Mexican Peso . . . . . . . . . . . . . . . . . . . . . . . . . . . . . . . . . . . . . . Short $ 47.0 22 Peso to $1
35
In 2022, after consideration of the existing foreign currency hedging contracts, foreign currencies had a negative impact
on net income compared to 2021. We expect currencies to have a negative impact on net income in 2023 compared to
2022.
The assets and liabilities in all our international entities are translated at the foreign exchange rate in effect at the balance
sheet date. Translation gains and losses are reflected as a component of accumulated other comprehensive loss, net in the
shareholders’ equity section of the consolidated balance sheets. Revenues and expenses in all of our international entities
are translated at the average foreign exchange rate in effect for each month of the year. Certain assets and liabilities
related to intercompany positions reported on our consolidated balance sheet that are denominated in a currency other
than the entity’s functional currency are translated at the foreign exchange rates at the balance sheet date and the
associated gains and losses are included in net income.
Interest Rates:
We are a party to an unsecured credit agreement with various lenders consisting of a $1.0 billion revolving loan facility,
a $1.2 billion term loan facility, and a $500 million incremental term loan. Interest accrues on the revolving loan, term
loans, and the incremental term loan at variable rates based on adjusted Term SOFR plus the applicable add-on
percentage as defined. As of December 31, 2022, there was $312.9 million outstanding on the revolving loan, $828.0
million outstanding on the term loan, and $500 million outstanding on the incremental term loan. We enter into interest
rate swaps in order to maintain a balanced risk of fixed and floating interest rates associated with our debt. Based on the
unhedged variable-rate debt included in our debt portfolio as of December 31, 2022, a 100 basis point increase or
decrease in interest rates would increase or decrease interest expense by approximately $8 million.
36

Item 8. Financial Statements and Supplementary Data
INDEX TO FINANCIAL STATEMENTS
Management’s Report on Internal Control over Financial Reporting . . . . . . . . . . . . . . . . . . . . . . . . . . . . . . . . . . . . . .
38
Report of Independent Registered Public Accounting Firm on Internal Control over Financial Reporting . . . . . . . . .
39
Report of Independent Registered Public Accounting Firm on Consolidated Financial Statements . . . . . . . . . . . . . .
40
Consolidated Balance Sheets as of December 31, 2022 and 2021 . . . . . . . . . . . . . . . . . . . . . . . . . . . . . . . . . . . . . . . .
42
Consolidated Statements of Income for the Years Ended December 31, 2022, 2021 and 2020 . . . . . . . . . . . . . . . . . .
43
Consolidated Statements of Comprehensive Income for the Years Ended December 31, 2022, 2021 and 2020 . . . . .
44
Consolidated Statements of Equity for the Years Ended December 31, 2022, 2021 and 2020 . . . . . . . . . . . . . . . . . .
45
Consolidated Statements of Cash Flows for the Years ended December 31, 2022, 2021 and 2020 . . . . . . . . . . . . . . .
46
Notes to Consolidated Financial Statements . . . . . . . . . . . . . . . . . . . . . . . . . . . . . . . . . . . . . . . . . . . . . . . . . . . . . . . . .
47
Page
37

Management’s Report on Internal Control over Financial Reporting
Management is responsible for establishing and maintaining an adequate system of internal control over financial
reporting of the Company. This system is designed to provide reasonable assurance regarding the reliability of financial
reporting and the preparation of financial statements for external purposes in accordance with United States generally
accepted accounting principles.
Our internal control over financial reporting includes those policies and procedures that (1) pertain to the maintenance of
records that, in reasonable detail, accurately and fairly reflect the transactions and dispositions of the assets of the
Company; (2) provide reasonable assurance that transactions are recorded as necessary to permit preparation of financial
statements in accordance with generally accepted accounting principles, and that receipts and expenditures of the
Company are being made only in accordance with authorizations of management and directors of the Company; and
(3) provide reasonable assurance regarding prevention or timely detection of unauthorized acquisition, use, or disposition
of the Company’s assets that could have a material effect on the financial statements.
Because of its inherent limitations, internal control over financial reporting may not prevent or detect misstatements.
Also, projections of any evaluation of effectiveness to future periods are subject to the risk that controls may become
inadequate because of changes in conditions, or that the degree of compliance with the policies or procedures may
deteriorate.
Management conducted an evaluation of the effectiveness of the system of internal control over financial reporting as of
December 31, 2022. In making this evaluation, management used the criteria set forth by the Committee of Sponsoring
Organizations of the Treadway Commission (COSO) in Internal Control—2013 Integrated Framework. Based on
management’s evaluation and those criteria, management concluded that the Company’s system of internal control over
financial reporting was effective as of December 31, 2022.
Management’s internal control over financial reporting as of December 31, 2022 has been audited by Ernst & Young
LLP, an independent registered public accounting firm, as stated in their report appearing on the following page, in
which they expressed an unqualified opinion thereon.
/S/ MICHAEL T. SPEETZEN
Michael T. Speetzen
Chief Executive Officer
/S/ ROBERT P. MACK
Robert P. Mack
Chief Financial Officer
February 17, 2023
Further discussion of our internal controls and procedures is included in Item 9A of this report, under the caption
“Controls and Procedures.”
38
Report of Independent Registered Public Accounting Firm
To the Shareholders and the Board of Directors of
Polaris Inc.
Opinion on Internal Control over Financial Reporting
We have audited Polaris Inc.’s internal control over financial reporting as of December 31, 2022, based on criteria
established in Internal Control—Integrated Framework issued by the Committee of Sponsoring Organizations of the
Treadway Commission (2013 framework) (the COSO criteria). In our opinion, Polaris Inc. (the Company) maintained, in
all material respects, effective internal control over financial reporting as of December 31, 2022, based on the COSO
criteria.
We also have audited, in accordance with the standards of the Public Company Accounting Oversight Board (United
States) (PCAOB), the consolidated balance sheets of the Company as of December 31, 2022 and 2021, the related
consolidated statements of income, comprehensive income, equity and cash flows for each of the three years in the
period ended December 31, 2022, and the related notes and the financial statement schedule listed in the Index at Item
15(a), and our report dated February 17, 2023 expressed an unqualified opinion thereon.
Basis for Opinion
The Company’s management is responsible for maintaining effective internal control over financial reporting and for its
assessment of the effectiveness of internal control over financial reporting included in the accompanying Management’s
Report on Internal Control over Financial Reporting. Our responsibility is to express an opinion on the Company’s
internal control over financial reporting based on our audit. We are a public accounting firm registered with the PCAOB
and are required to be independent with respect to the Company in accordance with the U.S. federal securities laws and
the applicable rules and regulations of the Securities and Exchange Commission and the PCAOB.
We conducted our audit in accordance with the standards of the PCAOB. Those standards require that we plan and
perform the audit to obtain reasonable assurance about whether effective internal control over financial reporting was
maintained in all material respects.
Our audit included obtaining an understanding of internal control over financial reporting, assessing the risk that a
material weakness exists, testing and evaluating the design and operating effectiveness of internal control based on the
assessed risk, and performing such other procedures as we considered necessary in the circumstances. We believe that
our audit provides a reasonable basis for our opinion.
Definition and Limitations of Internal Control Over Financial Reporting
A company’s internal control over financial reporting is a process designed to provide reasonable assurance regarding
the reliability of financial reporting and the preparation of financial statements for external purposes in accordance with
generally accepted accounting principles. A company’s internal control over financial reporting includes those policies
and procedures that (1) pertain to the maintenance of records that, in reasonable detail, accurately and fairly reflect the
transactions and dispositions of the assets of the company; (2) provide reasonable assurance that transactions are
recorded as necessary to permit preparation of financial statements in accordance with generally accepted accounting
principles, and that receipts and expenditures of the company are being made only in accordance with authorizations of
management and directors of the company; and (3) provide reasonable assurance regarding prevention or timely
detection of unauthorized acquisition, use, or disposition of the company’s assets that could have a material effect on the
financial statements.
Because of its inherent limitations, internal control over financial reporting may not prevent or detect misstatements.
Also, projections of any evaluation of effectiveness to future periods are subject to the risk that controls may become
inadequate because of changes in conditions, or that the degree of compliance with the policies or procedures may
deteriorate.
/s/ Ernst & Young LLP
Minneapolis, Minnesota
February 17, 2023
39

Report of Independent Registered Public Accounting Firm
To the Shareholders and the Board of Directors of
Polaris Inc.
Opinion on the Financial Statements
We have audited the accompanying consolidated balance sheets of Polaris Inc. (the Company) as of December 31, 2022
and 2021, the related consolidated statements of income, comprehensive income, equity and cash flows for each of the
three years in the period ended December 31, 2022, and the related notes and the financial statement schedule listed in
the Index at Item 15(a) (collectively referred to as the “consolidated financial statements”). In our opinion, the
consolidated financial statements present fairly, in all material respects, the financial position of the Company at
December 31, 2022 and 2021, and the results of its operations and its cash flows for each of the three years in the period
ended December 31, 2022, in conformity with U.S. generally accepted accounting principles.
We also have audited, in accordance with the standards of the Public Company Accounting Oversight Board (United
States) (PCAOB), the Company’s internal control over financial reporting as of December 31, 2022, based on criteria
established in Internal Control-Integrated Framework issued by the Committee of Sponsoring Organizations of the
Treadway Commission (2013 framework), and our report dated February 17, 2023 expressed an unqualified opinion
thereon.
Basis for Opinion
These financial statements are the responsibility of the Company’s management. Our responsibility is to express an
opinion on the Company’s financial statements based on our audits. We are a public accounting firm registered with the
PCAOB and are required to be independent with respect to the Company in accordance with the U.S. federal securities
laws and the applicable rules and regulations of the Securities and Exchange Commission and the PCAOB.
We conducted our audits in accordance with the standards of the PCAOB. Those standards require that we plan and
perform the audit to obtain reasonable assurance about whether the financial statements are free of material
misstatement, whether due to error or fraud. Our audits included performing procedures to assess the risks of material
misstatement of the financial statements, whether due to error or fraud, and performing procedures that respond to those
risks. Such procedures included examining, on a test basis, evidence regarding the amounts and disclosures in the
financial statements. Our audits also included evaluating the accounting principles used and significant estimates made
by management, as well as evaluating the overall presentation of the financial statements. We believe that our audits
provide a reasonable basis for our opinion.
Critical Audit Matter
The critical audit matter communicated below is a matter arising from the current period audit of the consolidated
financial statements that was communicated or required to be communicated to the audit committee and that: (1) relates
to accounts or disclosures that are material to the consolidated financial statements and (2) involved our especially
challenging, subjective or complex judgments. The communication of the critical audit matter does not alter in any way
our opinion on the consolidated financial statements, taken as a whole, and we are not, by communicating the critical
audit matter below, providing a separate opinion on the critical audit matter or on the accounts or disclosures to which it
relates.
Product Liability
Description of
the Matter
At December 31, 2022, the Company had an accrual of $107.5 million for the probable payment of pending
claims related to product liability litigation associated with the Company’s products. As discussed in Note
14 to the consolidated financial statements, the Company is subject to product liability claims in the normal
course of business. The Company records product liability reserves for losses that are probable and
reasonably estimable, utilizing historical trends and actuarial analysis, along with an analysis of current
claims.
Auditing management’s accounting for product liability claims was especially challenging due to the
significant judgment and estimation required in evaluating the probability and amount of loss, as well as the
actuarial methods applied.
40

How We
Addressed the
Matter in Our
Audit
We identified and tested controls over the identification and evaluation of product liability claims, including
the Company’s assessment and measurement of the estimate of the probable liability. We tested controls
over management's review of the methods, significant assumptions, and the completeness and accuracy of
the underlying data used by management’s actuarial specialist to assist management in estimating the
product liability reserve.
To test management’s assessment of the probability of occurrence of a loss and whether the amount of loss
was reasonably estimable, we inquired of internal counsel and other members of management to discuss the
facts and circumstances, including possible outcomes and potential losses. In addition, we received internal
and external legal counsel inquiry letters and obtained a representation letter from the Company. To test the
measurement of the product liability claims, we evaluated the method of measuring the contingency and
tested the accuracy and completeness of the data used to determine a range of loss. In addition, we involved
internal actuarial specialists to assist with our procedures related to the measurement of the product liability
reserve. To evaluate the historical accuracy of management’s estimates, we performed a retrospective
analysis of resolved claims to management’s previous estimates.
/s/ Ernst & Young LLP
We have served as the Company’s auditor since 2002.
Minneapolis, Minnesota
February 17, 2023
41

POLARIS INC.
CONSOLIDATED BALANCE SHEETS
(In millions, except per share data)
Assets
Current assets:
Cash and cash equivalents . . . . . . . . . . . . . . . . . . . . . . . . . . . . . . . . . . . . . . . . . . $ 324.5 $ 502.3
Trade receivables, net . . . . . . . . . . . . . . . . . . . . . . . . . . . . . . . . . . . . . . . . . . . . . . 343.0 227.9
Inventories, net . . . . . . . . . . . . . . . . . . . . . . . . . . . . . . . . . . . . . . . . . . . . . . . . . . . 1,896.1 1,510.7
Prepaid expenses and other . . . . . . . . . . . . . . . . . . . . . . . . . . . . . . . . . . . . . . . . . . 183.7 150.9
Income taxes receivable . . . . . . . . . . . . . . . . . . . . . . . . . . . . . . . . . . . . . . . . . . . . 20.3 4.0
Current assets held for sale . . . . . . . . . . . . . . . . . . . . . . . . . . . . . . . . . . . . . . . . . . . — 163.2
Total current assets . . . . . . . . . . . . . . . . . . . . . . . . . . . . . . . . . . . . . . . . . . . . . . . . . . . . . 2,767.6 2,559.0
Property and equipment, net . . . . . . . . . . . . . . . . . . . . . . . . . . . . . . . . . . . . . . . . . . . . . . 1,018.4 927.7
Investment in finance affiliate . . . . . . . . . . . . . . . . . . . . . . . . . . . . . . . . . . . . . . . . . . . 93.1 49.3
Deferred tax assets . . . . . . . . . . . . . . . . . . . . . . . . . . . . . . . . . . . . . . . . . . . . . . . . . . . . 210.5 162.9
Goodwill and other intangible assets, net . . . . . . . . . . . . . . . . . . . . . . . . . . . . . . . . . . . 910.6 935.2
Operating lease assets . . . . . . . . . . . . . . . . . . . . . . . . . . . . . . . . . . . . . . . . . . . . . . . . . . . 111.0 90.5
Other long-term assets . . . . . . . . . . . . . . . . . . . . . . . . . . . . . . . . . . . . . . . . . . . . . . . . . 106.7 97.2
Long-term assets held for sale . . . . . . . . . . . . . . . . . . . . . . . . . . . . . . . . . . . . . . . . . . . . . — 226.0
Total assets . . . . . . . . . . . . . . . . . . . . . . . . . . . . . . . . . . . . . . . . . . . . . . . . . . . . . . . . . . $ 5,217.9 $ 5,047.8
Liabilities and Equity
Current liabilities:
Current portion of debt, finance lease obligations and notes payable . . . . . . . . . $ 553.6 $ 553.3
Accounts payable . . . . . . . . . . . . . . . . . . . . . . . . . . . . . . . . . . . . . . . . . . . . . . . . . 847.6 776.0
Accrued expenses . . . . . . . . . . . . . . . . . . . . . . . . . . . . . . . . . . . . . . . . . . . . . . . . . . 896.8 756.5
Current operating lease liabilities . . . . . . . . . . . . . . . . . . . . . . . . . . . . . . . . . . . . . . 24.1 19.4
Income taxes payable . . . . . . . . . . . . . . . . . . . . . . . . . . . . . . . . . . . . . . . . . . . . . . 6.5 17.1
Current liabilities held for sale . . . . . . . . . . . . . . . . . . . . . . . . . . . . . . . . . . . . . . . . . — 107.8
Total current liabilities . . . . . . . . . . . . . . . . . . . . . . . . . . . . . . . . . . . . . . . . . . . . . . . . . 2,328.6 2,230.1
Long-term income taxes payable . . . . . . . . . . . . . . . . . . . . . . . . . . . . . . . . . . . . . . . . . 11.7 13.3
Finance lease obligations . . . . . . . . . . . . . . . . . . . . . . . . . . . . . . . . . . . . . . . . . . . . . . . 9.9 12.1
Long-term debt . . . . . . . . . . . . . . . . . . . . . . . . . . . . . . . . . . . . . . . . . . . . . . . . . . . . . . . 1,494.3 1,235.3
Deferred tax liabilities . . . . . . . . . . . . . . . . . . . . . . . . . . . . . . . . . . . . . . . . . . . . . . . . . . . 4.6 5.5
Long-term operating lease liabilities . . . . . . . . . . . . . . . . . . . . . . . . . . . . . . . . . . . . . . . . 87.0 71.3
Other long-term liabilities . . . . . . . . . . . . . . . . . . . . . . . . . . . . . . . . . . . . . . . . . . . . . . . 167.7 176.6
Long-term liabilities held for sale . . . . . . . . . . . . . . . . . . . . . . . . . . . . . . . . . . . . . . . . . . — 66.1
Total liabilities . . . . . . . . . . . . . . . . . . . . . . . . . . . . . . . . . . . . . . . . . . . . . . . . . . . . . . . $ 4,103.8 $ 3,810.3
Deferred compensation . . . . . . . . . . . . . . . . . . . . . . . . . . . . . . . . . . . . . . . . . . . . . . . . . . $ 12.6 $ 11.2
Shareholders’ equity:
Preferred stock $0.01 par value per share, 20.0 shares authorized, no shares
issued and outstanding . . . . . . . . . . . . . . . . . . . . . . . . . . . . . . . . . . . . . . . . . . . . . . . — —
Common stock $0.01 par value per share, 160.0 shares authorized, 57.0 and
60.4 shares issued and outstanding, respectively . . . . . . . . . . . . . . . . . . . . . . . . . . . $ 0.6 $ 0.6
Additional paid-in capital . . . . . . . . . . . . . . . . . . . . . . . . . . . . . . . . . . . . . . . . . . . 1,152.1 1,143.8
Retained earnings . . . . . . . . . . . . . . . . . . . . . . . . . . . . . . . . . . . . . . . . . . . . . . . . . 33.8 157.3
Accumulated other comprehensive loss, net . . . . . . . . . . . . . . . . . . . . . . . . . . . . . (87.5) (77.4)
Total shareholders’ equity . . . . . . . . . . . . . . . . . . . . . . . . . . . . . . . . . . . . . . . . . . . . . 1,099.0 1,224.3
Noncontrolling interest . . . . . . . . . . . . . . . . . . . . . . . . . . . . . . . . . . . . . . . . . . . . . . . . . . 2.5 2.0
Total equity . . . . . . . . . . . . . . . . . . . . . . . . . . . . . . . . . . . . . . . . . . . . . . . . . . . . . . . . . . . 1,101.5 1,226.3
Total liabilities and equity . . . . . . . . . . . . . . . . . . . . . . . . . . . . . . . . . . . . . . . . . . . . . $ 5,217.9 $ 5,047.8
December 31, 2022 December 31, 2021
The accompanying footnotes are an integral part of these consolidated statements.
42

POLARIS INC.
CONSOLIDATED STATEMENTS OF INCOME
(In millions, except per share data)
2022 2021 2020
Sales . . . . . . . . . . . . . . . . . . . . . . . . . . . . . . . . . . . . . . . . . . . . . . . $ 8,589.0 $ 7,439.2 $ 6,281.4
Cost of sales . . . . . . . . . . . . . . . . . . . . . . . . . . . . . . . . . . . . . . . . . 6,629.5 5,688.3 4,745.7
Gross profit . . . . . . . . . . . . . . . . . . . . . . . . . . . . . . . . . . . . . . . . . 1,959.5 1,750.9 1,535.7
Operating expenses:
Selling and marketing . . . . . . . . . . . . . . . . . . . . . . . . . . . . 480.8 458.2 429.8
Research and development . . . . . . . . . . . . . . . . . . . . . . . . 366.7 328.7 288.1
General and administrative . . . . . . . . . . . . . . . . . . . . . . . . 355.9 305.8 296.1
Goodwill impairment . . . . . . . . . . . . . . . . . . . . . . . . . . . . . . — — 81.1
Total operating expenses . . . . . . . . . . . . . . . . . . . . . . . . . . . . . . . 1,203.4 1,092.7 1,095.1
Income from financial services . . . . . . . . . . . . . . . . . . . . . . . . . . 48.4 53.8 80.4
Operating income . . . . . . . . . . . . . . . . . . . . . . . . . . . . . . . . . . . . 804.5 712.0 521.0
Non-operating expense:
Interest expense . . . . . . . . . . . . . . . . . . . . . . . . . . . . . . . . . 71.7 44.2 66.8
Other (income) expense, net . . . . . . . . . . . . . . . . . . . . . . . (28.6) 2.3 3.8
Loss on sale of businesses . . . . . . . . . . . . . . . . . . . . . . . . . . — 36.8 —
Income from continuing operations before income taxes . . . . . . 761.4 628.7 450.4
Provision for income taxes . . . . . . . . . . . . . . . . . . . . . . . . . . . . . 158.0 132.1 89.9
Net income from continuing operations . . . . . . . . . . . . . . . . . . . . . 603.4 496.6 360.5
Loss from discontinued operations, net of tax . . . . . . . . . . . . . . . . (13.2) (2.3) (235.6)
Loss from sale of discontinued operations, net of tax . . . . . . . . . . (142.6) — —
Net income . . . . . . . . . . . . . . . . . . . . . . . . . . . . . . . . . . . . . . . . . . . 447.6 494.3 124.9
Net income attributable to noncontrolling interest . . . . . . . . . . . . . (0.5) (0.4) (0.1)
Net income attributable to Polaris Inc. . . . . . . . . . . . . . . . . . . . . . . $ 447.1 $ 493.9 $ 124.8
Amounts attributable to Polaris Inc. common shareholders:
Net income from continuing operations . . . . . . . . . . . . . . . . . . . . . $ 603.4 $ 496.6 $ 360.5
Less net income attributable to noncontrolling interest . . . . . . . . . (0.5) (0.4) (0.1)
Net income from continuing operations attributable to Polaris Inc.
common shareholders . . . . . . . . . . . . . . . . . . . . . . . . . . . . . . . . . . . 602.9 496.2 360.4
Net loss from discontinued operations attributable to Polaris Inc.
common shareholders . . . . . . . . . . . . . . . . . . . . . . . . . . . . . . . . . . . (155.8) (2.3) (235.6)
Net income attributable to Polaris Inc. . . . . . . . . . . . . . . . . . . . . . . $ 447.1 $ 493.9 $ 124.8
Net income (loss) per share attributable to Polaris Inc. common
shareholders:
Basic
Continuing operations . . . . . . . . . . . . . . . . . . . . . . . . . . . . . . $ 10.17 $ 8.10 $ 5.83
Discontinued operations . . . . . . . . . . . . . . . . . . . . . . . . . . . . $ (2.63) $ (0.04) $ (3.81)
Basic . . . . . . . . . . . . . . . . . . . . . . . . . . . . . . . . . . . . . . . $ 7.54 $ 8.06 $ 2.02
Diluted
Continuing operations . . . . . . . . . . . . . . . . . . . . . . . . . . . . . . $ 10.04 $ 7.92 $ 5.75
Discontinued operations . . . . . . . . . . . . . . . . . . . . . . . . . . . . $ (2.60) $ (0.04) $ (3.76)
Diluted . . . . . . . . . . . . . . . . . . . . . . . . . . . . . . . . . . . . . $ 7.44 $ 7.88 $ 1.99
Weighted average shares outstanding:
Basic . . . . . . . . . . . . . . . . . . . . . . . . . . . . . . . . . . . . . . . . . 59.3 61.3 61.9
Diluted . . . . . . . . . . . . . . . . . . . . . . . . . . . . . . . . . . . . . . . . 60.1 62.7 62.6
For the Years Ended December 31,
The accompanying footnotes are an integral part of these consolidated statements.
43

POLARIS INC.
CONSOLIDATED STATEMENTS OF COMPREHENSIVE INCOME
(In millions)
2022 2021 2020
Net income . . . . . . . . . . . . . . . . . . . . . . . . . . . . . . . . . . . . . . . . . . . $ 447.6 $ 494.3 $ 124.9
Other comprehensive income, net of tax:
Foreign currency translation adjustments . . . . . . . . . . . . . . . . . (25.3) (30.4) 24.2
Unrealized gain (loss) on derivative instruments . . . . . . . . . . . 14.9 11.1 (9.4)
Retirement plan and other activity . . . . . . . . . . . . . . . . . . . . . . 0.3 0.3 (0.5)
Comprehensive income . . . . . . . . . . . . . . . . . . . . . . . . . . . . . . . . . . 437.5 475.3 139.2
Comprehensive income attributable to noncontrolling interest . . . . . (0.5) (0.4) (0.1)
Comprehensive income attributable to Polaris Inc. . . . . . . . . . . . . . . $ 437.0 $ 474.9 $ 139.1
For the Years Ended December 31,
The accompanying footnotes are an integral part of these consolidated statements.
44

POLARIS INC.
CONSOLIDATED STATEMENTS OF EQUITY
(In millions, except per share data)
Balance, December 31, 2019 . .
61.4 $ 0.6 $ 892.8 $ 287.3 $ (72.7) $ 0.2 $ 1,108.2
Employee stock compensation 0.6 — 65.3 — — — 65.3
Deferred compensation . . . . . . . — — 0.5 0.8 — — 1.3
Proceeds from stock issuances
under employee plans . . . . .
0.5 — 33.6 — — — 33.6
Cash dividends declared . . . . . . — — — (152.5) — — (152.5)
Repurchase and retirement of
common shares . . . . . . . . . .
(0.6) — (8.3) (42.0) — — (50.3)
Net income . . . . . . . . . . . . . . . — — — 124.8 — 0.1 124.9
Other comprehensive income . . — — — — 14.3 — 14.3
Balance, December 31, 2020 . .
61.9 $ 0.6 $ 983.9 $ 218.4 $ (58.4) $ 0.3 $ 1,144.8
Employee stock compensation 0.5 — 62.7 — — — 62.7
Deferred compensation . . . . . . . — — 1.3 (0.2) — — 1.1
Proceeds from stock issuances
under employee plans . . . . .
1.8 — 156.1 — — — 156.1
Cash dividends declared . . . . . . — — — (153.4) — — (153.4)
Repurchase and retirement of
common shares . . . . . . . . . .
(3.8) — (60.2) (401.4) — — (461.6)
Net income . . . . . . . . . . . . . . . — — — 493.9 — 0.4 494.3
Contributions . . . . . . . . . . . . . . . — — — — — 1.3 1.3
Other comprehensive loss . . . . . — — — — (19.0) — (19.0)
Balance, December 31, 2021 . .
60.4 $ 0.6 $ 1,143.8 $ 157.3 $ (77.4) $ 2.0 $ 1,226.3
Employee stock compensation 0.6 — 60.0 — — — 60.0
Deferred compensation . . . . . . . — — (2.5) 1.1 — — (1.4)
Proceeds from stock issuances
under employee plans . . . . .
0.4 — 34.1 — — — 34.1
Cash dividends declared . . . . . . — — — (150.0) — — (150.0)
Repurchase and retirement of
common shares . . . . . . . . . .
(4.4) — (83.3) (421.7) — — (505.0)
Net income . . . . . . . . . . . . . . . — — — 447.1 — 0.5 447.6
Other comprehensive loss . . . . — — — — (10.1) — (10.1)
Balance, December 31, 2022 . .
57.0 $ 0.6 $ 1,152.1 $ 33.8 $ (87.5) $ 2.5 $ 1,101.5
Number
of Shares
Common
Stock
Additional
Paid-
In Capital
Retained
Earnings
Accumulated
Other
Comprehensive
Income (loss)
Non
Controlling
Interest Total Equity
Polaris Inc. declared cash dividends of $2.56, $2.52, and $2.48 per share for the years ended December 31, 2022, 2021,
and 2020, respectively.
The accompanying footnotes are an integral part of these consolidated statements.
45

POLARIS INC.
CONSOLIDATED STATEMENTS OF CASH FLOWS
(In millions)
2022 2021 2020
Operating Activities:
Net income . . . . . . . . . . . . . . . . . . . . . . . . . . . . . . . . . . . . . . . . . . . . . . . . . . . . $ 447.6 $ 494.3 $ 124.9
Loss from discontinued operations, net of tax . . . . . . . . . . . . . . . . . . . . . . . . 13.2 2.3 235.6
Loss from sale of discontinued operations, net of tax . . . . . . . . . . . . . . . . . . 142.6 — —
Adjustments to reconcile net income to net cash provided by operating activities:
Depreciation and amortization . . . . . . . . . . . . . . . . . . . . . . . . . . . . . . . . . 232.8 216.4 235.8
Noncash compensation . . . . . . . . . . . . . . . . . . . . . . . . . . . . . . . . . . . . . .
62.9 60.6 65.3
Noncash income from financial services . . . . . . . . . . . . . . . . . . . . . . . . . (15.1) (7.7) (18.5)
Deferred income taxes . . . . . . . . . . . . . . . . . . . . . . . . . . . . . . . . . . . . . . . (48.9) 15.2 (83.7)
Loss on sale of businesses, net . . . . . . . . . . . . . . . . . . . . . . . . . . . . . . . . . .
— 34.8 —
Goodwill impairment . . . . . . . . . . . . . . . . . . . . . . . . . . . . . . . . . . . . . . . . .
— — 81.1
Other, net . . . . . . . . . . . . . . . . . . . . . . . . . . . . . . . . . . . . . . . . . . . . . . . . . . . (0.5) 7.1 1.8
Changes in operating assets and liabilities:
Trade receivables . . . . . . . . . . . . . . . . . . . . . . . . . . . . . . . . . . . . . . . .
(122.6) 1.8 (64.6)
Inventories . . . . . . . . . . . . . . . . . . . . . . . . . . . . . . . . . . . . . . . . . . . . . . (391.1) (490.1) (61.3)
Accounts payable . . . . . . . . . . . . . . . . . . . . . . . . . . . . . . . . . . . . . . . .
71.7 31.2 324.2
Accrued expenses . . . . . . . . . . . . . . . . . . . . . . . . . . . . . . . . . . . . . . . . 131.1 (62.3) 42.5
Income taxes payable/receivable . . . . . . . . . . . . . . . . . . . . . . . . . . . .
18.4 (3.8) 104.4
Prepaid expenses and other, net . . . . . . . . . . . . . . . . . . . . . . . . . . . . .
(7.6) (13.0) (25.7)
Net cash provided by operating activities of continuing operations . . . . . . . . . . .
534.5 286.8 961.8
Net cash provided by (used for) operating activities of discontinued operations .
(25.9) 6.9 56.8
Net cash provided by operating activities . . . . . . . . . . . . . . . . . . . . . . . . . . . . . . .
508.6 293.7 1,018.6
Investing Activities:
Purchase of property and equipment . . . . . . . . . . . . . . . . . . . . . . . . . . . . . . . (306.6) (282.8) (204.3)
Investment in finance affiliate . . . . . . . . . . . . . . . . . . . . . . . . . . . . . . . . . . . . (59.3) (42.2) (30.6)
Distributions from finance affiliate . . . . . . . . . . . . . . . . . . . . . . . . . . . . . . . . 30.6 60.0 100.4
Investment in other affiliates . . . . . . . . . . . . . . . . . . . . . . . . . . . . . . . . . . . . . .
(26.2) (23.4) (6.6)
Proceeds from sale of businesses, net . . . . . . . . . . . . . . . . . . . . . . . . . . . . . . .
42.2 — —
Net cash used for investing activities of continuing operations . . . . . . . . . . . . . .
(319.3) (288.4) (141.1)
Net cash used for investing activities of discontinued operations . . . . . . . . . . . . . (5.3) (15.5) (9.6)
Net cash used for investing activities . . . . . . . . . . . . . . . . . . . . . . . . . . . . . . . . . . . (324.6) (303.9) (150.7)
Financing Activities:
Borrowings under debt arrangements . . . . . . . . . . . . . . . . . . . . . . . . . . . . . . .
2,987.5 2,424.3 1,365.5
Repayments under debt arrangements . . . . . . . . . . . . . . . . . . . . . . . . . . . . . . . (2,729.8) (2,073.0) (1,611.7)
Repurchase and retirement of common shares . . . . . . . . . . . . . . . . . . . . . . .
(505.0) (461.6) (50.3)
Cash dividends to shareholders . . . . . . . . . . . . . . . . . . . . . . . . . . . . . . . . . . . (150.0) (153.4) (152.5)
Proceeds from stock issuances under employee plans . . . . . . . . . . . . . . . . .
34.1 156.1 33.6
Net cash used for financing activities . . . . . . . . . . . . . . . . . . . . . . . . . . . . . . . . . .
(363.2) (107.6) (415.4)
Impact of currency exchange rates on cash balances . . . . . . . . . . . . . . . . . . . . . (10.2) (10.6) 8.7
Net increase (decrease) in cash, cash equivalents and restricted cash . . . . . .
(189.4)
(128.4)
461.2
Cash, cash equivalents and restricted cash at beginning of period . . . . . . . . . . . 529.1 657.5 196.3
Cash, cash equivalents and restricted cash at end of period . . . . . . . . . . . . . $ 339.7 $ 529.1 $ 657.5
Supplemental Cash Flow Information:
Interest paid on debt borrowings . . . . . . . . . . . . . . . . . . . . . . . . . . . . . . . . . . $ 71.2 $ 44.8 $ 67.0
Income taxes paid . . . . . . . . . . . . . . . . . . . . . . . . . . . . . . . . . . . . . . . . . . . . .
$ 194.4 $ 124.4 $ 65.5
The following presents the classification of cash, cash equivalents and restricted
cash within the consolidated balance sheets:
Cash and cash equivalents . . . . . . . . . . . . . . . . . . . . . . . . . . . . . . . . . . . . . . . $ 324.5 $ 502.3 $ 631.7
Current assets held for sale . . . . . . . . . . . . . . . . . . . . . . . . . . . . . . . . . . . . . .
— 6.9 3.0
Other long-term assets . . . . . . . . . . . . . . . . . . . . . . . . . . . . . . . . . . . . . . . . . . 15.2 19.9 22.8
Total . . . . . . . . . . . . . . . . . . . . . . . . . . . . . . . . . . . . . . . . . . . . . . . . . . . . . . . . . . . . $ 339.7 $ 529.1 $ 657.5
For the Years Ended December 31,
The accompanying footnotes are an integral part of these consolidated statements.
46
POLARIS INC.
NOTES TO CONSOLIDATED FINANCIAL STATEMENTS
Note 1. Organization and Significant Accounting Policies
Polaris Inc. (“Polaris” or the “Company”), a Minnesota corporation, and its subsidiaries are engaged in the design,
engineering, manufacturing and marketing of powersports vehicles, which include: off-road vehicles (“ORV”), including
all-terrain vehicles (“ATV”) and side-by-side vehicles; military and commercial ORVs; snowmobiles; motorcycles;
moto-roadsters; quadricycles; boats; and related Parts, Garments and Accessories (“PG&A”), which includes aftermarket
accessories and apparel. Polaris products are sold worldwide online and through a network of independent dealers and
distributors. The primary markets for the Company’s products are the United States, Canada, Western Europe, Australia
and Mexico.
Basis of presentation. The accompanying consolidated financial statements include the accounts of Polaris and its
wholly-owned subsidiaries. All intercompany transactions and balances have been eliminated in consolidation. Income
from financial services is reported as a component of operating income to better reflect income from ongoing operations,
of which financial services has a significant impact.
The Company evaluates consolidation of entities under Accounting Standards Codification (ASC) Topic 810. This Topic
requires management to evaluate whether an entity or interest is a variable interest entity and whether the company is the
primary beneficiary. The Company used the guidelines to analyze the Company’s relationships and concluded that there
were no variable interest entities requiring consolidation by the Company.
Reclassifications. Reclassifications of certain prior year segment results and account balances have been made to
conform to the current-year presentation. The reclassifications had no impact on the consolidated balance sheets,
statements of income, comprehensive income, equity, or cash flows, as previously reported. Refer to Note 16 for
additional information.
On July 1, 2022, the Company completed the sale of its Transamerican Auto Parts (“TAP”) business. The operating
results of the TAP business are reported in loss from discontinued operations, net of tax in the consolidated statements of
income for all periods presented. In addition, the related assets and liabilities are reported as assets and liabilities held for
sale in the consolidated balance sheets. All amounts and disclosures included in the notes to consolidated financial
statements reflect only the Company's continuing operations, unless otherwise noted. Refer to Note 4 for additional
information.
Use of estimates. The preparation of financial statements in conformity with accounting principles generally accepted in
the United States requires management to make estimates and assumptions that affect the reported amounts of assets and
liabilities and disclosure of contingent assets and liabilities at the date of the financial statements and the reported
amounts of revenues and expenses during the reporting period. Actual results could differ from those estimates.
Fair value measurements. Fair value is the exchange price that would be received for an asset or paid to transfer a
liability (an exit price) in the principal or most advantageous market for the asset or liability in an orderly transaction
between market participants on the measurement date. Assets and liabilities measured at fair value are classified using
the following hierarchy, which is based upon the transparency of inputs to the valuation as of the measurement date:
Level 1 — Quoted prices in active markets for identical assets or liabilities.
Level 2 — Observable inputs other than Level 1 prices such as quoted prices for similar assets or liabilities; quoted
prices in markets that are not active; or other inputs that are observable or can be corroborated by observable
market data for substantially the full term of the assets or liabilities.
Level 3 — Unobservable inputs that are supported by little or no market activity and that are significant to the fair
value of the assets or liabilities.
In making fair value measurements, observable market data must be used when available. When inputs used to measure
fair value fall within different levels of the hierarchy, the level within which the fair value measurement is categorized is
based on the lowest level input that is significant to the fair value measurement. The Company utilizes the market
approach to measure fair value for its non-qualified deferred compensation assets and liabilities, and the income
approach for foreign currency contracts and interest rate contracts. The market approach uses prices and other relevant
information generated by market transactions involving identical or comparable assets or liabilities, and for the income
47

approach the Company uses significant other observable inputs to value its derivative instruments used to hedge foreign
currency and interest rate transactions.
Assets and liabilities measured at fair value on a recurring basis are summarized below (in millions):
Input Level December 31, 2022 December 31, 2021
Assets
Non-qualified deferred compensation assets . . . . . . . . . . . . . . . . Level 1 $ 39.8 $ 52.4
Foreign exchange contracts, net . . . . . . . . . . . . . . . . . . . . . . . . . . Level 2 8.4 2.1
Interest rate contracts, net . . . . . . . . . . . . . . . . . . . . . . . . . . . . . . . Level 2 5.9 —
Liabilities
Non-qualified deferred compensation liabilities . . . . . . . . . . . . . Level 1 $ (39.8) $ (52.4)
Interest rate contracts, net . . . . . . . . . . . . . . . . . . . . . . . . . . . . . . . Level 2 — (7.8)
Fair value of other financial instruments. The carrying values of the Company’s short-term financial instruments,
including cash and cash equivalents, trade receivables and short-term debt, including current maturities of long-term
debt, finance lease obligations and notes payable, approximate their fair values. As of December 31, 2022 and
December 31, 2021, the fair value of the Company’s long-term debt, finance lease obligations and notes payable was
approximately $2,070.3 million and $1,870.0 million, respectively, and was determined primarily using Level 2 inputs,
including quoted market prices or discounted cash flows based on quoted market rates for similar types of debt. The
carrying value of long-term debt, finance lease obligations and notes payable including current maturities was $2,057.8
million and $1,800.7 million as of December 31, 2022 and December 31, 2021, respectively.
The Company measures certain assets and liabilities at fair value on a nonrecurring basis. The Company will impair or
write off an investment and recognize a loss when events or circumstances indicate there is impairment in the investment
that is other-than-temporary. The amount of loss is determined by measuring the investment at fair value. Refer to Note
12 for additional information.
Cash equivalents. The Company considers all highly liquid investments purchased with an original maturity of 90 days
or less to be cash equivalents. Cash equivalents are stated at cost, which approximates fair value. Such investments
consist principally of money market mutual funds.
Restricted cash. The Company classifies amounts of cash that are restricted in terms of their use and withdrawal
separately within other long-term assets in the consolidated balance sheets. The Company’s restricted cash is comprised
primarily of cash held in trust accounts not available for general use due to contractual restrictions.
Allowance for doubtful accounts. The Company’s exposure to credit losses on accounts receivable is limited due to its
agreements with certain finance companies. For receivables not serviced through these finance companies, the Company
establishes a reserve for doubtful accounts based on historical credit loss experience, the age of the accounts receivables,
credit quality of our customers, current and expected economic conditions, and other factors that may affect our ability to
collect from customers.
Inventories. Inventory costs include material, labor and manufacturing overhead costs, including depreciation expense
associated with the manufacture and distribution of the Company’s products. Inventories are stated at the lower of cost or
net realizable value with substantially all inventories recorded using the first-in, first-out method. Finished goods include
products that are completed and ready for sale or substantially completed as the product has gone through the primary
manufacturing and assembly process.
Investment in finance affiliate. The caption investment in finance affiliate in the consolidated balance sheets represents
the Company’s fifty percent equity interest in Polaris Acceptance. The Company’s allocable share of the income of
Polaris Acceptance has been included as a component of income from financial services in the consolidated statements of
income. Refer to Note 11 for additional information.
Investment in other affiliates. The Company’s investment in other affiliates is included within other long-term assets in
the consolidated balance sheets, and represents the Company’s investment in nonmarketable securities of strategic
companies. For each investment, the Company assesses the level of influence in determining whether to account for the
investment under the cost method or equity method. For equity method investments, the Company’s proportionate share
of income or losses is recorded in the consolidated statements of income. The Company will write down or write off an
48
investment and recognize a loss if and when events or circumstances indicate there is impairment in the investment that
is other-than-temporary. Refer to Note 11 for additional information.
Property and equipment. Property and equipment is stated at historical cost. Depreciation is determined using the
straight-line method over the estimated useful life of the respective assets, ranging from 10-40 years for buildings and
improvements and from 1-7 years for equipment and tooling. Depreciation of assets recorded under finance leases is
included within depreciation expense. Fully-depreciated tooling is eliminated from the accounting records annually. The
Company recorded $214.0 million, $193.4 million, and $198.2 million of depreciation expense for the years ended
December 31, 2022, 2021, and 2020, respectively. Substantially all of the Company’s property and equipment is located
in North America.
Goodwill and other intangible assets. Goodwill is tested at least annually for impairment and is tested for impairment
more frequently when events or changes in circumstances indicate that the asset might be impaired. The Company
completes its annual goodwill impairment test as of the first day of the fourth quarter.
The Company may first perform a qualitative assessment to determine whether it is more likely than not that the fair
value of each reporting unit is less than its carrying amount. A qualitative assessment requires that the Company
considers events or circumstances including macroeconomic conditions, industry and market considerations, cost factors,
overall financial performance, changes in management or key personnel, changes in strategy, changes in customers,
changes in the composition or carrying amount of a reporting unit’s net assets, and changes in the Company’s stock
price. If, after assessing the totality of events or circumstances, it is determined that it is more likely than not that the fair
value of the reporting unit is less than its carrying amount, or if the Company elects to bypass the qualitative test and
proceed to a quantitative test, then the quantitative goodwill impairment test is performed. A quantitative test includes
comparing the fair value of each reporting unit to the carrying amount of the reporting unit, including goodwill. If the
estimated fair value is less than the carrying amount of the reporting unit, an impairment is recognized in an amount
equal to the difference, limited to the total amount of goodwill allocated to that reporting unit.
Under the quantitative goodwill impairment test, the fair value of each reporting unit is determined using a discounted
cash flow analysis and market approach. Determining the fair value of the reporting units requires the use of significant
judgment, including discount rates, assumptions in the Company’s long-term business plan about future revenues and
expenses, capital expenditures, and changes in working capital, which are dependent on internal forecasts, estimation of
long-term growth for each reporting unit, and determination of the discount rate. These plans take into consideration
numerous factors including historical experience, anticipated future economic conditions, changes in raw material prices,
and growth expectations for the industries and end markets in which the Company participates.
For its annual test in 2022, the Company completed a qualitative assessment for all reporting units.
The Company’s primary identifiable intangible assets include: dealer/customer relationships, brand/trade names,
developed technology, and non-compete agreements. Identifiable intangible assets with finite lives are amortized and
those identifiable intangibles with indefinite lives are not amortized. Identifiable intangible assets that are subject to
amortization are tested for impairment whenever events or changes in circumstances indicate that the carrying amount
may not be recoverable. Identifiable intangible assets with indefinite lives are tested for impairment annually or more
frequently when events or changes in circumstances indicate that the asset might be impaired. The Company’s
identifiable intangible assets with indefinite lives include brand/trade names. The impairment test consists of a
comparison of the fair value of the brand/trade name with its carrying value. The Company completes its annual
impairment test as of the first day of the fourth quarter each year for identifiable intangible assets with indefinite lives.
Refer to Note 8 for additional information on goodwill and other intangible assets.
Revenue recognition. The Company recognizes revenue when it satisfies a performance obligation by transferring control
of a good or service to a customer. Revenue is measured based on the amount of consideration that the Company expects
to be entitled to in exchange for the goods or services transferred. Sales, value add, and other taxes that are collected
from a customer concurrent with revenue-producing activities are excluded from revenue. Revenue from goods and
services transferred to customers at a point-in-time accounts for the majority of the Company’s revenue. Revenue from
products or services transferred over time is discussed in the contract liabilities section.
For the majority of wholegood vehicles, boats, and PG&A, the Company transfers control and recognizes a sale when it
ships the product from its manufacturing facility, distribution center, or vehicle holding center to its customer. The
amount of consideration the Company receives and revenue it recognizes varies with changes in marketing incentives
and rebates it offers to its dealers and their customers. Payment terms vary by customer and most of the Company’s sales
49
are financed by the customer under floorplan financing arrangements whereby the Company receives payment within a
few days of shipment of the product.
When the right of return exists, the Company adjusts the consideration for the estimated effect of returns. The Company
estimates expected returns based on historical sales levels, the timing and magnitude of historical sales return levels as a
percent of sales, type of product, type of customer, and a projection of this experience into the future. The Company
adjusts its estimate of revenue at the earlier of when the most likely amount of consideration it expects to receive
changes or when the consideration becomes fixed.
Depending on the terms of the arrangement, the Company may also defer the recognition of a portion of the
consideration received because it has to satisfy a future obligation. The Company uses an observable price to determine
the stand-alone selling price for separate performance obligations. The Company has elected to recognize the cost for
freight and shipping when control over vehicles, boats, or PG&A has transferred to the customer as an expense in cost of
sales.
The Company sells separately-priced service contracts (“ESCs”) that extend mechanical coverages beyond the base
limited warranty as well as prepaid maintenance agreements to vehicle owners. Each of these separately priced service
contracts range from 12 months to 84 months. The Company typically receives payment at the inception of the contract
and recognizes revenue over the term of the agreement in proportion to the costs expected to be incurred in satisfying the
obligations under the contract.
Sales promotions and incentives. The Company accrues for estimated sales promotion and incentive expenses, which are
recognized as a component of sales in measuring the amount of consideration the Company expects to receive in
exchange for transferring goods or providing services. Examples of sales promotion and incentive programs include
dealer and consumer rebates, volume incentives, retail financing programs and sales associate incentives. Sales
promotion and incentive expenses are estimated based on current programs, planned programs, and historical rates for
each product line. The Company records these amounts as a liability in the consolidated balance sheet until they are
ultimately paid. Adjustments to sales promotions and incentives accruals are made as actual usage becomes known in
order to properly estimate the amounts necessary to generate consumer demand based on market conditions as of the
balance sheet date.
Dealer holdback programs. Dealer holdback represents a portion of the invoiced sales price that is expected to be
subsequently returned to the dealer or distributor as a sales incentive upon the ultimate retail sale of the product.
Holdback amounts reduce the ultimate net price of the products purchased by the Company’s dealers or distributors and,
therefore, reduce the amount of sales the Company recognizes. The portion of the invoiced sales price estimated as the
holdback is recognized as “dealer holdback” liability on the Company’s consolidated balance sheet until paid or
forfeited. The minimal holdback adjustments in the estimated holdback liability due to forfeitures are recognized in net
sales. Payments are made to dealers or distributors at various times during the year subject to previously established
criteria.
Shipping and handling costs. The Company records shipping and handling costs as a component of cost of sales when
control has transferred to the customer.
Research and development expenses. The Company records research and development expenses in the period in which
they are incurred as a component of operating expenses.
Advertising expenses. The Company records advertising expenses as a component of selling and marketing expenses in
the period in which they are incurred. In the years ended December 31, 2022, 2021 and 2020, the Company incurred
$87.6 million, $90.8 million and $95.8 million of advertising expenses, respectively.
Product warranties. The Company typically provides a limited warranty for its vehicles and boats for a period of six
months to ten years, depending on the product. The Company provides longer warranties in certain geographical markets
as determined by local regulations and customary practice and may also provide longer warranties related to certain
promotional programs. The Company’s standard warranties require the Company, generally through its dealer network,
to repair or replace defective products during such warranty periods. The warranty reserve is established at the time of
sale to the dealer or distributor based on management’s best estimate using historical rates and trends. The Company
records these amounts as a liability in the consolidated balance sheet until they are ultimately paid. Adjustments to the
warranty reserve are made based on actual claims experience in order to properly estimate the amounts necessary to
settle future and existing claims on products sold as of the balance sheet date. The warranty reserve includes the
estimated costs related to recalls, which are accrued when probable and estimable. Factors that could have an impact on
50

the warranty reserve include the following: changes in manufacturing quality, shifts in product mix, changes in warranty
coverage periods, impacts on product usage (including weather), product recalls and changes in sales volume.
The activity in the warranty reserve during the periods presented was as follows (in millions):
For the Years Ended December 31,
2022 2021 2020
Balance at beginning of year . . . . . . . . . . . . . . . . . . . . . . . . . . . . . . . . . $ 132.9 $ 138.6 $ 134.0
Reductions to reserve related to divestitures . . . . . . . . . . . . . . . . . . . . . . — (2.1) —
Additions charged to expense . . . . . . . . . . . . . . . . . . . . . . . . . . . . . . . . 183.5 130.4 123.7
Warranty claims paid, net . . . . . . . . . . . . . . . . . . . . . . . . . . . . . . . . . . . . (143.5) (134.0) (119.1)
Balance at end of year . . . . . . . . . . . . . . . . . . . . . . . . . . . . . . . . . . . . . . . $ 172.9 $ 132.9 $ 138.6
Leases. The Company leases certain manufacturing facilities, retail stores, warehouses, distribution centers, office space,
land, and equipment. Leases with an initial term of 12 months or less are not recorded on the balance sheet; the Company
recognizes lease expense for these leases on a straight-line basis over the lease term. The Company does not separate
non-lease components from the lease components to which they relate, and instead accounts for each separate lease and
non-lease component associated with that lease component as a single lease component for all underlying asset classes.
As most of the Company's leases do not provide an implicit rate, the Company uses its estimated incremental borrowing
rate based on the information available at commencement date in determining the present value of lease payments.
Some leases include one or more options to renew, with renewal terms that can extend the lease term from one to 20
years or more. Such options are included in the lease term when it is reasonably certain that the option will be exercised.
Certain leases also include options to purchase the leased property. The depreciable life of assets and leasehold
improvements are limited by the expected lease term, unless there is a transfer of title or purchase option reasonably
certain of exercise. Certain lease agreements include rental payments that are variable based on usage or are adjusted
periodically for inflation. The Company’s lease agreements do not contain any material residual value guarantees or
material restrictive covenants.
Share-based employee compensation. The Company accounts for share-based compensation awards, including stock
options and other equity-based compensation issued to employees, on a fair value basis. Determining the appropriate
fair-value model and calculating the fair value of share-based awards at the date of grant requires judgment. The
Company utilizes the Black-Scholes option pricing model to estimate the fair value of employee stock options, and the
Monte Carlo model to estimate the fair value of employee performance restricted stock units that include a market
condition. These pricing models also require the use of input assumptions, including expected volatility, expected life,
expected dividend yield, and expected risk-free rate of return. The Company utilizes historical volatility as the Company
believes this is reflective of market conditions. The expected life of the awards is based on historical exercise patterns.
The risk-free interest rate assumption is based on observed interest rates appropriate for the terms of awards. The
dividend yield assumption is based on the Company’s history of dividend payouts.
The amount of compensation cost for share-based awards recognized during a period is based on the portion of the
awards that are ultimately expected to vest. The Company estimates forfeitures at the time of grant and revises those
estimates in subsequent periods if actual forfeitures differ from those estimates. The Company analyzes historical data to
estimate pre-vesting forfeitures and records share compensation expense for those awards expected to vest. If forfeiture
adjustments are made, they would affect gross margin and operating expenses.
All stock options have time-based vesting conditions. The Company estimates the likelihood and the rate of achievement
for performance share-based awards, specifically long-term compensation grants of performance-based restricted stock
unit awards. Changes in the estimated rate of achievement can have a significant effect on reported share-based
compensation expenses as the effect of a change in the estimated achievement level is recognized in the period that the
likelihood factor changes. If adjustments in the estimated rate of achievement are made, they would be reflected in gross
profit and operating expenses. Fluctuations in the Company’s stock price can have an effect on reported share-based
compensation expenses for liability-based awards. The impact from fluctuations in the Company’s stock price is
recognized in the period of the change, and is reflected in gross profit and operating expenses. Refer to Note 5 for
additional information.
Derivative instruments and hedging activities. Changes in the fair value of a derivative are recognized in earnings unless
the derivative qualifies as a hedge. To qualify as a hedge, the Company must formally document, designate and assess
51
the effectiveness of transactions that receive hedge accounting. The Company does not use any financial contracts for
trading purposes.
The Company enters into foreign exchange contracts to manage currency exposures from certain of its purchase
commitments denominated in foreign currencies and transfers of funds from its foreign subsidiaries. These contracts
meet the criteria for cash flow hedges. Gains and losses on the Canadian dollar and Australian dollar contracts at
settlement are recorded in non-operating other (income) expense, net in the consolidated income statements, and gains
and losses on the Mexican peso contracts at settlement are recorded in cost of sales in the consolidated statements of
income. The contracts are recorded in other current assets or other current liabilities in the consolidated balance sheets.
Unrealized gains and losses are recorded as a component of accumulated other comprehensive loss, net.
The Company enters into interest rate swaps in order to maintain a balanced risk of fixed and floating interest rates
associated with the Company’s debt. These contracts meet the criteria for cash flow hedges. The contracts are recorded
in other current assets or other current liabilities in the consolidated balance sheets. Unrealized gains and losses are
recorded as a component of Accumulated other comprehensive loss, net.
The Company enters into commodity hedging contracts in order to manage fluctuating market prices of certain
purchased commodities and raw materials that are integrated into the Company’s end products.
Refer to Note 15 for additional information regarding derivative instruments and hedging activities.
Foreign currency translation. The functional currency for the Company’s foreign subsidiaries is typically their
respective local currencies. The assets and liabilities in the Company’s foreign entities are translated at the foreign
exchange rate in effect at the balance sheet date. Translation gains and losses are reflected as a component of
accumulated other comprehensive loss, net in the shareholders’ equity section of the consolidated balance sheets.
Revenues and expenses in all of the Company’s foreign entities are translated at the average foreign exchange rate in
effect for each month of the quarter. Transaction gains and losses including intercompany transactions denominated in a
currency other than the functional currency of the entity involved are included in other (income) expense, net in the
consolidated statements of income.
New accounting pronouncements.
Reference Rate Reform. In March 2020, the Financial Accounting Standards Board (the “FASB”) issued ASU 2020-04,
Reference Rate Reform (Topic 848): Facilitation of the Effects of Reference Rate Reform on Financial Reporting. This
ASU provides practical expedients and exceptions for applying U.S. GAAP to contracts, hedging relationships and other
transactions affected by reference rate reform if certain criteria are met. The FASB also issued ASU 2021-01, Reference
Rate Reform (Topic 848): Scope in January 2021, which adds implementation guidance to clarify which optional
expedients in Topic 848 may be applied to derivative instruments that do not reference LIBOR or a reference rate that is
expected to be discontinued, but that are being modified as a result of the discounting transition. The FASB also issued
ASU 2022-06, Reference Rate Reform (Topic 848): Deferral of the Sunset Date of Topic 848 in December 2022, which
deferred the sunset date of Topic 848 from December 31, 2022 to December 31, 2024. The Company adopted ASU
2020-04, ASU 2021-01, and ASU 2022-06. The adoption of the ASUs did not have a material impact on the Company’s
consolidated financial position, results of operations, equity or cash flows.
There are no other new accounting pronouncements that are expected to have a significant impact on the Company’s
consolidated financial statements.
52

Note 2. Supplemental Balance Sheet Information
Inventories
Raw materials and purchased components . . . . . . . . . . . . . . . . . . . . . . . . . . . . . . . $ 843.5 $ 720.2
Service parts, garments and accessories . . . . . . . . . . . . . . . . . . . . . . . . . . . . . . . . . 371.1 276.4
Finished goods . . . . . . . . . . . . . . . . . . . . . . . . . . . . . . . . . . . . . . . . . . . . . . . . . . . . 768.2 588.2
Less: reserves . . . . . . . . . . . . . . . . . . . . . . . . . . . . . . . . . . . . . . . . . . . . . . . . . . . . . (86.7) (74.1)
Inventories, net . . . . . . . . . . . . . . . . . . . . . . . . . . . . . . . . . . . . . . . . . . . . . . . . . . . . $ 1,896.1 $ 1,510.7
Property and equipment
Land, buildings and improvements . . . . . . . . . . . . . . . . . . . . . . . . . . . . . . . . . . . . $ 539.1 $ 501.1
Equipment and tooling . . . . . . . . . . . . . . . . . . . . . . . . . . . . . . . . . . . . . . . . . . . . . . 1,645.0 1,598.3
2,184.1 2,099.4
Less: accumulated depreciation . . . . . . . . . . . . . . . . . . . . . . . . . . . . . . . . . . . . . . . (1,165.7) (1,171.7)
Property and equipment, net . . . . . . . . . . . . . . . . . . . . . . . . . . . . . . . . . . . . . . . . . . $ 1,018.4 $ 927.7
Accrued expenses
Compensation . . . . . . . . . . . . . . . . . . . . . . . . . . . . . . . . . . . . . . . . . . . . . . . . . . . . . $ 212.3 $ 205.9
Warranties . . . . . . . . . . . . . . . . . . . . . . . . . . . . . . . . . . . . . . . . . . . . . . . . . . . . . . . 172.9 132.9
Sales promotions and incentives . . . . . . . . . . . . . . . . . . . . . . . . . . . . . . . . . . . . . . 127.0 96.9
Dealer holdback . . . . . . . . . . . . . . . . . . . . . . . . . . . . . . . . . . . . . . . . . . . . . . . . . . . 129.7 98.9
Other accrued expenses . . . . . . . . . . . . . . . . . . . . . . . . . . . . . . . . . . . . . . . . . . . . . 254.9 221.9
Accrued expenses . . . . . . . . . . . . . . . . . . . . . . . . . . . . . . . . . . . . . . . . . . . . . . . . . . $ 896.8 $ 756.5
In millions
December 31, 2022 December 31, 2021
Note 3. Revenue Recognition
The following tables disaggregate the Company’s revenue by major product type and geography (in millions):
For the Year Ended December 31, 2022
Off Road On Road Marine Corporate Total
Revenue by product type
Wholegoods . . . . . . . . . . . . . . . . . . . . . $ 4,999.9 $ 956.5 $ 989.4 $ — $ 6,945.8
PG&A . . . . . . . . . . . . . . . . . . . . . . . . . . 1,436.3 206.9 — — 1,643.2
Total revenue . . . . . . . . . . . . . . . . . . . . $ 6,436.2 $ 1,163.4 $ 989.4 $ — $ 8,589.0
Revenue by geography
United States . . . . . . . . . . . . . . . . . . . . $ 5,233.3 $ 614.2 $ 961.7 $ — $ 6,809.2
Canada . . . . . . . . . . . . . . . . . . . . . . . . . 536.0 43.5 27.2 — 606.7
EMEA . . . . . . . . . . . . . . . . . . . . . . . . . 421.4 423.2 0.1 — 844.7
APLA . . . . . . . . . . . . . . . . . . . . . . . . . . 245.5 82.5 0.4 — 328.4
Total revenue . . . . . . . . . . . . . . . . . . . . $ 6,436.2 $ 1,163.4 $ 989.4 $ — $ 8,589.0
53

For the Year Ended December 31, 2021
Off Road On Road Marine Corporate Total
Revenue by product type
Wholegoods . . . . . . . . . . . . . . . . . . . . . $ 4,251.7 $ 847.6 $ 760.2 $ 59.8 $ 5,919.3
PG&A . . . . . . . . . . . . . . . . . . . . . . . . . . 1,322.9 184.2 — 12.8 1,519.9
Total revenue . . . . . . . . . . . . . . . . . . . . $ 5,574.6 $ 1,031.8 $ 760.2 $ 72.6 $ 7,439.2
Revenue by geography
United States . . . . . . . . . . . . . . . . . . . . $ 4,422.5 $ 514.3 $ 737.4 $ 68.1 $ 5,742.3
Canada . . . . . . . . . . . . . . . . . . . . . . . . . 517.6 33.1 22.6 0.4 573.7
EMEA . . . . . . . . . . . . . . . . . . . . . . . . . 402.3 400.2 0.2 0.5 803.2
APLA . . . . . . . . . . . . . . . . . . . . . . . . . . 232.2 84.2 — 3.6 320.0
Total revenue . . . . . . . . . . . . . . . . . . . . $ 5,574.6 $ 1,031.8 $ 760.2 $ 72.6 $ 7,439.2
For the Year Ended December 31, 2020
Off Road On Road Marine Corporate Total
Revenue by product type
Wholegoods . . . . . . . . . . . . . . . . . . . . . $ 3,731.4 $ 669.0 $ 603.4 $ 49.5 $ 5,053.3
PG&A . . . . . . . . . . . . . . . . . . . . . . . . . . 1,078.6 137.7 — 11.8 1,228.1
Total revenue . . . . . . . . . . . . . . . . . . . . $ 4,810.0 $ 806.7 $ 603.4 $ 61.3 $ 6,281.4
Revenue by geography
United States . . . . . . . . . . . . . . . . . . . . $ 3,995.2 $ 427.1 $ 592.4 $ 58.8 $ 5,073.5
Canada . . . . . . . . . . . . . . . . . . . . . . . . . 332.4 23.6 11.0 0.2 367.2
EMEA . . . . . . . . . . . . . . . . . . . . . . . . . 324.5 289.2 — 1.1 614.8
APLA . . . . . . . . . . . . . . . . . . . . . . . . . . 157.9 66.8 — 1.2 225.9
Total revenue . . . . . . . . . . . . . . . . . . . . $ 4,810.0 $ 806.7 $ 603.4 $ 61.3 $ 6,281.4
Contract Liabilities
Contract liabilities relate to deferred revenue recognized for cash consideration received at contract inception in advance
of the Company's performance under the respective contract and generally relate to the sale of separately priced ESCs.
The Company finances its self-insured risks related to ESCs. The premiums for ESCs are primarily recognized in income
in proportion to the costs expected to be incurred over the contract period. Warranty costs are recognized as incurred.
The Company expects to recognize approximately $35.5 million of the unearned amount over the next 12 months and
$75.6 million thereafter. The activity in the deferred revenue reserve during the periods presented was as follows (in
millions):
2022 2021 2020
Balance at beginning of year . . . . . . . . . . . . . . . . . . . . . . . . . . . . . . . . $ 108.3 $ 89.1 $ 63.1
New contracts sold . . . . . . . . . . . . . . . . . . . . . . . . . . . . . . . . . . . . . . . . 49.1 55.0 49.0
Revenue recognized on existing contracts . . . . . . . . . . . . . . . . . . . . . . (46.3) (35.8) (23.0)
Balance at end of year . . . . . . . . . . . . . . . . . . . . . . . . . . . . . . . . . . . . . $ 111.1 $ 108.3 $ 89.1
For the Years Ended December 31,
The unamortized ESC premiums recorded in other current liabilities totaled $35.5 million and $34.7 million as of
December 31, 2022 and 2021, respectively, while the amount recorded in other long-term liabilities totaled $75.6 million
and $73.6 million as of December 31, 2022 and 2021, respectively.
54

Note 4. Divestitures and Discontinued Operations
2021 Divestitures.
In an effort to more strategically allocate the Company’s resources, the Company sold its Global Electric Motorcar
(“GEM”) and Taylor-Dunn businesses on December 31, 2021. The sale resulted in a loss of $36.8 million. As a result of
this divestiture, the Company eliminated its Global Adjacent Markets segment on January 1, 2022. All segment results
were reclassified for comparability. The 2021 and 2020 financial results of these businesses are reflected in Corporate.
2022 Divestitures.
On July 1, 2022, the Company completed the sale of its Transamerican Auto Parts (“TAP”) business, an aftermarket
parts business, for a sales price, net of post-closing purchase price adjustments, of $42.2 million. TAP is a vertically
integrated manufacturer, distributor, retailer, and installer of off-road Jeep and truck parts and accessories. The
transaction included TAP’s full portfolio of operations, including all brands, product lines, manufacturing operations,
distribution facilities, more than 100 4 Wheel Parts retail locations, and more than 1,700 TAP employees.
The results of TAP have been presented as discontinued operations and the related assets and liabilities have been
classified as held for sale for all periods presented. For the year ended December 31, 2022, a loss on sale of $187.6
million was recorded which resulted in a $45.0 million income tax benefit.
TAP was historically included within the Company’s Aftermarket segment; however, as a result of the divestiture, the
Company began management of its portfolio of businesses under a new basis as of June 30, 2022. The Aftermarket
segment was eliminated and the results of the Company’s remaining aftermarket businesses historically included within
the Aftermarket segment were reclassified to the Off Road and On Road segments. The comparative 2021 and 2020
segment results were reclassified for comparability.
Results of discontinued operations were as follows (in millions):
For the Years Ended December 31,
2022 2021 2020
Sales . . . . . . . . . . . . . . . . . . . . . . . . . . . . . . . . . . . . . . . . . . . . . . . . $ 349.3 $ 759.0 $ 746.5
Cost of sales . . . . . . . . . . . . . . . . . . . . . . . . . . . . . . . . . . . . . . . . . . 262.9 567.3 572.1
Other costs and expenses . . . . . . . . . . . . . . . . . . . . . . . . . . . . . . . . . . 100.9 194.7 483.4
Loss from discontinued operations before income taxes . . . . . . . .
(14.5) (3.0) (309.0)
Income tax benefit . . . . . . . . . . . . . . . . . . . . . . . . . . . . . . . . . . . . . . . (1.3) (0.7) (73.4)
Loss from discontinued operations, net of tax . . . . . . . . . . . . . . . . . . (13.2) (2.3) (235.6)
Loss from sale of discontinued operations . . . . . . . . . . . . . . . . . . . . 187.6 — —
Provision for income taxes . . . . . . . . . . . . . . . . . . . . . . . . . . . . . . . . (45.0) — —
Loss from sale of discontinued operations, net of tax . . . . . . . . . . . .
142.6 — —
Net loss from discontinued operations . . . . . . . . . . . . . . . . . . . . . . . $ (155.8) $ (2.3) $ (235.6)
55

The carrying amounts of major classes of assets and liabilities of discontinued operations were as follows (in millions):
Cash . . . . . . . . . . . . . . . . . . . . . . . . . . . . . . . . . . . . . . . . . . . . . . . . . . . . . . . . . . . . . . . . . . . . . . . . . . . . $ 6.9
Trade receivables . . . . . . . . . . . . . . . . . . . . . . . . . . . . . . . . . . . . . . . . . . . . . . . . . . . . . . . . . . . . . . . . . . 12.6
Inventories, net . . . . . . . . . . . . . . . . . . . . . . . . . . . . . . . . . . . . . . . . . . . . . . . . . . . . . . . . . . . . . . . . . . . 134.1
Other current assets . . . . . . . . . . . . . . . . . . . . . . . . . . . . . . . . . . . . . . . . . . . . . . . . . . . . . . . . . . . . . . . . 9.6
Current assets held for sale . . . . . . . . . . . . . . . . . . . . . . . . . . . . . . . . . . . . . . . . . . . . . . . . . . . . . . . . . . $ 163.2
Property and equipment, net . . . . . . . . . . . . . . . . . . . . . . . . . . . . . . . . . . . . . . . . . . . . . . . . . . . . . . . . . $ 47.7
Intangible assets, net . . . . . . . . . . . . . . . . . . . . . . . . . . . . . . . . . . . . . . . . . . . . . . . . . . . . . . . . . . . . . . . 102.3
Operating lease assets . . . . . . . . . . . . . . . . . . . . . . . . . . . . . . . . . . . . . . . . . . . . . . . . . . . . . . . . . . . . . . 74.8
Other long-term assets . . . . . . . . . . . . . . . . . . . . . . . . . . . . . . . . . . . . . . . . . . . . . . . . . . . . . . . . . . . . . . 1.2
Long-term assets held for sale . . . . . . . . . . . . . . . . . . . . . . . . . . . . . . . . . . . . . . . . . . . . . . . . . . . . . . . . $ 226.0
Accounts payable . . . . . . . . . . . . . . . . . . . . . . . . . . . . . . . . . . . . . . . . . . . . . . . . . . . . . . . . . . . . . . . . . . $ 21.5
Accrued expenses and other current liabilities . . . . . . . . . . . . . . . . . . . . . . . . . . . . . . . . . . . . . . . . . . . 66.5
Current operating lease liabilities . . . . . . . . . . . . . . . . . . . . . . . . . . . . . . . . . . . . . . . . . . . . . . . . . . . . . 19.8
Current liabilities held for sale . . . . . . . . . . . . . . . . . . . . . . . . . . . . . . . . . . . . . . . . . . . . . . . . . . . . . . . $ 107.8
Long-term operating lease liabilities . . . . . . . . . . . . . . . . . . . . . . . . . . . . . . . . . . . . . . . . . . . . . . . . . . . $ 57.2
Other long-term liabilities . . . . . . . . . . . . . . . . . . . . . . . . . . . . . . . . . . . . . . . . . . . . . . . . . . . . . . . . . . . 8.9
Long-term liabilities held for sale . . . . . . . . . . . . . . . . . . . . . . . . . . . . . . . . . . . . . . . . . . . . . . . . . . . . . $ 66.1
December 31, 2021
Note 5. Share-Based Compensation
Share-based plans. The Company grants long-term equity-based incentives and awards for the benefit of its employees
and directors under the shareholder approved Polaris Inc. 2007 Omnibus Incentive Plan (as amended and restated as of
April 30, 2020) (the “Omnibus Plan”). A maximum of 27,775,000 shares of common stock are available for issuance
under the Omnibus Plan, together with additional shares canceled or forfeited under the prior plans.
Stock option awards granted to date under the Omnibus Plan generally vest one to four years from the award date and
expire after ten years. In addition, since 2007, the Company has granted a total of 243,000 deferred stock units to its non-
employee directors under the Omnibus Plan (with grants of 17,000, 10,000 and 20,000 units in 2022, 2021 and 2020,
respectively), which will be converted into common stock when the director’s board service ends or upon a change in
control. Restricted units and performance-based restricted units (collectively restricted stock) awarded under the
Omnibus Plan generally vest after a one to four year period. The final number of shares issued under performance-based
awards are dependent on achievement of certain performance measures.
Under the Polaris Inc. Deferred Compensation Plan for Directors (“Director Plan”) and the Omnibus Plan, members of
the Board of Directors who are not Polaris officers or employees may annually elect to receive common stock
equivalents in lieu of director fees, which will be converted into common stock when board service ends. Alternatively,
these common stock equivalents may be diversified into other investments until board service ends, pursuant to the terms
of the Director Plan. A maximum of 500,000 shares of common stock has been authorized under the Director Plan, of
which 73,000 common stock equivalents have been earned and 427,000 shares have been issued to retired directors as of
December 31, 2022. Authorized shares under the Director Plan were exhausted in 2017. Since 2017, the Company has
granted a total of 67,000 common stock equivalents to its non-employee directors under the Omnibus Plan (with grants
of 11,000, 8,000 and 13,000 units in 2022, 2021 and 2020, respectively). As of December 31, 2022 and 2021, the
Company’s liability under the plans for the common stock equivalents totaled $9.2 million and $8.8 million,
respectively.
56

The Company maintains a long-term incentive program under which awards are issued for certain employees. Long-term
incentive program awards are granted in restricted stock units and stock options and are accounted for as equity awards.
Share-based compensation expense. The amount of compensation cost for share-based awards recognized during a
period is based on the portion of the awards that are ultimately expected to vest.
Total share-based compensation expenses were as follows (in millions):
2022 2021 2020
Option awards . . . . . . . . . . . . . . . . . . . . . . . . . . . . . . . . . . . . . . . . . . . . . . $ 11.4 $ 9.8 $ 13.8
Other share-based awards . . . . . . . . . . . . . . . . . . . . . . . . . . . . . . . . . . . . 39.2 40.9 40.9
Total share-based compensation before tax . . . . . . . . . . . . . . . . . . . . . . 50.6 50.7 54.7
Tax benefit . . . . . . . . . . . . . . . . . . . . . . . . . . . . . . . . . . . . . . . . . . . . . . . 12.0 12.1 13.1
Total share-based compensation expense included in net income . . . . . $ 38.6 $ 38.6 $ 41.6
For the Years Ended December 31,
These share-based compensation expenses are reflected in cost of sales and operating expenses in the consolidated
statements of income. As of December 31, 2022, there was $52.4 million of total unrecognized share-based
compensation expense related to unvested share-based equity awards. Unrecognized share-based compensation expense
is expected to be recognized over a weighted-average period of 1.2 years. Included in unrecognized share-based
compensation expense is approximately $5.1 million related to stock options and $47.3 million for restricted stock.
In addition to the above share-based compensation expenses, the Company sponsors a qualified non-leveraged employee
stock ownership plan (ESOP). Shares allocated to eligible participants’ accounts vest at various percentage rates based
on years of service and require no cash payments from the recipient. See Note 6 for additional information.
General stock option and restricted stock information. The following summarizes stock option activity and the weighted
average exercise price for the Omnibus Plan for the year ended December 31, 2022:
Options
Outstanding
Weighted
Average
Exercise
Price
Balance as of December 31, 2021 . . . . . . . . . . . . . . . . . . . . . . . . . . . . . . . . . . . . . . . . . . . . 3,279,701 $ 104.29
Granted . . . . . . . . . . . . . . . . . . . . . . . . . . . . . . . . . . . . . . . . . . . . . . . . . . . . . . . . . . 346,535 113.11
Exercised . . . . . . . . . . . . . . . . . . . . . . . . . . . . . . . . . . . . . . . . . . . . . . . . . . . . . . . . (351,332) 87.36
Forfeited/Expired . . . . . . . . . . . . . . . . . . . . . . . . . . . . . . . . . . . . . . . . . . . . . . . . . . . (151,161) 125.59
Balance as of December 31, 2022 . . . . . . . . . . . . . . . . . . . . . . . . . . . . . . . . . . . . . . . . . . . . 3,123,743 $ 106.16
Options exercisable as of December 31, 2022 . . . . . . . . . . . . . . . . . . . . . . . . . . . . . . . . . . 2,504,752 $ 104.91
Omnibus Plan
(Active)
The weighted average remaining contractual life of options outstanding and of options outstanding and exercisable as of
December 31, 2022 was 5.2 years and 4.4 years, respectively. Substantially all unvested outstanding options are expected
to vest.
The following assumptions were used to estimate the weighted average fair value of options granted of $37.41, $36.77
and $21.76 during the years ended December 31, 2022, 2021 and 2020, respectively:
2022 2021 2020
Weighted-average volatility . . . . . . . . . . . . . . . . . . . . . . . . . . . . . . . . . . 43 % 43 % 34 %
Expected dividend yield . . . . . . . . . . . . . . . . . . . . . . . . . . . . . . . . . . . . . 2.2 % 2.1 % 2.6 %
Expected term (in years) . . . . . . . . . . . . . . . . . . . . . . . . . . . . . . . . . . . . . 4.9 4.7 4.5
Weighted average risk free interest rate . . . . . . . . . . . . . . . . . . . . . . . . . 1.7 % 0.5 % 1.4 %
For the Years Ended December 31,
57

The total intrinsic value of options exercised during the year ended December 31, 2022 was $9.9 million. The total
intrinsic value of options outstanding and of options outstanding and exercisable as of December 31, 2022, was $35.7
million and $33.6 million, respectively. The total intrinsic values are based on the Company’s closing stock price on the
last trading day of the applicable year for in-the-money options.
The grant date fair value for performance awards with a total shareholder return (TSR) market condition were estimated
using a Monte Carlo simulation model utilizing the following weighted-average assumptions:
For the Years Ended December 31,
2022 2021 2020
Weighted-average volatility . . . . . . . . . . . . . . . . . . . . . . . . . . . . . . . . . . 48 % 49 % 35 %
Expected dividend yield . . . . . . . . . . . . . . . . . . . . . . . . . . . . . . . . . . . . . 2.2 % 2.1 % 2.6 %
Expected term (in years) . . . . . . . . . . . . . . . . . . . . . . . . . . . . . . . . . . . . . 3.0 3.0 3.0
Weighted average risk free interest rate . . . . . . . . . . . . . . . . . . . . . . . . . 1.5 % 0.2 % 1.4 %
The Company used its historical stock price as the basis for the Company’s volatility assumption. The assumed risk-free
interest rates were based on U.S. Treasury rates in effect at the time of grant. The expected term was based on the vesting
period. The weighted-average fair value used to record compensation expense for TSR performance share awards
granted during 2022, 2021, and 2020 was $146.08, $165.54, and $98.09 per award, respectively.
The following table summarizes restricted stock activity for the year ended December 31, 2022:
Balance as of December 31, 2021 . . . . . . . . . . . . . . . . . . . . . . . . . . . . . . . . . . . . . . . . . . . . 1,063,753 $ 101.72
Granted . . . . . . . . . . . . . . . . . . . . . . . . . . . . . . . . . . . . . . . . . . . . . . . . . . . . . . . . . . 347,083 119.42
Vested . . . . . . . . . . . . . . . . . . . . . . . . . . . . . . . . . . . . . . . . . . . . . . . . . . . . . . . . . . (443,170) 91.05
Forfeited/Cancelled . . . . . . . . . . . . . . . . . . . . . . . . . . . . . . . . . . . . . . . . . . . . . . . . . . (101,648) 109.24
Balance as of December 31, 2022 . . . . . . . . . . . . . . . . . . . . . . . . . . . . . . . . . . . . . . . . . . . . 866,018 $ 113.40
Expected to vest as of December 31, 2022 . . . . . . . . . . . . . . . . . . . . . . . . . . . . . . . . . . . . . 904,410 $ 112.52
Shares
Outstanding
Weighted
Average
Grant Price
The shares granted above include 66,184 performance restricted stock unit awards. These performance grants are the
number of shares that would be earned at the target level of performance. The number of shares of Polaris common stock
that could actually be delivered at the end of the three-year performance period for performance restricted stock units
may be anywhere from 0% to 200% of target for each performance share, depending on the performance of the Company
during such performance period.
The total intrinsic value of restricted stock expected to vest as of December 31, 2022 was $91.3 million. The total
intrinsic value is based on the Company’s closing stock price on the last trading day of the year. The weighted average
fair values at the grant dates of grants awarded under the Omnibus Plan for the years ended December 31, 2022, 2021
and 2020 were $119.42, $122.08 and $92.23, respectively.
Note 6. Employee Savings Plans
Employee Stock Ownership Plan (ESOP). The Company sponsors a qualified non-leveraged ESOP under which a
maximum of 7,700,000 shares of common stock can be awarded. The shares are allocated to eligible participants’
accounts based on total cash compensation earned during the calendar year. An employee’s ESOP account vests equally
after two and three years of service and requires no cash payments from the recipient. Participants may instruct the
Company to pay respective dividends directly to the participant in cash or reinvest the dividends into the participants’
ESOP accounts. Employees who meet eligibility requirements can participate in the ESOP. Participants that meet certain
age and service requirements are allowed to transfer balances, subject to limitation, to the Polaris 401(k) Retirement
Savings Plan and thus diversify their investments. Total expense related to the ESOP was $14.6 million, $13.9 million
and $12.3 million, in 2022, 2021 and 2020, respectively. As of December 31, 2022, there were 2,949,000 shares held in
the plan.
58

Defined contribution plans. The Company sponsors a 401(k) defined contribution retirement plan covering substantially
all U.S. employees. The Company matches 100 percent of employee contributions up to a maximum of five percent of
eligible compensation. All contributions vest immediately. The cost of the defined contribution retirement plan was
$26.4 million, $24.9 million, and $22.5 million, in 2022, 2021 and 2020, respectively.
Supplemental Executive Retirement Plan (SERP). The Company sponsors a SERP that provides executive officers of the
Company an alternative to defer portions of their salary, cash incentive compensation, and Company matching
contributions. The deferrals and contributions are held in a rabbi trust and are in funds to match the liabilities of the plan.
The assets are recorded as trading assets. The assets of the rabbi trust are included in other long-term assets in the
consolidated balance sheets and the SERP liability is included in other long-term liabilities in the consolidated balance
sheets. The asset and liability balances are both $39.8 million and $52.4 million as of December 31, 2022, and 2021,
respectively.
Executive officers and directors of the Company have the opportunity to defer certain restricted stock units. These
restricted stock units are redeemable in Polaris common stock or in cash. After a holding period, the executive officer has
the option to diversify the vested award into other funds available under the SERP. If the award is diversified, it must be
redeemed in cash. Awards probable of vesting, for which the executive has not yet made an election to defer, and awards
that have been deferred but have not yet vested and are probable of vesting are reported as deferred compensation in the
temporary equity section of the consolidated balance sheets, as these awards have redemption features that are not yet
solely within the control of the Company. The awards recorded in temporary equity are recognized at fair value as
though the reporting date is also the redemption date, with any difference from stock-based compensation recorded in
retained earnings. As of December 31, 2022, 124,505 shares are recorded at a fair value of $12.6 million in temporary
equity, which includes $12.5 million of compensation cost and $0.1 million of cumulative fair value adjustment recorded
through retained earnings.
Note 7. Financing Agreement
The carrying value of debt, finance lease obligations, and notes payable and the average related interest rates were as
follows (in millions):
Average interest rate as
of December 31, 2022 Maturity December 31, 2022 December 31, 2021
Revolving loan facility . . . . . . . . . . . . 5.10% June 2026 $ 312.9 $ —
Term loan facility . . . . . . . . . . . . . . . . 5.67% June 2026 828.0 876.0
Incremental term loan . . . . . . . . . . . . . 5.67% December 2023 500.0 500.0
Senior notes—fixed rate . . . . . . . . . . . 4.23% July 2028 350.0 350.0
Finance lease obligations . . . . . . . . . . 5.21% Various through 2029 11.4 13.5
Notes payable and other . . . . . . . . . . . 4.25% Various through 2030 61.4 68.3
Debt issuance costs . . . . . . . . . . . . . . . . . . . . . . . . . . . . . . . . . . . . . . . . . . . . . . . . . . . . (5.9) (7.1)
Total debt, finance lease obligations, and notes payable . . . . . . . . . . . . . . . . . . . . . . . . $ 2,057.8 $ 1,800.7
Less: current maturities . . . . . . . . . . . . . . . . . . . . . . . . . . . . . . . . . . . . . . . . . . . . . . . . . 553.6 553.3
Total long-term debt, finance lease obligations, and notes payable . . . . . . . . . . . . . . . $ 1,504.2 $ 1,247.4
In December 2010, the Company entered an unsecured Master Note Purchase Agreement, which has been amended and
supplemented, under which it has issued senior notes. In July 2018, the Company issued $350 million of unsecured
senior notes due July 2028 which remain outstanding.
The Company maintains an unsecured credit facility which consists of a term loan facility (the “Term Loan Facility”)
and a revolving loan facility (the “Revolving Loan Facility”). In July 2018, the Company amended its unsecured credit
facility to increase its Term Loan Facility to $1,180 million, of which $828.0 million was outstanding as of
December 31, 2022. In June 2021, the Company further amended its unsecured credit facility to increase its Revolving
Loan Facility to $1.0 billion, of which $312.9 million was outstanding as of December 31, 2022, and extend the maturity
date to June 2026. In December 2022, the Company further amended its unsecured credit facility to change its
benchmark base interest rate. Interest is charged at rates based on adjusted Term SOFR.
59

In December 2021, the Company amended the credit facility to provide an unsecured incremental 364-day term loan (the
“Incremental Term Loan”) in the amount of $500 million, which was fully drawn on closing. In December 2022, the
Company further amended its unsecured credit facility to extend the maturity date of the Incremental Term Loan to
December 15, 2023. There are no required principal payments prior to the maturity date. In addition to the payment of
the $500 million Incremental Term Loan, the Company is required to make principal payments under the Term Loan
Facility totaling $45 million over the next 12 months. These payments are classified as current maturities in the
consolidated balance sheets.
The credit agreements governing the facility and the Master Note Purchase Agreement contain covenants that require the
Company to maintain certain financial ratios, including minimum interest coverage and maximum leverage ratios. The
agreements require the Company to maintain an interest coverage ratio of not less than 3.00 to 1.00 and a leverage ratio
of not more than 3.50 to 1.00 on a rolling four quarter basis. The Company was in compliance with all such covenants as
of December 31, 2022.
Debt issuance costs are recognized as a reduction in the carrying value of the related long-term debt in the consolidated
balance sheets and are being amortized to interest expense in the consolidated statements of income over the expected
remaining terms of the related debt.
On July 2, 2018, pursuant to the Agreement and Plan of Merger dated May 29, 2018, the Company completed the
acquisition of Boat Holdings, LLC, a privately held Delaware limited liability company, headquartered in Elkhart,
Indiana which manufactures boats (“Boat Holdings”). As a component of the Boat Holdings merger agreement, the
Company has committed to make a series of deferred payments to the former owners following the closing date of the
merger through July 2030. The original discounted payable was for $76.7 million, of which $55.3 million was
outstanding as of December 31, 2022. The outstanding balance is included in long-term debt and current portion of long-
term debt in the consolidated balance sheets.
The following summarizes activity under the Company’s credit arrangements (in millions):
Total borrowings as of December 31 . . . . . . . . . . . . . . . . . . . . . . . . . . . $ 1,990.9 $ 1,726.0 $ 1,365.0
Average outstanding borrowings during year . . . . . . . . . . . . . . . . . . . . $ 2,074.9 $ 1,500.4 $ 1,879.7
Maximum outstanding borrowings during year . . . . . . . . . . . . . . . . . . . $ 2,300.0 $ 1,903.0 $ 2,370.6
Weighted-average interest rate as of December 31 . . . . . . . . . . . . . . . . 5.33 % 1.77 % 2.30 %
2022 2021 2020
As of December 31, 2022, the Company had open letters of credit totaling $38.5 million. The amounts are primarily
related to inventory purchases and are reduced as the purchases are received.
Note 8. Goodwill and Other Intangible Assets
Goodwill and other intangible assets, net of accumulated amortization, as of December 31, 2022 and 2021 are as follows
(in millions):
2022 2021
Goodwill . . . . . . . . . . . . . . . . . . . . . . . . . . . . . . . . . . . . . . . . . . . . . . . . . . . . . . . . . . . . . . . $ 386.2 $ 391.3
Other intangible assets, net . . . . . . . . . . . . . . . . . . . . . . . . . . . . . . . . . . . . . . . . . . . . . . . . . 524.4 543.9
Total goodwill and other intangible assets, net . . . . . . . . . . . . . . . . . . . . . . . . . . . . . . . . . . $ 910.6 $ 935.2
There were no material additions to goodwill and other intangible assets in 2022 and 2021. The changes in the carrying
amount of goodwill by reportable segment for the years ended December 31, 2022 and 2021 were as follows (in
60

millions):
Balance as of December 31, 2020 . . . . . . . . . . . . . . . . . . $ 111.6 $ 58.6 $ 227.1 $ 397.3
Currency translation effect on foreign goodwill balances 0.1 (6.1) — (6.0)
Balance as of December 31, 2021 . . . . . . . . . . . . . . . . . . $ 111.7 $ 52.5 $ 227.1 $ 391.3
Currency translation effect on foreign goodwill balances (1.0) (4.1) — (5.1)
Balance as of December 31, 2022 . . . . . . . . . . . . . . . . . . $ 110.7 $ 48.4 $ 227.1 $ 386.2
Off Road On Road Marine Total
During 2020, the Company recorded impairment charges of $270.3 million related to goodwill of the Company’s
Aftermarket reporting segment. As part of the Company’s segment reorganization in the second quarter of 2022, the
Aftermarket segment was eliminated and historical goodwill impairments of $60.8 million and $20.3 million were
allocated to the Off Road and On Road segments, respectively, on a relative fair value basis. The goodwill amounts
above are shown net of these impairment charges.
For other intangible assets, the changes in the net carrying amount for the years ended December 31, 2022 and 2021 are
as follows (in millions):
Gross
Amount
Accumulated
Amortization
Gross
Amount
Accumulated
Amortization
Other intangible assets, beginning . . . . . . . . . . . . . . . . . $ 618.7 $ (74.8) $ 645.7 $ (72.6)
Intangible assets disposed of during the period . . . . . . . . (13.4) 13.4 (25.8) 20.7
Amortization expense . . . . . . . . . . . . . . . . . . . . . . . . . . — (18.8) — (22.9)
Currency translation effect on foreign balances . . . . . . . . (0.9) 0.2 (1.2) —
Other intangible assets, ending . . . . . . . . . . . . . . . . . . . $ 604.4 $ (80.0) $ 618.7 $ (74.8)
2022 2021
The components of other intangible assets were as follows (in millions):
Dealer/customer related . . . . . . . . . . . . . . . . . . . . . . 19 341.7 (80.0) 261.7
Total amortizable . . . . . . . . . . . . . . . . . . . . . . . . . . . 19 341.7 (80.0) 261.7
Non-amortizable—brand/trade names . . . . . . . . . . . 262.7 — 262.7
Total other intangible assets, net . . . . . . . . . . . . . . . . $ 604.4 $ (80.0) $ 524.4
December 31, 2021
Weighted-average
useful life (years)
Gross Carrying
Amount
Accumulated
Amortization Net
Non-compete agreements . . . . . . . . . . . . . . . . . . . . . . . 4 $ 2.6 $ (2.3) $ 0.3
Dealer/customer related . . . . . . . . . . . . . . . . . . . . . . 19 349.7 (69.7) 280.0
Developed technology . . . . . . . . . . . . . . . . . . . . . . . 7 2.9 (2.8) 0.1
Total amortizable . . . . . . . . . . . . . . . . . . . . . . . . . . . 19 355.2 (74.8) 280.4
Non-amortizable—brand/trade names . . . . . . . . . . . 263.5 — 263.5
Total other intangible assets, net . . . . . . . . . . . . . . . . $ 618.7 $ (74.8) $ 543.9
December 31, 2022
Weighted-average
useful life (years)
Gross Carrying
Amount
Accumulated
Amortization Net
Amortization expense for intangible assets for the year ended December 31, 2022, 2021, and 2020 was $18.8 million,
$22.9 million, and $24.4 million, respectively. Estimated future amortization expense for identifiable intangible assets
during the next five years is as follows (in millions):
2023 2024 2025 2026 2027
Estimated amortization expense . . . . . . . $ 17.7 $ 17.7 $ 17.7 $ 17.7 $ 17.7
The preceding expected amortization expense is an estimate and actual amounts could differ due to additional intangible
asset acquisitions, changes in foreign currency rates, or impairments of intangible assets.
61

Note 9. Income Taxes
The Company’s income from continuing operations before income taxes consisted of the following (in millions):
2022 2021 2020
United States . . . . . . . . . . . . . . . . . . . . . . . . . . . . . . . . . . . . . . . . . . . . . $ 608.4 $ 495.4 $ 382.0
Foreign . . . . . . . . . . . . . . . . . . . . . . . . . . . . . . . . . . . . . . . . . . . . . . . . . . 153.0 133.3 68.4
Income from continuing operations before income taxes . . . . . . . . . . . $ 761.4 $ 628.7 $ 450.4
For the Years Ended December 31,
The provision for income taxes consisted of the following (in millions):
2022 2021 2020
Current:
Federal . . . . . . . . . . . . . . . . . . . . . . . . . . . . . . . . . . . . . . . . . . . . . $ 145.4 $ 74.1 $ 119.1
State . . . . . . . . . . . . . . . . . . . . . . . . . . . . . . . . . . . . . . . . . . . . . . . 25.9 17.0 24.3
Foreign . . . . . . . . . . . . . . . . . . . . . . . . . . . . . . . . . . . . . . . . . . . . . 41.5 29.0 26.8
Deferred . . . . . . . . . . . . . . . . . . . . . . . . . . . . . . . . . . . . . . . . . . . . . . . . . (54.8) 12.0 (80.3)
Total provision for income taxes . . . . . . . . . . . . . . . . . . . . . . . . . . . . . . . $ 158.0 $ 132.1 $ 89.9
For the Years Ended December 31,
Reconciliations of the federal statutory income tax rate to the Company’s effective tax rate were as follows:
2022 2021 2020
Federal statutory rate . . . . . . . . . . . . . . . . . . . . . . . . . . . . . . . . . . . . . . . 21.0 % 21.0 % 21.0 %
State income taxes, net of federal benefit . . . . . . . . . . . . . . . . . . . . . . . . 1.7 2.0 2.0
Domestic manufacturing deduction . . . . . . . . . . . . . . . . . . . . . . . . . . . . — — (0.8)
Research and development tax credit . . . . . . . . . . . . . . . . . . . . . . . . . . . (1.8) (3.4) (3.9)
Stock based compensation . . . . . . . . . . . . . . . . . . . . . . . . . . . . . . . . . . . . (0.3) (0.5) (0.1)
Valuation allowance . . . . . . . . . . . . . . . . . . . . . . . . . . . . . . . . . . . . . . . . . — — 0.5
Foreign tax rate differential . . . . . . . . . . . . . . . . . . . . . . . . . . . . . . . . . . . . 0.9 0.9 1.8
Foreign-derived intangible income . . . . . . . . . . . . . . . . . . . . . . . . . . . . . . (1.3) — —
Other permanent differences . . . . . . . . . . . . . . . . . . . . . . . . . . . . . . . . . 0.5 1.0 (0.5)
Effective income tax rate for continuing operations . . . . . . . . . . . . . . . . 20.7 % 21.0 % 20.0 %
For the Years Ended December 31,
Undistributed earnings relating to certain non-U.S. subsidiaries of approximately $453.4 million and $338.0 million as of
December 31, 2022 and 2021, respectively, are considered to be permanently reinvested. While these earnings would no
longer be subject to incremental U.S. tax, if the Company were to actually distribute these earnings, they could be subject
to additional foreign income taxes and/or withholding taxes payable to non-U.S. countries. Determination of the
unrecognized deferred foreign income tax liability related to these undistributed earnings is not practicable due to the
complexities associated with this hypothetical calculation.
62

The Company utilizes the liability method of accounting for income taxes whereby deferred taxes are determined based
on the estimated future tax effects of differences between the financial statement and tax bases of assets and liabilities
given the provisions of enacted tax laws. The net deferred income taxes consist of the following (in millions):
2022 2021
Deferred income taxes:
Inventories . . . . . . . . . . . . . . . . . . . . . . . . . . . . . . . . . . . . . . . . . . . . . . . . . . . . . . . $ 87.2 $ 73.6
Accrued expenses and other . . . . . . . . . . . . . . . . . . . . . . . . . . . . . . . . . . . . . . . . . . . 125.5 105.0
Cost in excess of net assets of businesses acquired . . . . . . . . . . . . . . . . . . . . . . . . (44.1) 24.5
Capitalized research expenditures . . . . . . . . . . . . . . . . . . . . . . . . . . . . . . . . . . . . . . . 83.3 —
Property and equipment . . . . . . . . . . . . . . . . . . . . . . . . . . . . . . . . . . . . . . . . . . . . . (93.4) (101.2)
Operating lease assets . . . . . . . . . . . . . . . . . . . . . . . . . . . . . . . . . . . . . . . . . . . . . . . . (29.2) (40.1)
Operating lease liabilities . . . . . . . . . . . . . . . . . . . . . . . . . . . . . . . . . . . . . . . . . . . . . 29.2 40.5
Employee compensation and benefits . . . . . . . . . . . . . . . . . . . . . . . . . . . . . . . . . . . . 42.1 49.3
Net operating loss and other loss carryforwards . . . . . . . . . . . . . . . . . . . . . . . . . . . . 21.9 22.8
Valuation allowance . . . . . . . . . . . . . . . . . . . . . . . . . . . . . . . . . . . . . . . . . . . . . . . . (16.6) (17.0)
Total net deferred income tax asset . . . . . . . . . . . . . . . . . . . . . . . . . . . . . . . . . . . . . . . . . . . $ 205.9 $ 157.4
As of December 31,
As of December 31, 2022, the Company had available unused international and acquired federal net operating loss
carryforwards of $54.6 million. The net operating loss carryforwards will expire at various dates from 2024 to 2030, with
certain jurisdictions having indefinite carryforward terms.
The Company classified liabilities related to unrecognized tax benefits as long-term income taxes payable in the
consolidated balance sheets. The Company recognizes potential interest and penalties related to income tax positions as a
component of the provision for income taxes in the consolidated statements of income. Reserves related to potential
interest are recorded as a component of long-term income taxes payable. The federal benefit of state taxes and interest
related to the reserves is recorded as a component of deferred taxes. The entire balance of unrecognized tax benefits as of
December 31, 2022, if recognized, would affect the Company’s effective tax rate. The Company does not anticipate that
total unrecognized tax benefits will materially change in the next twelve months. Tax years 2017 through 2022 remain
open to examination by certain tax jurisdictions to which the Company is subject.
Reconciliations of the beginning and ending unrecognized tax benefits were as follows (in millions):
2022 2021
Balance as of January 1, . . . . . . . . . . . . . . . . . . . . . . . . . . . . . . . . . . . . . . . . . . . . . . . . . $ 12.4 $ 13.2
Gross increases for tax positions of prior years . . . . . . . . . . . . . . . . . . . . . . . . . . . . . . . . — 0.4
Gross increases for tax positions of current year . . . . . . . . . . . . . . . . . . . . . . . . . . . . . . . 2.4 2.7
Decreases due to settlements and other prior year tax positions . . . . . . . . . . . . . . . . . . . (0.6) (1.7)
Decreases for lapse of statute of limitations . . . . . . . . . . . . . . . . . . . . . . . . . . . . . . . . . . (3.3) (2.2)
Balance as of December 31, . . . . . . . . . . . . . . . . . . . . . . . . . . . . . . . . . . . . . . . . . . . . . . 10.9 12.4
Reserves related to potential interest and penalties as of December 31, . . . . . . . . . . . . . . 0.8 0.9
Unrecognized tax benefits as of December 31, . . . . . . . . . . . . . . . . . . . . . . . . . . . . . . . . . $ 11.7 $ 13.3
For the Years Ended December 31,
63

Note 10. Shareholders’ Equity
Stock repurchase program. The Company has made the following share repurchases (in millions):
For the Years Ended December 31,
2022 2021 2020
Total number of shares repurchased and retired . . . . . . . . . . . . . . . . . . . . 4.4 3.8 0.6
Total investment . . . . . . . . . . . . . . . . . . . . . . . . . . . . . . . . . . . . . . . . . . . . . $ 505.0 $ 461.6 $ 50.3
As of December 31, 2022, the Polaris Board of Directors has authorized the Company to repurchase up to an additional
$349.1 million of the Company’s common stock. The repurchase of any shares will be dependent on management’s
assessment of market conditions.
Stock purchase plan. The Company maintains an employee stock purchase plan (“Purchase Plan”). A total of 3.0
million shares of common stock are reserved for this plan. The Purchase Plan permits eligible employees to purchase
common stock monthly at 95 percent of the average of the beginning and end of month stock prices. As of December 31,
2022, approximately 1.6 million shares had been purchased under the Purchase Plan.
Dividends. Quarterly and total year cash dividends declared per common share for the years ended December 31, 2022,
2021, and 2020 were as follows:
For the Years Ended December 31,
2022 2021 2020
Quarterly dividend declared and paid per common share . . . . . . . . . . . . . $ 0.64 $ 0.63 $ 0.62
Total dividends declared and paid per common share . . . . . . . . . . . . . . . . $ 2.56 $ 2.52 $ 2.48
On February 2, 2023, the Polaris Board of Directors declared a regular cash dividend of $0.65 per share payable on
March 15, 2023 to holders of record of such shares at the close of business on March 1, 2023.
Net income per share. Basic net income per share was computed by dividing net income available to common
shareholders by the weighted average number of common shares outstanding during each period, including shares earned
under The Deferred Compensation Plan for Directors (“Director Plan”) and the ESOP and deferred stock units under the
2007 Omnibus Incentive Plan (“Omnibus Plan”). Diluted net income per share was computed under the treasury stock
method and was calculated to compute the dilutive effect of outstanding stock options and certain share-based awards
issued under the Omnibus Plan.
Reconciliations of these amounts are as follows (in millions):
2022 2021 2020
Weighted average number of common shares outstanding . . . . . . . . . . . 58.9 61.0 61.5
Director Plan and deferred stock units . . . . . . . . . . . . . . . . . . . . . . . . . . 0.2 0.2 0.2
ESOP . . . . . . . . . . . . . . . . . . . . . . . . . . . . . . . . . . . . . . . . . . . . . . . . . . . . 0.2 0.1 0.2
Common shares outstanding—basic . . . . . . . . . . . . . . . . . . . . . . . . . . . . 59.3 61.3 61.9
Dilutive effect of restricted stock awards . . . . . . . . . . . . . . . . . . . . . . . . . . 0.4 0.7 0.5
Dilutive effect of stock option awards . . . . . . . . . . . . . . . . . . . . . . . . . . . . 0.4 0.7 0.2
Common and potential common shares outstanding—diluted . . . . . . . . 60.1 62.7 62.6
For the Years Ended December 31,
During 2022, 2021 and 2020, the number of options that were not included in the computation of diluted net income per
share because the option exercise price was greater than the market price, and therefore, the effect would have been anti-
dilutive, was 1.6 million, 0.9 million and 4.4 million, respectively.
64

Accumulated other comprehensive loss. Changes in the accumulated other comprehensive loss balance were as follows
(in millions):
Balance as of December 31, 2021 . . . . . . . . . $ (69.5) $ (4.4) $ (3.5) $ (77.4)
Reclassification to the statement of income . — (15.0) 0.3 (14.7)
Change in fair value . . . . . . . . . . . . . . . . . . (25.3) 29.9 — 4.6
Balance as of December 31, 2022 . . . . . . . . . $ (94.8) $ 10.5 $ (3.2) $ (87.5)
Foreign Currency
Translation
Cash Flow
Hedging Derivatives
Retirement Plan
Activity
Accumulated Other
Comprehensive Loss
The table below provides the amount of gains and losses, net of tax, reclassified from accumulated other comprehensive
loss into the income statement for cash flow derivatives designated as hedging instruments and retirement plan activity
for the years ended December 31, 2022 and 2021 (in millions):
Derivatives in Cash Flow Hedging Relationships
and Other Activity
Location of Gain (Loss) Reclassified from
Accumulated OCI into Income
For the Years Ended December 31,
2022 2021
Foreign currency contracts . . . . . . . . . . . . Other (income) expense, net . . . . . . . . . . . $ 12.2 $ (0.3)
Foreign currency contracts . . . . . . . . . . . . Cost of sales . . . . . . . . . . . . . . . . . . . . . . . . 2.1 0.5
Interest rate contracts . . . . . . . . . . . . . . . . . Interest expense . . . . . . . . . . . . . . . . . . . . . 1.0 (8.1)
Other activity . . . . . . . . . . . . . . . . . . . . . . . Cost of sales / operating expenses . . . . . . . (0.6) (0.3)
Total . . . . . . . . . . . . . . . . . . . . . . . . . . . . . . . . . . . . . . . . . . . . . . . . . . . . . . . . . . . . . . . . . $ 14.7 $ (8.2)
The net amount of the existing gains or losses as of December 31, 2022 that are expected to be reclassified into the
statements of income within the next 12 months is not expected to be material. See Note 15 for additional information
regarding hedging activities.
Note 11. Financial Services Arrangements
Polaris Acceptance, a joint venture between the Company and Wells Fargo Commercial Distribution Finance
Corporation, a direct subsidiary of Wells Fargo Bank, N.A. (“Wells Fargo”), which is supported by a partnership
agreement between their respective wholly owned subsidiaries, finances substantially all of the Company’s United States
sales of ORVs, snowmobiles, motorcycles, and related PG&A, whereby the Company receives payment within a few
days of shipment of the product.
The Company’s subsidiary has a 50 percent equity interest in Polaris Acceptance. Polaris Acceptance may sell its
receivable portfolio to a securitization facility (the “Securitization Facility”) arranged by Wells Fargo. The sale of
receivables from Polaris Acceptance to the Securitization Facility is accounted for in Polaris Acceptance’s financial
statements as a “true-sale” under ASC Topic 860. The Company’s allocable share of the income of Polaris Acceptance
has been included as a component of income from financial services in the consolidated statements of income. The
partnership agreement is effective through February 2027.
The Company’s total investment in Polaris Acceptance of $93.1 million as of December 31, 2022 is accounted for under
the equity method and is recorded in investment in finance affiliate in the consolidated balance sheets. As of
December 31, 2022, the outstanding amount of net receivables financed for dealers under this arrangement was
$1,314.2 million, all of which was included in the Polaris Acceptance portfolio.
The Company has agreed to repurchase products repossessed by Polaris Acceptance up to an annual maximum of 15
percent of the aggregate average month-end outstanding Polaris Acceptance receivables and Securitized Receivables
during the prior calendar year. For calendar year 2022, the potential 15 percent aggregate repurchase obligation was
approximately $69.2 million.
65

Summarized financial information for Polaris Acceptance reflecting the effects of the Securitization Facility are as
follows (in millions):
2022 2021 2020
Revenues . . . . . . . . . . . . . . . . . . . . . . . . . . . . . . . . . . . . . . . . . . . . . . . . $ 49.7 $ 21.9 $ 44.7
Interest and operating expenses . . . . . . . . . . . . . . . . . . . . . . . . . . . . . . . 19.5 6.6 7.6
Net income . . . . . . . . . . . . . . . . . . . . . . . . . . . . . . . . . . . . . . . . . . . . . . . $ 30.2 $ 15.3 $ 37.1
For the Years Ended December 31,
2022 2021
Finance receivables, net . . . . . . . . . . . . . . . . . . . . . . . . . . . . . . . . . . . . . . . . . . . . . . . . . . $ 1,314.2 $ 470.7
Other assets . . . . . . . . . . . . . . . . . . . . . . . . . . . . . . . . . . . . . . . . . . . . . . . . . . . . . . . . . . . 20.9 29.1
Total assets . . . . . . . . . . . . . . . . . . . . . . . . . . . . . . . . . . . . . . . . . . . . . . . . . . . . . . . $ 1,335.1 $ 499.8
Notes payable . . . . . . . . . . . . . . . . . . . . . . . . . . . . . . . . . . . . . . . . . . . . . . . . . . . . . . . . . . . $ 1,076.0 $ 366.9
Other liabilities . . . . . . . . . . . . . . . . . . . . . . . . . . . . . . . . . . . . . . . . . . . . . . . . . . . . . . . . 73.0 34.4
Partners’ capital . . . . . . . . . . . . . . . . . . . . . . . . . . . . . . . . . . . . . . . . . . . . . . . . . . . . . . . . 186.1 98.5
Total liabilities and partners’ capital . . . . . . . . . . . . . . . . . . . . . . . . . . . . . . . . . . . $ 1,335.1 $ 499.8
As of December 31,
A subsidiary of Huntington Bancshares Incorporated (“Huntington”) finances a portion of the Company’s United States
sales of boats whereby the Company receives payment within a few days of shipment of the product. The Company has
agreed to repurchase products repossessed by Huntington up to a maximum of 100 percent of the aggregate outstanding
Huntington receivables balance. As of December 31, 2022, the potential aggregate repurchase obligation was
approximately $322.5 million.
The Company has other financing arrangements related to its foreign subsidiaries in which it has agreed to repurchase
repossessed products. For calendar year 2022, the potential aggregate repurchase obligations were approximately
$21.8 million.
The Company’s financial exposure under these repurchase agreements is limited to the difference between the amounts
unpaid by the dealer or distributor with respect to the repossessed product plus costs of repossession and the amount
received on the resale of the repossessed product. No material losses have been incurred under this agreement during the
periods presented.
The amount financed worldwide by dealers under arrangements with finance companies as of December 31, 2022 was
approximately $1,893.9 million. As a part of its marketing program, the Company contributes to the cost of dealer
financing up to certain limits and subject to certain conditions. Such expenditures are presented as a reduction of sales in
the consolidated statements of income.
The Company has agreements with third-party financing companies to provide financing options to end consumers of the
Company’s products. The Company has no material contingent liabilities for residual value or credit collection risk under
these agreements. The Company’s income generated from these agreements has been included as a component of income
from financial services in the consolidated statements of income.
Note 12. Investment in Other Affiliates
The Company has certain strategic investments in nonmarketable securities of other companies. The Company had
$50.3 million and $23.0 million of such investments as of December 31, 2022 and 2021, respectively. These investments
are recorded as a component of other long-term assets in the consolidated balance sheets.
The Company impairs an investment and recognize a loss if and when events or circumstances indicate there is
impairment in the investment that is other-than-temporary. The Company evaluates investments in nonmarketable
securities for impairment utilizing level 3 fair value inputs. The Company recorded a $7.7 million impairment associated
with a strategic investment during 2021. The impairment was recorded within other (income) expense, net in the
consolidated statements of income.
66

Note 13. Leases
Information on the Company’s leases is summarized as follows (in millions):
As of December 31,
Classification
2022 2021
Assets
Operating lease assets . . . . . . . Operating lease assets . . . . . . . . . . . . . . . . . . . . . . . . . . . $ 111.0 $ 90.5
Finance lease assets . . . . . . . . . Property and equipment, net
(1)
. . . . . . . . . . . . . . . . . . . . 7.4 9.3
Total leased assets . . . . . . . . . . . . . . . . . . . . . . . . . . . . . . . . . . . . . . . . . . . . . . . . . . . . . . . . $ 118.4 $ 99.8
Liabilities
Current
Operating lease liabilities . . . Current operating lease liabilities . . . . . . . . . . . . . . . . . . $ 24.1 $ 19.4
Finance lease liabilities . . . . . Current portion of debt, finance lease obligations and
notes payable . . . . . . . . . . . . . . . . . . . . . . . . . . . . . . . . .
1.5 1.4
Long-term
Operating lease liabilities . . . Long-term operating lease liabilities . . . . . . . . . . . . . . . 87.0 71.3
Finance lease liabilities . . . . . Finance lease obligations . . . . . . . . . . . . . . . . . . . . . . . . 9.9 12.1
Total lease liabilities . . . . . . . . . . . . . . . . . . . . . . . . . . . . . . . . . . . . . . . . . . . . . . . . . . . . . . $ 122.5 $ 104.2
(1)
Finance lease assets are recorded net of accumulated amortization of $10.4 million and $10.0 million as of
December 31, 2022 and 2021, respectively.
For the Year Ended December 31,
Lease Cost Classification
2022 2021
Operating lease cost
(1)
. . . . . . . . . . Operating expenses and cost of sales . . . . . . . . . . . $ 40.0 $ 33.8
Finance lease cost
Amortization of leased assets . . . Operating expenses and cost of sales . . . . . . . . . . . 1.1 1.3
Interest on lease liabilities . . . . . .
Interest expense . . . . . . . . . . . . . . . . . . . . . . . . . . . . . .
0.7 0.7
Sublease income . . . . . . . . . . . . . . . Other (income) expense, net . . . . . . . . . . . . . . . . . . — (0.6)
Total lease cost . . . . . . . . . . . . . . . . . . . . . . . . . . . . . . . . . . . . . . . . . . . . . . . . . . . . . . . . . . $ 41.8 $ 35.2
(1)
Includes short-term leases and variable lease costs, which are immaterial.
2023 . . . . . . . . . . . . . . . . . . . . . . . . . . . . . . . . . . . . . . . . . . . . $ 26.5 $ 2.0 $ 28.5
2024 . . . . . . . . . . . . . . . . . . . . . . . . . . . . . . . . . . . . . . . . . . . . 21.3 2.0 23.3
2025 . . . . . . . . . . . . . . . . . . . . . . . . . . . . . . . . . . . . . . . . . . . . 17.1 2.0 19.1
2026 . . . . . . . . . . . . . . . . . . . . . . . . . . . . . . . . . . . . . . . . . . . . 14.7 2.0 16.7
2027 . . . . . . . . . . . . . . . . . . . . . . . . . . . . . . . . . . . . . . . . . . . . 10.5 2.1 12.6
Thereafter . . . . . . . . . . . . . . . . . . . . . . . . . . . . . . . . . . . . . . . . 30.1 3.4 33.5
Total lease payments . . . . . . . . . . . . . . . . . . . . . . . . . . . . . . . . $ 120.2 $ 13.5 $ 133.7
Less: interest . . . . . . . . . . . . . . . . . . . . . . . . . . . . . . . . . . . . 9.1 2.1
Present value of lease payments . . . . . . . . . . . . . . . . . . . . . . . $ 111.1 $ 11.4
Maturity of Lease Liabilities Operating Leases
(1)
Finance Leases Total
(1)
Operating lease payments exclude $8.3 million of legally binding minimum lease payments for leases signed but not
yet commenced. There were no options to extend lease terms that were reasonably certain of being exercised as of
December 31, 2022.
67

As of December 31,
Lease Term and Discount Rate
2022 2021
Weighted-average remaining lease term (years)
Operating leases . . . . . . . . . . . . . . . . . . . . . . . . . . . . . . . . . . . . . . . . . . . . . . . . . . . . . . . . 6.26 3.56
Finance leases . . . . . . . . . . . . . . . . . . . . . . . . . . . . . . . . . . . . . . . . . . . . . . . . . . . . . . . . . 6.54 7.49
Weighted-average discount rate
Operating leases . . . . . . . . . . . . . . . . . . . . . . . . . . . . . . . . . . . . . . . . . . . . . . . . . . . . . . . . 2.45 % 1.15 %
Finance leases . . . . . . . . . . . . . . . . . . . . . . . . . . . . . . . . . . . . . . . . . . . . . . . . . . . . . . . . . 5.21 % 5.17 %
For the Year Ended December 31,
Other Information
2022 2021
Cash paid for amounts included in the measurement of lease liabilities
Operating cash flows from operating leases . . . . . . . . . . . . . . . . . . . . . . . . . . . . . . . . . . $ 40.4 $ 33.8
Operating cash flows from finance leases . . . . . . . . . . . . . . . . . . . . . . . . . . . . . . . . . . . . 0.6 0.8
Financing cash flows from finance leases . . . . . . . . . . . . . . . . . . . . . . . . . . . . . . . . . . . . 1.4 1.5
Leased assets obtained in exchange for new operating lease liabilities . . . . . . . . . . . . . . . 52.8 82.0
Note 14. Commitments and Contingencies
Product liability. The Company is subject to product liability claims in the normal course of business. In 2012, the
Company began purchasing excess insurance coverage for product liability claims. The Company self-insures product
liability claims before the policy date and up to the purchased insurance coverage after the policy date. The estimated
costs resulting from any losses are charged to operating expenses when it is probable a loss has been incurred and the
amount of the loss is reasonably estimable. The Company utilizes historical trends and actuarial analysis, along with an
analysis of current claims, to assist in determining the appropriate loss reserve levels. As of December 31, 2022 and
2021, the Company had an accrual of $107.5 million and $70.3 million, respectively, for the probable payment of
pending claims related to product liability litigation associated with the Company’s products. This accrual is included as
a component of other accrued expenses in the consolidated balance sheets.
Litigation. The Company is a defendant in lawsuits and subject to other claims arising in the normal course of business,
including matters related to intellectual property, commercial matters, employment, and product liability claims. In
addition, as of December 31, 2022, the Company is party to putative class actions pending against the Company in the
United States which are described in more detail in Part I, Item 3 – Legal Proceedings. The Company is unable to
provide an evaluation of the likelihood that a loss will be incurred or an estimate of the range of possible loss on the
putative class actions.
In the opinion of management, it is presently unlikely that any legal proceedings pending against or involving the
Company will have a material adverse effect on the Company’s financial position, results of operations, or cash flows.
However, in many of these matters, it is inherently difficult to determine whether a loss is probable or reasonably
possible or to estimate the size or range of the possible loss given the variety and potential outcomes of actual and
potential claims, the uncertainty of future rulings, the behavior or incentives of adverse parties, and other factors outside
the control of the Company. Accordingly, the Company’s loss reserve may change from time to time, and actual losses
could exceed the amounts accrued by an amount that could be material to the Company’s consolidated financial position,
results of operations, or cash flows in any particular reporting period.
Regulatory. In the normal course of business, the Company’s products are subject to extensive laws and regulations
relating to safety, environmental and other regulations promulgated by the United States federal government and
individual states, as well as international regulatory authorities. Failure to comply with applicable regulations could
result in fines, penalties or other costs.
Note 15. Derivative Instruments and Hedging Activities
The Company is exposed to certain risks relating to its ongoing business operations. The primary risks managed by using
derivative instruments are foreign currency risk, interest rate risk, and commodity price fluctuations. Derivative contracts
68

on various currencies are entered into in order to manage foreign currency exposures associated with certain product
sourcing activities and intercompany cash flows. Interest rate swaps are entered into in order to maintain a balanced risk
of fixed and floating interest rates associated with the Company’s debt. Commodity hedging contracts are entered into in
order to manage fluctuating market prices of certain purchased commodities and raw materials that are integrated into the
Company’s end products.
The Company’s foreign currency management objective is to mitigate the potential impact of currency fluctuations on
the value of its U.S. dollar cash flows and to reduce the variability of certain cash flows at the subsidiary level. The
Company actively manages certain forecasted foreign currency exposures and uses a centralized currency management
operation to take advantage of potential opportunities to naturally offset foreign currency exposures. The decision of
whether and when to execute derivative instruments, along with the duration of the instrument, may vary from period to
period depending on market conditions, the relative costs of the instruments and capacity to hedge. The duration is linked
to the timing of the underlying exposure, with the connection between the two being regularly monitored. The Company
does not use any financial contracts for trading purposes. The Company’s open foreign currency contracts, with
maturities through December 2023, met the criteria for cash flow hedges.
As of December 31, 2022 and 2021, the Company had the following open foreign currency contracts (in millions):
December 31, 2022 December 31, 2021
Foreign Currency
Notional Amounts
(in U.S. dollars)
Net Unrealized
Gain (Loss)
Notional Amounts
(in U.S. dollars)
Net Unrealized
Gain (Loss)
Australian Dollar . . . . . . . . . . . . . . . . . . . . . . . . $ 13.7 $ 0.2 $ 20.3 $ 0.4
Canadian Dollar . . . . . . . . . . . . . . . . . . . . . . . . . 93.3 2.5 121.1 0.6
Mexican Peso . . . . . . . . . . . . . . . . . . . . . . . . . . . 47.0 5.7 87.9 1.1
Total . . . . . . . . . . . . . . . . . . . . . . . . . . . . . . . . . . $ 154.0 $ 8.4 $ 229.3 $ 2.1
The Company enters into interest rate swap transactions to hedge the variable interest rate payments for the Term Loan
Facility. In connection with these transactions, the Company pays interest based upon a fixed rate and receives variable
rate interest payments based on adjusted Term SOFR. As of December 31, 2022 and 2021, the Company had outstanding
interest rate swaps with notional amounts of $550.0 million. These contracts, with maturities through February 2026, met
the criteria for cash flow hedges. As of December 31, 2022 and 2021, the net unrealized gain (loss) associated with these
swaps was $5.9 million and $(7.8) million, respectively.
The table below summarizes the carrying values of derivative instruments as of December 31, 2022 and 2021
(in millions):
Carrying Values of Derivative Instruments as of December 31, 2022
Fair Value—
Assets
Fair Value—
(Liabilities)
Derivative Net
Carrying Value
Derivatives designated as hedging instruments
Foreign exchange contracts . . . . . . . . . . . . . . . . . . . . . . . . . . $ 8.4 $ — $ 8.4
Interest rate contracts . . . . . . . . . . . . . . . . . . . . . . . . . . . . . . . 5.9 — 5.9
Total derivatives designated as hedging instruments . . . .
$ 14.3 $ — $ 14.3
69

Carrying Values of Derivative Instruments as of December 31, 2021
Fair Value—
Assets
Fair Value—
(Liabilities)
Derivative Net
Carrying Value
Derivatives designated as hedging instruments
Foreign exchange contracts . . . . . . . . . . . . . . . . . . . . . . . . . . $ 2.4 $ (0.3) $ 2.1
Interest rate contracts . . . . . . . . . . . . . . . . . . . . . . . . . . . . . . . — (7.8) (7.8)
Total derivatives designated as hedging instruments . . . .
$ 2.4 $ (8.1) $ (5.7)
Assets are included in prepaid expenses and other and liabilities are included in accrued expenses in the consolidated
balance sheets. Assets and liabilities are offset in the consolidated balance sheet if the right of offset exists. The
unrealized gains or losses, after tax, are recorded as a component of accumulated other comprehensive loss in
shareholders’ equity. Gains and losses on derivative instruments representing either hedge ineffectiveness or hedge
components excluded from the assessment of effectiveness are recognized currently in the consolidated statements of
income.
The amount of gains (losses), net of tax, related to the effective portion of derivative instruments designated as cash flow
hedges included in other comprehensive loss for the years ended December 31, 2022 and 2021 were $14.9 million and
$11.1 million, respectively.
See Note 10 for additional information about the amount of gains and losses, net of tax, reclassified from accumulated
other comprehensive loss into the statements of income for derivative instruments designated as hedging instruments.
The ineffective portion of foreign currency contracts was not material for the years ended December 31, 2022 and 2021.
Note 16. Segment Reporting
On January 1, 2022, the Company began management of its portfolio of businesses under a new basis as a result of the
divestiture of the GEM and Taylor-Dunn businesses. As a such, the Global Adjacent Markets segment was eliminated
and the results of the Company’s remaining businesses historically included within the Global Adjacent Markets segment
were reclassified to the Off Road and On Road segments. All historical segment results were reclassified for
comparability, including the divested businesses which are included in Corporate.
On June 30, 2022, the Company again began management of its portfolio of businesses under a new basis as a result of
the divestiture of TAP. As such, the Aftermarket segment was eliminated and the results of the Company’s remaining
aftermarket businesses historically included within the Aftermarket segment were reclassified to the Off Road and On
Road segments. All historical segment results were reclassified for comparability.
The Company’s reportable segments are based on the Company’s method of internal reporting and are comprised of
various product offerings that serve multiple end markets. These results are not necessarily indicative of the results of
operations that would have occurred had each segment been an independent, stand-alone entity during the periods
presented. The internal reporting of these operating segments is defined based, in part, on the reporting and review
process used by the Company’s Chief Executive Officer. The Company has three operating segments: 1) Off Road, 2)
On Road, and 3) Marine which are all reportable segments. The Corporate amounts include revenues and costs of
businesses that were divested in 2021, as well as costs that are not allocated to segments, including certain unallocated
manufacturing costs. Businesses that are presented as discontinued operations are excluded from the table below.
70

Segment sales and gross profit data is summarized as follows (in millions):
For the Years Ended December 31,
2022 2021 2020
Sales
Off Road . . . . . . . . . . . . . . . . . . . . . . . . . . . . . . . . . . . . . . . . . . . $ 6,436.2 $ 5,574.6 $ 4,810.0
On Road . . . . . . . . . . . . . . . . . . . . . . . . . . . . . . . . . . . . . . . . . . . . 1,163.4 1,031.8 806.7
Marine . . . . . . . . . . . . . . . . . . . . . . . . . . . . . . . . . . . . . . . . . . . . . 989.4 760.2 603.4
Corporate . . . . . . . . . . . . . . . . . . . . . . . . . . . . . . . . . . . . . . . . . . . — 72.6 61.3
Total sales . . . . . . . . . . . . . . . . . . . . . . . . . . . . . . . . . . . . . . . . . .
$ 8,589.0 $ 7,439.2 $ 6,281.4
Gross profit
Off Road . . . . . . . . . . . . . . . . . . . . . . . . . . . . . . . . . . . . . . . . . . . . 1,523.4 1,329.8 1,302.0
On Road . . . . . . . . . . . . . . . . . . . . . . . . . . . . . . . . . . . . . . . . . . . . 206.3 160.7 95.5
Marine . . . . . . . . . . . . . . . . . . . . . . . . . . . . . . . . . . . . . . . . . . . . . 222.5 170.6 116.4
Corporate . . . . . . . . . . . . . . . . . . . . . . . . . . . . . . . . . . . . . . . . . . . 7.3 89.8 21.8
Total gross profit . . . . . . . . . . . . . . . . . . . . . . . . . . . . . . . . . . . . .
$ 1,959.5 $ 1,750.9 $ 1,535.7
Item 9. Changes in and Disagreements with Accountants on Accounting and Financial Disclosure
Not applicable.
Item 9A. Controls and Procedures
The Company carried out an evaluation, under the supervision and with the participation of the Company’s management,
including the Company’s Chief Executive Officer and its Chief Financial Officer, of the effectiveness of the design and
operation of the Company’s disclosure controls and procedures (as defined in Rule 13a-15(e) of the Securities Exchange
Act of 1934, as amended) as of the end of the period covered by this report. Based upon that evaluation, the Company’s
Chief Executive Officer along with the Company’s Chief Financial Officer concluded that, as of the end of the period
covered by this Annual Report on Form 10-K, the Company’s disclosure controls and procedures were effective to
ensure that information required to be disclosed by the Company in reports that it files or submits under the Securities
Exchange Act of 1934, as amended, is (1) recorded, processed, summarized and reported within the time periods
specified in SEC rules and forms, and (2) accumulated and communicated to the Company’s management including its
Chief Executive Officer and Chief Financial Officer, in a manner that allows timely decisions regarding required
disclosure. No changes have occurred during the period covered by this report or since the evaluation date that would
have a material effect on the disclosure controls and procedures.
The Company’s internal control report is included in this report after Item 8, under the caption “Management’s Report on
Company’s Internal Control over Financial Reporting.”
The effectiveness of the Company’s internal control over financial reporting has been audited by Ernst & Young LLP
(PCAOB ID: 42), an independent registered public accounting firm, as stated in its report included herein.
Item 9B. Other Information
Not applicable.
Item 9C. Disclosure Regarding Foreign Jurisdictions that Prevent Inspections.
Not applicable.
71
PART III
Item 10. Directors, Executive Officers and Corporate Governance
The sections entitled “Proposal 1 – Election of Directors—Information Concerning Nominees and Directors,”
“Corporate Governance—Committees of the Board and Meetings” and “Corporate Governance—Code of Business
Conduct and Ethics” in the Polaris definitive Proxy Statement to be filed on or about March 15, 2023 for its 2023 annual
meeting of stockholders (the “2023 Proxy Statement”), are incorporated herein by reference. See also Item 1 “Executive
Officers of the Registrant” in Part I hereof.
Item 11. Executive Compensation
The sections entitled “Director Compensation,” “Compensation Discussion and Analysis,” “Compensation Committee
Report,” “Executive Compensation,” “Potential Payments Upon Termination or Change-In-Control,” and “Pay Ratio
Disclosure” in the Company’s 2023 Proxy Statement are incorporated herein by reference.
Item 12. Security Ownership of Certain Beneficial Owners and Management and Related Stockholder Matters
The sections entitled “Equity Compensation Plan Information” and “Security Ownership of Certain Beneficial Owners
and Management” in the Company’s 2023 Proxy Statement are incorporated herein by reference.
Item 13. Certain Relationships and Related Transactions, and Director Independence
The sections entitled “Corporate Governance—Corporate Governance Guidelines and Independence” and “Corporate
Governance—Certain Relationships and Related Transactions” in the Company’s 2023 Proxy Statement are incorporated
herein by reference.
Item 14. Principal Accountant Fees and Services
The section entitled “Fees Paid to Independent Registered Public Accounting Firm” in the Company’s 2023 Proxy
Statement is incorporated herein by reference.
72
PART IV
Item 15. Exhibit and Financial Statement Schedules
(a) The following documents are filed as part of this report:
(1) Financial Statements
The financial statements listed in the Index to Financial Statements on page 37 are included in Part II of this
Form 10-K.
(2) Financial Statement Schedules
Schedule II—Valuation and Qualifying Accounts is included on page 74 of this report.
All other supplemental financial statement schedules have been omitted because they are not applicable or are
not required or the information required to be set forth therein is included in the Consolidated Financial
Statements or Notes thereto.
(3) Exhibits
The Exhibits to this report are listed in the Exhibit Index to Annual Report on Form 10-K on pages 75 to 79.
A copy of any of these Exhibits will be furnished at a reasonable cost to any person who was a shareholder of
the Company as of February 17, 2023, upon receipt from any such person of a written request for any such
exhibit. Such request should be sent to Polaris Inc., 2100 Highway 55, Medina, Minnesota 55340, Attention:
Investor Relations.
(b) Exhibits
Included in Item 15(a)(3) above.
(c) Financial Statement Schedules
Included in Item 15(a)(2) above.
Item 16. Form 10-K Summary
None.
73

POLARIS INC.
SCHEDULE II—VALUATION AND QUALIFYING ACCOUNTS
(In millions)
2020: Deducted from asset accounts—
Allowance for doubtful accounts receivable .
$ 4.4 $ 0.8 $ — $ (0.8) $ 4.4
2021: Deducted from asset accounts—
Allowance for doubtful accounts receivable .
$ 4.4 $ 1.3 $ (0.2) $ (0.8) $ 4.7
2022: Deducted from asset accounts—
Allowance for doubtful accounts receivable .
$ 4.7 $ 4.2 $ — $ (0.2) $ 8.7
Allowance for Doubtful Accounts
Balance at
Beginning of
Period
Additions
Charged to
Costs and
Expenses
Reductions
from
Divestiture
Other
Changes
(1)
Balance at
End of Period
(1) Uncollectible accounts receivable written off, net of recoveries
(In millions)
2020: Deducted from asset accounts—
Allowance for obsolete inventory . . . . . . . . .
$ 51.6 $ 24.7 $ — $ (14.7) $ 61.6
2021: Deducted from asset accounts—
Allowance for obsolete inventory . . . . . . . . .
$ 61.6 $ 29.5 $ (2.4) $ (14.6) $ 74.1
2022: Deducted from asset accounts—
Allowance for obsolete inventory . . . . . . . . .
$ 74.1 $ 32.0 $ — $ (19.4) $ 86.7
Inventory Reserve
Balance at
Beginning of
Period
Additions
Charged to
Costs and
Expenses
Reductions
from
Divestiture
Other
Changes
(2)
Balance at
End of Period
(2) Inventory disposals, net of recoveries
(In millions)
2020: Deducted from asset accounts—Allowance for
deferred tax assets . . . . . . . . . . . . . . . . . . . . . . . . . . . . . . . .
$ 14.6 $ 3.3 $ (1.8) $ 16.1
2021: Deducted from asset accounts—Allowance for
deferred tax assets . . . . . . . . . . . . . . . . . . . . . . . . . . . . . . . .
$ 16.1 $ 2.1 $ (1.2) $ 17.0
2022: Deducted from asset accounts—Allowance for
deferred tax assets . . . . . . . . . . . . . . . . . . . . . . . . . . . . . . . .
$ 17.0 $ 0.7 $ (1.1) $ 16.6
Deferred Tax Asset Valuation Allowance
Balance at
Beginning of
Period
Additions
Charged to
Costs and
Expenses
(3)
Other
Changes
(4)
Balance at
End of Period
(3) Increases related to losses, credits, impairments and capital losses without tax benefits
(4) Decreases related to utilization of loss carryforwards and certain deferred tax assets
74
POLARIS INC.
EXHIBIT INDEX TO ANNUAL REPORT ON
FORM 10-K
For Fiscal Year Ended December 31, 2022
Exhibit
Number Description
2.a
Agreement and Plan of Merger, dated as of May 29, 2018, by and among Polaris Industries Inc., Polaris
Sales Inc., Beam Merger Sub, LLC, Boat Holdings, LLC and the Holder Representative thereunder
(excluding schedules and exhibits, which the Company agrees to furnish supplementally to the Securities
and Exchange Commission upon request), incorporated by reference to Exhibit 2.1 to the Company’s
Current Report on Form 8-K filed May 30, 2018.
3.a
Restated Articles of Incorporation of Polaris Inc. (the “Company”), effective July 29, 2019, incorporated by
reference to Exhibit 3.1 to the Company’s Current Report on Form 8-K filed on July 29, 2019.
.b
Bylaws of Polaris Inc., as amended and restated on July 29, 2019, incorporated by reference to Exhibit 3.2
to the Company’s Current Report on Form 8-K filed July 29, 2019.
4.a
Specimen Stock Certificate of the Company, incorporated by reference to Exhibit 4 to the Company’s
Registration Statement on Form S-4/A, filed November 18, 1994 (No. 033-55769).
.b
Master Note Purchase Agreement by and among Polaris Industries Inc. and the purchasers party thereto,
dated December 13, 2010, incorporated by reference to Exhibit 4.1 to the Company’s Current Report on
Form 8-K filed December 15, 2010.
.c
First Amendment to Master Note Purchase Agreement effective as of August 18, 2011, incorporated by
reference to Exhibit 4.c to the Company’s Quarterly Report on Form 10-Q for the quarter ended September
30, 2011.
.d
First Supplement to Master Note Purchase Agreement effective as of December 19, 2013, incorporated by
reference to Exhibit 4.1 to the Company’s Current Report on Form 8-K, filed December 20, 2013.
.e
Second Amendment to Master Note Purchase Agreement, as Supplemented by the First Supplement to the
Master Note Amendment effective as of December 28, 2016, incorporated by reference to Exhibit 4.f to the
Company’ Annual Report on Form 10-K for the year ended December 31, 2016.
.f
Third Amendment to Master Note Purchase Agreement, as Supplemented by the First Supplement to the
Master Note Amendment, effective as of July 31, 2018, incorporated by reference to Exhibit 4.f to the
Company’s Quarterly Report on Form 10-Q for the quarter ended September 30, 2018.
.g
Fourth Amendment to Master Note Purchase Agreement, effective as of May 26, 2020, incorporated by
reference to Exhibit 10.02 to the Company’s Current Report on Form 8-K filed May 29, 2020.
.h
Fifth Amendment to Master Note Purchase Agreement, effective January 15, 2021, incorporated by
reference to Exhibit 10.02 to the Company’s Current Report on Form 8-K filed January 19, 2021.
.i
Master Note Purchase Agreement by and among Polaris Industries Inc. and the purchasers party thereto,
dated July 2, 2018, incorporated by reference to Exhibit 4.1 to the Company’s Current Report on Form 8-K
filed July 2, 2018.
.j
First Amendment to Master Note Purchase Agreement effective May 26, 2020, incorporated by reference to
Exhibit 10.03 to the Company’s Current Report on Form 8-K filed May 29, 2020.
.k
Second Amendment to Master Note Purchase Agreement, effective January 15, 2021, incorporated by
reference to Exhibit 10.03 to the Company’s Current Report on Form 8-K filed January 19, 2021.
.l
Description of the Company’s Capital Stock, incorporated by reference to Exhibit 4.h to the Company’s
Annual Report on Form 10-K for the year ended December 31, 2019.
10.a
Polaris Industries Inc. Supplemental Retirement/Savings Plan, as amended and restated effective July 23,
2014, incorporated by reference to Exhibit 10.a to the Company’s Quarterly Report on Form 10-Q for the
quarter ended September 30, 2014.*
.b
Amendment to the Polaris Industries Inc. Supplemental Retirement/Savings Plan effective January 1, 2018
incorporated by reference to Exhibit 10.b to the Company’s Annual Report on Form 10-K for the year
ended December 31, 2017.*
75
.c
Polaris Inc. Deferred Compensation Plan for Directors, as amended and restated, effective October 24,
2019, incorporated by reference to Exhibit 10.c to the Company’s Annual Report on Form 10-K for the
year ended December 31, 2019.*
.d
Polaris Industries Inc. Senior Executive Annual Incentive Plan, as amended and restated effective February
27, 2018 incorporated by reference to Exhibit 10.a to the Company’s Quarterly Report on Form 10-Q for
the quarter ended March 31, 2018.*
.e
Polaris Inc. 2007 Omnibus Incentive Plan (as Amended and Restated April 30, 2020), incorporated by
reference to Annex A to the Company’s Proxy Statement for the 2020 Annual Meeting of Shareholders
filed March 13, 2020.*
.f
Form of Nonqualified Stock Option Agreement (Single Trigger) made under the Polaris Industries Inc.
2007 Omnibus Incentive Plan (As Amended and Restated April 28, 2011), incorporated by reference to
Exhibit 10.2 to the Company’s Current Report on Form 8-K filed on May 3, 2011.*
.g
Form of Nonqualified Stock Option Agreement (Double Trigger) made under the Polaris Industries Inc.
2007 Omnibus Incentive Plan (As Amended and Restated April 28, 2011), incorporated by reference to
Exhibit 10.3 to the Company’s Current Report on Form 8-K filed on May 3, 2011.*
.h
Form of Deferred Stock Award Agreement for shares of deferred stock granted to non-employee directors
in 2007 under the Polaris Industries Inc. 2007 Omnibus Incentive Plan, incorporated by reference to Exhibit
10.t to the Company’s Annual Report on Form 10-K for the year ended December 31, 2007.*
.i
Form of the Deferred Stock Unit Award Agreement for units of deferred stock granted to non-employee
directors under the Company’s Amended and Restated 2007 Omnibus Incentive Plan, incorporated by
reference to Exhibit 10.1 to the Company’s Current Report on Form 8-K filed May 3, 2016.*
.j
Form of Nonqualified Stock Option Agreement entered into with Kenneth J. Pucel, incorporated by
reference to Exhibit 10.gg to the Company’s Annual Report on Form 10-K for the year ended December
31, 2014 .*
.k
Form of Performance Restricted Stock Unit Award Agreement entered into with Kenneth J. Pucel,
incorporated by reference to Exhibit 10.hh to the Company’s Annual Report on Form 10-K for the year
ended December 31, 2014.*
.l
Form of Restricted Stock Unit Award Agreement made under the Polaris Industries Inc. 2007 Omnibus
Incentive Plan (as Amended and Restated April 30, 2015), incorporated by reference to Exhibit 10.1 to the
Company’s Current Report on Form 8-K as filed July 13, 2015.*
.m
Form of Performance Restricted Stock Unit Award Agreement made under the Polaris Industries Inc. 2007
Omnibus Incentive Plan (as Amended and Restated April 30, 2015), incorporated by reference to Exhibit
10.2 to the Company’s Current Report on Form 8-K as filed July 13, 2015.*
.n
Form of Nonqualified Stock Option Award Agreement made under the Polaris Industries Inc. 2007
Omnibus Incentive Plan (as Amended and Restated April 30, 2015), incorporated by reference to Exhibit
10.3 to the Company’s Current Report on Form 8-K as filed July 13, 2015.*
.o
Form of Nonqualified Stock Option Award Agreement made under the Polaris Inc. 2007 Omnibus
Incentive Plan (as Amended and Restated April 25, 2019), incorporated by reference to Exhibit 10.p to the
Company’s Annual Report on Form 10-K for the year ended December 31, 2019.*
.p
Form of Nonqualified Stock Option Award Agreement entered into with Kenneth J. Pucel, made under the
Polaris Inc. 2007 Omnibus Incentive Plan (as Amended and Restated April 25, 2019), incorporated by
reference to Exhibit 10.q to the Company’s Annual Report on Form 10-K for the year ended December 31,
2019.*
.q
Form of Restricted Stock Unit Award Agreement made under the Polaris Inc. 2007 Omnibus Incentive Plan
(as Amended and Restated April 25, 2019), incorporated by reference to Exhibit 10.r to the Company’s
Annual Report on Form 10-K for the year ended December 31, 2019.*
.r
Form of Restricted Stock Unit Award Agreement entered into with Kenneth J. Pucel, made under the
Polaris Inc. 2007 Omnibus Incentive Plan (as Amended and Restated April 25, 2019), incorporated by
reference to Exhibit 10.s to the Company’s Annual Report on Form 10-K for the year ended December 31,
2019.*
.s
Form of Performance Restricted Stock Unit Award Agreement made under the Polaris Inc. 2007 Omnibus
Incentive Plan (as Amended and Restated April 25, 2019), incorporated by reference to Exhibit 10.t to the
Company’s Annual Report on Form 10-K for the year ended December 31, 2019.*
76
.t
Form of Performance Restricted Stock Unit Award Agreement entered into with Kenneth J. Pucel, made
under the Polaris Inc. 2007 Omnibus Incentive Plan (as Amended and Restated April 25, 2019),
incorporated by reference to Exhibit 10.u to the Company’s Annual Report on Form 10-K for the year
ended December 31, 2019.*
.u
Form of Nonqualified Stock Option Award Agreement made under the Polaris Inc. 2007 Omnibus
Incentive Plan (as Amended and Restated April 30, 2020), incorporated by reference to the Company’s
Annual Report on Form 10-K for the year ended December 31, 2020.*
.v
Form of Nonqualified Stock Option Award Agreement entered into with Kenneth J. Pucel, made under the
Polaris Inc. 2007 Omnibus Incentive Plan (as Amended and Restated April 30, 2020), incorporated by
reference to the Company’s Annual Report on Form 10-K for the year ended December 31, 2020.*
.w
Form of Restricted Stock Unit Award Agreement made under the Polaris Inc. 2007 Omnibus Incentive Plan
(as Amended and Restated April 30, 2020), incorporated by reference to the Company’s Annual Report on
Form 10-K for the year ended December 31, 2020.*
.x
Form of Restricted Stock Unit Award Agreement entered into with Kenneth J. Pucel, made under the
Polaris Inc. 2007 Omnibus Incentive Plan (as Amended and Restated April 30, 2020), incorporated by
reference to the Company’s Annual Report on Form 10-K for the year ended December 31, 2020.*
.y
Form of Performance Restricted Stock Unit Award Agreement made under the Polaris Inc. 2007 Omnibus
Incentive Plan (as Amended and Restated April 30, 2020), incorporated by reference to the Company’s
Annual Report on Form 10-K for the year ended December 31, 2020.*
.z
Form of Performance Restricted Stock Unit Award Agreement entered into with Kenneth J. Pucel, made
under the Polaris Inc. 2007 Omnibus Incentive Plan (as Amended and Restated April 30, 2020),
incorporated by reference to the Company’s Annual Report on Form 10-K for the year ended December 31,
2020.*
.aa
Form of Restricted Stock Unit Award Agreement (Retention Grant) made under the Polaris Inc. 2007
Omnibus Incentive Plan (as Amended and Restated April 30, 2020), incorporated by reference to the
Company’s Annual Report on Form 10-K for the year ended December 31, 2020.*
.bb
Employment Offer Letter dated September 15, 2014 by and between the Company and Kenneth J. Pucel,
incorporated by reference to Exhibit 10.w to the Company’s Annual Report on Form 10-K for the year
ended December 31, 2014.*
.cc
Employment Offer Letter dated July 10, 2015 by and between the Company and Michael T. Speetzen,
incorporated by reference to Exhibit 10.d to the Company’s Quarterly Report on Form 10-Q for the quarter
ended September 30, 2015.*
.dd
Employment Offer Letter dated December 21, 2020 by and between the Company and Michael T.
Speetzen, incorporated by reference to the Company’s Annual Report on Form 10-K for the year ended
December 31, 2020.*
.ee
Employment Offer Letter dated December 21, 2020 by and between the Company and Robert P. Mack,
incorporated by reference to the Company’s Annual Report on Form 10-K for the year ended December 31,
2020.*
.ff
Employment Offer letter dated January 12, 2011 by and between the Company and James P. Williams,
incorporated by reference to Exhibit 10.cc to the Company’s Annual Report on Form 10-K for the year
ended December 31, 2011.*
.gg
Severance Agreement entered into with Kenneth J. Pucel dated December 1, 2014, incorporated by
reference to Exhibit 10.gg to the Company’s Annual Report on Form 10-K for the year ended December
31, 2021.*
.hh
Severance Agreement dated July 31, 2015 entered into with Michael T. Speetzen, incorporated by reference
to Exhibit 10.ff to the Company’s Annual Report on Form 10-K for the year ended December 31, 2015.*
.ii
Severance Agreement dated April 4, 2011 entered into with James P. Williams, incorporated by reference
to Exhibit 10.ff to the Company’s Annual Report on Form 10-K for the year ended December 31, 2019.*
.jj
Employment Offer Letter dated December 27, 2017 by and between the Company and Lucy Clark
Dougherty, incorporated by reference to Exhibit 10.u to the Company’s Annual Report on Form 10-K for
the year ended December 31, 2018.*
77
.kk
Severance Agreement dated January 29, 2018 entered into with Lucy Clark Dougherty, incorporated by
reference to Exhibit 10.z to the Company’s Annual Report on Form 10-K for the year ended December 31,
2018.*
.ll
Amended and Restated Joint Venture Agreement dated as of February 28, 2011, by and between the
Company and GE Commercial Distribution Finance Corporation, incorporated by reference to Exhibit 10.1
to the Company’s Current Report on Form 8-K filed March 1, 2011.
.mm
Amended and Restated Manufacturer’s Repurchase Agreement dated as of February 28, 2011, by and
among the Company, Polaris Industries Inc., a Delaware Corporation, Polaris Sales Inc., and Polaris
Acceptance, incorporated by reference to Exhibit 10.2 to the Company’s Current Report on Form 8-K filed
March 1, 2011.
.nn
First Amendment dated December 7, 2015 to the Amended and Restated Joint Venture Agreement dated as
of February 28, 2011, by and between the Company and GE Commercial Distribution Finance LLC f/k/a
GE Commercial Distribution Corporation, incorporated by reference to Exhibit 10.nn to the Company’s
Annual Report on Form 10-K for the year ended December 31, 2015.
.oo
Second Amendment dated December 7, 2015 to the Second Amended and Restated Partnership Agreement,
by and between Polaris Acceptance Inc. and CDF Joint Ventures, Inc. dated as of June 1, 2014,
incorporated by reference to Exhibit 10.oo to the Company’s Annual Report on Form 10-K for the year
ended December 31, 2015.
.pp
Third Amended and Restated Credit Agreement dated November 9, 2016 by and among Polaris Industries
Inc., Polaris Sales Inc., any other Domestic Borrower (as defined therein) that thereafter becomes a party
thereto, Polaris Sales Europe Sárl, any other Foreign Borrower (as defined therein) that hereafter becomes a
party thereto, the Lenders named therein, U.S. Bank National Association, as Administrative Agent, Left
Lead Arranger and Lead Book Runner, Merrill Lynch, Pierce, Fenner & Smith Incorporated, Wells Fargo
Securities, LLC, and The Bank of Tokyo-Mitsubishi UFJ, Ltd., as Joint Lead Arrangers, Joint Book
Runners and Syndication Agents, and Bank of the West, Fifth Third Bank, JP Morgan Chase Bank, N.A.,
PNC Bank, National Association and BMO Harris Bank N.A., as Documentation Agents, incorporated by
reference to Exhibit 10.1 to the Company’s Current Report on Form 8-K, filed November 10, 2016.
.qq
Fourth Amended and Restated Credit Agreement, dated July 2, 2018 by and among Polaris Industries Inc.,
Polaris Sales Europe Sàrl, any other Foreign Borrower (as defined therein) that hereafter becomes a party
thereto, the Lenders named therein, U.S. Bank National Association, as Administrative Agent, Left Lead
Arranger and Lead Book Runner, Merrill Lynch, Pierce, Fenner & Smith Incorporated, Wells Fargo
Securities, LLC, and MUFG Bank, Ltd., as Joint Lead Arrangers, Joint Book Runners and Syndication
Agents, and Bank of the West, Fifth Third Bank, JP Morgan Chase Bank N.A., PNC Bank, National
Association and BMO Harris Bank N/A., as Documentation Agents, incorporated by reference to Exhibit
10.1 to the Company’s Current Report on Form 8-K filed July 2, 2018.
.rr
Incremental Amendment to Fourth Amended and Restated Credit Agreement dated as of April 9, 2020,
incorporated by reference to Exhibit 10.01 to the Company’s Current Report on Form 8-K filed April 13,
2020.
.ss
Amendment No. 1 to Fourth Amended and Restated Credit Agreement dated as of May 26, 2020,
incorporated by reference to Exhibit 10.01 to the Company’s Current Report on Form 8-K filed May 29,
2020.
.tt
Amendment No. 2 to Fourth Amended and Restated Credit Agreement dated as of January 15, 2021,
incorporated by reference to Exhibit 10.01 to the Company’s Current Report on Form 8-K filed January 19,
2021.
.uu
Amendment No. 3 dated as of June 30, 2021 to Fourth Amended and Restated Credit Agreement dated as
of July 2, 2018 by and among Polaris Inc., certain of its affiliates listed on the signature pages thereto, the
lenders listed on the signature pages thereto and U.S. Bank National Association, as administrative agent,
incorporated by reference to Exhibit 10.01 to the Company’s Current Report on Form 8-K filed June 30,
2021.
.vv
Amendment No. 4 dated as of December 17, 2021 to Fourth Amended and Restated Credit Agreement
dated as of July 2, 2018 by and among Polaris Inc., certain of its affiliates listed on the signature pages
thereto, the lenders listed on the signature pages thereto and U.S. Bank National Association, as
administrative agent, incorporated by reference to Exhibit 10.01 to the Company’s Current Report on Form
8-K filed December 21, 2021.
78
.ww
Amendment No. 5 dated as of December 16, 2022 to Fourth Amended and Restated Credit Agreement
dated as of July 2, 2018 by and among Polaris Inc., certain of its affiliates listed on the signature pages
thereto, the lenders listed on the signature pages thereto and U.S. Bank National Association, as
administrative agent, incorporated by reference to Exhibit 10.01 to the Company’s Current Report on Form
8-K filed December 20, 2022.
.xx
Severance Agreement dated August 18, 2011 entered into with Steven Menneto, incorporated by reference
to Exhibit 10.a to the Company’s Quarterly Report on Form 10-Q for the quarter ended March 31, 2021.*
.yy
Employment Offer Letter dated April 27, 2016 by and between the Company and Stephen L. Eastman,
incorporated by reference to Exhibit 10.b to the Company’s Quarterly Report on Form 10-Q for the quarter
ended June 30, 2016.*
.zz
Severance Agreement dated February 6, 2012 entered into with Stephen L. Eastman, incorporated by
reference to Exhibit 10.dd to the Company’s Annual Report on Form 10-K for the year ended December
31, 2015.*
.aaa
Severance Agreement entered into with Robert Mack, incorporated by reference to Exhibit 10.aa to the
Company’s Annual Report on Form 10-K for the year ended December 31, 2016.*
.bbb
Offer Letter Agreement dated April 29, 2021 between Michael T. Speetzen and the Company, incorporated
by reference to Exhibit 10.1 to the Company’s Current Report on Form 8-K filed May 4, 2021.*
.ccc
Offer Letter Agreement dated April 29, 2021 between Robert P. Mack and the Company, incorporated by
reference to Exhibit 10.2 to the Company’s Current Report on Form 8-K filed May 4, 2021.*
21
Subsidiaries of Registrant.
23
Consent of Ernst & Young LLP.
24
Power of Attorney.
31.a
Certification of Chief Executive Officer required by Exchange Act Rule 13a-14(a).
31.b
Certification of Chief Financial Officer required by Exchange Act Rule 13a-14(a).
32.a
Certification furnished pursuant to 18 U.S.C. 1350, as adopted pursuant to Section 906 of the Sarbanes-
Oxley Act of 2002.
32.b
Certification furnished pursuant to 18 U.S.C. 1350, as adopted pursuant to Section 906 of the Sarbanes-
Oxley Act of 2002.
101
The following financial information from Polaris Inc.’s Annual Report on Form 10-K for the year ended
December 31, 2022, filed with the SEC on February 17, 2023, formatted in Inline eXtensible Business
Reporting Language (iXBRL): (i) the Consolidated Balance Sheets as of December 31, 2022 and 2021, (ii)
the Consolidated Statements of Income for the years ended December 31, 2022, 2021 and 2020 (iii) the
Consolidated Statements of Comprehensive Income for the years ended December 31, 2022, 2021 and
2020, (iv) the Consolidated Statements of Equity for the years ended December 31, 2022, 2021 and 2020,
(v) the Consolidated Statements of Cash Flows for the years ended December 31, 2022, 2021 and 2020, and
(vi) Notes to Consolidated Financial Statements.
104
The cover page from the Annual Report on Form 10-K of the Company for the year ended December 31,
2022 formatted in iXBRL.
* Management contract or compensatory plan.
79

SIGNATURES
Pursuant to the requirements of Section 13 or 15(d) of the Securities Exchange Act of 1934, the registrant has duly
caused this report to be signed on its behalf by the undersigned, thereunto duly authorized, in the City of Minneapolis,
State of Minnesota on February 17, 2023.
POLARIS INC.
By:
/S/ MICHAEL T. SPEETZEN
Michael T. Speetzen
Chief Executive Officer
Pursuant to the requirements of the Securities Exchange Act of 1934, this report has been signed below by the following
persons on behalf of the registrant in the capacities and on the dates indicated.
/S/ MICHAEL T. SPEETZEN
Chief Executive Officer
(Principal Executive Officer)
February 17, 2023
Michael T. Speetzen
/S/ ROBERT P. MACK
Chief Financial Officer
(Principal Financial and Accounting Officer)
February 17, 2023
Robert P. Mack
* Director
February 17, 2023
George W. Bilicic
* Director
February 17, 2023
Kevin M. Farr
* Director
February 17, 2023
Gary E. Hendrickson
* Director
February 17, 2023
Gwenne A. Henricks
* Director
February 17, 2023
Darryl R. Jackson
*
Director
February 17, 2023
Bernd F. Kessler
* Director
February 17, 2023
Lawrence D. Kingsley
* Director
February 17, 2023
Gwynne E. Shotwell
* Chair of the Board
February 17, 2023
John P. Wiehoff
*By:
/S/ MICHAEL T. SPEETZEN
February 17, 2023
(Michael T. Speetzen Attorney-in-Fact)
Signature
Title
Date
* Michael T. Speetzen, pursuant to Powers of Attorney executed by each of the officers and directors listed above
whose name is marked by an “*” and filed as an exhibit hereto, by signing his name hereto does hereby sign and
execute this report of Polaris Inc. on behalf of each of such officers and directors in the capacities in which the names
of each appear above.
80

EXHIBIT 31.a
I, Michael T. Speetzen, certify that:
1. I have reviewed this annual report on Form 10-K of Polaris Inc.;
2. Based on my knowledge, this report does not contain any untrue statement of a material fact or omit to state a
material fact necessary to make the statements made, in light of the circumstances under which such statements were
made, not misleading with respect to the period covered by this report;
3. Based on my knowledge, the financial statements, and other financial information included in this report, fairly
present in all material respects the financial condition, results of operations and cash flows of the registrant as of,
and for, the periods presented in this report;
4. The registrant’s other certifying officer(s) and I are responsible for establishing and maintaining disclosure controls
and procedures (as defined in Exchange Act Rules 13a-15(e) and 15d-15(e)) and internal control over financial
reporting (as defined in Exchange Act Rules 13a-15(f) and 15d-15(f)) for the registrant and have:
a. Designed such disclosure controls and procedures, or caused such disclosure controls and procedures to be
designed under our supervision, to ensure that material information relating to the registrant, including its
consolidated subsidiaries, is made known to us by others within those entities, particularly during the
period in which this report is being prepared;
b. Designed such internal control over financial reporting or caused such internal control over financial
reporting to be designed under our supervision, to provide reasonable assurance regarding the reliability of
financial reporting and the preparation of financial statements for external purposes in accordance with
generally accepted accounting principles;
c. Evaluated the effectiveness of the registrant’s disclosure controls and procedures and presented in this
report our conclusions about the effectiveness of the disclosure controls and procedures, as of the end of the
period covered by this report based on such evaluation; and
d. Disclosed in this report any change in the registrant’s internal control over financial reporting that occurred
during the registrant’s most recent fiscal quarter (the registrant’s fourth fiscal quarter in the case of an
annual report) that has materially affected, or is reasonably likely to materially affect, the registrant’s
internal control over financial reporting; and
5. The registrant’s other certifying officer(s) and I have disclosed, based on our most recent evaluation of internal
control over financial reporting, to the registrant’s auditors and the audit committee of the registrant’s board of
directors (or persons performing the equivalent functions):
a. All significant deficiencies and material weaknesses in the design or operation of internal control over
financial reporting which are reasonably likely to adversely affect the registrant’s ability to record, process,
summarize and report financial information; and
b. Any fraud, whether or not material, that involves management or other employees who have a significant
role in the registrant’s internal control over financial reporting.
/S/ MICHAEL T. SPEETZEN
Michael T. Speetzen
Chief Executive Officer
Date: February 17, 2023
81

EXHIBIT 31.b
I, Robert P. Mack, certify that:
1. I have reviewed this annual report on Form 10-K of Polaris Inc.;
2. Based on my knowledge, this report does not contain any untrue statement of a material fact or omit to state a
material fact necessary to make the statements made, in light of the circumstances under which such statements were
made, not misleading with respect to the period covered by this report;
3. Based on my knowledge, the financial statements, and other financial information included in this report, fairly
present in all material respects the financial condition, results of operations and cash flows of the registrant as of,
and for, the periods presented in this report;
4. The registrant’s other certifying officer(s) and I are responsible for establishing and maintaining disclosure controls
and procedures (as defined in Exchange Act Rules 13a-15(e) and 15d-15(e)) and internal control over financial
reporting (as defined in Exchange Act Rules 13a-15(f) and 15d-15(f)) for the registrant and have:
a. Designed such disclosure controls and procedures, or caused such disclosure controls and procedures to be
designed under our supervision, to ensure that material information relating to the registrant, including its
consolidated subsidiaries, is made known to us by others within those entities, particularly during the
period in which this report is being prepared;
b. Designed such internal control over financial reporting or caused such internal control over financial
reporting to be designed under our supervision, to provide reasonable assurance regarding the reliability of
financial reporting and the preparation of financial statements for external purposes in accordance with
generally accepted accounting principles;
c. Evaluated the effectiveness of the registrant’s disclosure controls and procedures and presented in this
report our conclusions about the effectiveness of the disclosure controls and procedures, as of the end of the
period covered by this report based on such evaluation; and
d. Disclosed in this report any change in the registrant’s internal control over financial reporting that occurred
during the registrant’s most recent fiscal quarter (the registrant’s fourth fiscal quarter in the case of an
annual report) that has materially affected, or is reasonably likely to materially affect, the registrant’s
internal control over financial reporting; and
5. The registrant’s other certifying officer(s) and I have disclosed, based on our most recent evaluation of internal
control over financial reporting, to the registrant’s auditors and the audit committee of the registrant’s board of
directors (or persons performing the equivalent functions):
a. All significant deficiencies and material weaknesses in the design or operation of internal control over
financial reporting which are reasonably likely to adversely affect the registrant’s ability to record, process,
summarize and report financial information; and
b. Any fraud, whether or not material, that involves management or other employees who have a significant
role in the registrant’s internal control over financial reporting.
/S/ ROBERT P. MACK
Robert P. Mack
Chief Financial Officer
Date: February 17, 2023
82

EXHIBIT 32.a
POLARIS INC.
STATEMENT PURSUANT TO 18 U.S.C. §1350
I, Michael T. Speetzen, Chief Executive Officer of Polaris Inc., a Minnesota corporation (the “Company”), hereby certify as
follows:
1. This statement is provided pursuant to 18 U.S.C. § 1350 in connection with the Company’s Annual Report on
Form 10-K for the period ended December 31, 2022 (the “Periodic Report”);
2. The Periodic Report fully complies with the requirements of Sections 13(a) and 15(d) of the Securities Exchange
Act of 1934, as amended; and
3. The information contained in the Periodic Report fairly presents, in all material respects, the financial condition and
results of operations of the Company as of the dates and for the periods indicated therein.
Date: February 17, 2023
/S/ MICHAEL T. SPEETZEN
Michael T. Speetzen
Chief Executive Officer
A signed original of this written statement required by Section 906, or other document authenticating, acknowledging, or
otherwise adopting the signature that appears in typed form within the electronic version of this written statement required by
Section 906, has been provided to Polaris Inc. and will be retained by Polaris Inc. and furnished to the Securities and
Exchange Commission or its staff upon request.
83

EXHIBIT 32.b
POLARIS INC.
STATEMENT PURSUANT TO 18 U.S.C. §1350
I, Robert P. Mack, Chief Financial Officer of Polaris Inc., a Minnesota corporation (the “Company”), hereby certify as
follows:
1. This statement is provided pursuant to 18 U.S.C. § 1350 in connection with the Company’s Annual Report on
Form 10-K for the period ended December 31, 2022 (the “Periodic Report”);
2. The Periodic Report fully complies with the requirements of Sections 13(a) and 15(d) of the Securities Exchange
Act of 1934, as amended; and
3. The information contained in the Periodic Report fairly presents, in all material respects, the financial condition and
results of operations of the Company as of the dates and for the periods indicated therein.
Date: February 17, 2023
/S/ ROBERT P. MACK
Robert P. Mack
Chief Financial Officer
A signed original of this written statement required by Section 906, or other document authenticating, acknowledging, or
otherwise adopting the signature that appears in typed form within the electronic version of this written statement required by
Section 906, has been provided to Polaris Inc. and will be retained by Polaris Inc. and furnished to the Securities and
Exchange Commission or its staff upon request.
84

STOCK EXCHANGE
Shares of common stock of Polaris Inc. trade on the New York
Stock Exchange under the symbol PII.
INDEPENDENT AUDITORS
Ernst & Young LLP, Minneapolis, MN
TRANSFER AGENT AND REGISTRAR
Communications concerning transfer requirements,
address changes, dividends and lost certicates, as well as
requests for Dividend Reinvestment Plan enrollment
information, should be addressed to:
ANNUAL SHAREHOLDERS’ MEETING
The virtual only meeting will be held at 9 a.m. Central Time,
April 27, 2023. The proxy statement will be available on or
about March 15, 2023. The shareholder-of-record date is
March 6, 2023.
SUMMARY OF TRADING
For the Years Ended December 31
CASH DIVIDENDS DECLARED
Cash dividends are declared quarterly and have been paid since
1995. On February 2, 2023, the quarterly dividend was increased
2% percent to $0.65 per share.
STOCK-SPLIT HISTORY
DIVIDEND REINVESTMENT PLAN
Shareholders may automatically reinvest their dividends
in additional Polaris common stock through the Dividend
Reinvestment Plan, which also provides for purchase of
common stock with voluntary cash contributions.
For additional information, please contact EQ Shareowner
Services at 1-800-468-9716 or visit the website at
www.shareowneronline.com.
INVESTOR RELATIONS
Security analysts and investment professionals should direct
their business-related inquiries to:
To view additional information on the Company, access
www.polaris.com
CORPORATE SOCIAL RESPONSIBILITY
For the most complete view of our Corporate Responsibility
and ESG efforts, you may view the Polaris Geared for Good ESG
Report on our corporate website at:
www.polaris.com/en-us/corporate-responsibility/
NON-GAAP RECONCILIATION OF RESULTS
First
Second
Third
Fourth
First
Second
Third
Fourth
Total
Quarter
Quarter
$127.37
112.35
123.87
116.96
2022
2022
High
$140.93
147.73
139.79
132.50
2021
2021
High
$102.34
94.24
95.21
91.86
$0.64
0.64
0.64
0.64
$2.56
$0.63
0.63
0.63
0.63
$2.52
Low
$94.42
122.67
114.21
100.52
Low
EQ Shareowner Services
1110 Centre Point Curve, Suite 101
Mendota Heights, MN 55120
1-800-468-9716
www.shareowneronline.com
J.C. Weigelt
Vice President of Investor Relations
Polaris Inc.
2100 Highway 55, Medina, MN 55340-9770
763-542-0525
jc.weigelt@polaris.com
August 1993
October 1995
March 2004
September 2011
2 for 1
3 for 2
2 for 1
2 for 1
Sales
Diluted EPS from continuing operations
attributable to Polaris Inc.
Impairment charges
(1)
Loss on sale of businesses
(2)
Restructuring & realignment
(3)
Intangible amortization
(4)
Class action litigation expenses
(5)
Provision for income taxes
Interest expense
Depreciation
Intangible amortization
(4)
Impairment charges
(1)
Loss on sale of businesses
(2)
Restructuring & realignment
(3)
Class action litigation expenses
(5)
Adjusted EPS from continuing operations
attributable to Polaris Inc.
(6)
Net Income from continuing operations
Adjusted EBITDA
Adjusted EBITDA Margin
Twelve months ended
December 31
8,589.0
10.04
(0.01)
—
0.08
0.24
0.05
10.40
603.4
158.0
71.7
214.0
18.8
(0.7)
—
6.2
4.5
1,075.9
7,439.2
7.92
0.12
0.45
0.16
0.28
0.11
9.04
496.6
132.1
44.2
193.4
22.9
7.7
36.8
13.1
9.4
956.2
2022 2021
$
$
$
$
$
$
$
$
$
$
(In Millions, Except Per Share Data: Unaudited)
Adjustments:
(1) Represents impairment charges and subsequent distributions related
to a strategic investment held by the Company
(2) Represents the loss associated with the Company’s divestiture of the
Global Electric Motorcar (GEM) and Taylor-Dunn businesses
(3) Represents adjustments for corporate restructuring, network realign-
ment costs, and supply chain transformation
(4) Represents amortization expense for acquisition-related intangible
assets
(5) Represents adjustments for class action litigation-related expenses
(6) The Company used its estimated statutory tax rate of 23.8% for the
non-GAAP adjustments in 2022 and 2021, except for non-deductible items
12.5% 12.9%

© 2023 Polaris Inc. All rights reserved.
Printed in the USA on paper containing mixed
post-consumer ber.
Polaris Inc.
2100 Highway 55
Medina, MN 55340
763-542-0500
www.polaris.com
