
1
DIIS WORKING PAPER 2013:17
WORKING PAPER
DIIS WORKING PAPER
Decentralization and implementation of
climate change policy in Uganda
Esbern Friis-Hansen, Bernard Bashaasha and
Charles Aben
DIIS Working Paper 2013:17

2
DIIS WORKING PAPER 2013:17
DIIS WORKING PAPER 2013:17
© The authors and DIIS, Copenhagen 2013
Danish Institute for International Studies, DIIS
Østbanegade 117, DK-2100, Copenhagen, Denmark
Ph: +45 32 69 87 87
Fax: +45 32 69 87 00
E-mail: diis@diis.dk
Web: www.diis.dk
Cover Design: Carsten Schiøler
Layout: Allan Lind Jørgensen
Printed in Denmark by Vesterkopi AS
ISBN: 978-87-7605-625-4 (print)
ISBN: 978-87-7605-626-1 (pdf)
Price: DKK 25.00 (VAT included)
DIIS publications can be downloaded
free of charge from www.diis.dk
ESBERN FRIIS-HANSEN
PhD, Seniorforsker, DIIS
efh@diis.dk
BERNARD BASHAASHA
Dr., Principal at College of Agricultural and Environmental
Sciences, Makerere University, Uganda
CHARLES ABEN
PhD Candidate, Dept. of Extension & Innovation Study,
Makerere University, Uganda
DIIS Working Papers make available DIIS researchers’ and
DIIS project partners’ work in progress towards proper
publishing. They may include important documentation
which is not necessarily published elsewhere. DIIS Working
Papers are published under the responsibility of the author
alone. DIIS Working Papers should not be quoted without
the express permission of the author.
Climate Change and Rural Institutions is a four-year
collaborative research programme which explores the
role of district level institutions in providing an enabling
environment for climate change adaptation. The
programme is coordinated by DIIS in collaboration with
partners in Nepal, Uganda, Vietnam and Zambia. The
programme is funded by Danish Research Council for
Development Research, with additional support from the
Climate Change, Agriculture and Food Security Programme
under the CGIAR Partnership.
For more information, please see www.diis.dk/ccri

3
DIIS WORKING PAPER 2013:17
CONTENTS
Preface 4
List of abbreviations 5
1. Introduction 7
1.1 Setting the scene 7
1.2 Study focus 8
1.3 Methodology 8
2. Genesis of climate change in Uganda 8
2.1 Geography of Uganda 8
2.2 Characteristics of climate change in East Africa 10
2.3 Gradual change in weather patterns in Uganda 11
2.4 Extreme climate events in Uganda 13
3. Recent economic, social and political change in Uganda 14
3.1 Economic development 14
3.2 Institutional change 15
3.3 Role of Eexternal Aactors/donors in development and
climate change 16
3.4 Evolution of the political character of the Ugandan state 16
4. Decentralization as unique feature of Uganda 18
4.1 Evolution of local government 18
4.2 Local government capacity to deliver services 18
5. National climate change policies and their implementation modalities 20
5.1 Emergency assistance policy OPM 20
5.2 NAPA 22
5.3 NCCP and implementation framework 23
6. Discussion 25
6.1 Compliance of climate change policy and Decentralization Act? 25
6.2 Political nature of Ugandan state and policy reform 26
6.3 Drivers of climate change policies 27
6.4 Implication of the gap between climate change policies
and decentralization 28
6.5 NCCP: bridging the gap between policy and practice? 29
6.6 Lack of understanding of climate change action by meso-level
institutions 30
7. Bibliography 31
Annex 1 and 2 33-34

4
DIIS WORKING PAPER 2013:17
PREFACE
This working paper is the rst of two working papers that presentings ndings
from the Climate Change and Rural Institutions (CCRI) research program on
how meso-level institutions in Uganda are responding to climate change and
extreme climate events. This working paper analyses national policies that to
support climate change mitigation and adaptation and their implementation
modalities. The second working paper focuses on the meso-level institutional
dynamics of how climate change action inside within as well as outside the
framework of climate change policies. For more information about CCRI,
see http://subweb.diis.dk/sw113176.asp
The CCRI research program undertakes empirical eldwork in Soroti, Amu-
ria and Katakwi districts located in of Teso region, Eeastern Uganda. The
research examines how extreme climate events such as the 2007 oods and
subsequent severe oods and droughts , as well as the gradual change in weath-
er patterns, are affecting meso-level institutions.

5
DIIS WORKING PAPER 2013:17
LIST OF ABBREVIATIONS
CAADP Comprehensive Africa Agricultural Development
CAO Chief Administrative Ofcer
CCD Climate Change Department
CCRI Climate Change and Rural Institutions
CCU Climate Change Unit
CIF Climate Investment Fund
DANIDA Danish Agency for International Development
DDP District Development Plan
DFID Department for International Development
DNA Designated National Authority
DRR Disaster Risk Reduction
DSIP Development Strategy and Investment Plan
EAC East African Community
EC Electoral Commission
EU European Community
FAO Food and Agriculture Organisation
GoU Government of Uganda
GTZ Deutsche Gesellschaft für Technische Zusammenarbeit
ICEDA Integrated Community Education and Development
Association
IGG Inspectorate of Government
INC Initial National Communication
IPPC International Panel
KIDDP Karamoja Integrated Disarmament and Development
Programme
LGDP Local Government Development Plan
LGs Local Government
LRDP Luwero – Rwenzori Development Plan
MAAIF Ministry of Agriculture, Animal Industry and Fisheries
MDAs Ministries, Departments and Agencies
MEA Multilateral Environmental Agreements
MoH Ministry of Health
MOLG Ministry of Local Government

6
DIIS WORKING PAPER 2013:17
MoWE Ministry of Water and Environment
NAPA National Adaptation Plan of Action
NCCAC National Climate Change Advisory Committee
NCCF National Climate Change Focal point
NCCP National Climate Change Policy
NCCPC National Climate Change Policy Committee
NDP National Development Plan
NEPAD New Partnership for African Development
NGOs Non-Governmental Organisations
NUREP Northern Uganda Rehabilitation Programme
NUSAF Northern Uganda Social Action Fund
OPM Prime Minister’s Ofce
PRDP Peace Recovery and Development Plan
SLM sustainable land management
UHRC Uganda Human Rights Commission
UN United Nations
UNCBD Convention on Biological Diversity
UNCCD United Nations Convention to Combat Desertication
UNDP United Nations Development Programme
UNEP United Nations Environmental Programme
UNFCCC United Nations Framework Convention on Climate Change
USAID United States Agency for International Development
USD US $
WB World Bank
WFP World Food Program

DIIS WORKING PAPER 2013:17
7
1. INTRODUCTION
1.1 Setting the scene
The focus of climate change policies and
action in Africa south of the Sahara differs
from the global agenda. While most debate
within the United Nations Framework Con-
vention on Climate Change relates to assess-
ing physical climate change and mechanisms
for mitigation, the main concern of most
African countries is how to adapt to the ef-
fects of climate change. A growing number
of projects addressing climate change adap-
tation and government are formulating new
policies that seek to provide a framework to
guide these activities. Yet, discussion of the
content of and driving forces behind climate
change adaptation in national policies has
been limited. Even less is known about how
such national climate change policies have
been implemented and their institutional set-
ting within the country. This working paper
explores the driving forces behind the formu-
lation of climate change policies in Uganda
and assesses its content and implementation
modalities. The working paper explores the
extent to which there is a gap between policy
and practice at the district and local levels.
Climate change in Uganda is very real factor
in people’s lives. Smallholder farming families
with little or no mechanization, irrigation or
use of seasonal chemical inputs are particu-
larly affected. While extreme climate change
events, such as oods and droughts, are not
a new phenomenon in Uganda, they have
become more frequent during the past dec-
ade. Meanwhile the long established weather
patterns around which farming systems have
evolved have gradually become more uncer-
tain. In combination, these expressions of
climate change are causing already vulnerable
rural people to become even more vulnera-
ble. While small-scale farmers have long ex-
perience in adapting to unpredictable weather
patterns, the type of uncertainty that is as-
sociated with climate change is beyond the
scope of rural people’s capacity to cope with.
They need help from outside the local com-
munity to adapt.
Such assistance has been guided by three
sets of policies that fall under the heading
of climate change. The policy that has been
around the longest is the policy of emergen-
cy assistance, reecting the fact that natural
hazards have existed for far longer than the
climate change agenda. Emergency assistance
policy is anchored in OPM. NAPA, which
came into force in 2008, was the rst policy
that directly addressed the challenges posed
by climate change and for the rst time set
priorities for supporting adaptation efforts.
NAPA is institutionally anchored across a
number of central ministries. The most recent
is the NCCP, which addresses climate change
in a comprehensive manner. The NCCP is in
the process of being accepted by government
and is led by a secretariate located within the
Ministry of Water and Environment.
Local government in Uganda is the gov-
ernance institution that is best suited to assist
farmers in adapting to climate change. Ugan-
da undertook a comprehensive decentraliza-
tion reform in 1993 and has since built up
government units at district and sub-county
level with elected councillors and technical
and administrative staff. In the decade follow-
ing decentralization reform the responsibility
for providing a wide range of services was
devolved from central ministries to the dis-
trict level, including education, health, roads
and agriculture. At the turn of the century
a second wave of reform took place aimed
at ‘deepening democracy’ and leading to the
establishment of new local institutions that
linked users at the primary service units to
local government institutions with the aim

8
DIIS WORKING PAPER 2013:17
of enhancing social accountability. However,
during the past decade the momentum of re-
form has run out of steam and the national
political agenda has shifted towards recentral-
ization and a return to neo-patrimonial gov-
ernance.
In spite of the fact that decentralised gov-
ernance structures would be the obvious
choice as an implementation mechanism for
creating an enabling environment supporting
rural people to adapt to climate change, until
now climate change policies have been imple-
mented through central ministries and NGOs
using project-based parallel structures.
1.2 Study focus
The working paper seeks to understand why
climate change policies have remained cen-
tralized till now by analysing the nature of the
state and government of Uganda. In particu-
lar, the paper examines the extent to which
climate change policies are being implement-
ed through decentralized political and admin-
istrative structures in Uganda and how. Ques-
tions asked in the two working papers include
the following:
• Are Uganda’s climate change policies con-
sistent with the Decentralization Act?
• Who is driving the formulation of climate
change policies, and how is this affecting
their implementation modalities?
• To what extent can the changing nature of
the Ugandan state explain a gap between
policy and practice?
• What is the implication of decoupling cli-
mate change policies and local government?
1.3 Methodology
Analysis of national decentralization and cli-
mate change policies is based on a literature
review combined with interviews of key in-
formants at the Climate Change Unit and
OPM. The geographical description and anal-
ysis of national trends in precipitation and
temperature are based on a literature review
of scientic reports and policy documents.
The analysis of climate change action at
the local government level is based on pri-
mary eldwork in Soroti, Amuria and Ka-
takwi districts, Teso region. The working
paper draws on information in unpublished
reports from three CCRI workshops with
local government politicians and technical
staff held in 2012 and 2013. Two workshops,
held in Soroti and Amuria districts, involved
25-30 participants representing politicians
(district councillors), chief administrative of-
cers (CAO) and technical staff from most
relevant departments. The third workshop
involved participants from nine districts in
Teso and Karamoja regions, including CAU,
the chairman of the district council (LC5
chair), district NAADS coordinators (DNC)
and district environmental ofcers (DEO).
In additional the section draws on thirty in-
depth interviews with key informants from
Soroti, Amuria and Katakwi districts.
Available studies from Teso compliment
the CCRI eldwork, including two recent cli-
mate change adaptation studies carried out by
students from Makerere University (Kizauzi
et al. 2012) and LIFE (Epilo, 2011).
2. GENESIS OF CLIMATE CHANGE
IN UGANDA
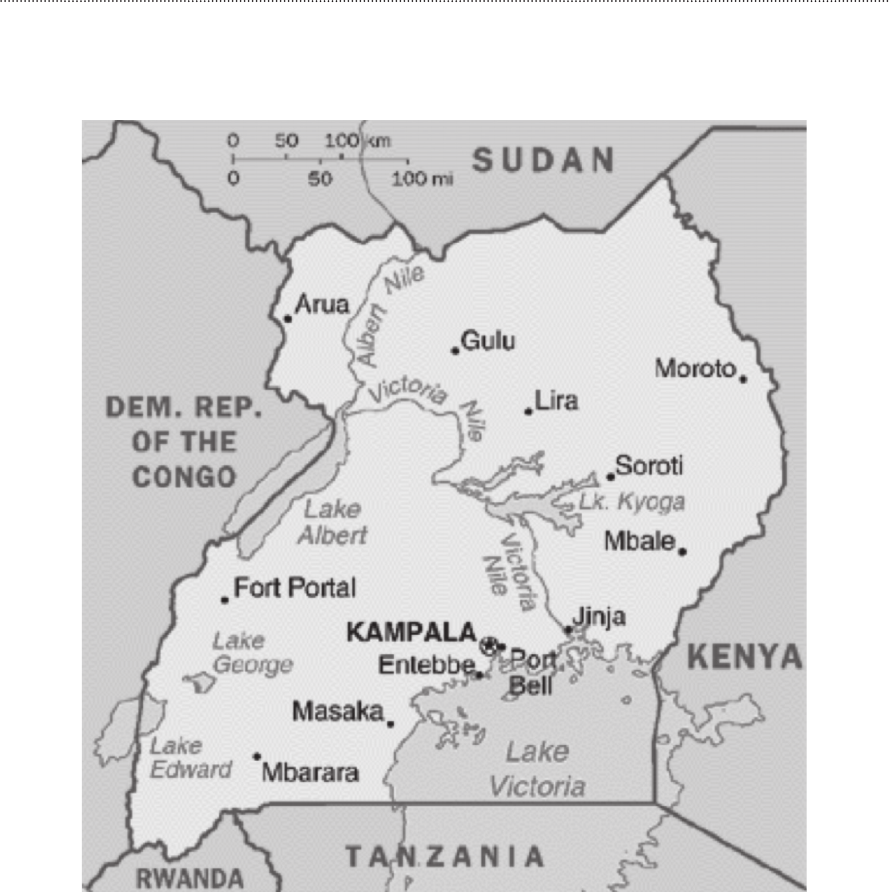
2.1 Geography of Uganda
Uganda lies across the equator and occupies
241,038 square kilometres, of which open
water and swamps constitute 43,941 square
kilometres or 18.2% of the total area. Most
9
DIIS WORKING PAPER 2013:17
parts of the country are at an average height
of 1,200 metres above sea level. The lowest
altitude is 620m (on the Albert Nile) and
the highest altitude (Mt Ruwenzori Peak) is
5,110m above sea level. The climate is equa-
torial, with moderate, humid and hot climatic
conditions throughout the year.
Uganda experiences a wet climate with two
distinct rainy seasons in a year in the south-
ern parts of the country, which merge into
one rainy season further north of the equa-
tor. The rainy period between October to De-
cember is described as the long period, and
the short period is between March and May
(McSweeney et al., 2008:1). The areas around
Lake Victoria are wetter than other areas of
the country and receive more than 2,100 mil-
limetres of rain annually, whereas the arid and
semi-arid north receives 500 millimetres per
year, thinning out to as low as 200 millime-
tres in the north-eastern corner (Encyclopaedia
of Earth). Average temperatures in the cool-
er regions of the southwest are below 20°C,
and reach 25°C in the northernmost parts
of the country, also considered the warmest
(McSweeney et al, 2008:1).
Figure 1. Map of Uganda

10
DIIS WORKING PAPER 2013:17
2.2 Characteristics of climate change
in East Africa
Climate change in East Africa manifests it-
self as two phenomena: (i) gradual change
of mean temperature, mean precipitation and
variation in precipitation; and (ii) increases in
the intensity and frequency of extreme cli-
mate events, such as droughts, oods, heat
waves and lightning (GoU NAPA, 2007:xiv;
GoU Climate Policy Paper, 2012:5). An analy-
sis of data from the International Emergency
Disaster Database by Shongwe et al. revealed
that there has also been an increase in the
number of reported hydro-meteorological
disasters in the East Africa region, from an
average of less than three events per year in
the 1980s, to over seven events per year in the
1990s, and almost ten events per year from
2000 to 2006, with a particular increase in
oods, from average of less than one event
per year in the 1980s to seven events per
year between 2000 and 2006 (Shongwe et al.
2010:3719).
Uganda has experienced an increase in the
frequency of droughts, with seven droughts
reported between 1991 and 2000. Also the
frequency of anomalously strong rainfall
causing oods has increased (Shongwe et al,
2010:3719). A total of 4.11 million people in
Uganda have been affected by climate-related
disasters of different kinds, such as oods,
disease outbreaks and droughts, since 1979
Table 1. Recent major climate hazards in Uganda
Source: Climate Policy Paper, 2012 and Climate Change Update 2013.
Drought
Landslide (Mass movement)
Drought
Flood
Drought
Drought
Drought
Drought
Epidemic
Flood
Drought
Drought
April-August
2013
March 2010
July 2008
August 2007
March 2005
June 2002
August 1999
January 1998
November 1997
November 1997
December 1987
1979
>500,000
338
1,100,000
718,045
600,000
655,000
700,000
126,000
100,000
153,500
600,000
500,000
Number of
People
Affected
Type of Disaster Date
DIIS WORKING PAPER 2013:17
11
(Heinrich Böller Foundation, 2010:22). In the
past, up to 34 per cent of crop damage in
Uganda has been caused by climate-induced
stimuli such as a lack of rainfall, crop diseases
and insect damage (Hisali et al., 2011:1245).
Hepworth and Goulden (2008) state that
oods in Uganda during 1961/62, 1997/98
and 2007 caused widespread infrastructural
damage, displacement and the destruction
of livelihood assets. Droughts have taken a
signicant toll with, for example, 1.8 million
people affected through increased malnutri-
tion, poverty, illness, asset loss and migra-
tion in the 1993/94 event (Hepworth and
Goulden, 2008:10).
2.3 Gradual change in weather
patterns in Uganda
The availability and accessibility of climate
data are major challenges in Uganda. Most
of the climate data produced in the country
does not meet the required standards due to
the irregular monitoring of collection equip-
ment, the few stations and poor station dis-
tribution. There is also a signicant lack of
historical meteorological data in Uganda. For
these reasons, as well as the limited modelling
work that has been done and the complex
interactions that exist between land cover,
oceanographic changes and climate, Uganda’s
climate projections are thus still very unrelia-
ble (GoU Climate Policy Paper, 2012:14-15).
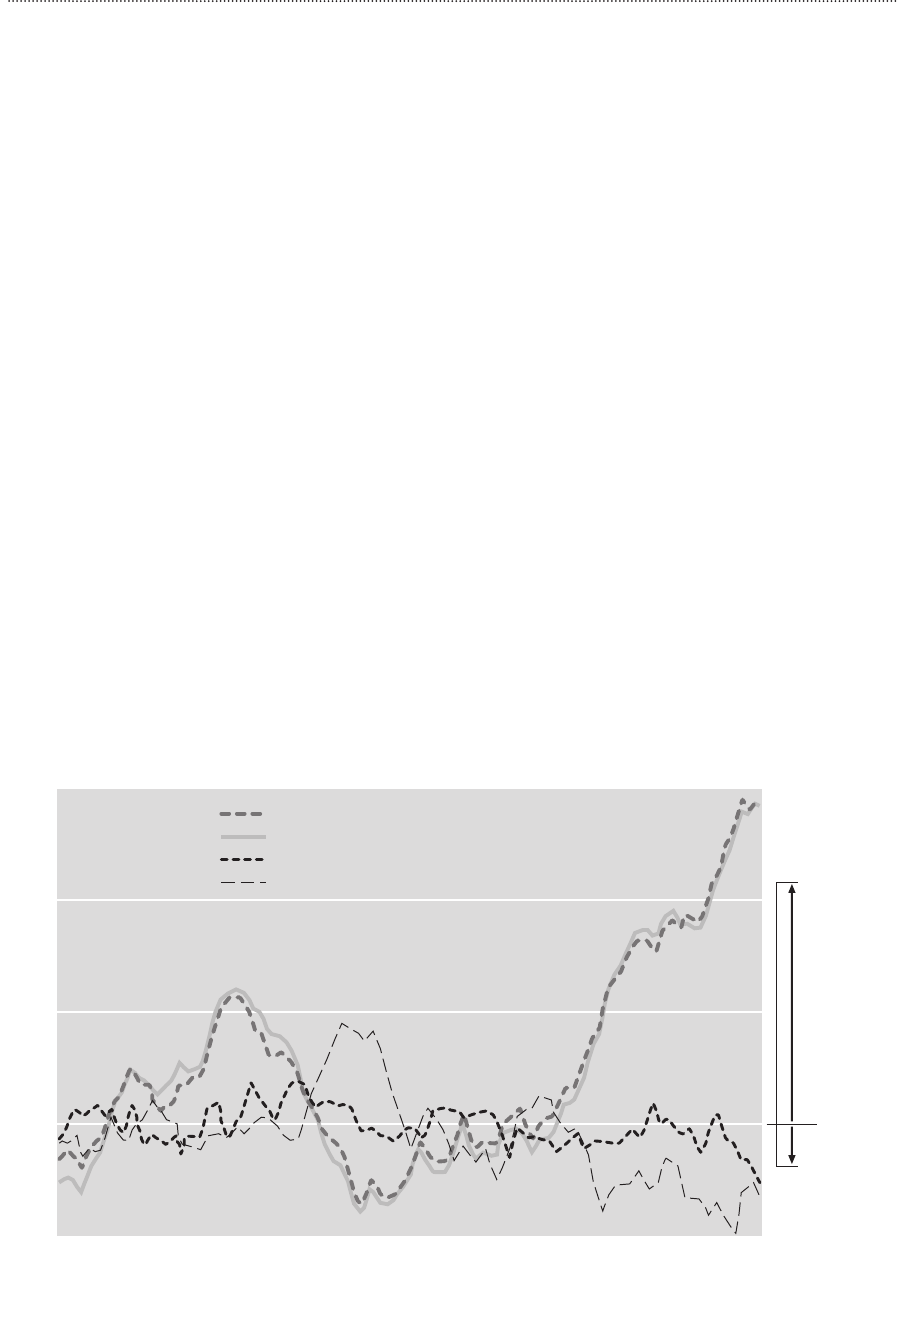
Figure 2 show time series of rainfall (ten-
year running mean) from 1900 to 2009. The
table indicates that “2000–2009 rainfall has
been, on average, about 8 per cent lower (-0.65
standard deviation) than rainfall between 1920
and 1969. Although the June–September rain-
fall appears to have been declining for a longer
period, the March–June decline has only oc-
curred recently.” (USGS 2012:2)
Figure 2. Trends in rainfall and temperature in Uganda
*
* Smoothed 1900-2009 March-June and June-September rainfall and air temperature time series for crop-growing
regions
+ 0.8
degrees
Celsius
- 8
percent
rainfall
Standard deviations
3
2
1
0
-1
1900
1955
2009
March-June temperature
June-September temperature
March-June rainfall
June-September rainfall

12
DIIS WORKING PAPER 2013:17
Lyon and DeWitt conclude that since 1999
the East Africa region has experienced a de-
cline in precipitation during the long rainy
season, which has continued since (Lyon and
DeWItt, 2012:4). Funk et al. (2008) state that
East Africa has seen precipitation decline
since 1979 (Funk et al., 2008:11082). Fur-
thermore, overall future climate projections
for East Africa show scientic disagreement
over total rainfall. Funk et al. (2008) suggest
that East Africa will expect a decline in total
rainfall, at least until 2030. The authors use
climate relationship data as opposed to raw
simulations (Funk et al., 2008:11083, 11085).
Conversely, the IPCC report Region Climate
Projections suggests that there is likely to be an
increase in annual mean rainfall in the future
(Christensen, 2007:850). There are, howev-
er, disagreements among scientists. Accord-
ing to McSweeney et al. (2008) observations
of rainfall over Uganda do show statistically
signicant decreasing trends in annual and
March to May rainfall (McSweeney et al.
2008:2).
According to a Climate Policy Paper
(2012), prepared by the Climate Change Unit
within the Ministry of Water and Environ-
ment in Uganda, changes have been observed
in rainfall patterns in Uganda. Rainfall has
become lower, more unreliable and uneven-
ly distributed, and where rain does fall, it is
heavier and more violent. In general, wet-
ter areas are tending to become wetter and
droughts more frequent. The main concern
is not the total amount of rain, but instead
its distribution, seasonality and intensity, the
policy paper concludes (GoU Climate Policy
Paper, 2012:5).
Trends in the variation in precipitation
based on daily rainfall data are, however,
mixed. McSweeney writes that there is no
signicant trend towards heavier and more
extreme rainfall events (McSweeney et al.
2008:2). Others report that rainfall in Ugan-
da has become more unreliable and uneven-
ly distributed (IGAD, 2010). An increase in
the intensities and frequency of heavy rains,
oods and landslides in highland areas, as
well as outbreaks of associated waterborne
diseases associated with the oods, were
also observed and conrmed by a Participa-
tory Rural Appraisal (NEMA, 2008). Recent
years have seen erratic onsets and ends to the
rainy seasons, and rainfall has been heavier
and more violent (GoU, 2007; MWE, 2010).
These are being followed by long droughts,
which are becoming more and more fre-
quent. El Nino Southern Oscillation (ENSO)
events have also been observed to be shorter
and more irregular (IGAD, 2010).
Shongwe et al. 2011 carried out a study
of possible changes in the intensity of mean
and extreme precipitation rates in East Afri-
ca. They state that ‘Evidence in support of
a future positive shift in the rainfall distri-
bution under global warming has been pre-
sented for most models, with only a single
model simulating a trend to less rain’. They
also conclude that ‘It is physically reasona-
ble, therefore, to conclude from this ocean–
atmosphere coupling pattern that global
warming could enhance the likelihood of
anomalously strong short rains’ (Shongwe et
al, 2010:3728f).
Since 2000, extreme rainfall conditions
have been regularly experienced in eastern
Uganda, where there has been an increase
of approximately 1500 mm in precipitation
in the December to January rainy season
(NEMA, 2008). Teso region has particular-
ly been affected by these trends. According
to the Uganda Department of Meteorology,
rainfall seasons have become more variable as
depicted by the analysis of cumulative average
ten-day totals. Although western, central and
northern Uganda experienced good rainfall,

DIIS WORKING PAPER 2013:17
13
the eastern region experienced dr-oaughts in
1997, showing the complexity of these var-
iations.
2.4 Extreme climate events in
Uganda
Recent droughts in Uganda. The western, north-
ern, and north-eastern regions have been ex-
periencing more frequent and longer-lasting
droughts than seen historically (GoU, 2007).
Between 1991 and 2000 there were seven
droughts in the Karamoja region, and the
years 2001, 2002, 2005 and 2008 also saw ma-
jor droughts (GoU, 2002; GoU, 2007; EM-
DAT, 2011). While there have always been
droughts in Uganda, evidence suggests they
are becoming more frequent and more severe
(IGAD, 2010). An example of such a severe
drought was the 2000 widespread drought in
the eastern and northern regions, with Arua
district being worst affected, although the
western region experienced good seasons.
The increased frequency and duration of
droughts is the most signicant climate-re-
lated change being experienced in Uganda
(GoU, 2007; MWE, 2010). See Figure 3.
Recent oods in Uganda. Uganda experienced
above normal rainfall in 1998 (an El Nino
year), resulting in oods that had serious neg-
ative impacts on several sectors, particularly
health and transport. The ooding of 1998
was followed by a severe drought in western
region, with Mbarara district being most af-
fected. From 2007 to date, the Teso sub-re-
gion in the north-eastern part of the country
has experienced major oods in November
that have continued to be intermittently fol-
lowed by long droughts and oods during
traditional planting seasons. This has virtually
derailed the planting strategies in the sub-re-
gion. These analyses show that the impact
of climate variability and climate change has
not been consistent across the whole country,
thereby posing serious implications for the
efciency of the national-level response. In
Figure 3. Drought occurrences in Uganda 1911-2000
Source: GoU 2007
Frequency of drought
Decades
1921-301911-20 1931-40 1941-50 1951-60 1961-70 1971-80 1981-90 1991-00
8
7
6
5
4
3
2
1
0
Decade
1911-20
1921-30
1931-40
1941-50
1951-60
1961-70
1971-88
1981-90
1991-00
Frequency
of drought
1
1
1
0
1
0
3
2
7

14
DIIS WORKING PAPER 2013:17
September 2010, further ood disasters hit
the Teso region, leading to rotting cassava,
sweet potato tubers and groundnuts (GoU
Climate Policy Paper, 2012:13).
3. RECENT ECONOMIC, SOCIAL
AND POLITICAL CHANGE IN
UGANDA
3.1 Economic development
Uganda’s economy performed remarkably
well from independence to 1970, when the
country experienced relative political stability.
Ination was maintained at an average of 3
per cent per annum, real GDP grew by 5.2
per cent per annum, and scal decits rarely
exceeded 2.5 per cent of GDP. Real interest
rates were positive for most of the period,
the current account balance was in surplus,
and domestic savings averaged 15 per cent
of GDP. In the same period, the growth in
exports averaged 5 per cent per annum while
that of imports was 6.2 per cent.
From 1971 to 1979, Uganda’s economy
was seriously damaged by economic misman-
agement and civil conicts that negatively im-
pacted on the gains made during the previous
periods. The rate of ination averaged 30 per
cent per annum between 1970 and 1980, as
the government nanced public expenditure
through bank borrowing. During the same
period, GDP declined at 1.6 per cent per an-
num, exports by 8.5 per cent and imports by
9.8 per cent. This led to a decline in export
revenue, which subsequently impacted nega-
tively on the balance of payments and exter-
nal debt positions.
Growth in GDP was temporally restored
between 1981 and 1983, when an average
annual growth rate of 5.6 per cent was reg-
istered. Ination declined from 111 per cent
to 25 per cent. Overall budget decits were
reduced from 2.8 per cent of GDP in 1981 to
0.6 per cent in 1983 but rose to 11.9 per cent
of GDP in 1984. Thereafter, the civil strife
and political instability that ensued, especial-
ly in the central part of the country, negated
the achievements made. As a result, negative
GDP growth rates were recorded during the
period between 1984 and 1986.
In 1987, the government launched a
minimum Economic Recovery Programme
(ERP) followed by a series of other reforms
aimed at restoring macroeconomic stabili-
ty to provide a favourable environment for
economic growth and private-sector devel-
opment. The key reforms included a cur-
rency reform, changes in tax and scal pol-
icy geared towards improving revenues and
restraining expansion in Government ex-
penditures, while maintaining a strong focus
on economic recovery and growth. Between
1987 and 1996, GDP grew at an average an-
nual rate of 6.5 per cent, translating into 3.4
per cent growth in per capita terms. The de-
cline in monetary growth led to a substantial
reduction in ination.
Over the period 1997/1998 to 2000/2001,
GDP growth averaged 7.2 per cent per an-
num. Between 2000/01 and 2003/04 it aver-
aged 6.8 per cent and between 2004/05 and
2007/08, it was 8 per cent. As a result of
the global recession, which reduced the de-
mand for Uganda’s exports to Europe and
America, GDP growth declined slightly in
2008/09 to 6.2 per cent at basic prices but re-
covered in 2011/12. The scal decit stood
at 10.2 per cent and 7.9 per cent of GDP
on average during 2000/01 to 2003/04 and
2004/05 to 2007/2008respectively. Ination
was kept in single digits for most of these
periods, foreign reserves covered at least ve
months of imports, and exchange rates were
competitive.

DIIS WORKING PAPER 2013:17
15
There has been a signicant increase in both
foreign and local investment ows into the
economy. As a percentage of GDP, pri-
vate investment rose from 12.2 per cent in
2000/2001 to 20.6 per cent in 2006/2007.
Public investment averaged 5.1 per cent of
GDP over the same period but has been
more or less stagnant over the last decade.
Furthermore, the investment pattern of re-
cent years shows rising private construction,
especially of residential buildings, modest-
ly increasing investment in machinery and
equipment, and low levels of public con-
struction. This indicates issues with low
capital investment in industries, services and
labour productivity.
The global downturn has to some extent
negatively inuenced investments through
reduced private remittances, foreign direct
investment and loans, although recent global
economic trends, coupled with the resilience
of Uganda’s economy, have subdued the in-
itially perceived risks. Foreign Direct Invest-
ment (FDI) dropped from 5.3 per cent of
GDP in 2007/2008 to 4.6 per cent GDP in
2008/09 and was projected to remain slow in
2009/2010. However, the anticipated nega-
tive effects on aid were marginal, as most de-
velopment partners continued to meet their
obligations.
Uganda’s trade decit has been widening
despite improvements in the composition and
value of exports. The trade decit as a per-
centage of GDP declined from an annual av-
erage of 12.9 per cent for the period 2000/01
to 2003/2004 to 13.5 per cent for the period
2004/2005 to 2007/2008. The balance of
payments has also been unfavourable, with
a deteriorating trend in recent years. These
results could partly be due to lower demand
for Uganda’s exports in advanced economies,
although this is partly being compensated for
by increased regional exports.
3.2 Institutional change
Uganda has established a number of institu-
tions to enable effective public-sector man-
agement. These institutions are responsible
for policy formulation and implementation
and public service delivery. However, there
are opportunities to improve the structure
of the public sector, in particular with regard
to the allocation of roles and responsibilities
in service delivery. Most of the public insti-
tutions were formed in the early 1960s, be-
fore the liberalization policies of the 1990s.
The organization of some public institutions
is not suitable and impedes the delivery of
policy, regulation and public services. Oth-
er issues include overlaps and duplication
of mandates, weak oversight of institutions,
poor corporate governance and weak regula-
tory frameworks. The civil servants are still
poorly remunerated, and this limits their pro-
ductivity. Furthermore, the coordination of
public-sector institutions is still a challenge.
The progress made in both public admin-
istration and public-sector management is be-
ing hampered by corruption at various levels
of government. Government recognizes the
devastating socio–economic effects of cor-
ruption and is committed to taking corrective
and deterrent measures in order to fully real-
ize the potential for improving social and eco-
nomic conditions. Uganda ranks 130
th
out of
180 countries on Transparency Internation-
als’ 2009 Corruption Perception Index, while
many African countries rank better (Tanzania
126, Zambia 99, Swaziland 79, South Africa
56, and Botswana 37).
In order to enhance accountability in gov-
ernment, the accountability sector was estab-
lished in 2007 with the goal of promoting,
supervising and implementing accountability
systems. The sector comprises the Ministry
of Finance, Planning and Economic Devel-
opment, the Inspectorate of Government,

16
DIIS WORKING PAPER 2013:17
the Ofce of the Auditor General, the Di-
rectorate of Ethics and Integrity, the Ministry
of Public Service – Inspection, the Ministry
of Local Government, the Public Procure-
ment and Disposal of Public Assets Au-
thority, the Uganda Bureau of Statistics, the
Uganda Revenue Authority and development
partners. There is also a Stakeholders Forum
in which civil-society views are presented
and addressed. Civil society includes private
business, media, anti–corruption NGOs and
community groups, all of which play a vital
role in representing the views and experienc-
es of public service beneciaries and holding
public ofcials to account.
The legal, policy and regulatory framework
that guides the accountability sector includes
the Budget Act 2001, the Public Finance and
Accountability Act 2003, the National Audit
Act 2008 , the Leadership Code Act 2002, the
National Records and Archives Act 2001, the
Public Procurement and Disposal of Public
Assets Act 2003, and the Access to Informa-
tion Act 2005. Other laws pending legislation
include the Anti-Money Laundering Bill, the
Anti-Corruption Bill 2008, and the Whistle
Blowers’ Bill. A special court has also been
established to try corruption cases.
3.3 Role of external actors/donors in
development and climate change
The government of Uganda is still unable to
balance its budget and continues to depend
on external budget support, although the lev-
el of support is declining. Budget support in
the form of grants and concessionary loans
is projected to be US$ 281.3 million, equiva-
lent to Shs 734.1 billion, during FY 2012/13.
Budget support is projected to decrease mar-
ginally in US dollar terms in FY 2013/14 to
US$ 247.7 million or Shs 685 billion before
declining further over the remaining period
to about US $ 182.1 million or Sh 493.3 bil-
lion by 2012/17. The largest support received
under this mode of external nancing comes
from the World Bank Poverty Support Credit
(PRSC) of USD 100 million, followed by UK
and EU general budget support equivalent to
USD 30 million and USD 20 million respec-
tively.
At the same time, next year project support
disbursements are projected at US$ 745.7
million, equivalent to Shs 1,945.8 billion,
which will further rise to US$ 794.2 million
or Shs 2,196.9 billion during 2013/14. Project
support is projected to decline the follow-
ing three years and to be US$ 402.9 million,
or Shs 1,091 billion during the last year of
the Medium Term Expenditure Framework
(MTEF). The major benetting sectors are
works and transport, education, public man-
agement and health.
Meanwhile, amortization of external debt
is projected at US$ 96 million, equivalent to
Shs 250.4 billion in 2012/13. The level of ex-
ternal debt repayments is projected to remain
almost the same in US dollar terms over the
medium term. Net external debt repayments
are higher than the amortization schedules set
out above due to payments of arrears. Amor-
tization on domestic debt is projected at Shs
9.7 billion in each of the next ve years.
3.4 Evolution of the political
character of the Ugandan state
A number of democratic institutions have
been put in place in line with the 1995 con-
stitution. The three arms of government,
namely the legislature, the executive and the
judiciary, are now in place and functioning, al-
beit with varying degrees of respect for each
other’s constitutional mandates. Parliament
continues to exercise its constitutional man-
date and has strengthened a number of insti-

DIIS WORKING PAPER 2013:17
17
tutions for promoting democracy and good
governance including the Electoral Commis-
sion (EC), the Inspectorate of Government
(IGG), the Auditor General (with enhanced
powers) and the Uganda Human Rights
Commission (UHRC), among others.
However, the country’s culture of consti-
tutionalism is not improving fast, and many
of the institutions established in the legisla-
tive, executive and judicial branches of gov-
ernment are struggling to fully embrace the
ideals, principles and practices of democracy.
The media has been liberalized and is relative-
ly free, with both the print and electronic me-
dia providing citizens with ample opportuni-
ties to express their views on a wide range of
issues that affect their lives. At the same time,
Uganda has seen the dramatic emergence of
non-governmental and civil-society organiza-
tions willing and able to engage the arms of
government in policy debates and advocacy
of democracy and good political governance,
albeit with challenges in the policy and reg-
ulatory framework. However, in general the
citizen body is not yet empowered enough to
engage effectively in demanding their rights
and to insist that these institutions meet their
obligations.
The Ugandan state supported a series of
economic and governance reforms during
the 1990s carried out in close collaboration
with international aid agencies led by the
World Bank. A high level of commitment
by the president and the wider Ugandan po-
litical establishment, combined with donor
support, was crucial for the initial success of
these governance reforms. This combination
enabled the strengthening of ‘technocratic or
bureaucratic elites with some degree of in-
sulation from political and societal interests
through the creation of specialised, semi-au-
tonomous agencies responsible for reform
implementation’ (Robinson, 2006:13).
At the turn of the century, the reform pro-
cess in Uganda was viewed by World Bank
and international observers as one of the
most successful in Africa. However, over the
past decade the initial success in decentraliz-
ing and reforming the public sector has been
gradually undermined, leading to a reversal
of development and reform outcomes. While
national political commitment was an essen-
tial prerequisite for initiating reform, the ab-
sence of such political commitment became
a source of vulnerability for the reform in a
political culture with a powerful legacy of au-
thoritarianism and personal rule.
‘The principal explanation for stalled re-
form or reversals lies in the imperative of
preserving the institutional foundations of
neo-patrimonial politics’ (Robinson, 2006:13).
Over the past decade the politics of regime
maintenance in Uganda has prevailed over
development objectives and the strengthen-
ing of local government structures. As the
success of the reforms was increasingly at-
tributed to the semi-autonomous institutions
responsible for implementing governance
reforms (e.g. the NAADS secretariat) and
to local government structures, they became
susceptible to political manipulation from
central government. Over the past decade the
politics of regime maintenance has increas-
ingly become associated with neo-patrimoni-
al rule and re-centralization, challenging the
sustainability of successful decentralization
reforms.
The reversal of the decentralization reform
in Uganda has been explained by its reliance
on the personal commitment of President
Museveni over an extended time period and
the absence of a broader political constitu-
ency to ensure its sustainability (Robinson,
2006). A contributing factor to the erosion of
the commitment to the decentralized imple-
mentation of policy reform may be the shift

18
DIIS WORKING PAPER 2013:17
to multi-party elections in 2005. Increased
competition in multiparty elections in 2007
and 2011 has increased the importance of at-
tributing success for development outcomes.
This may ‘deepen rather than erode patrimo-
nial politics as newly mobilised constituencies
seek to access the benets that were formerly
the exclusive preserve of politicians and of-
cials associated with the NRM Movement’
(Robinson, 2006:12).
The political base of the NRM movement
has narrowed over the past decade, with
strong personal concentration power in the
hands of the President and a disproportion-
ate share of top political positions and civ-
il service appointments going to Ugandans
with strong kinship roots in the west of the
country (Robinson, 2006). Over the past dec-
ade Uganda has thus transformed itself from
one of countries in Africa that was most
closely associated with the type of structural
reforms supported by World Bank and inter-
national development agencies to a country
based on the type of neo-patrimonial poli-
tics commonly found in many other African
states (Hickey 2003).
4.
DECENTRALIZATION AS
UNIQUE FEATURE OF UGANDA
4.1 Evolution of local government
In 1993 in Uganda the Decentralization Act
was passed through parliament as an instru-
ment to deliver sub-national development
and to bring services closer to the people.
Decentralization envisioned good govern-
ance, democratic participation and control of
decision-making by local communities. Under
this policy, the following functions were de-
volved to local government: planning, budg-
ets, administration, scal management and
control, and administration of justice in local
council courts.
Local government functions through a
unied system of elected authorities at var-
ious levels, ranging from the village to the
city or district. The responsibility for local
planning, budgeting and implementation lies
primarily with the district/municipality and
sub-county/town council. The number of
districts with approved three-year develop-
ment plans increased from three in 1997 to
all the 80 districts that existed in 2009. This is
an indication that local government capacity
increased during this period. In connection
with national elections in 2011, the number
of districts was increased to 112. While creat-
ing new districts is popular among the people
living in the district and result in more votes
for the government, most technical observers
argue that it has resulted in increased expend-
iture on public administration (UNCDF).
4.2 Local government capacity to
deliver services
There has been progress in institutional and
human resource capacities in local govern-
ment. Under the LGDP, the government
designed and implemented a capacity-build-
ing programme for local government, which
has led to improvements in service delivery.
However, there are still gaps in stafng levels
(at 65 per cent), which affects service deliv-
ery. The most affected sectors include health,
agriculture and engineering, which have failed
to attract, deploy or retain skilled personnel.
In spite of the introduction of equalization
grants to bring disadvantaged local govern-
ment to the level of service delivery com-
parable to the rest of the country, regional
imbalances still exist. This is demonstrated
simply by disparities in poverty levels and so-
cial development indictors. While nationally

DIIS WORKING PAPER 2013:17
19
the proportion of the population below the
poverty line is 31 per cent, the incidence f
poverty is highest in the Northern region at
66 per cent, followed by the Eastern at 46.8
per cent, Western at 34.4 per cent and Central
at 27.2 per cent. The high incidence of pov-
erty in the north is attributed to the insurgen-
cy, which disrupted economic activities in the
northern and eastern parts of the country.
Gender inequalities are more pronounced
in the post-conict areas of the north than
in the rest of the country. Displacement and
resettlement have left many women with-
out any access to land. Conict has brought
about a breakdown in traditional household
roles whereby women have had to become
primary breadwinners, although they lack the
necessary skills. Many women and children
have been severely traumatized by the effects
of conict. Disruption of social services has
led to worse social outcomes, lower than na-
tional averages, in literacy, malnutrition, ma-
ternal mortality and fertility, among others.
Local government bodies (LGs) are funded
through central government grant transfers,
local revenue and borrowing. In addition,
many LGs access donations from devel-
opment partners. The Constitution of the
Republic of Uganda provides for three cat-
egories of grants, namely unconditional, con-
ditional and equalization. The Constitution
also gives powers to local government to col-
lect some tax and non-tax revenues. All these
sources are operations, although at different
levels of contribution to LG budgets. LGs
have powers to collect property taxes, but few
collect it effectively, and it is signicant only
in urban areas. Various local fees, licenses and
other minor revenues are collected.
The unconditional grants are at the dis-
cretion of LGs, but the largest percentage is
used to pay salaries. The conditional grants
are earmarked for specic development and
recurrent activities of national importance,
whereas the equalization grants are extended
to new LGs and those that are disadvantaged.
The multiplicity of fund transfer mecha-
nisms is a growing concern of local govern-
ment. Many of these mechanisms were not
well adapted to the decentralized framework,
which resulted in management and reporting
challenges. In addition, there were concerns
over the different designs and conditionalities
of the different grants.
To address these challenges, the govern-
ment introduced the Fiscal Decentralization
Strategy (FDS), which allows LGs some exi-
bility and/or discretion to reallocate resources
between and within sectors during planning
and budgetary processes. While a lot has been
achieved since the FDS was introduced, it has
not been fully embraced. Most LG budgets
still comprise of more than 80 per cent of
conditional grants.
To address regional and district imbalanc-
es, a number of afrmative action plans have
been implemented at sub-national levels with
some degree of success, including the North-
ern Uganda Rehabilitation Programmes
(NUREP) I & II and the Northern Uganda
Social Action Fund (NUSAF), the Karamoja
Integrated Disarmament and Development
Programme (KIDDP) and extensions of
equalization grants to address the imbalances
between districts. The government has devel-
oped and is implementing the Peace Recovery
ad Development Plan (PRDP) for northern
and eastern Uganda. The Luwero–Rwenzori
Development Plan (LRDP) is also being de-
veloped.
The PRDP will consolidate the achieve-
ments of previous afrmative action pro-
grammes in the region and enable the system-
atic rehabilitation and long-term recovery of
the post-conict north of the country. This
will reopen the area to meaningful produc-

20
DIIS WORKING PAPER 2013:17
tion, as well as reinstating democratic govern-
ance in the area.
Available evidence (Bashaasha et al. 2010)
so far suggests that devolution of responsi-
bility contributes to greater compliance with
some natural resource management (NRM)
requirements. In particular, the involvement
of locally accountable and representative
authorities in enacting and enforcing NRM
requirements appears critical for the legit-
imacy and success of such regulation. With
regard to forest conservation, comparison of
centralized and decentralized forms of for-
est management reveals ambiguous results.
There is evidence that forest conditions in
some areas have declined following decen-
tralization. The Bashaasha et al. estimates of
the cost of natural resource degradation in
Uganda are as high as 17 per cent of gross
national income (GNI) per year, of which 6
per cent consists of forest degradation and
11 per cent soil degradation.
5. NATIONAL CLIMATE CHANGE
POLICIES AND THEIR
IMPLEMENTATION MODALITIES
5.1 Emergency assistance policy
OPM
Disasters or emergencies refer to a series of
events that give rise to casualties, damage or
a loss of property, infrastructure, essential
services or means of livelihood on a scale
that is beyond the normal capacity of the
communities affected to cope with unaided.
According to the NDP, the most frequent
disasters in Uganda include displacement
of persons, famine, earthquakes, epidemics,
livestock and crop diseases, oods and land-
slides, and technological accidents, among
others. Many on the list can clearly be traced
back to climate change as either a direct or
indirect cause.
Disasters affect many people in Uganda,
and emergency assistance is therefore nat-
urally a highly sensitive political issue. The
NDP also reports that between 2000 and
2005, approximately 65.7 per cent of house-
holds in Uganda experienced at least one type
of disaster (UNHS 2005/06). The regional
distribution is shown in gure 4 below. The
tableshows that the Northern region was the
most severely affected because of the civil
strife. Here emergency assistance is associat-
ed with the temporary resettlement of affect-
ed people and refugees in camps, adding fur-
ther to the political sensitivity of emergency
assistance.
Uganda’s current disaster management
policy was formulated in the early 1990s. It
has three objectives: rst, to reduce the socio-
economic and environmental impacts of dis-
asters on people and the economy; secondly,
to address the causes of disasters. The emer-
gency policy distinguishes between ‘natural’
and human-induced causes of disaster; and
thirdly, to promote and uphold the rights of
refugees.
Because of the highly politically sensitive
nature of emergency assistance, the responsi-
bility for its coordination has been centralized
in OPM, represented by a junior minister.
The implementation of disaster management
policy has been devolved to seven regional
disaster coordination ofces that are linked
to disaster risk reduction committees (DRR)
at the district and sub-district levels. These in-
stitutions function in parallel with local gov-
ernment institutional structures and are not
integrated into the ongoing activities of local
government.
Qualitative interviews with local govern-
ment staff and other key informants in So-
roti, Amuria and Katakwi districts reveal that

21
DIIS WORKING PAPER 2013:17
the DDR institutions are dormant and are
only activated when there is an ofcially de-
clared emergency. Last time the DDRs were
activated in the three districts was during and
in the immediate aftermath of the 2007 ood
in Teso region. During this period the DDR
assisted by collecting information and mobi-
lizing local people for the emergency agencies
led by UNHCR and WFP.
As shown in table 1 (section 2) Teso has
experienced a series of oods and droughts
since 2007 that have been less severe in mag-
nitude and the number of people affected.
For this reason these extreme climate change
events were not ofcially declared emergen-
cies by OPM. As a consequence the UN
emergency agencies were active in these later
extreme events and the DDRs have remained
dormant.
Uganda’s emergency response has by and
large been one of response. The absence of
a credible early warning system has further
limited preventive activities prior to the oc-
currence of disasters. The UNDP is currently
working with the OPM on disaster risk reduc-
tion and management, as well as sponsoring
a 3.6M USD program on SLM. The UNEP
also is supporting the Ministry of Agriculture
to develop an early warning system and inte-
grate climate change into development pro-
grams.
During an interview in OPM it was made
clear that the Ugandan government has al-
located very limited resources to providing
relief and rehabilitation support in response
to emergencies. OPM therefore largely relies
on the UN emergency agencies, which only
mobilise their resources during major emer-
gencies. As a consequence communities that
are affected by extreme climate events that
are limited in scope and space and only affect
a more limited number of people fall below
the radar and remain without any govern-
ment support.
Figure 4. Percent of households that experienced more than one disaster
(2000-2005)
100
90
80
70
60
50
40
30
20
10
0
Percent
Central Eastern Northern Western Uganda
Region
53.3
63.3
88.7
65.4 65.7

22
DIIS WORKING PAPER 2013:17
Local government is under a considerable
pressure to assist, but it does not receive
funding from central government for such
activities, and its assistance therefore often
remains symbolic.
The Government of Uganda has an-
nounced that it has initiated the formulation
of a new National Policy for Disaster Risk
Reduction and is also working on a program
of action to implement the policy. It is not
publicly known what the policy reform will
focus on or the extent to which it will ad-
dress the implementation challenges of the
current policy.
5.2 NAPA
National policies so far appear to have
been motivated by the need to ratify in-
ternational protocols. Uganda signed the
United Nations Framework Convention on
Climate Change (UNFCCC) on 13th June
1992 and ratied it on 8th September 1993.
Uganda has also ratied the Kyoto Proto-
col, which provides the basis for an interna-
tional response to the challenges of climate
change. In addition, Uganda is also a party
to a number of Multilateral Environmental
Agreements (MEAs) that have a strong link
with climate change, including the United
Nations Convention to Combat Deserti-
cation (UNCCD), the Ramsar Convention,
the Convention on Biological Diversity
(UNCBD) and the Montreal Protocol. In
response to commitments under Articles 4
and 12 of the UFCCC, Uganda developed
and submitted the Initial National Commu-
nication (INC) in 2002 and National Adap-
tation Programmes of Action (NAPA) in
2007, produced by the Department of Me-
teorology in the Ministry of Water, Lands
and Environment (MoWE) in its capacity
Table 2. Estimated Cost of NAPA Projects
Source: NAPA Uganda, 2007
Community Tree Growing Project
Land Degradation Management Project
Strengthening Meteorological Services
Community Water and Sanitation Project
Water for Production Project
Draught Adaptation Project
Vectors, Pests and Disease Control Project
Indigenous Knowledge and Natural Resource
Management Project
Climate Change and Development Planning
Project
Total
1
2
3
4
5
6
7
8
9
3.2
2.5
4.2
2.8
4.0
2.0
3.5
0.6
0.5
23.3
5.5
4.7
6.5
4.7
5.0
3.0
8.0
1.2
1.2
39.8
Limited
Area
Interventions
Country
Wide
Interventions
Project Title

DIIS WORKING PAPER 2013:17
23
as the National Climate Change Focal point
(NCCF) under the Convention.
The drawing up of NAPA was an exter-
nally driven policy process carried out by
a committee of representatives from the
relevant central ministries with the task of
making Uganda eligible to receive funding
from the Least Developed Country Fund
(LDCF). According to the GEF website,
a total of 49 NAPAs were formulated in
2005-2009, and the LDCF has had a total
of US$415 million available to fund them.
However, until now only US$177 million
has been approved for 47 projects, attract-
ing more than US$550 million in co-nanc-
ing in the process (http://www.thegef.org/
gef/ldcf ). Based on this, one can conclude
that less than one project has been funded
for each NAPA. Globally, the funding level
for NAPA has been signicantly lower than
expected. This is a direct consequence of
the political impasse and failure of United
Nations Framework Convention for Cli-
mate Change (UNFCCC) to reach an agree-
ment. The priorities of Uganda’s NAPAs
are shown in table 2 below. The extent to
which these projects have been funded is
not known.
According to UNFCCC guidelines, NA-
PAs should describe a country’s perception
of its most ‘urgent and immediate needs to
adapt to climate change’ (UNFCCC 2011:
p2). While the Uganda NAPA was formally
subject to a process of participatory consul-
tation, in reality the identication and prior-
itisation process was done by technical rep-
resentatives from central ministries. None of
the seventy participants in three CCRI work-
shops that were held in 2012 and 2013 who
represent nine local governments in TESO
and Karamoja regions knew about the NAPA
policy and priorities.
5.3 NCCP and implementation
framework
A draft Climate Change Policy was formulat-
ed during 2012 and will take effect subject to
approval by the Government. The process of
formulating a new national Climate Change
Policy has been driven by a newly established
Climate Change Unit (CCU) in the Depart-
ment of Meteorology in the Ministry of
Water and Environment (MoWE) that func-
tions as the National Focal Point for climate
change under the United Nations Framework
Convention for Climate Change (UNFCCC).
The Climate Change Policy Committee in the
Ministry of Water and Environment func-
tionally serves as a Steering Committee for all
climate change projects and provides advice
on climate change to the Minister of Wa-
ter and Environment. The Climate Change
Policy Committee currently consists of the
following members: Finance, Royal Danish
Embassy, OPM, MOH, MAAIF, Justice and
Constitutional Affairs, Energy and Mineral
Resources, Works and Transport, the Na-
tional Planning Authority and MoWE. Oth-
er organisations may be invited to CCPC
meetings. The policy formulation process has
been supported by international development
agencies, including the EU, DFID, DANI-
DA, World Bank and World Food Program
(WFP).
National Climate Change Policy places
a priority on adaptation, mitigation, and re-
search and observation. The policy priori-
tises climate change adaptation over climate
change mitigation. This is in harmony with
EAC regional climate change policy and log-
ic, given Uganda’s stage of development,
which is characterized by low levels of emis-
sion. Under adaptation, the policy recognizes
eleven sector-specic and two cross-cutting
priorities that fall under nine different line
ministries, as shown in annex 1. These line
24
DIIS WORKING PAPER 2013:17
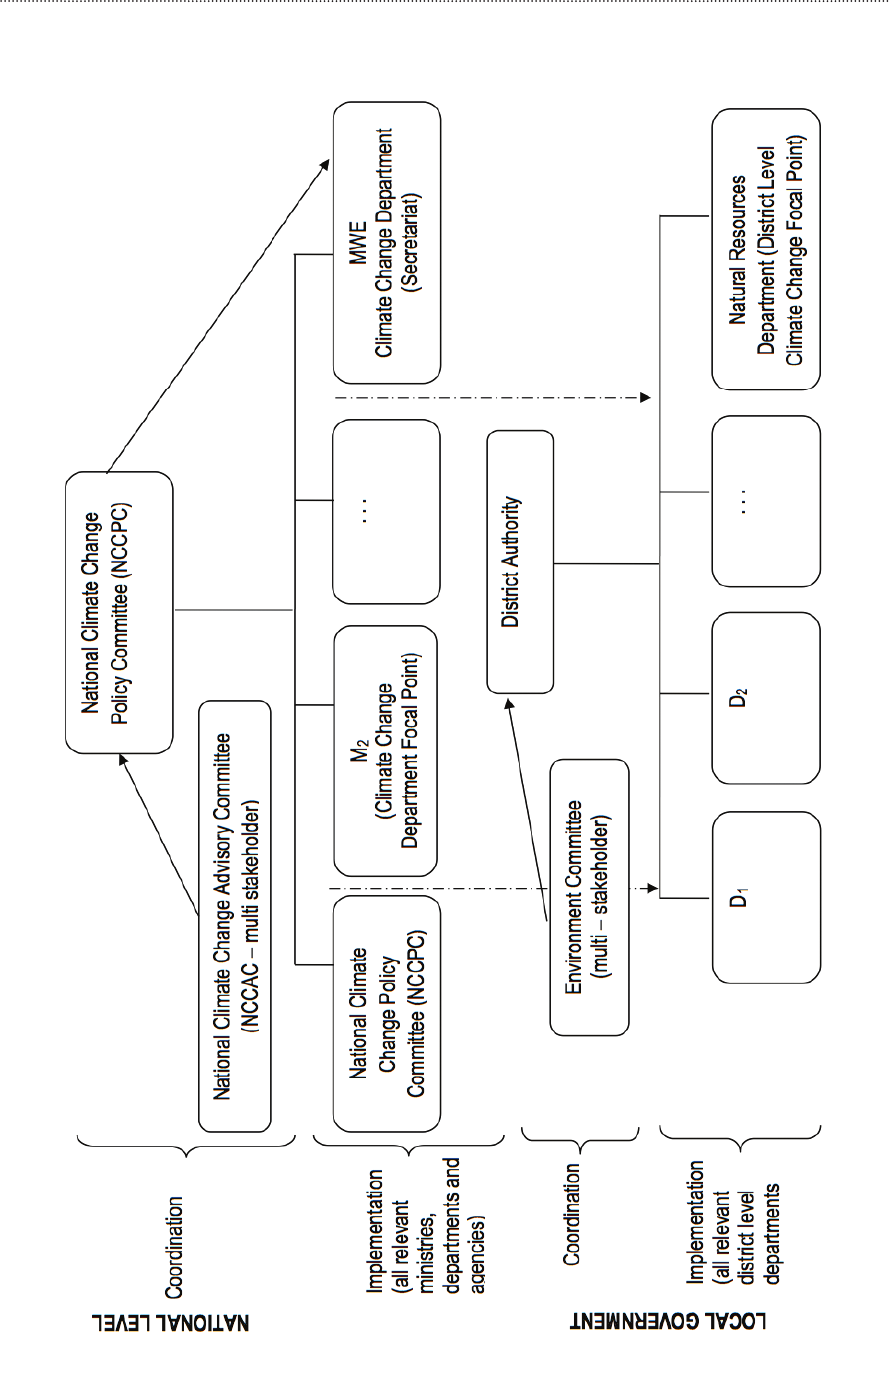
Figure 5. Institutional architecture for climate change action in Uganda
Source: Ministry of Water and Environment, National Climate Change Policy, 2012.

DIIS WORKING PAPER 2013:17
25
ministries are represented but not exactly rep-
licated at the local government and lower lev-
els, making coordination and implementation
at the lower levels of government questions
for research. Under mitigation, the policy rec-
ognizes ten sector-specic and two crosscut-
ting priorities that fall under six different line
ministries, as shown in annex 2.
The NCCP proposes to strengthen the
current climate change unit (CCU) and pro-
mote it to the level of a sectorial government
department named the Climate Change De-
partment (CCD) under the Ministry of Wa-
ter and Environment. This department is to
serve as the National Focal Climate Change
organ. The policy also proposes that the Nat-
ural Resources Department should serve as
the climate change focal point at the district
level, with all other departments ensuring that
climate change issues are integrated into the
district development plans. The policy prom-
ises to provide an implementation structure
to detail the accountabilities of the various
ministries, departments and agencies con-
cerned.
The NCCP emphasizes the multi-sectorial
nature of climate change and seeks to main-
stream climate change as cutting across other
development policies. At the national level it
is proposed to carry out such mainstreaming
through the establishment of a National Cli-
mate Change Policy Committee, with the task
of coordinating policy implementation and
of ensuring information ows on resource
allocations for the implementation of the
policy, as well as a National Climate Change
Advisory Committee to ensure working level
coordination and provide technical input to
the National Climate Change Policy Com-
mittee. The work of these two coordination
mechanisms has been guided by the Climate
Change Implementation Strategy, the ob-
jective of which is to enable more effective
planning and coordination of national-level
activities, including linkages with meso-level
institutions.
In addition to the CCD, three national
ministries or authorities (Finance, NPA and
MOLG) ensure policy implementation. Each
ministry, department and agency with a role
to play in the implementation of the policy
responses is expected to designate a depart-
mental focal point and is accountable for the
implementation of the prescribed policy re-
sponses that concern it. The Implementation
Strategy details the accountabilities of the
various ministries, departments and agencies
concerned around indicative climate change
programmes. They are expected to report
on their progress in the implementation of
their respective tasks and in the attainment of
their expected results. On the basis of these
reports, the CCD is tasked with preparing a
consolidated progress report on the overall
implementation of the climate change policy.
The proposed implementation structure
of climate change is summarized in Figure
5. As shown, the NCCP has nally embraced
the local government system as the key im-
plementation modality. At district level, the
policy provides for district-level focal points
with an environmental committee, and for
departments.
6. DISCUSSION
6.1 Compliance of climate change
policy and Decentralization Act?
The rst of the questions raised in the intro-
duction to the working paper was whether
Uganda’s climate change policies are compli-
ant with the Decentralization Act and current
local government institutional structures.
Up till now, the answer has been a clear no,

26
DIIS WORKING PAPER 2013:17
though when the new climate change poli-
cy takes effect, this is likely to change. The
working paper reveals that neither emergen-
cy policy nor NAPA uses local government
political and administrative institutions for
their implementation. The newly formulated
NCCP, which has not yet been approved by
the government, is compliant with the De-
centralization Act.
The fact that climate change policies have
been implemented in parallel with existing
local decentralization structures cannot be
justied with an argument that there is inade-
quate capacity in local government.
As discussed in section four, all districts
in Uganda had approved three-year District
Development Plans (DDP) by 2009. These
DDPs are decided by the district councils
consisting of councillors elected from each
of the sub-counties within the district. In a
well-established district the DDP is imple-
mented by 15-20 technical departments, cov-
ering a wide range of services. While local
government continues to be hampered by
various nancial, regulatory, capacity and ad-
ministrative constraints, these constraints are
not very different from those hampering the
central administration. While far from per-
fect, local government is well placed to sup-
port climate change adaptation.
6.2 Political nature of Ugandan state
and policy reform
In the introduction we set out to examine the
extent to which the nature of the state de-
termined whether or not climate change poli-
cies were compliant with the Decentralization
Act. In section 3.4 we analysed the changing
nature of the Ugandan state and described
how the commitment to reform and devo-
lution of power and responsibilities to local
government during the 1990s gradually erod-
ed during the 2000s. The section concluded
that the attribution of success for develop-
ment outcomes to central government during
the past decade has come to override reform-
and development-specic concerns.
Formulation of the comprehensive Decen-
tralization Act in 1993 and the subsequent
Table 3. Compliance of Climate Change Policies with Decentralization
Central government need to be
seen to act. Resettlement camps
highly politically sensitive.
Driver of reform was to
become eligible to receive UN
funding for climate change
projects.
Policy formulation process
guided by joint
government–multi-donor
committee. Policy reects
analysis rather than funding
availability.
No. Centralised coordination with concentrated local
institutions is not integrated into local government.
No. Implemented through projects managed by central
ministries in parallel with local government.
Yes. Implementation of policy fully integrated with local
government structures.
Emergency
response
NAPA
NCCP
Compliance with decentralization? Analysis whyPolicy

DIIS WORKING PAPER 2013:17
27
devolution of power, nancial resources and
responsibilities for service delivery are con-
sistent with our analysis of the nature of the
Ugandan state in the 1990s discussed in sec-
tion ve. As one of the most reform-compli-
ant countries in Africa during the 1990s, the
new local government institutions received
considerable capacity development support
from UNCDF, World Bank and other inter-
national donor organizations. However, this
does not explain why the government did not
allow the emergency policy formulated dur-
ing the same period to be compliant with the
Decentralization Act. As discussed earlier, all
decisions with regard to the coordination of
emergency assistance are centralized within
the OPM’s ofce, which is headed by its own
Minister. While the overall trend towards the
recentralization of power to central govern-
ment ts well with how NAPA was formu-
lated and implemented, the political analysis
is inconsistent with the fact that the NCCP
embrace the local government system and
in many ways resembles the types of reform
that Uganda was known for during the 1990s.
6.3 Drivers of climate change
policies
Our analysis of climate change policies in
section 5 revealed signicant differences in
the formulation process and drivers in this
process between the three policies. At the
same time we found a strong coherence be-
tween the interests of those driving the poli-
cy process and its implementation modalities.
Given the high political sensitivity of emer-
gency assistance, the formulation of emer-
gency policy during the early 1990s was close-
ly followed and guided by the government.
We argue that there are three sets of reasons
why the governance of emergency assis-
tance policy is centralized and non-compliant
with the Decentralization Act. First, it is po-
litically important to be seen to respond to
emergencies and to ensure that assistance is
seen to be attributed to central government.
Secondly, control over when and when not
to declare an emergency is important. His-
torically, emergencies in Uganda have been
closely linked to civil conicts. Thirdly, but
not least, the resettlement of displaced peo-
ple in camps as a consequence of emergen-
cies is politically highly sensitive because of
its security aspects.
NAPA is the rst national policy that is ful-
ly dedicated to adaptation to climate change.
As described in section ve, policy formu-
lation was driven by a need to be compliant
with the United Nations Framework Con-
vention for Climate Change requirements
in order to be eligible for funding from the
Least Developed Country Fund. Policy for-
mulation therefore became centralized, with
little more than token instrumental consul-
tation among so-called stakeholders outside
the central ministries and UN consultants.
As discussed in section 5, central ministerially
managed projects are the chosen implementa-
tion modality of NAPA, though it ignores the
Decentralization Act and local government
structures. Interviews with key informants in
the ministries suggest that, to the extent that
the NAPA priority projects were funded, a
larger proportion of the funding was used on
research or central ministry activities. Priori-
ties suggest that activities that reached local
farming communities were largely based on
transfers of technologies made to assist farm-
ers adapt to climate change, such as modern
drought-tolerant crop varieties.
As examined in section 5, the NCCP for-
mulation was guided by a Climate Change
Policy Committee that comprises represent-
atives from the OPM, Ministry of Finance,
six line ministries and a donor representative

28
DIIS WORKING PAPER 2013:17
(Danida). The policy formulation process was
supported by a group of international devel-
opment agencies, including the EU, DFID,
DANIDA, World Bank and World Food Pro-
gram (WFP).
Given this very high level of support for
policy development, it is not surprising that
the NCCP implementation framework is
compliant with the Decentralization Act. The
NCCP implementation framework fully em-
braces the decentralised governance struc-
tures, which will greatly enhance the chanc-
es to establish local forums for dialogue and
co-production of the ideas needed to address
rural people’s challenges in adapting to cli-
mate change.
6.4 Implication of the gap between
climate change policies and
decentralization
In the previous section we have tried to un-
derstand why a centralized mode of imple-
mentation was chosen for emergency assis-
tance and NAPA policies. In the following we
examine some of the negative impacts of this
choice.
The fact that the decentralised emergen-
cy assistance institutions are not integrated
with normal local government structures
clearly has a negative inuence on their ef-
ciency. Qualitative eldwork in Teso region
indicated that the DRR committees at the
district (LC5) and sub-country (LC3) levels
were dormant and were only reactivated as
a response to oods. The role of the RRD
has largely been to make assessments of the
current situation and to assist in mobilizing
people to receive assistance from internation-
al emergency NGOs. With no budget and
little or no interaction with or inuence on
decisions made by the OPM ofce, the role
of the RRD can hardly be characterized as
the implementation mechanism of the disas-
ter unit in the OPM’s ofce. The emergency
unit in the OPM’s ofce is seriously under-
nanced and therefore limited in its ability to
respond to emergencies on its own. Its track
record is largely one of formal and ofcial
coordination, while the UN and internation-
al and national NGOs are the organizations
that are taking the lead in emergency respons-
es on the ground. The emergency unit at the
PMP’s ofce seems to be more interested in
taking the credit for responding to emergen-
cies than actually making a difference for the
people affected.
It is therefore not surprising that central
government funding for climate change
adaptation does not feature in the District
Development Plans of the three CCRI
study districts, Soroti, Amuria and Katakwi.
However, the consequence of such a top-
down project-planning and implementation
approach to climate change adaptation is
a heightened risk that the support is irrel-
evant for the community. Compared with
project implementation by the central minis-
try, , implementation through local govern-
ment institutions is much better placed to
create opportunities for political and tech-
nical dialogue leading to joint priorities and
co-produced social or technical approaches
to climate change adaption. NAPA therefore
has, in our assessment, done more harm and
good in some respects. The rushed external
UN and central ministry-driven policy for-
mulation process ignored the decentralized
policy and technical level. This is likely to
have delayed the formulation of the nation-
al climate change policy and funding for the
meso-level government institutions that are
best situated to provide and enable an envi-
ronment that can assist smallholder farmers
in their efforts to adapt to the effects of cli-
mate change.

DIIS WORKING PAPER 2013:17
29
A considerable number of projects address-
ing climate changes have been implemented
over the past ve to six years. However, a
consequence of no adequate policy imple-
mentation framework is that development
agencies have funded and implemented pro-
jects through central state institutions or
NGOs. A GTZ study (GTZ, 2010) identied
and logged the interests of 84 climate change
actors across government (23), development
partners (22), NGOs (20), research institutes
(16) and the private sector (3). The majority
are engaged in the environment, energy, agri-
culture and climate change-specic sub-sec-
tors, with cross-cutting climate change issues.
The support can be categorized into four
areas: (i) policy and capacity building, (i) ad-
aptation, (iii) mitigation and (iv) cross-cutting
issues.
6.5 NCCP: bridging the gap between
policy and practice?
In principle, the implementation framework
for the NCCP can be said to bridge the gap
between policy and practice. However, the
extent to which this will happen in practice
will only been seen during actual implementa-
tion. At least three issues are causing concern
and could inuence the implementation of
NCCP.
The rst issue is that there seems to have
been little discussion about how the NCCP
and the emergency assistance policy relate to
each other. It is unclear how the integration
of the NCCP within local government struc-
tures will affect the emergency assistance
policy. In fact, when the Uganda CCRI team
interviewed the key emergency assistance of-
cer in the OPM, the ofcer was not aware
of the new NCCP and was never consulted
during its formulation.
The second issue relates to the fact that,
while the NCCP policy formulation process
was highly inclusive, only limited consultation
with local government stakeholders seems to
have taken place. Whereas the district-level
structures are provided for in the policy, it is
less clear how they are linked to the nation-
al-level structure and the lower (sub-coun-
ty)-level structures to deliver on climate
change action. The extent to which it is the
district council or MWE that sets priorities
within the district also remains unclear.
During a CCRI meeting in 2013 involv-
ing politicians and technical staff from nine
districts in Tesso and Karamoja, the NCCP
implementation framework was presented
and subsequent discussions recorded and
transcribed. Participants were overall very
pleased with the integration of support for
climate change adaptation in district planning
and budgeting. However, no one had been
consulted in the design of the implementa-
tion framework, and some were critical of the
appointment of the district environmental
ofcer as the focal point for climate change
at the district level. They were concerned that
the environmental ofcer would not have the
political clout to mainstream climate change
into the agenda across many departments.
Thirdly, the group of international donor
agencies that supported the formulation of
the NCCP were also involved in a joint pro-
ject: the UNDP/CIF-led and multidonor-
and government-funded area-based climate
change adaptation project in Mbale district.
This project is seen as a pilot project with
the aim of developing an appropriate way to
support climate change adaptation. In our
assessment, the UNDP/CIP project com-
prises a range of technically relevant climate
change activities and relevant experiences
with participatory approaches for involving
rural citizens in these activities. However,
its implementation as a project, using paral-

30
DIIS WORKING PAPER 2013:17
lel structures to those of local government,
undermines its relevance as a model for the
climate change policy. The usual criticism of
donor-funded projects applies to this project
as well: (i) local politicians have little owner-
ship of the project, as they have not been in-
volved in its design and management and are
unlikely and unable to take over the funding
of project activities; (ii) a large part of the
project cost is made up of project staff and
international consultancy fees, something
that is highly unlikely to be how local gov-
ernment would prioritise their budget; and iii)
the funding level of the project is magnitudes
higher than the kind of budget that local gov-
ernment is likely to have available for imple-
menting the climate change policy.
6.6 Lack of understanding of climate
change action by meso level
institutions
The fact that local government has until now
largely been bypassed by emergency assis-
tance, NAPA and most donor agencies and
NGO-implemented projects is, however, not
the same as saying there is a complete lack
of activity. The CCRI’s qualitative eldwork
in Soroti, Amuria and Katakwi districts re-
vealed that local government technical staff
at district and in particular at sub-county level
are acting in various ways to the challenge of
climate change, even when there is no poli-
cy guiding their action or budget line fund-
ing their activities. Understanding meso- and
local-level institutional responses to climate
change in the absence of relevant policies
and budgets is urgently needed to inform
the implementation of the proposed climate
change policy. This will be the subject of a
second CCRI working paper, to be nalized
in early 2014.

31
DIIS WORKING PAPER 2013:17
7. BIBLIOGRAPHY
CIA Factbook, 2013: https://www.cia.gov/library/publications/the-world-
factbook/geos/ug.html
GoU, 2007. Climate Change: Uganda National Adaptation Programmes
of Action. Department of Meteorology, Ministry of Water, Lands and
Environment
FAO, 2007. The State of the World’s Forests. FAO of the United Nations,
Rome.
FAO, 2009. State of the world sheries report for 2008. Viale delle Terme di
Caracalla, 00153 Rome, Italy.
FAO, 2010. Guidance, Intentions and Commitment to Climate Change in
Uganda (2010-2014), Food and Agriculture Organization of the United
Nations (FAO), Kampala.
GoU, 2007. Climate Change: Uganda National Adaptation Programmes of
Action. Kampala, Uganda.
GOU, 2009. Uganda climate change case studies. Department of Meteorology,
MWE. Kampala, Uganda.
GoU, 2010. The State of Uganda’s Population Report 2010. Kampala Uganda.
GoU., 2002. Initial national communication to the UNFCCC. MWE. Uganda.
Kampala
Hisali, E., Birungi, P., and Buyinza, F., 2011. Adaptation to climate change in
Uganda: evidence from micro level data. Global Environmental Change, pp
1245-1261.
Intergovernmental Panel on Climate Change, 2001. Climate Change 2001:
Synthesis Report. A Contribution of Working Groups I, II, III to the Third
Assessment Report of the Intergovernmental Panel on Climate Change, R.T.
Watson and the Core Team, Eds., Cambridge University Press, Cambridge
and New York.
Intergovernmental Panel on Climate Change. 2001. Climate change: the
scientic basis (http:/www.ipcc.ch/)
James, P., 2010. Using Farmers’ Preferences to Assess Development Policy: A
Case Study of Uganda. Development Policy Review , 2010, 28 (3): 359-378.
Overseas Development Institute
Library of Congress, 2013. Country studies: Uganda. http://lcweb2.loc.gov/
cgi-bin/query/r?frd/cstdy:@eld%28DOCID+ug0005%29
Hepworth, N. and Goulden, M., 2008. Climate change in Uganda: understanding
the implications and appraising the response. Edinburgh: LTS International
McSweeney, C. New, M., Lizcano, G, 2008. UNDP Climate Change Country
Prole: Uganda. http://country-proles.geog.ox.ac.uk
Ministry of Agriculture, Animal Industry and Fisheries (MAAIF) 2010.
Agriculture Sector Development Strategy and Investment Plan (DSIP),
(2010/11-2014/15).

32
DIIS WORKING PAPER 2013:17
Ministry of Water and the environment (MWE), 2007. Climate Change.
Uganda’s National Adaptation Programmes of Action. Summary for Policy
Makers. Kampala, Uganda.
Ministry of Water and the environment (MWE) 2012. Uganda national Climate
Change Policy. Final Draft. Kampala, Uganda.
MWLE [Ministry of Water, Lands and the Environment] 2002. Uganda initial
national communication to the United Nations Framework Convention on
Climate Change, Kampala Uganda.
National Encyclopedia: http://www.nationsencyclopedia.com/economies/
Africa/Uganda-AGRICULTURE.htm
Ochieng, R. 2007. Predicting malaria’s changing course in east Africa. http://
www.idrc.ca/uploads/user-S/11999105261malaria_e.pdf
Osbahr, H. Dorward, P, Stern, R and Cooper, S. 2011. Supporting agricultural
innovation in Uganda to respond to climate risk: linking climate change and
variabilty with farmers perceptions. Experimental Agriculture, 47, pp 293-
316 doi:10.1017/S0014479710000785
Oxfam Great Britain, 2008. Turning up the Heat: Climate Change and Poverty
in Uganda. Online ISBN 978-1-84814-039-4
Republic of Uganda (RoU), 2010. National Development Plan (2010/11-
2014/15), National Planning Authority, Kampala, Uganda.
Shongwe, Mxolisi, Jan Van Oldenborgh, G, Van den Hurk, B. 2010. Projected
Changes in Mean and Extreme Precipitation in Africa under Global
Warming. Part II: East Africa. Journal of Climate, pp 3718 – 3733, Volume
24. American Meteoroligcal Society. DOI: 10.1175/2010JCLI2883.1
Uganda Bureau of Statistics (UBOS), 2011. Uganda Census of Agriculture
(UCA) 2008/09. Statistics House, Kampala, Uganda.
UNFCCC, 2011. National Adaptation Programmes of Action. http://unfccc.
int/national_reports/napa/items/2719.php

33
DIIS WORKING PAPER 2013:17
Annex 1. Climate change adaptation priority areas and
institutional Location
1. Agriculture and Livestock
2. Water
3. Fisheries and aquaculture
4. Transport and works
5. Forestry and wetlands
6. Biodiversity and ecosystem
services
7. Health
8. Energy
9. Wildlife and tourism
10. Human settlements and social
infrastructure
11. Disaster risk management
Cross-cutting priority:
1. Gender issues and child
welfare
2. Vulnerable groups
Ministry of Agriculture, Animal Industry and
Fisheries (MAAIF)
Ministry of Water and the Environment
(MoWE)
MAAIF
Ministry of Works and Transport
Ministry of Water and the Environment
Ministry of Tourism and National Heritage
Ministry of Health (MoH)
Ministry of Energy
Ministry of Tourism and National Heritage
Ministry of Lands and Urban Planning
Ministry of Disaster and Preparedness
Ministry of Gender and Social Development
“
Sector - Specic Priority - Core sectors Responsible Ministry

34
DIIS WORKING PAPER 2013:17
Annex 2. Climate change mitigation priority areas and
institutional location
Sector - Specic Priority Responsible Ministry
1. Land use, land use change and
forestry (LULUCF)
2. Land use and land use change
3. Reduced Emission from
Deforestation and forest
Degradation + (REDD +)
4. Wetlands
5. Agriculture
6. Energy generation
7. Energy utilization
8. Transport
9. Waste management
10. Industrial sector
Cross-cutting priority:
1. Barriers to technology
transfer
2. Large-scale diffusion of clean,
low-carbon technologies
Ministry of Agriculture, Animal Industry and
Fisheries (MMAIF)
Ministry of Water and the Environment
(MWE)
Ministry of Water and the Environment
(MWE)
Ministry of Water and the Environment
(MWE)
Ministry of Agriculture, Animal Industry and
Fisheries (MMAIF)
Ministry of Energy
Ministry of Energy
Ministry of Works and Transport
Ministry of Lands and Urban Planning
Ministry of Trade, Industry and Cooperatives
?
?
