
National Health Statistics Reports
Number 192 November 2, 2023
U.S. DEPARTMENT OF HEALTH AND HUMAN SERVICES
Centers for Disease Control and Prevention
National Center for Health Statistics
Demographic Differences in Life Dissatisfaction
Among Adults: United States, 2021
by Amanda E. Ng, M.P.H., Dzifa Adjaye-Gbewonyo, Ph.D., and Kristen Cibelli Hibben, Ph.D.
Abstract
Objective—Previous work has established life satisfaction as an important
indicator of overall health and well-being. This report describes differences in life
dissatisfaction by selected characteristics, grouped by family income.
Methods—Data from the 2021 National Health Interview Survey were used
to examine the percentage of adults that were dissatisfied with life by selected
demographic characteristics (age, sex, race and Hispanic origin, and nativity status
[born in the United States or U.S. territory]), grouped by family income.
Results—In 2021, 4.8% of adults were dissatisfied with life. In general, analyses
showed significant differences by all selected demographic characteristics among
adults with incomes of less than 200% of the federal poverty level. Among this group,
men, adults ages 45–64, White non-Hispanic adults, Black non-Hispanic adults, and
adults born in the United States were more likely to be dissatisfied with life compared
with their counterparts. No significant differences in life dissatisfaction by selected
demographic characteristics among adults with incomes greater than 200% of the
federal poverty level were observed.
Conclusion—This report presents estimates of life dissatisfaction among adults
by demographic subgroups and family income. These results highlight the importance
of monitoring life dissatisfaction among detailed subgroups grouped by income, in
addition to the overall national estimate.
Keywords: life satisfaction • quality of life • subjective well-being • social
determinants of health • National Health Interview Survey (NHIS)
Introduction
Subjective well-being is a concept
that captures how people feel about and
evaluate or assess their overall lives, and
it reflects various elements, including
personal health as well as other factors
(such as life events, social interactions
and relationships, employment, and social
and economic conditions) (1). Improving
subjective well-being has been identified
as a national priority by Healthy People
2030 (2,3), a federal initiative that sets
data-driven objectives to improve health
over the current decade. Well-being is
central to the Healthy People 2030 vision,
and an indicator is included as a summary
outcome measure to evaluate progress
toward achieving Healthy People
objectives.
A key measure of subjective
well-being is satisfaction with life, as
defined by one’s view or experience (1).
In 2021, the U.S. Department of Health
and Human Services added a question
on life satisfaction to the National Health
Interview Survey (NHIS) to assess well-
being in the United States and monitor
change over time for the Healthy People
initiative. Life satisfaction was last
included in NHIS in 2001. Single-item
measures have been found to provide
a broad and reliable assessment of life
satisfaction (4) and have been used in
major surveys around the world (5).
Previous work suggests demographic
differences in overall life satisfaction,
although many such studies use data
collected over 10 years ago. Higher
levels of life satisfaction are reported
by women compared with men (6),
White non-Hispanic (subsequently,
White) adults compared with Black
non-Hispanic (subsequently, Black) and
Hispanic adults (7), and among older
immigrants compared with native-born
people (8,9). Recent data from NHIS
may provide additional understanding of
the distribution of life satisfaction levels
NCHS reports can be downloaded from: https://www.cdc.gov/nchs/products/index.htm.

Page 2 National Health Statistics Reports Number 192 November 2, 2023
among these demographic groups, as well
as potential patterns by age group.
Research has demonstrated links
between satisfaction with life and
physical health, morbidity, and mortality
(9–12), especially among adults of low
socioeconomic status (10). Studies have
shown a positive association between
income and life satisfaction (13,14); that
is, people with higher incomes generally
rate their satisfaction with life to be
higher, while those with lower incomes
generally rate their satisfaction to be
lower (15–17). This often-replicated
and robust finding has been observed
particularly for evaluative well-being
measures that look at general satisfaction
with life as a whole—when people pause
and reflect, as in a health survey—and
recent research suggests higher life
satisfaction is also evident at higher
incomes for experienced well-being
measures examining people’s feelings in
the moment (14,18).
Given the potential demographic
variation in life satisfaction and the
existing link between income and
life satisfaction, increased reporting
of dissatisfaction with life in recent
decades (19), and racial inequities in
the prevalence of factors associated
with dissatisfaction with life (17),
it is important to understand the
association of income with demographic
differences in both life satisfaction
and dissatisfaction. In addition, given
that poor life satisfaction is linked to
negative health outcomes, understanding
the characteristics of those who are
dissatisfied with their life can help to
identify populations potentially at risk.
This report examines the percentage
of adults ages 18 and older who report
being dissatisfied or very dissatisfied
with life by selected demographic
characteristics, based on data from the
2021 NHIS. Because of the relationship
between income and life satisfaction, the
analyses of demographic differences are
grouped by family income as a percentage
of the federal poverty level (FPL).
Methods
Data source
Data from the 2021 NHIS were used
for this analysis. NHIS is a nationally
representative household survey of
the civilian noninstitutionalized U.S.
population. It is conducted continuously
throughout the year by the National
Center for Health Statistics (NCHS).
Interviews are typically conducted in
respondents’ homes, but follow-ups to
complete interviews may be conducted
over the telephone. Because of the
COVID-19 pandemic, interviewing
procedures were disrupted, and during
2021, 62.8% of the Sample Adult
interviews were conducted at least
partially by telephone (20). For more
information about NHIS, visit
https://www.cdc.gov/nchs/nhis.htm.
Measures
Dissatisfaction with life
Dissatisfaction with life was based
on responses to the question, “In general,
how satisfied are you with your life?
Would you say very satisfied, satisfied,
dissatisfied, or very dissatisfied?”
Selected sociodemographic
characteristics
Family income as a percentage
of FPL—Based on FPL, which was
calculated from family income in the
previous calendar year and family size
using the U.S. Census Bureau’s poverty
thresholds (21). Family income was
imputed when missing (22). A cut point
of 200% FPL was used, which was about
$55,000 for a family of four in 2021.
Nativity status—Based on a “yes”
response to the question, “Were you born
in the United States or a U.S. territory?”
Race and Hispanic origin—
Respondents were grouped into
four categories: Asian non-Hispanic
(subsequently, Asian), Black, White, and
Hispanic. These categories were based on
responses to two survey questions asking
about race and Hispanic origin, where
those characterized as Hispanic or Latino
could be of any race or combination of
races. People who reported unknown
race or ethnicity or multiple races were
not reported due to small sample size but
were included in the overall analysis and
other sociodemographic subanalyses.
Estimates for non-Hispanic adults of
races other than White only, Black only,
or Asian only, and those of multiple
races, are not shown but are included in
total estimates. Analyses were limited to
the race and Hispanic-origin groups for
which data were reliable and sufficiently
powered to make group comparisons.
Statistical analyses
Percentages of life dissatisfaction
were calculated by selected
sociodemographic characteristics,
grouped by family income. These
estimates excluded unknown values
from the denominators, and differences
between percentages were assessed with
two-sided pairwise tests at the 0.05 alpha
level. Linear and quadratic trends by age
group were evaluated using orthogonal
polynomials.
All estimates were weighted and
calculated using SAS-callable SUDAAN
software (23) to account for the complex
sample design of NHIS. Ninety-five
percent confidence intervals were
generated using the Korn–Graubard
method for complex surveys. All estimates
meet NCHS data presentation standards
for proportions (24).
Results
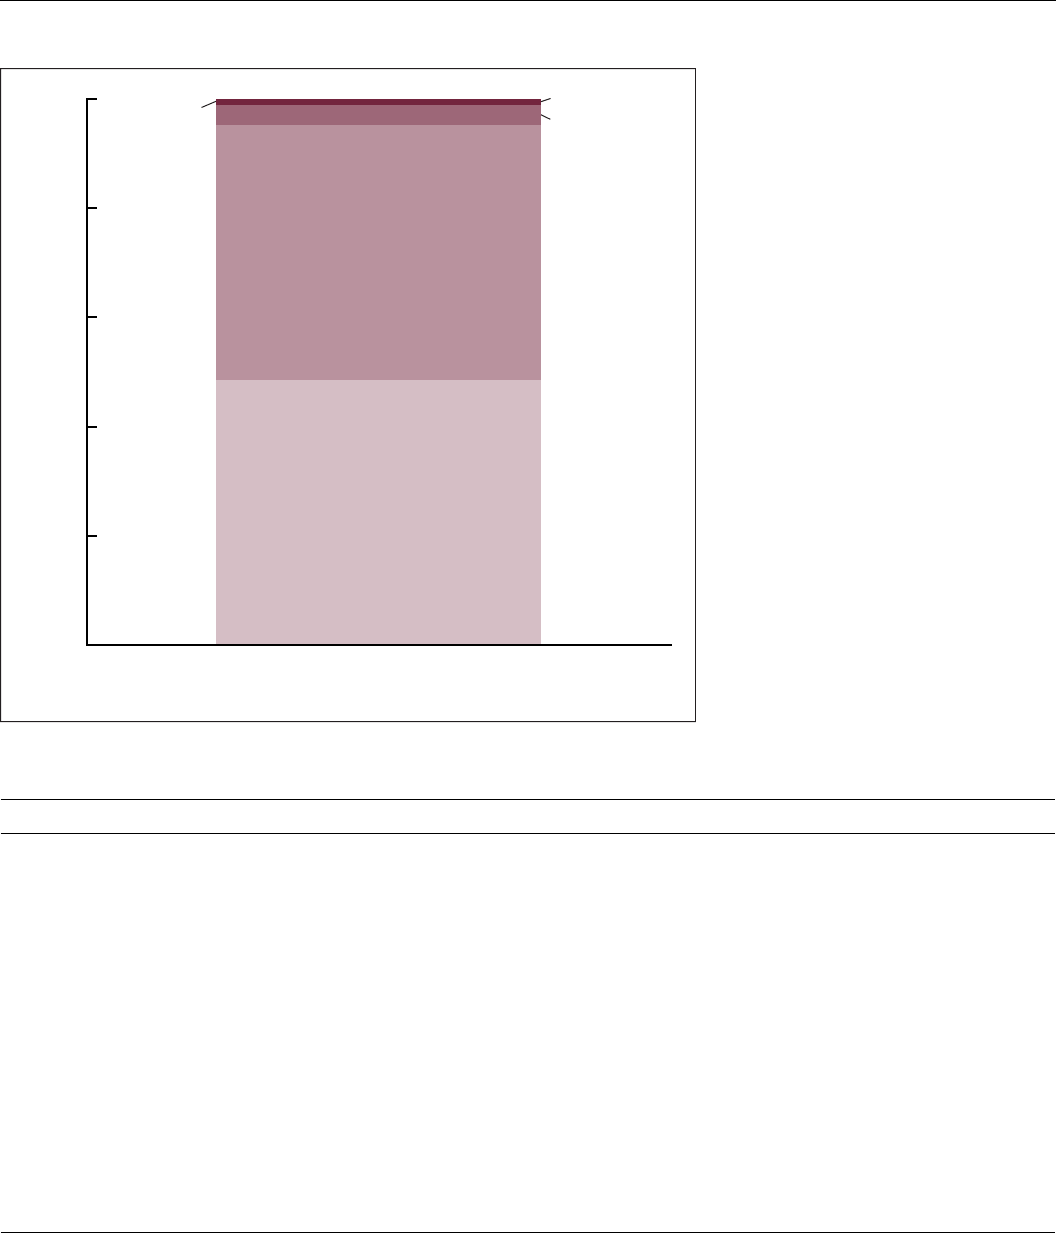
In 2021, 4.8% of all adults were
dissatisfied or very dissatisfied with life,
including 3.7% (confidence interval
[CI]: 3.5–4.0) who were dissatisfied and
1.1% (CI: 1.0–1.2) who were very
dissatisfied. In contrast, 95.2% of all
adults were satisfied or very satisfied
with life, including 46.6% (CI: 45.8–47.3)
who were satisfied and 48.6%
(CI: 47.8–49.4) who were very satisfied
(Figure 1).
Among all adults, 5.1% (CI: 4.7–5.6)
of men and 4.6% (CI: 4.2–5.0) of women
were dissatisfied or very dissatisfied with
life (Table). The percentage of adults
that were dissatisfied or very dissatisfied
with life varied by age group, from 4.4%
(CI: 3.9–4.8) among adults ages 18–44
to 5.5% (CI: 5.0–6.0) among adults ages
45–64 and 4.8% (CI: 4.3–5.3) among
adults ages 65 and older. Asian adults
National Health Statistics Reports Number 192 November 2, 2023 Page 3
Figure 1. Percent distribution of life satisfaction among adults ages 18 and older:
United States, 2021
(3.1%, CI: 2.2–4.2) were less likely to
be dissatisfied with life compared with
Black (6.0%, CI: 5.0–7.0) and White
(4.9%, CI: 4.5–5.3) adults. Black adults
were also more likely to be dissatisfied
than Hispanic (4.1%, CI: 3.4–4.9)
and White adults. Adults born in the
United States (5.0%, CI: 4.7–5.4) were
more likely to be dissatisfied with life
compared with adults born outside the
United States (3.7%, CI: 3.1–4.4).
When grouped by income, feeling
dissatisfied or very dissatisfied with life
was consistently more likely among
adults with family incomes of less than
200% FPL. In 2021, 8.1% of adults with
family incomes of less than 200% FPL,
and 3.6% of adults with family incomes
of 200% or more FPL were dissatisfied or
very dissatisfied with life (Figure 2).
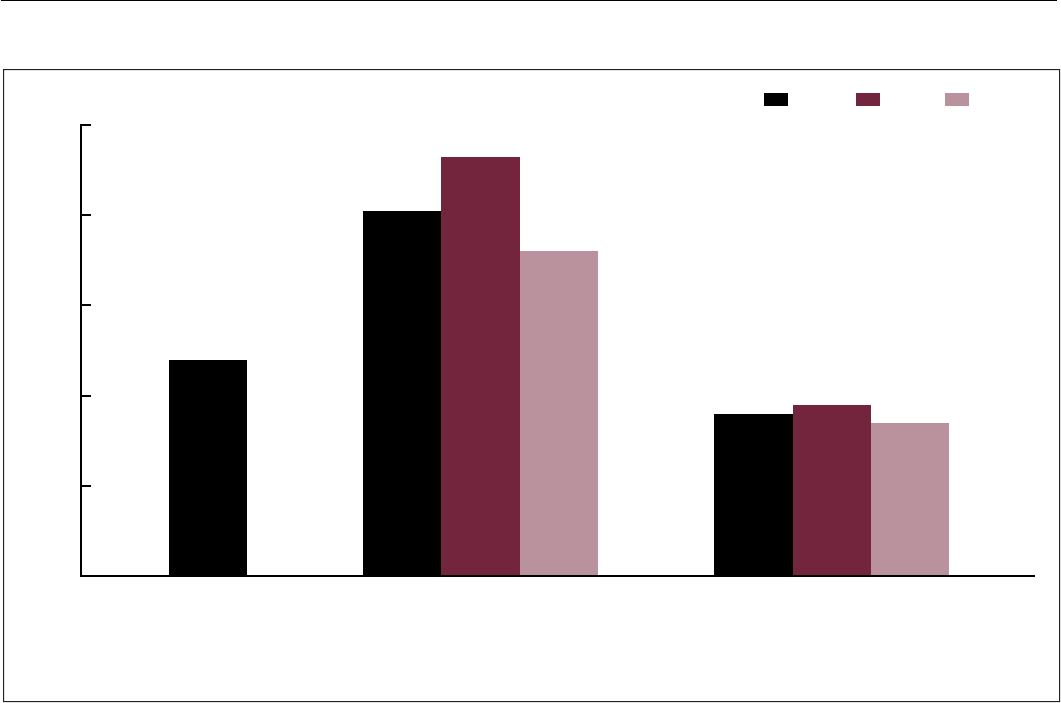
Among adults with family incomes of
less than 200% FPL, men were more
likely to be dissatisfied or very
dissatisfied with life (9.3%) compared
with women (7.2%). Among adults with
family incomes of 200% or more FPL,
this percentage was similar for men
(3.8%) and women (3.4%).
NOTE: Estimates are based on household interviews of a sample of the U.S. civilian noninstitutionalized population.
SOURCE: National Center for Health Statistics, National Health Interview Survey, 2021.
Percent
0
20
40
60
80
100
Very dissatisfied
Dissatisfied
Satisfied
Very satisfied48.6
46.6
3.7
1.1
Table. Percentage of adults ages 18 and older who were dissatised or very dissatised with life, by selected sociodemographic
characteristics overall and by family income: United States, 2021
Characteristic Overall Less than 200% FPL 200% or more FPL
Percent (95% condence interval)
Total . . . . . . . . . . . . . . . . . . . . . . . . . . . . . . . . . . . . . . . 4.8 (4.5–5.1) 8.1 (7.4–8.9) 3.6 (3.3–3.9)
Sex
Men. . . . . . . . . . . . . . . . . . . . . . . . . . . . . . . . . . . . . . . . 5.1 (4.7–5.6)
1
9.3 (8.1–10.6) 3.8 (3.3–4.2)
Women . . . . . . . . . . . . . . . . . . . . . . . . . . . . . . . . . . . . . 4.6 (4.2–5.0) 7.2 (6.3–8.1) 3.4 (3.0–3.9)
Age group
18–44 . . . . . . . . . . . . . . . . . . . . . . . . . . . . . . . . . . . . . .
2
4.4 (3.9–4.8)
2
6.8 (5.8–8.0) 3.3 (2.8–3.8)
45–64 . . . . . . . . . . . . . . . . . . . . . . . . . . . . . . . . . . . . . . 5.5 (5.0–6.0) 11.1 (9.6–12.7) 3.8 (3.3–4.4)
65 and older . . . . . . . . . . . . . . . . . . . . . . . . . . . . . . . . . 4.8 (4.3–5.3) 7.2 (6.1–8.5) 3.9 (3.3–4.5)
Race and Hispanic origin
Asian, non-Hispanic . . . . . . . . . . . . . . . . . . . . . . . . . . .
3,4
3.1 (2.2–4.2)
3,4
4.7 (2.5–7.9) 2.6 (1.6–4.0)
Black, non-Hispanic . . . . . . . . . . . . . . . . . . . . . . . . . . .
3,5
6.0 (5.0–7.0) 9.0 (7.2–11.0) 3.8 ( 2.7–5.1)
White, non-Hispanic . . . . . . . . . . . . . . . . . . . . . . . . . . . 4.9 (4.5–5.3) 9.7 (8.6–10.8) 3.7 (3.4–4.1)
Hispanic . . . . . . . . . . . . . . . . . . . . . . . . . . . . . . . . . . . .
3
4.1 (3.4–4.9)
3,4
5.0 (3.9–6.3) 3.4 (2.5–4.4)
Nativity status
U.S.-born . . . . . . . . . . . . . . . . . . . . . . . . . . . . . . . . . . .
6
5.0 (4.7–5.4)
6
9.2 (8.4–10.2) 3.6 (3.3–4.0)
Born outside United States. . . . . . . . . . . . . . . . . . . . . . 3.7 (3.1–4.4) 4.7 (3.5–6.0) 3.2 (2.4–4.0)
1
Signicantly different from women (p < 0.05).
2
Signicant quadratic trend by age group (p < 0.05).
3
Signicantly different from White non-Hispanic adults (p < 0.05).
4
Signicantly different from Black non-Hispanic adults (p < 0.05).
5
Signicantly different from Hispanic adults (p < 0.05).
6
Signicantly different from adults born outside the United States (p < 0.05).
NOTES: FPL is federal poverty level. Estimates are based on household interviews of a sample of the U.S. civilian noninstitutionalized population. Chi-squared tests show signicant differences
between adults that were dissatised or very dissatised with life who had family incomes of less than 200% FPL and 200% or more FPL (p < 0.05).
SOURCE: National Center for Health Statistics, National Health Interview Survey, 2021.
Page 4 National Health Statistics Reports Number 192 November 2, 2023
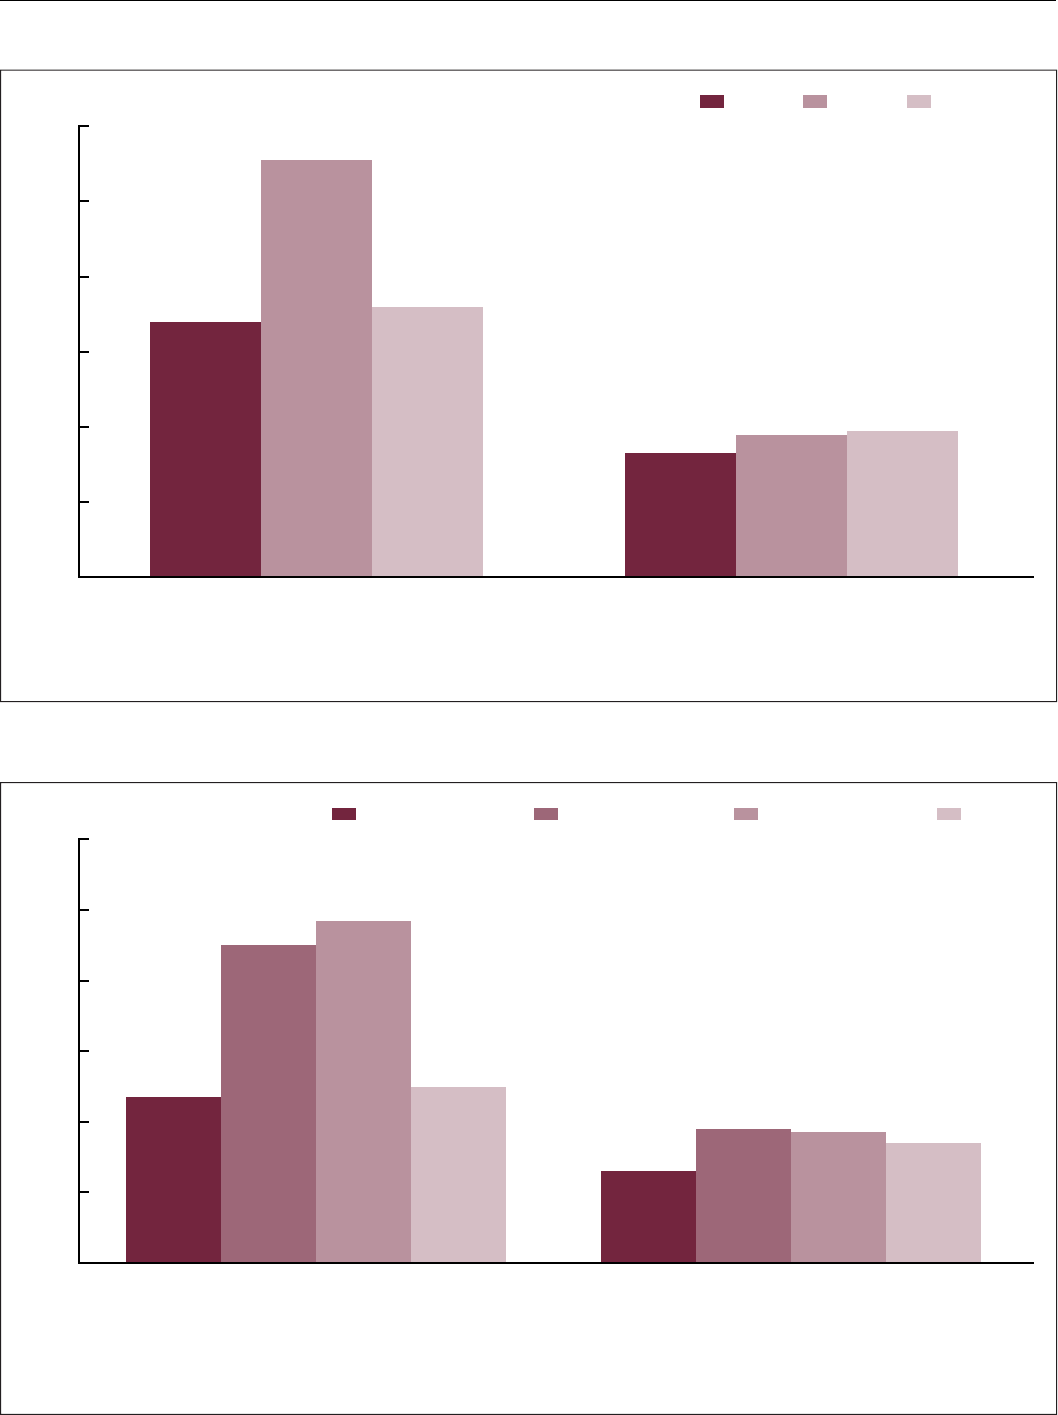
Among adults with family incomes
of less than 200% FPL, the percentage
of adults who were dissatisfied or very
dissatisfied with life varied by age, from
6.8% among adults ages 18–44, to 11.1%
for ages 45–64, and 7.2% for ages 65
and older (Figure 3). In contrast, among
adults with family incomes of 200% or
more FPL, the percentage of adults that
were dissatisfied or very dissatisfied with
life was similar by age (3.3% for ages
18–44, 3.8% for ages 45–64, and 3.9%
for ages 65 and older).
Life dissatisfaction among adults
with family incomes of less than 200%
FPL was higher among White (9.7%)
and Black (9.0%) adults compared
with Hispanic (5.0%) or Asian (4.7%)
adults (Figure 4). Among adults with
family incomes of 200% or more FPL,
the percentage of adults who were
dissatisfied or very dissatisfied with life
was similar by race and Hispanic origin.
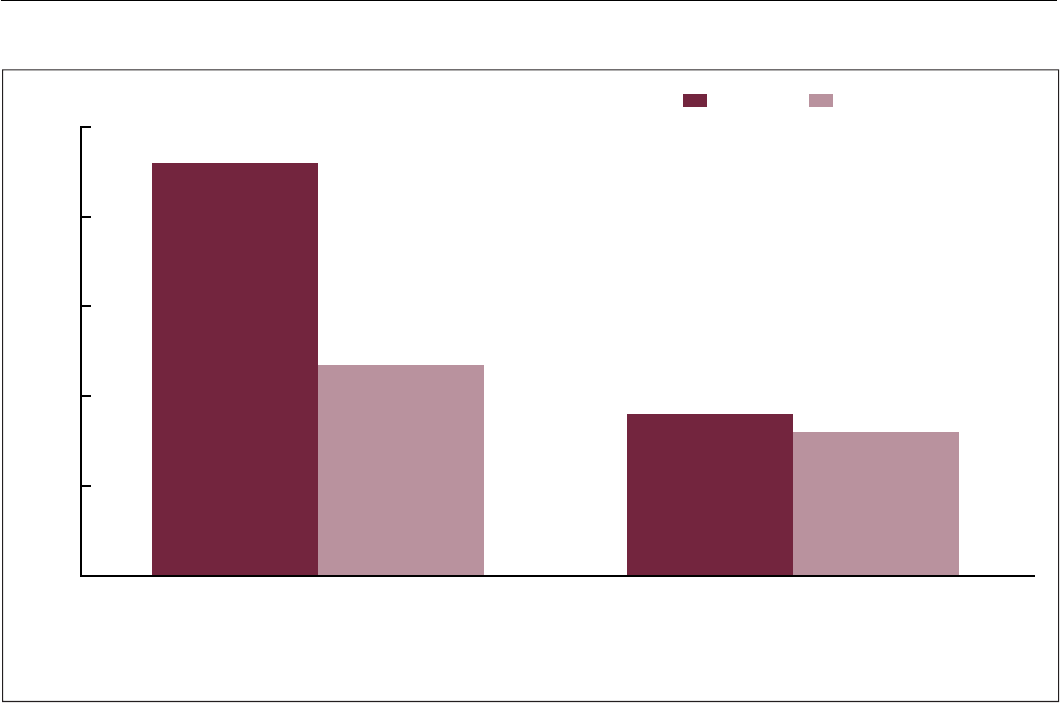
Among adults with family incomes
of less than 200% FPL, the percentage
of adults who were dissatisfied or very
dissatisfied with life was higher among
U.S.-born adults (9.2%) compared with
adults born outside the United States
(4.7%) (Figure 5). Among adults with
family incomes of 200% or more FPL,
the percentage of adults who were
dissatisfied or very dissatisfied with life
was similar by nativity status (3.6% for
those born in the United States and 3.2%
for those born outside the United States).
Summary
In 2021, 4.8% of adults were
dissatisfied or very dissatisfied with
life. Adults with family incomes of less
than 200% FPL were more likely to be
dissatisfied or very dissatisfied with
life compared with adults with family
incomes greater than 200% or more FPL.
Among adults with family incomes of less
than 200% FPL, additional differences
were observed by sex, age group, race
and Hispanic origin, and nativity status.
Men, adults ages 45–64, White adults,
Black adults, and adults born in the
United States were more likely to report
being dissatisfied or very dissatisfied with
life compared with their counterparts.
No differences were observed among
adults with family incomes of 200% or
more FPL. This suggests that the overall
differences in life dissatisfaction by these
demographic characteristics are largely
driven by people with lower incomes.
This report aligns with previous
research noting associations between
life dissatisfaction and socioeconomic
disadvantage (14,25). It is also consistent
with recent research that found a lower
likelihood of dissatisfaction with life
among Hispanic and Asian adults
(26). Results by nativity status are also
consistent with prior studies, which
examined life satisfaction among non-
U.S.-born Hispanic adults and immigrants
from other racial and ethnic backgrounds
compared with native-born adults (8,9).
The findings in this report also confirm
previous research, which has found a
greater likelihood of dissatisfaction with
life among Black adults compared with
White adults (7,26).
This report demonstrates the
importance of stratifying by income when
examining life satisfaction as a national
indicator of well-being. Although the
percentage of life dissatisfaction is
Figure 2. Percentage of adults ages 18 and older who were dissatised or very dissatised with life, by sex and family income:
United States, 2021
Percent
1
Significantly different from adults with family incomes of 200% or more of the federal poverty level (FPL) (p < 0.05).
2
Significantly different from men (p < 0.05).
NOTE: Estimates are based on household interviews of a sample of the U.S. civilian noninstitutionalized population.
SOURCE: National Center for Health Statistics, National Health Interview Survey, 2021.
0
2
4
6
8
10
WomenMenTotal
Less than 200% FPL
Overall
200% or more FPL
4.8
1
8.1
1
9.3
1,2
7.2
3.6
3.8
3.4
National Health Statistics Reports Number 192 November 2, 2023 Page 5
Figure 4. Percentage of adults ages 18 and older who were dissatised or very dissatised with life, by race and Hispanic origin and family
income: United States, 2021
Figure 3. Percentage of adults ages 18 and older who were dissatised or very dissatised with life, by age group and family income:
United States, 2021
1
Significantly different from adults with family incomes of 200% or more of the federal poverty level (FPL) (p < 0.05).
2
Significant quadratic trend by age (p < 0.05).
NOTE: Estimates are based on household interviews of a sample of the U.S. civilian noninstitutionalized population.
SOURCE: National Center for Health Statistics, National Health Interview Survey, 2021.
65 and older45–6418–44
200% or more FPLLess than 200% FPL
Percent
0
2
4
6
8
10
12
1,2
6.8
1
11.1
1
7.2
3.3
3.8
3.9
3.4
3.7
2,3
5.0
3
9.7
0
2
4
6
8
10
12
White, non-Hispanic HispanicBlack, non-HispanicAsian, non-Hispanic
200% or more FPLLess than 200% FPL
Percent
1
Significantly different from Black non-Hispanic adults (p < 0.05).
2
Significantly different from White non-Hispanic adults (p < 0.05).
3
Significantly different from adults with family incomes of 200% or more of the federal poverty level (FPL) (p < 0.05).
4
Significantly different from Hispanic adults (p < 0.05).
NOTE: Estimates are based on household interviews of a sample of the U.S. civilian noninstitutionalized population.
SOURCE: National Center for Health Statistics, National Health Interview Survey, 2021.
1–3
4.7
2–4
9.0
2.6
3.8
Page 6 National Health Statistics Reports Number 192 November 2, 2023
satisfaction in the United States. Qual
Life Res 18(2):179–89. 2009.
Available from: https://doi.org/10.1007/
s11136-008-9426-2.
8. Calvo R, Carr DC, Matz-Costa C.
Another paradox? The life satisfaction
of older Hispanic immigrants in
the United States. J Aging Health
29(1):3–24. 2016.
9. Calvo R, Carr DC, Matz-Costa C.
Expanding the happiness paradox:
Ethnoracial disparities in life
satisfaction among older immigrants
in the United States. J Aging Health
31(2):231–55. 2017.
10. VanderWeele TJ, Trudel-Fitzgerald C,
Allin PV, Farrelly C, Fletcher G,
Frederick DE, et al. Current
recommendations on the selection of
measures for well-being. Prev Med
1;133:106004. 2020.
11. Lee H, Singh GK. Inequalities in life
expectancy and all-cause mortality
in the United States by levels of
happiness and life satisfaction: A
longitudinal study. Int J MCH AIDS
9(3):305–15. 2020.
relatively low among the total adult
population (4.8%), these results suggest
that the prevalence of life dissatisfaction
is higher among certain demographic
subgroups of adults with lower incomes.
For example, 11% of adults ages 45–64
with family incomes of less than 200%
FPL were dissatisfied or very dissatisfied
with life compared with 3% of adults of
this age group with family incomes of
200% or more FPL. The inclusion of life
satisfaction on the 2021 NHIS provides
a population baseline of well-being,
and its continued inclusion will allow
documentation of progress toward the
Healthy People 2030 goals of improving
overall well-being and reducing
disparities in well-being.
References
1. Organisation for Economic
Co-operation and Development.
OECD guidelines on measuring
subjective well-being. 2013. Paris,
France: OECD Publishing. Available
from: https://dx.doi.org/10.1787/
9789264191655-en.
2. Koh HK, Piotrowski JJ,
Kumanyika S, Fielding JE. Healthy
people: A 2020 vision for the social
determinants approach. Health Educ
Behav 38(6):551–7. 2011.
3. Healthy people 2030 framework.
Available from: https://health.gov/
healthypeople/about/healthy-people-
2030-framework.
4. Pavot W, Diener E. The Satisfaction
With Life Scale and the emerging
construct of life satisfaction. J Posit
Psychol 3(2):137–52. 2008.
5. Cheung F, Lucas RE. Assessing
the validity of single-item life
satisfaction measures: Results from
three large samples. Qual Life Res
23(10):2809–18. 2014.
6. Joshanloo M, Jovanović V. The
relationship between gender and
life satisfaction: Analysis across
demographic groups and global
regions. Arch Womens Ment Health
23(3):331–8. 2020.
7. Barger SD, Donoho CJ, Wayment
HA. The relative contributions of
race/ethnicity, socioeconomic status,
health, and social relationships to life
Figure 5. Percentage of adults ages 18 and older who were dissatised or very dissatised with life, by nativity status and family income:
United States, 2021
Percent
1
Significantly different from adults with family incomes of 200% or more of the federal poverty level (FPL) (p < 0.05).
2
Significantly different from adults not born in the United States (p < 0.05).
NOTE: Estimates are based on household interviews of a sample of the U.S. civilian noninstitutionalized population.
SOURCE: National Center for Health Statistics, National Health Interview Survey, 2021.
0
2
4
6
8
10
Born outside United States U.S.-born
200% or more FPLLess than 200% FPL
1,2
9.2
1
4.7
3.6
3.2

National Health Statistics Reports Number 192 November 2, 2023 Page 7
12. Kim ES, Delaney SW, Tay L, Chen Y,
Diener ED, Vanderweele TJ. Life
satisfaction and subsequent physical,
behavioral, and psychosocial health in
older adults. Milbank Q 99(1):209–39.
2021.
13. Steptoe A. Happiness and health.
Annu Rev Public Health 40(1):339–59.
2019.
14. Cheung F, Lucas RE. When does
money matter most? Examining the
association between income and
life satisfaction over the life course.
Psychol Aging 30(1):120–35. 2015.
Available from: https://doi.org/10.1037/
a0038682.
15. Reiners AA, Azevedo RC, Cardoso JD,
Espinosa MM, Santana AZ.
Dissatisfaction with life and associated
factors in older community-dwelling
adults. Revista Brasileira de Geriatria
e Gerontologia 23(6). 2020.
16. Killingsworth MA. Experienced
well-being rises with income, even
above $75,000 per year. Proc Natl Acad
Sci USA 118(4):e2016976118. 2021.
17. Miller AL, Bhattacharyya M,
Bhattacharyya R, Frankhauser F,
Miller LE. Determinants of life
dissatisfaction among adults in the
United States: A cross-sectional
analysis of the National Health
Interview Survey. Medicine
(Baltimore) 102(32):e34488. 2023.
18. Tay L, Zyphur M, Batz-Barbarich C.
Income and subjective well-being:
Review, synthesis, and future research.
In: Diener E, Oishi S, Tay L (editors).
Handbook of well-being. Salt Lake
City, UT: DEF Publishers. 2018.
19. Gallup News Service. Gallup poll
social series: Mood of the nation.
2022. Available from: https://news.
gallup.com/file/poll/389318/
220202Issue-Satisfaction.pdf.
20. National Center for Health Statistics.
National Health Interview Survey:
2021 survey description. 2022.
Available from: https://ftp.cdc.gov/
pub/Health_Statistics/NCHS/
Dataset_Documentation/NHIS/2021/
srvydesc-508.pdf.
21. U.S. Census Bureau. Poverty
thresholds. 2021. Available from:
https://www.census.gov/data/tables/
time-series/demo/income-poverty/
historical-poverty-thresholds.html.
22. National Center for Health Statistics.
Multiple imputation of family income
in 2020 National Health Interview
Survey: Methods. 2021. Available
from: https://ftp.cdc.gov/pub/
Health_Statistics/NCHS/Dataset_
Documentation/NHIS/2020/NHIS2020
-imputation-techdoc-508.pdf.
23. RTI International. SUDAAN (Release
11.0.3) [computer software]. 2018.
24. Parker JD, Talih M, Malec DJ,
Beresovsky V, Carroll M, Gonzalez
JF Jr, et al. National Center for Health
Statistics data presentation standards
for proportions. National Center for
Health Statistics. Vital Health Stat
2(175). 2017.
25. Lund JJ, Chen TT, LaBazzo GE,
Hawes SE, Mooney SJ. The
association between three key social
determinants of health and life
dissatisfaction: A 2017 behavioral risk
factor surveillance system analysis.
Prev Med 153:106724. 2021.
26. Wadsworth T, Pendergast PM. Race,
ethnicity and subjective
well-being: Exploring the disparities
in life satisfaction among Whites,
Latinx, and Asians. Int J Community
Wellbeing 11(2):51–72. 2021.

National Health Statistics Reports Number 192 November 2, 2023
For more NCHS NHSRs, visit:
https://www.cdc.gov/nchs/products/nhsr.htm.
For e-mail updates on NCHS publication releases, subscribe online at: https://www.cdc.gov/nchs/email-updates.htm.
For questions or general information about NCHS: Tel: 1–800–CDC–INFO (1–800–232–4636) • TTY: 1–888–232–6348
Internet: https://www.cdc.gov/nchs • Online request form: https://www.cdc.gov/info • CS343319
FIRST CLASS MAIL
POSTAGE & FEES PAID
CDC/NCHS
PERMIT NO. G-284
U.S. DEPARTMENT OF
HEALTH & HUMAN SERVICES
Centers for Disease Control and Prevention
National Center for Health Statistics
3311 Toledo Road, Room 4551, MS P08
Hyattsville, MD 20782–2064
OFFICIAL BUSINESS
PENALTY FOR PRIVATE USE, $300
Suggested citation
Ng AE, Adjaye-Gbewonyo D, Cibelli Hibben K.
Demographic differences in life dissatisfaction
among adults: United States, 2021. National
Health Statistics Reports; no 192. Hyattsville,
MD: National Center for Health Statistics. 2023.
DOI: https://dx.doi.org/10.15620/cdc:133057.
Copyright information
All material appearing in this report is in
the public domain and may be reproduced
or copied without permission; citation as to
source, however, is appreciated.
National Center for Health Statistics
Brian C. Moyer, Ph.D., Director
Amy M. Branum, Ph.D., Associate Director for
Science
Division of Health Interview Statistics
Stephen J. Blumberg, Ph.D., Director
Anjel Vahratian, Ph.D., M.P.H., Associate
Director for Science
Division of Research and Methodology
Jennifer D. Parker, Ph.D., Director
John Pleis, Ph.D., Associate Director for
Science
