Why Local Food Matters:
Views from the National Landscape
Debra Tropp,
Supervisory Agricultural Marketing Specialist
Farmers Market and Direct Marketing Research

Table of Contents
What do we mean by local food?
Relationship of local food to U.S. food system
Importance of local food demand
Growth of local food marketing outlets
Demand drivers and trends
What does the future of local food look like?
Is there room for further growth?
How do AMS programs facilitate market access for
local food?

What is Local?
A food product that is raised, produced, aggregated,
stored, processed, and distributed in the locality or region
in which the final product is marketed.
No official national designation, though some
individual USDA programs use a broad (maximum)
definition:
Less than 400 miles from the origin of the product, or
Within the State in which the product is produced.
Includes both direct-to-consumer sales AND
intermediated sales by distributors/food hubs
To restaurants, grocery stores, schools/universities,
hospitals, et. al.

How Are Consumer Perspectives Changing?
Phil Lambert, “Supermarket Guru”, 2013:
People are choosing their foods more holistically based on
multiple “food factors”:
Taste
Ingredients
Source
Nutritional composition
Asking who is making their foods
Understanding impact on environment and animal welfare
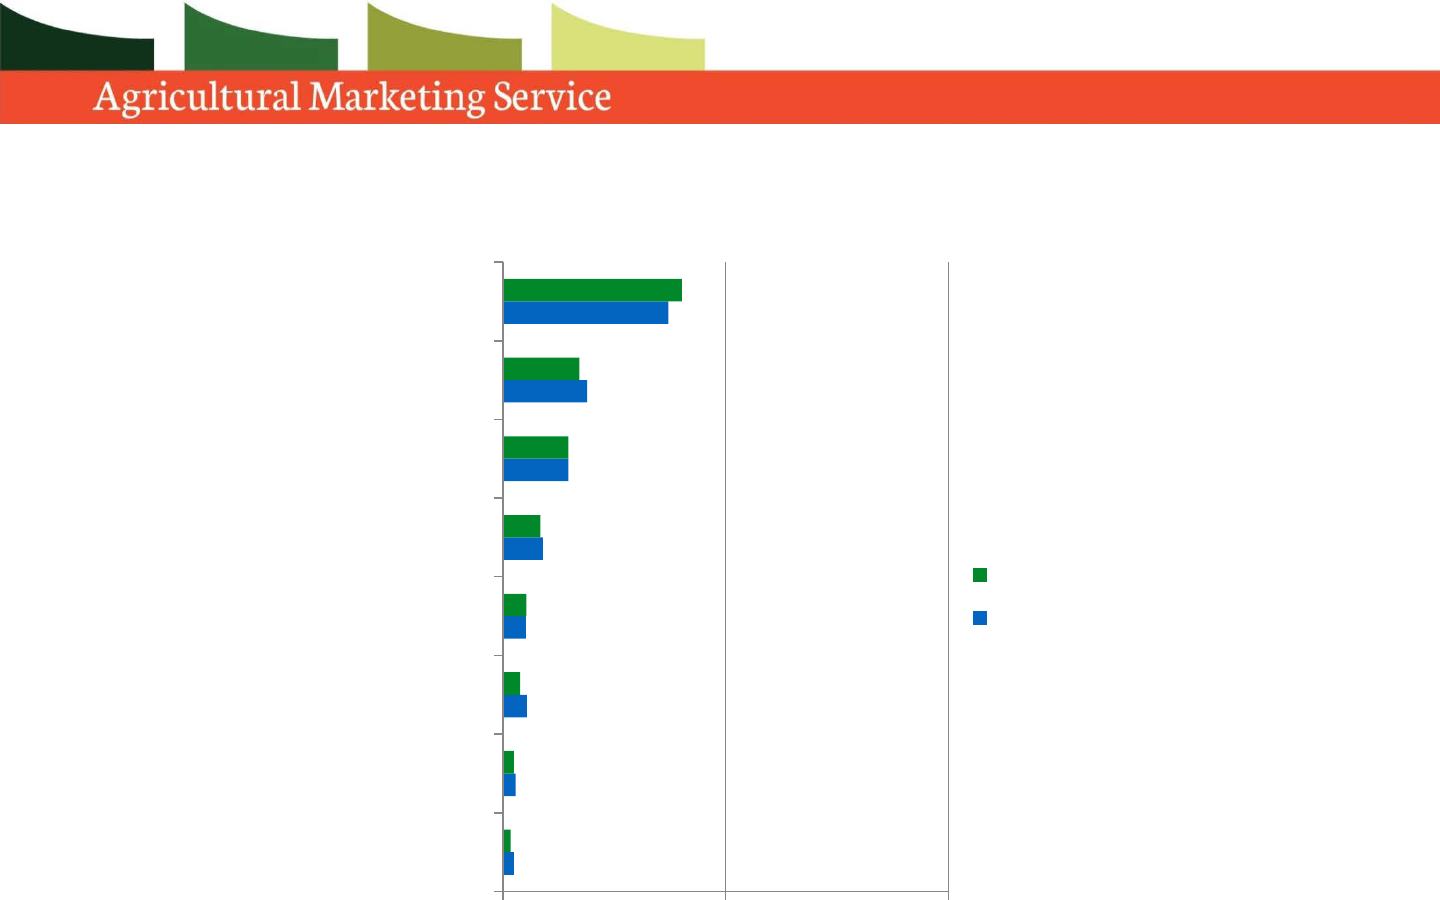
Consumers Lean Toward Alternative Store Formats
2.50
2.90
5.40
5.20
9.00
14.70
18.90
37.20
1.80
2.50
3.90
5.30
8.50
14.70
17.20
40.20
0 50 100
E-commerce
Dollar store
Fresh format/limited assortment
Drug store
Wholesale format
Convenience stores
Supercenters
Traditional supermarket
2013 Market Share
2018 Projected Market Share
2014 Retail Shop Topic, Jones Lang LaSalle, September 2014, available from
http://www.us.jll.com/united-states/en-us/Research/JLL-ShopTopic-Grocery-share.pdf?aa79b615-6518-4080-af03-e6104ea59d91

Rise of Fresh Format Stores
Strongest growth in “fresh format” stores
These food stores emphasize perishables and offer
center-store assortments that differ from those of
traditional retailers—especially in the areas of ethnic,
natural, and organic foods
Examples: Whole Foods, The Fresh Market

How Does Local Food Demand Correspond to
Changing Consumer Preferences?
In alignment with growing demand for freshness,
product integrity and transparency, local food
purchasing provides consumers with the opportunity to:
Obtain food items with superior quality characteristics
– freshness, flavor, ripeness, enhanced shelf life – and
possibly enhanced nutritional density (more research still
needed)?
Learn about farming practices used (often directly from
growers if through farmers markets or CSAs)
Have greater confidence in the integrity and quality of
the food they purchase
Reward sustainable production practices

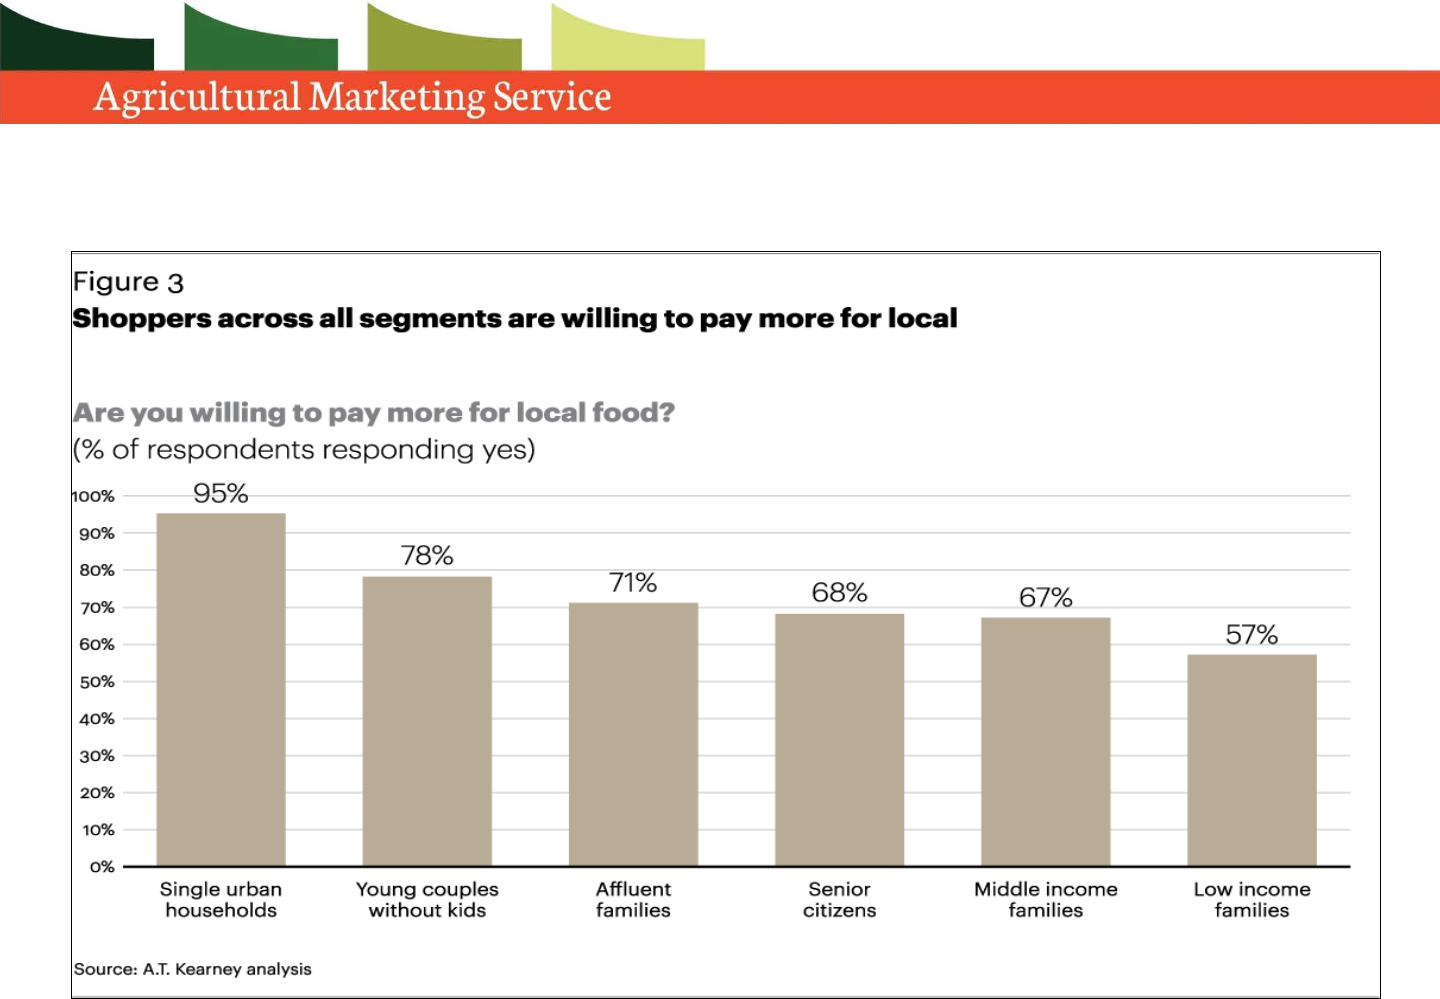
Demand Drivers Among Consumers
Kearney report: grocery shoppers embrace the increase
in local food options because they believe it:
helps local economies (66 percent)
delivers a broader and better assortment of products
(60 percent)
provides healthier alternatives (45 percent)
improves the carbon footprint (19 percent)
increases natural or organic production (19 percent)
Approximately 70% of restaurant operators surveyed in
2014 said their patrons were more interested in locally
sourced items than they were two years earlier.
90% for fine dining restaurants.
A.T. Kearney, “Buying Into the Local Food Movement”, February 2013, National Restaurant
Association's 2014 Restaurant Industry Forecast
Demand Drivers Among Consumers
Observations from a 2015 study by Dr. Ion Vasi, an
associate professor with a joint appointment in the
Department of Sociology and Tippie College of Business
at the University of Iowa:
The local food market is what sociologists call a
moralized market, where people combine
economic activities with their social values.
It’s not just about the economical exchange; it’s a
relational and ideological exchange as well
It’s about valuing the relationship with the farmers and
people who produce the food and believing that how
they produce the food aligns with your personal
values

Demand Drivers Among Consumers
UI researchers discovered local food markets were more
likely to develop in areas where residents had a strong
commitment to civic participation, health, and the
environment
For his study, Vasi examined the development of local
food markets by looking at the number of farmers
markets, food coops, community-supported agriculture
providers, and local food restaurants in cities across the
United States. Researchers also conducted 40 interviews
with consumers and producers in different local food
markets in Iowa and New York.

Demand Drivers Among Consumers
Top 10 Menu Trends for 2015
1. Locally sourced meats and seafood
2. Locally grown produce
3. Environmental sustainability
4. Healthful kids’ meals
5. Natural ingredients/minimally processed foods
6. New cuts of meat (e.g. Denver steak, pork flat iron)
7. Hyper-local sourcing (e.g., restaurant gardens)
8. Sustainable seafood
9. Food waste reduction/management
10. Farm/estate branded items
Source: National Restaurant Association “What’s Hot” Chef Survey

Demand Drivers Among Consumers
Availability of locally grown produce and other local
packaged foods have become major influences on
grocery shopping decisions
87.2% say it is “very or somewhat important” to their
choice of a primary food store, up slightly from the 2013
level of 85.0%
Leading the “very important” component (44.2%)
Hispanics (53.3%)
Single-person households (49.4%)
Adults between the ages of 50 and 64 (46.2%)
2/3 of survey respondents endorse efforts of their
primary supermarket to support nearby local food sources.
Source: National Grocery Association and Supermarket Guru
Consumer Panel Survey 2014

Demand Drivers Among Consumers
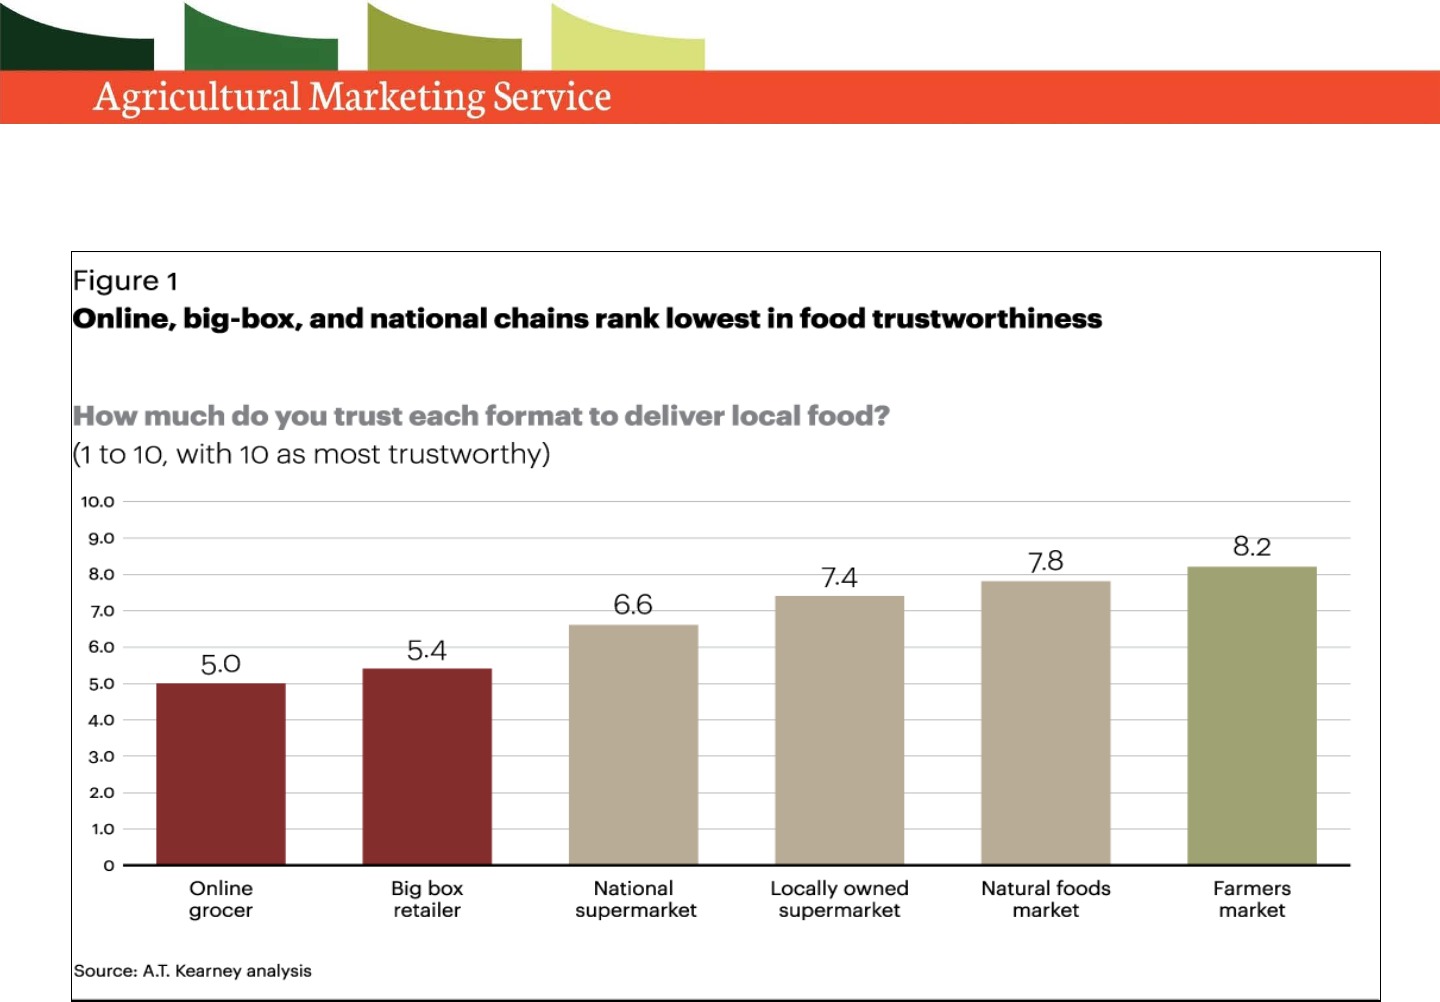
Shoppers will switch stores for local food selection
Almost 30% of grocery shoppers say they
consider purchasing food elsewhere if their
preferred store does not carry local foods.
Respondents say their main source for local food
is still the local farmers market and farm stores.
Only 5% indicate they shop for local foods at
big-box retailers, and 15% at national
supermarkets
Source: A.T. Kearney, “Buying Into the Local Food Movement”, January 2013
Demand Drivers Among Consumers
Consumers Willing to Shop Around for Quality Perishables
Channel
Primary Food
Source
Primary Source
of Fresh
Produce
Secondary
Source of Fresh
Produce
Supermarkets 76% 56% ↓
29%
Warehouse
clubs/supercenters
19% 10% ↓
23%
Health food stores 2% 2% 8%
Farmers markets 1% 25% ↑
12%
Other direct from
producer
1% 5% ↑
3%
Specialty store 1% 1% 3%
No preference – – 22%
Colorado State University Survey of U.S. Adults (2006), based on national consumer
panel data
Demand Drivers Among Consumers
Demand Drivers Among Consumers
Direct to consumer (DTC) food sales for human
consumption still represent a very small share of the
national food supply:
But if we take into account direct and intermediated
sales of local food products, the picture begins to
change:
Nearly 8 percent of U.S. farms participated in local
food marketing channels as of 2012 (Low, 2015)
Local Food’s Contribution to National Food System
Year
Total
Agricultural
Sales ($000)
Direct-to-Consumer
Sales of Ag. Products
for Human
Consumption ($000)
Ratio of Direct-to-
Consumer Sales to
Total Agricultural
Sales (%)
2012 394,644,481 1,309,827 0.3

Estimated 2012 local food sales: $6.11 billion
Of which
$3.35 billion (54.8 percent) was generated by farms that
exclusively
used intermediated wholesale marketing
channels
• Only 22,600 farms, 148K per farm
$1.15 billion (18.8 percent) was generated by farms which
exclusively
used DTC channels
• Approximately 5x as many farms (112,304) as those
which only used intermediated channels, 10.2K per farm
Remaining $1.61 billion sold through both channels
.
Most Local Food Sold Through Intermediaries
Source: Low (USDA Economic Research Service, January 2015)
Why Intermediated Sales?
430
288
180
0 200 400 600
Farm to School Programs
Food Hubs
Farmers Markets
Growth between 2007 and 2014 (Percent)
Prompted by:
Growing retail and food service buyer interest in meeting
consumer demand for local foods
Producer interest in catering to higher- volume wholesale clients
Comparatively low revenues from labor-intensive direct to
consumer marketing
Growing producer ability to provide deliveries of local products
in commercial-sized volume over longer portions of the year,
supported by aggregation services and season extension technology

Farm Level Challenges with Local Food
Not always so easy for local farmers to access
larger-volume marketing channels
Individual farm operators often lack individual capacity to
meet buyer requirements for product volume, quality,
consistency, variety, or extended availability.
Farmers continue to be challenged by the lack of
distribution, processing and marketing infrastructure
that would give them wider market access to larger volume
customers

Meanwhile, Commercial Buyers Are Looking For:
Traceback mechanisms and recordkeeping
Many commercial, institutional and retail buyers want to
procure local food products that can be traced back to the
originating farm in the event of a foodborne illness outbreak.
Smaller and mid-scale farmers often lack capacity to
establish adequate recordkeeping or product
monitoring systems by themselves
Food safety
Commercial and institutional customers are increasingly
demanding third-party certifications of production/handling
processes (e.g., GAP, GHP), which many smaller farmers
have not had to address in the past
Food Safety Modernization Act may result in new
requirements and expectations
USDA believes regional food hubs can play an
important role in supporting these small and mid-size
farmers through aggregation, collective marketing, and
facilitative services

Defining Characteristics of Regional Food Hubs
Carry out or coordinate the aggregation, distribution,
and marketing of primarily locally/regionally
produced foods
Move product from multiple producers to multiple
markets
Producers considered valued business partners
instead of interchangeable suppliers
Committed to buying from small to mid-sized
producers whenever possible.
Use product differentiation strategies (e.g., identity
preservation, group branding, sustainable production
practices, etc.) to ensure that producers maximize
returns from their products.
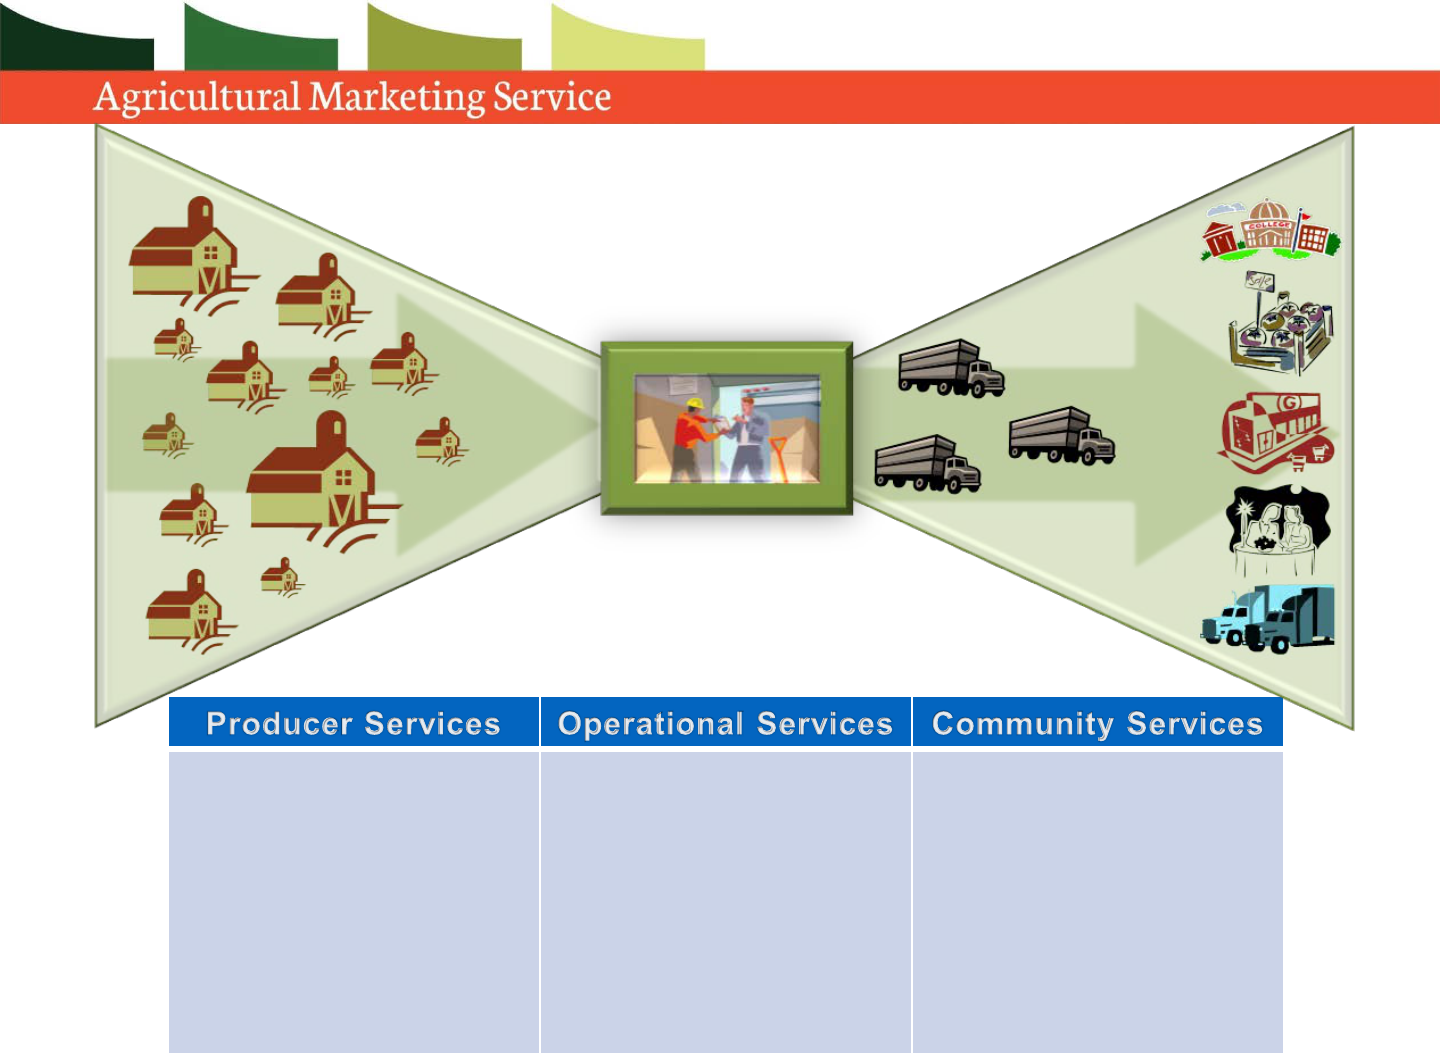
Regional Food Hubs
Actively linking producers to
markets
On-farm pick up
Production and post-harvest
handling training
Business management
services and guidance
Value-added product
development
Food safety and GAP training
Liability insurance
Aggregation
Distribution
Brokering
Branding and market
development
Packaging and repacking
Light processing (trimming,
cutting, freezing)
Product Storage
“Buy Local” campaigns
Distributing to “food deserts”
Food bank donations
Health screenings, cooking
demonstrations
SNAP redemptions
Educational programs
Youth and community
employment opportunities
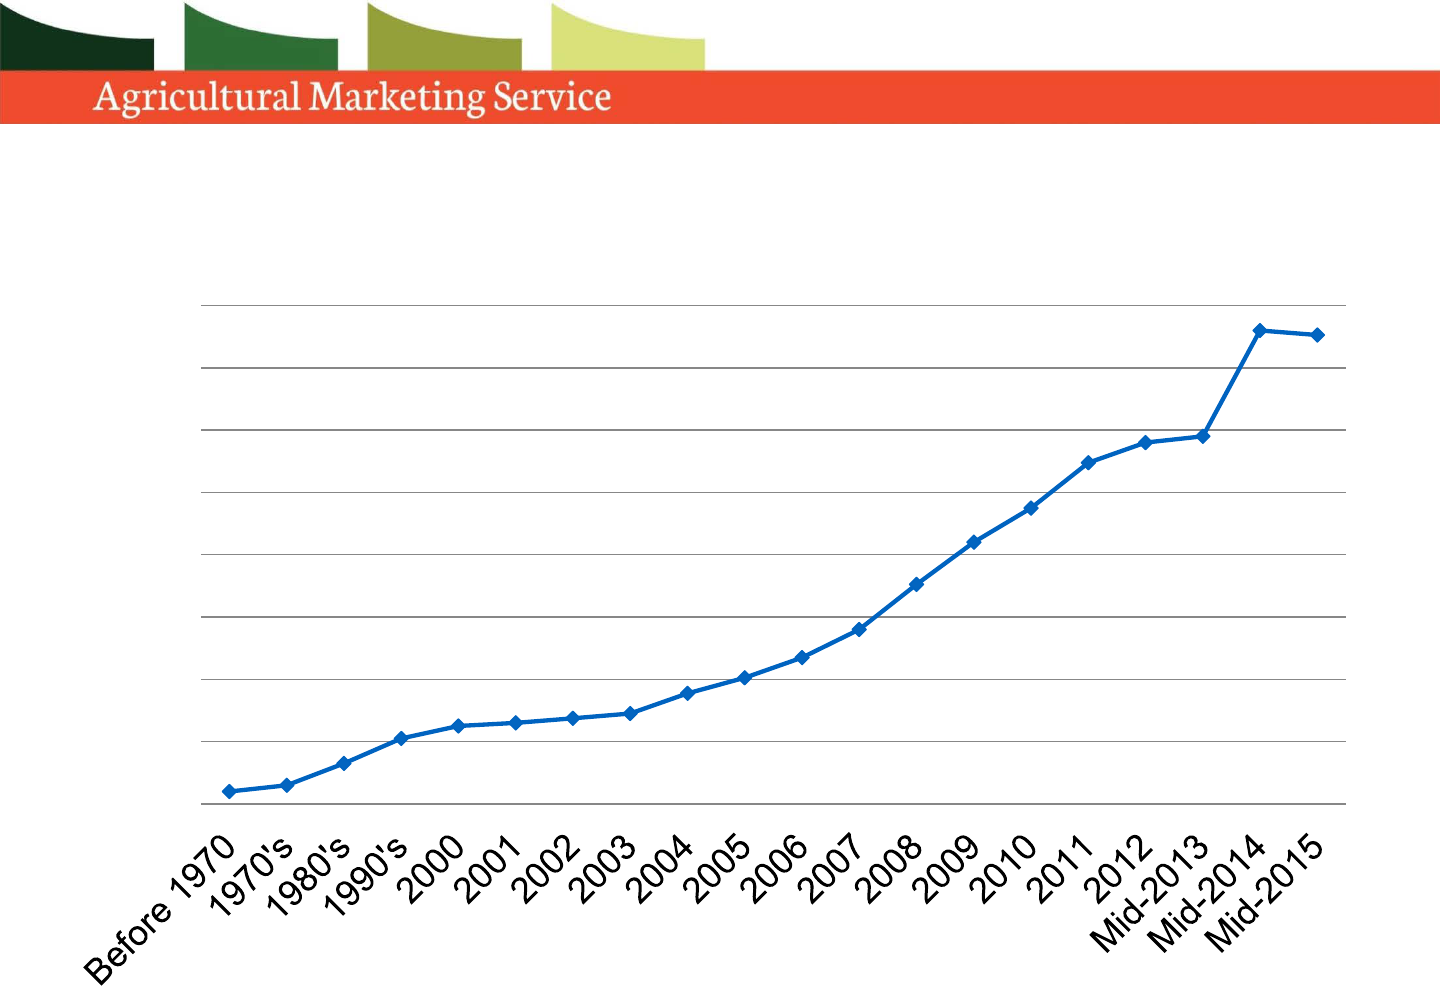
Regional Food Hubs
0
40
80
120
160
200
240
280
320
Growth in the Number of Food Hubs (1970s-2014)*
Based on a working list of food hubs identified by the NGFN Food Hub Collaboration
http://www.ers.usda.gov/data-products/food-dollar-series/documentation.aspx
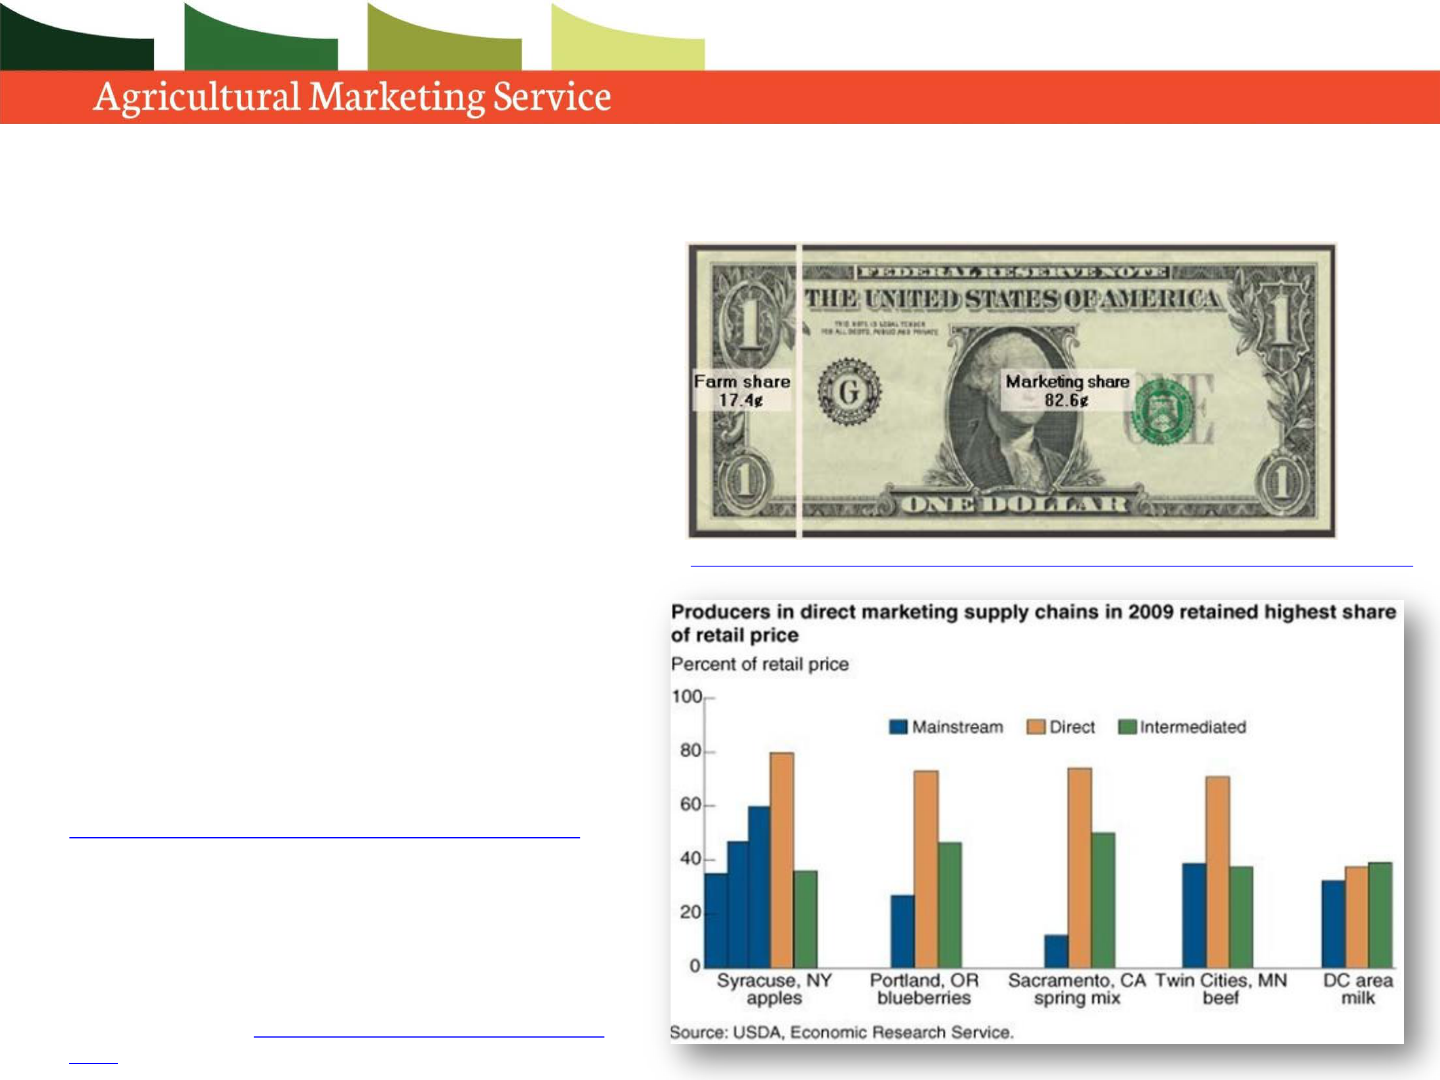
Farm Share of U.S. Consumer Food Dollar (2012)
Different story in local food
systems…
In “short” supply chains, local
producers received up to seven
times the share of the retail price
compared to mainstream chains -
USDA ERS report
http://www.ers.usda.gov/media/122609/err99_1_.pdf
Food hubs often return between
75 to 85 percent of their wholesale
sales revenues to their producers -
USDA AMS report
http://dx.doi.org/10.9752/MS046.04-
2012
In mainstream supply chains,
farmers retain only 17.4 cents
of the consumer food dollar on
average
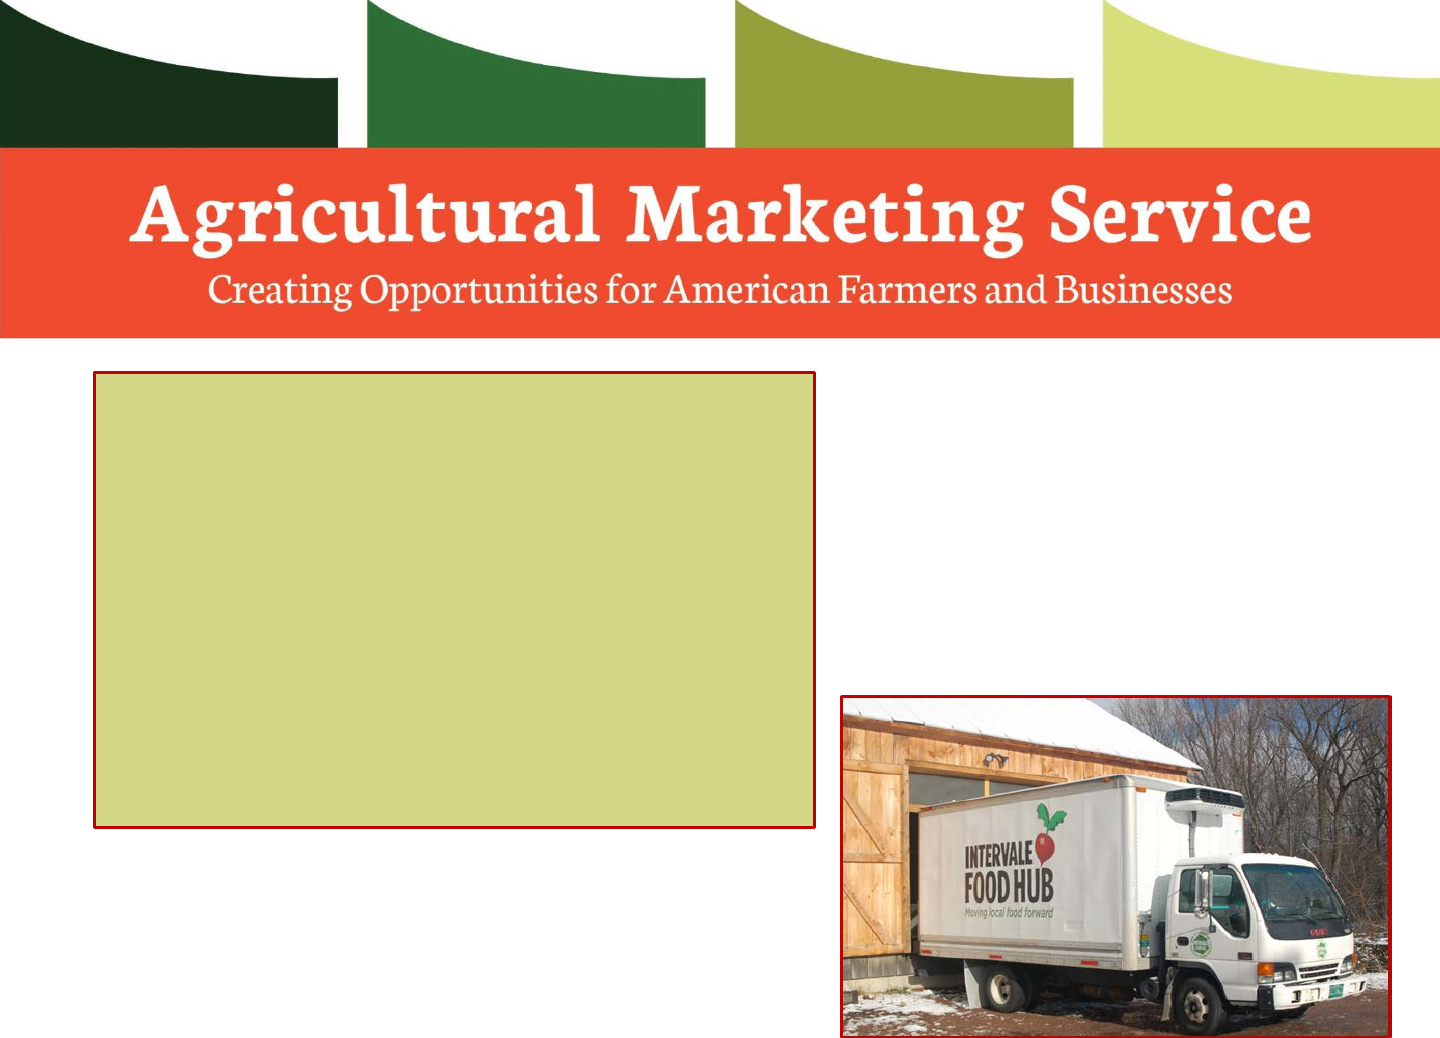
Example One: Intervale Food Hub,
Burlington, VT
Intervale works with producers to determine prices
based on actual production costs for producers and
what the market can realistically manage.
Intervale’s producers generally net 60-70% of the
retail revenue obtained from CSAs and 85% of the
revenue obtained from distribution to wholesale
customers through the hub.
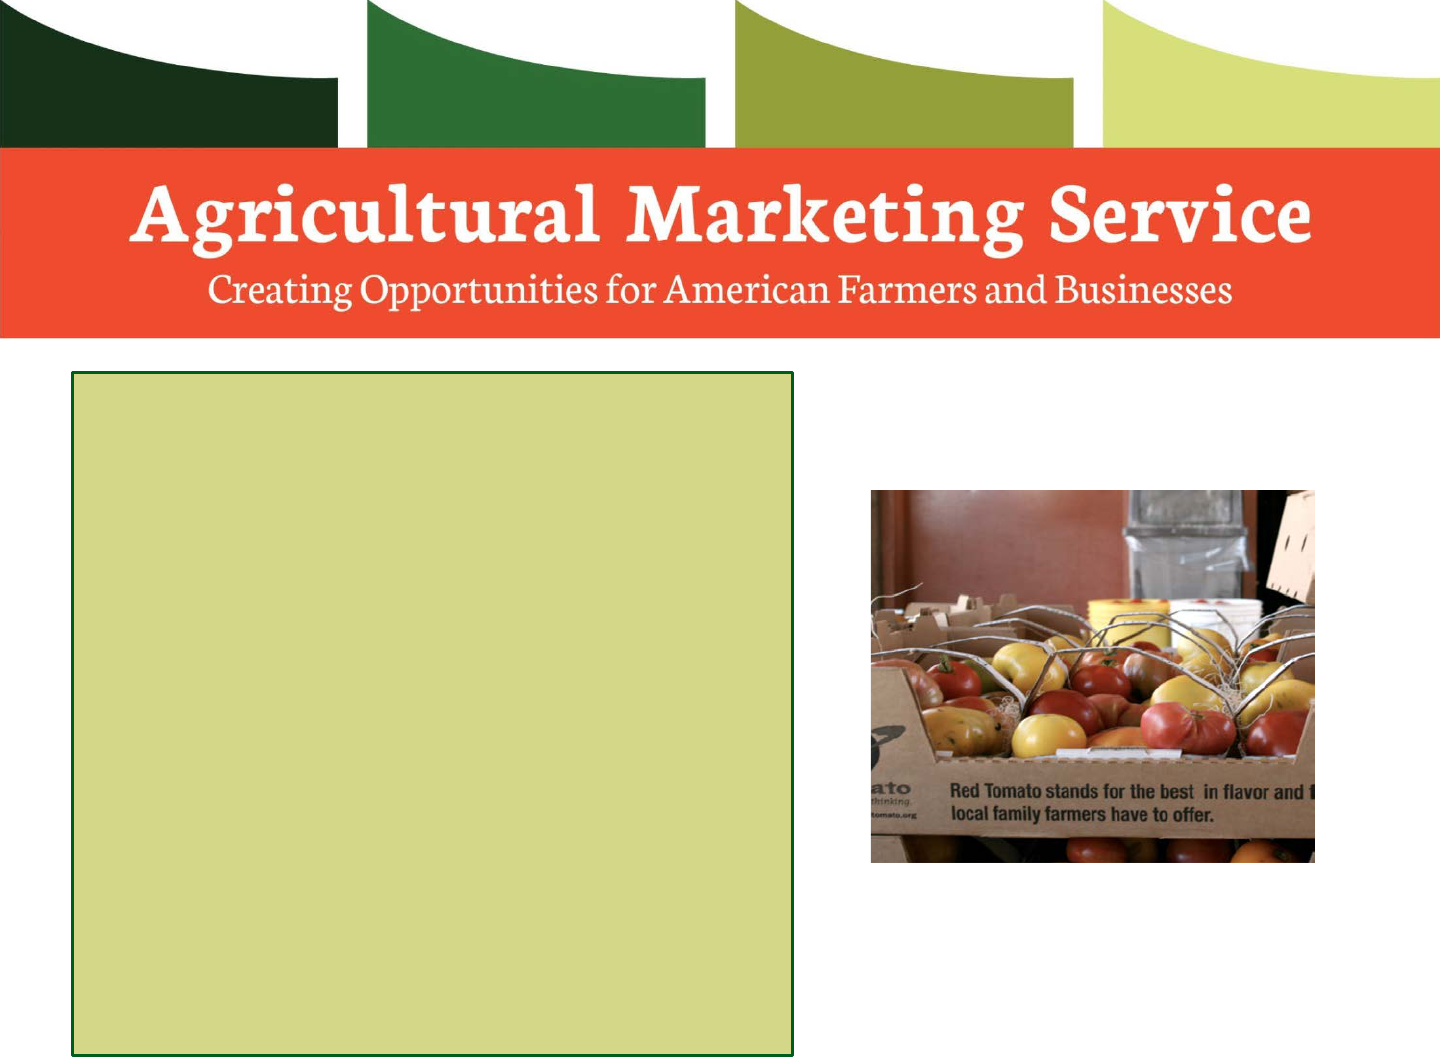
Example Two: Red Tomato, Canton, MA
Coordinates aggregation, transportation and
sales for roughly 40 farmers to grocery stores in
the NE (including Trader Joe’s)
Employs a variety of product differentiation
strategies – regional branding, source
identification and the verified use of sustainable
production practices like IPM
November 2009 case study: retailer agreed to
sell RT’s tomatoes at $2.79/lb. compared to
standard retail price for the same commodity of
$1.99/lb. given the unique attributes of the
product
Combination of cost savings in shared logistics
and a higher wholesale price led RT’s producers
to receive 3x higher returns than they received
for comparable items outside the value chain

Example of Food Hub/Retail Partnership
In August 2013, Milwaukee-based Roundy's Inc.,a large
regional supermarket chain and the market leader in
metropolitan Milwaukee, formed a partnership with the
Madison-based Wisconsin Food Hub Cooperative. The
cooperative, based in Madison, supplies a variety of produce
to Roundy’s stores in Wisconsin operating under the Pick 'n
Save, Copps and Metro Market banners.
Participating stores frequently use point-of-purchase
displays to promote the program.
The Wisconsin Food Hub Cooperative generated
approximately $3 million in produce revenues in 2013,
after only a year in operation
Example of Food Hub/Retail Partnership
The partnership with Roundy's is
designed to get food from farm to
warehouse and on its way to grocery
stores as quickly as 24 hours from
when the produce is picked, said Ron
Balsimo, sales manager for the
cooperative. "You can't get any fresher
unless you walked into a field and picked
it yourself,“
The cooperative has grown to more than
100 members, "and they keep coming,"
Balsimo said.
Starting to see some farmers expand
their plantings because of the hub

Benefits of Food Hub/Retail Partnership
There are demonstrated sales gains that come from
locally grown food programs in grocery stores, says Bill
Justin, president of W.L. Justin & Assoc., a supermarket
consulting company based in Atlanta. "We find that you can
actually increase total store sales," he said.
He has seen examples of such programs increasing sales
by as much as 15% to 20% in the produce department.
Having sources of local produce can also help mitigate
any potential supply concerns brought about by the
extreme drought in California’s produce-growing regions.
Future Demand Drivers?
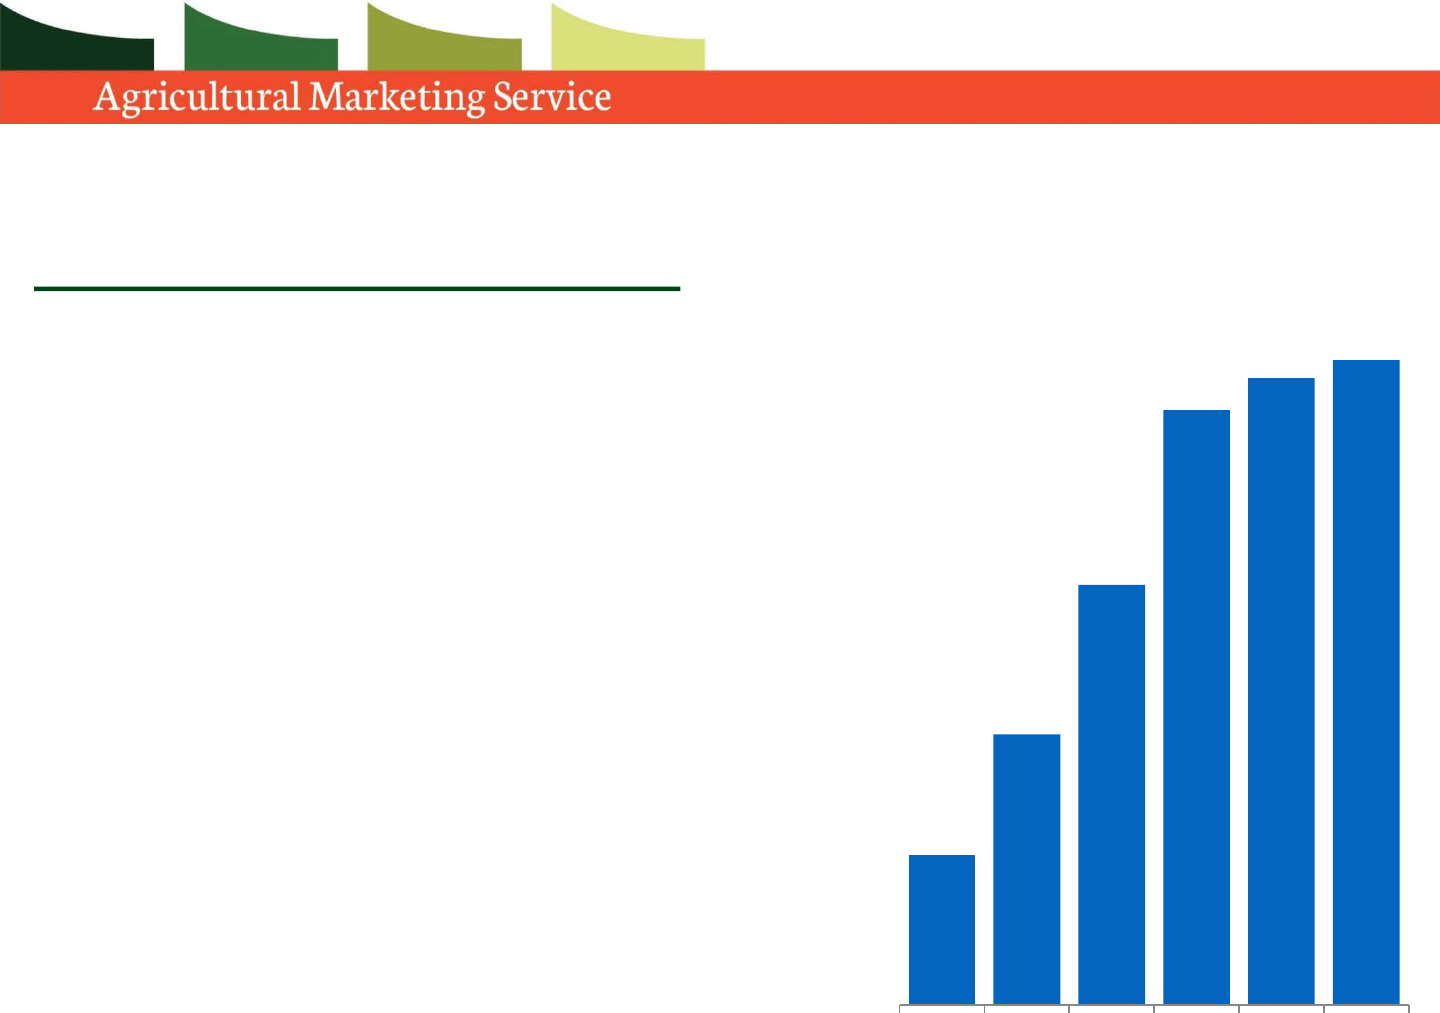
Nutrition Assistance Programs
Acceptance of SNAP benefits at farmers
markets and farm stands rose from
approximately 900 sites in 2009 to more
than 6,400 in 2014. The value of
redemptions grew from $4 million to
nearly $19 million, due to:
Pro-active outreach by USDA Food and
Nutrition Service (FNS) to certify markets
and vendors
AMS and FNS grants for EBT equipment
installation
Rise of non-profit voucher programs (i.e.,
Wholesome Wave, Fair Food Network)
Rise of mobile FMs in low-income areas
$4,173,323
$7,547,028
$11,725,316
$16,598,255
$17,500,000
$18,800,000
2009 2010 2011 2012 2013 2014

Future Demand Drivers?
Schools
Farm to school programs now exist in more than 42,000 schools
Schools spent more than $600 million on local food in the 2013-14
school year, up 55% from the previous year.
Hospitals
Growing number of farmers markets operating at hospitals and
health care facilities
More than 90 reported in USDA National Farmers Market Directory
at hospitals or public health facilities
Kaiser Permanente lead in early years; recent campaign to
introduce them at VA hospitals
Military Bases
New DoD “healthy base initiative” aims to expand farmers
markets on base, local food in commissaries
Joint USDA/DoD Report on FMs at military bases released in
November 2015

AMS Programs and Services
AMS Connection to Local Food
Division Structure
Applied Research Reports
Facility Design
Grants
Farmers Market Promotion Program (FMPP)
Local Food Promotion Program (LFPP)
Specialty Crop Block Grant (SCBG)
Federal-State Marketing Improvement Program
(FSMIP)
Cost-Share for Organic Certification
Legislative Authority Supports USDA/AMS Interest
in Locally-Grown Food
1946 Agricultural Marketing Act:
Agency mandated to reduce distribution costs and the
price spread between producers and consumers
Directed to market the “full production” of American
farmers—regardless of scale—in a useful, economical,
profitable, and orderly manner
Improvement of overall dietary and nutritional
standards is a primary policy goal
1976 Farmer to Consumer Direct Marketing Act:
Encourages promotion of direct farm marketing
activities for mutual benefit of farmers and consumers

Legislative Authority Supports USDA/AMS Interest
in Locally-Grown Food
Bottom line: USDA/AMS is mandated to:
Support the development and creation of shorter food
supply chains wherever feasible
Work to ensure that food producers receive a greater
share of the final retail price that consumers pay
Support profitable marketing of all American farmers at
all scale levels
Promote direct marketing of farm products where it
provides mutual benefit to farmers and consumers
Farmers Markets and Direct-to-Consumer Marketing
Through market research, analysis, data products and
other tools, we help stakeholders better understand
trends in the rapidly evolving direct to consumer
marketplace.
Maintains four national directories on local food (FMs
[8,527], CSAs [668], food hubs [153], on-farm markets
[1,313]) at www.usdalocalfooddirectories.com
FM directory selected as first Federal API in 2013!
Administers voluntary FM market manager surveys
Developing national surveys for CSAs, food hubs, on-farm
markets (directories launched in 2014)
Structure of AMS Local Food Research &
Development Division
Food Hubs and Other Aggregation Models
Conducts research on emerging business enterprises
that offer aggregation, distribution, and/or marketing
services to small and mid-sized agricultural producers
who cater to local food markets.
Facility Design
Provides targeted site assessment, design services
and layout analysis for food market and facility
personnel to improve the efficiency of permanent food
market, distribution and warehouse facilities.
Structure of AMS Local Food Research &
Development Division
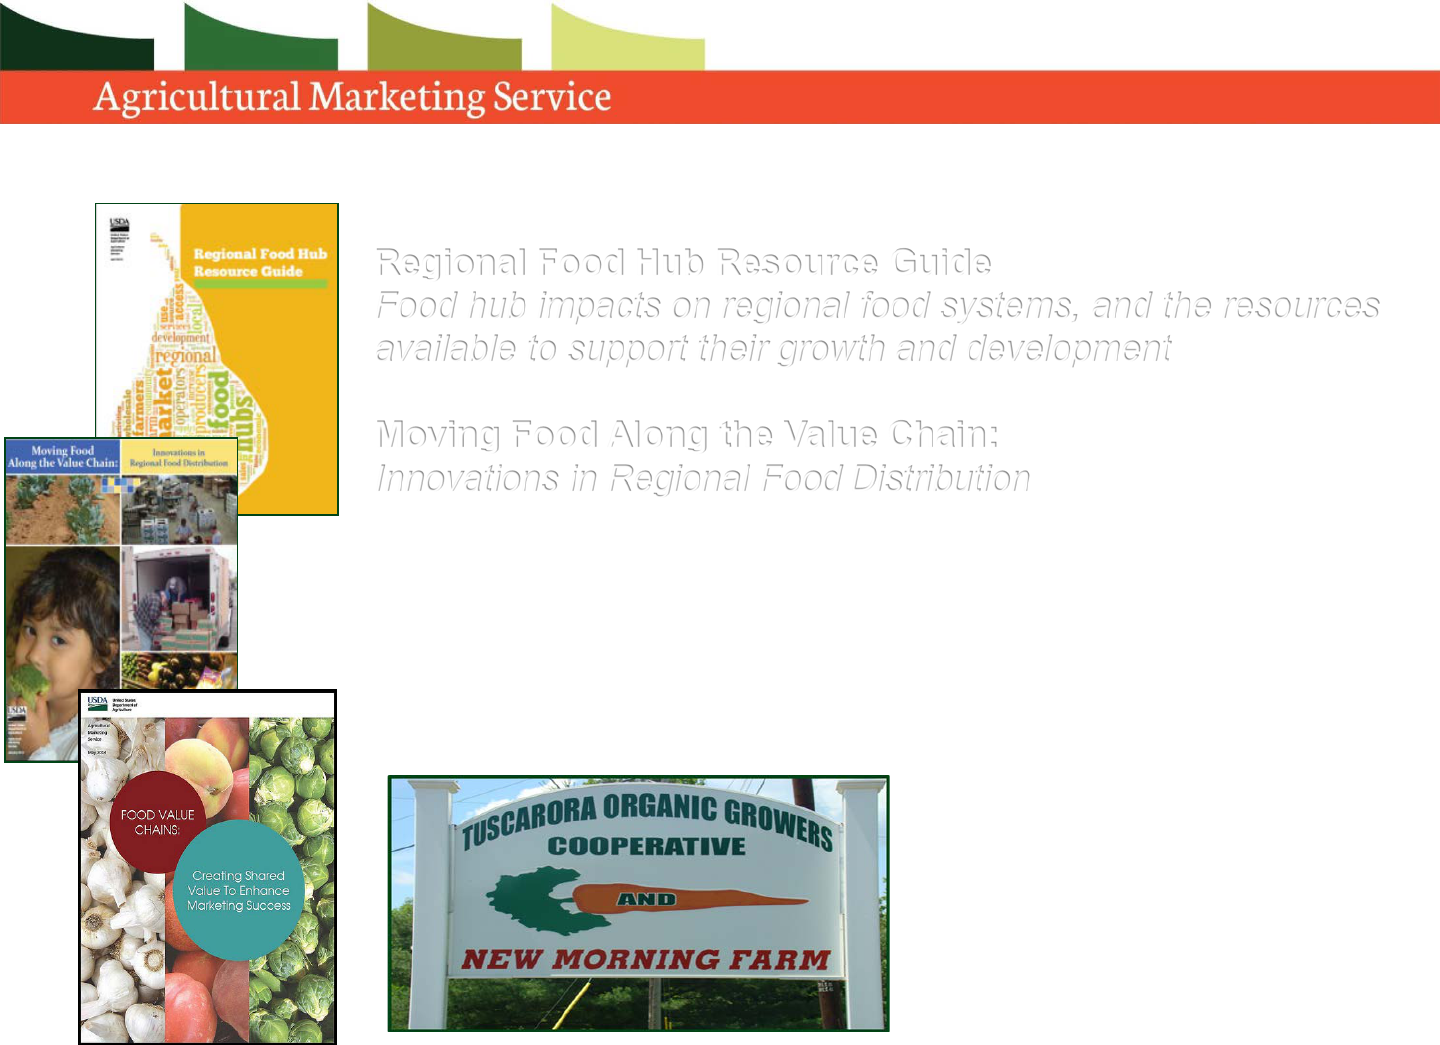
Regional Food Hub Resource Guide
Food hub impacts on regional food systems, and the resources
available to support their growth and development
Moving Food Along the Value Chain:
Innovations in Regional Food Distribution
Food Value Chains:
Creating Shared Value to Enhance Marketing Success
Building a Food Hub from the Ground Up:
A Facility Design Case Study of Tuscarora Organic Growers
Research/TA Reports on Local Food Systems

Upcoming Releases in early CY 2016:
The Evolving CSA Business Model (results of national survey and
focus group interviews in six states)
Potential Demand for Local Agricultural Products by Mobile
Markets
Local Food Economic Assessment Toolkit: a guide to creating
your own community assessment using secondary/primary data and
IMPLAN input/output software
Research Reports on Local Food Systems

Why an Economic Impact Toolkit?
The recent sharp increase in market demand for local
foods, currently estimated by USDA to be over $6 billion
in value, has sparked a groundswell of interest and
investment in local food systems.
Community planners, public officials, and private
foundations are increasingly interested in exploring the
potential of local food in generating economic growth
and business development.
Unfortunately, many of these initiatives lack a clear
roadmap for measuring and evaluating their overall
impact.

Why an Economic Impact Toolkit?
To provide community planners and other stakeholders
with better ways of assessing outcomes of proposed local
food investments, USDA/AMS asked Colorado State
University to convene a group of leading U.S.
researchers and consultants to synthesize current best
practices
The project team members chosen to create the Toolkit
were deliberately selected because of their specific
research expertise in local food systems and
economic impact assessment.

Toolkit Learning Objectives
The Toolkit contains seven modules that offer real-world,
practical guidance to planners, economic development
specialists, and others interested in assessing the
economic impact of local food system interventions. Topics
covered include:
Framing research approaches
Collecting primary data
Compiling data from secondary sources
Developing a solid grasp of economic multipliers
and their limitations as measurement tools
Making effective use of input/output software
Customizing it as needed to better reflect local food
system conditions.

Grants: Farmers Market Promotion Program
Mission: To increase domestic consumption of, and
access to, locally and regionally produced agricultural
products, and to develop new market opportunities for
farm and ranch operations serving local markets
Diverse applicant eligibility (non-profits, local governments,
producer networks, etc.) Excludes state governments and
individual producers
Only funds direct producer-to-consumer marketing activities
(e.g., FMs, CSAs, on-farm markets)
Approximately $13 million in funding available in FY 2016
$25,000-$100,000 per grant
RFA likely to be released in March 2016

Mission: To increase domestic consumption of, and
access to, locally and regionally produced
agricultural products marketing through
intermediaries (not direct to consumer)
Launched in FY 2014, result of new Farm Bill
Approximately $13 million in funding available in FY 2016
Planning Grants – up to $25,000 each
Implementation Grants - up to $100,000 each
Diverse applicant eligibility (State governments and
individual producers are prohibited)
RFA for FY 2016 likely to be released in March 2016
Grants: Local Food Promotion Program
Agency oversees management of grants administered
by State Departments of Agriculture solely to enhance
the competitiveness of specialty crops
Specialty crops are defined as “fruits, vegetables, tree
nuts, dried fruits, horticulture, and nursery crops (including
floriculture)”
$63 million in funding was available in FY 2015 (pro-rated
based on state share of specialty crop production)
Grants: Specialty Crop Block Grant Program

NEW: Multi-State Specialty Crop Block
Grant Program
Designed to:
Support food safety and research
Address plant pests, disease, and crop-specific
issues
Increase marketing opportunities for specialty crops
Announced September 4, 2015
Applications must be submitted to www.grants.gov
by January 14, 2016

Program is open to state departments of agriculture in
the 50 States, the District of Columbia, the
Commonwealth of Puerto Rico, Guam, American Samoa,
the United States Virgin Islands, and the Commonwealth
of the Northern Mariana Islands.
Involves at least two partners located in different
states. USDA encourages other State agencies, Tribal
governments, universities, non-profits, and other
specialty crop organizations to partner with participating
State departments of agriculture
NEW: Multi-State Specialty Crop Block
Grant Programs

NEW: Multi-State Specialty Crop Block
Grant Program
Priority areas:
• Benefitting underserved communities and veterans
• Improving producers’ and facilities’ capacity to comply
with the requirements of the Food Safety Modernization
Act
• Developing adaptation and mitigation strategies for
farmers in drought-stricken regions of the country
• Increasing opportunities for new and beginning farmers
• Developing strong local and regional food systems
• Protecting pollinator habitats/improving pollinator
health
• Supporting the growth of organic specialty crops.

Provides matching funds to State Departments of
Agriculture, State agricultural experiment stations,
and other appropriate State agencies
Assists in exploring new market opportunities for U.S.
food and agricultural products, and to encourage
research and innovation aimed at improving the
efficiency and performance of the marketing system
About $1 million per year
Funds approximately 20 projects per year at an average
of $50,000 per grant
Grants: Federal-State Marketing Improvement Program
As of FY 2016, being administered by AMS/TM/Grants Division
(not NOP)
Organic producers can be reimbursed up to 75 percent of their
certification costs (not to exceed $750)
Two organic certification cost share programs were offered in
2015, valued at $11.9 million
National Organic Certification Cost Share Program
(NOCCSP) - $11 million per year
Agricultural Management Assistance (AMA) Organic
Certification Cost Share Program - $900K per year
• Available to organic producers (crop and livestock operators only)
in CT, DE, HI, MA, ME, MD, NH, NJ, NV, PA, RI, VT, WV, WY
Cost-Share for Organic Certification