Detecting Exoplanets Answer Key
1. Normalized flux is the total amount of light arriving from the star, when the “normal” amount is set to
1.00. What do you expect will happen to the normalized flux of the star as the exoplanet passes in front?
What will the plot look like?
The flux will decrease as the planet enters the disk of the star then increase again as the planet leaves the
disk of the star. I expect to see a flat horizontal line with a deep well in the middle.
2. If the normalized flux dipped from 1 to 0.5, what does that suggest about the light from the star?
It would mean that half of the brightness from the star was being blocked by the planet when it passed
between the star and Earth.
3. Why does the data table include a column for “error”? What does “error” mean in scientific data?
In scientific data, error can be due to inaccuracy or imprecision. These errors can be caused by many things,
including human mistakes, defects or limitations in the tools or changing environmental factors.
4. Plot the data points from the data sheet to create a light curve by copying and pasting the data into
Google Sheets, Excel or a similar graphing program or by plotting on graph paper. Make sure that the
independent variable is graphed on the x-axis and the dependent variable is on the y-axis. Include a title
for your graph, labels for the x-axis and the y-axis, and units as needed. Insert a screenshot or photo of
your light curve below.
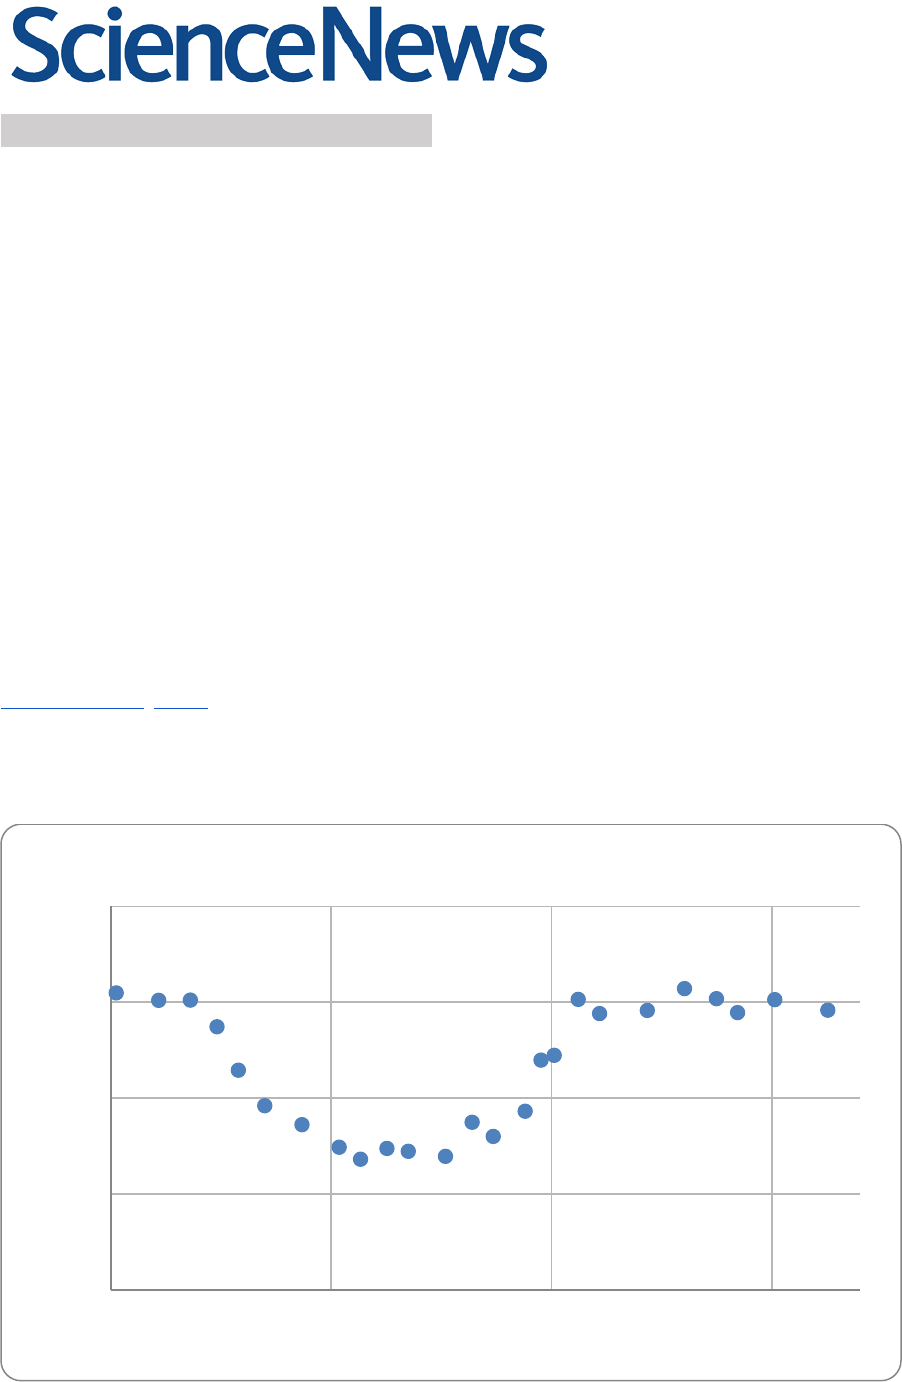
0.97
0.98
0.99
1.00
1.01
5:00 6:00 7:00 8:00
Normalized flux
Timestamp (hh:mm)
Exoplanet orbiting GSC 00522-01199

5. Based on what you have learned about exoplanet detection methods, does your graph of the data
support the presence of an exoplanet? Explain your reasoning.
Yes, the graph supports the existence of an exoplanet because the amount of light is constant but then
decreases for a short period of time. This indicates that a planet is transiting across the star, blocking some
of the star’s light as it is seen from Earth.
6. This type of data is normalized so that the average brightness of the target star is 1 and complete
darkness is 0. However, when you look at the data points on the y-axis, what do you notice? What do you
think this indicates?
Some of the data points are greater than 1. This could be due to instrumental error or error caused by
changes in ambient light, the atmosphere or temperatures. Also, because the value for the brightness of the
target star is an average, some values for its brightness would be greater than or less than 1.
7. If you wanted to include the error column’s data in your graph, how would you represent it? What
could have caused these errors?
The error could be shown as vertical bars at each data point. The error line will be centered on the data
point with the full value above and the full value below, because the error is based on the amount of
normalized flux, which is on the y-axis. The errors could have been caused by instrument inaccuracy or
changing atmospheric conditions.
8. What are your observations about your light curve? Are your observations in line with what you
thought you would see in your light curve?
The brightness of the star is not exactly 1 when the exoplanet isn’t transiting; the dip is slightly rounded at
the bottom, and the sides of the dip are slanted. I thought the dip caused by the transiting exoplanet would
have straight sides and be flat across the bottom, so there must be something else going on.
9. The “depth” of transit is the amount of light from the star that is blocked by its exoplanet when the
exoplanet is between the star and Earth. What is the approximate depth of transit (as a percentage) for
your exoplanet?
Approximately 1.5 percent of the star’s light is being blocked by the exoplanet because the flux changes from
the top to the bottom of the dip by about 0.015.
10. The approximate size of the planet can be found using the equation:
=
If the radius of the star is 0.834 solar radii (0.834 times the radius of our sun), what is the radius of the
planet?
Radius of our sun = 696,342 km
Radius of the star = 0.834 x 696,342 km = 580,749 km
R
planet
= (580,749 km)√0.015 = 71,127 km = 7.11 x 10
4
km

11. How does the size of the exoplanet compare with a planet within our own solar system?
The radius of the exoplanet is very similar to Jupiter’s radius; the exoplanet is 1.02 Jupiter radii.
12. What points on your light curve could you use to calculate the time it takes the exoplanet to complete
its transit? Why?
I would use the points on the light curve where the dip just begins and ends to calculate the transit time
because that is when the exoplanet begins and ends its transit.
13. Based on your graph, how long does the exoplanet take to transit its star using your defined points
from the previous question?
Using those points, the exoplanet takes about 1 hour 40 minutes to complete its transit.
14. Multiple, consecutive light curves are needed to calculate an exoplanet’s orbital period (year).
Kepler’s third law
=
(
)
allows us to calculate the distance (a) between a star and its orbiting
planet, if we know the masses of the star and planet and the planet’s orbital period. When the mass of the
planet (M
2
) is very tiny compared with the mass of its star (M
1
), we can assume that the sum of the two
(M
1
+ M
2
) will be about the same as the mass of the star alone (M
star
).
If the orbital period (P) of your exoplanet is 51.7 hours, and the mass of the star (M
1
) is 0.84 solar masses
(0.84 times the mass of our sun), what is the distance (a) between the exoplanet and its star in
kilometers? Note that G is the gravitational constant, which is equal to 6.673 x 10
-11
m
3
kg
-1
s
-2
.
Mass of our sun = 1.989 x 10
30
kg
Mass of the star = 0.84 x 1.989 x 10
30
kg = 1.671 x 10
30
kg
Converting orbital period from hours to seconds to match units of G: 51.7 hours = 186,120 seconds
=
4
(
+
)
=
(
+
)
4
=
(
+
)
4
=
(186,120 )
(6.673 10
)(1.671 10
)
4
=
9.783 10
= 4.6 10
The exoplanet is about 4.6 x 10
6
km from its star.
15. Not all information about an exoplanet can be determined from a single light curve. What additional
information would you need to calculate further details about the exoplanet?
Multiple consecutive transits would need to be observed to calculate the exoplanet’s year. Once the year is
determined, the distance the planet orbits from its star could be calculated. Further observation using
methods such as radial velocity would allow astronomers to calculate the actual mass of the exoplanet. Once
you have the mass and radius of the exoplanet, the density of the planet could be calculated, allowing
astronomers to determine whether the exoplanet is terrestrial or gaseous.

© Society for Science & the Public 2000–2020. All rights reserved.
