

DRAFT Lee County Human Services Gap Analysis
Intenonally le blank.

DRAFT Lee County Human Services Gap Analysis
Analytica
POB 998 352-339-6090 Voice
Newberry, FL 32669 888-287-3959 Fax
Herb@analyca-group.com www.analyca-group.com
February 5, 2020
Mr. Glen Salyer
Assistant County Manager
Lee County, Florida
Dear Glen:
Enclosed are the ndings of the Gap Analysis of Human Services in Lee County. Per your
direcon, this report is intended to be of value to the community focusing on a range of
services, not solely on the responsibilies of the Lee Board of County Commissioners (BoCC).
Consistent with that direcon, these ndings incorporate the perspecves of many human
service providers in the County. There has been a high level of parcipaon through various
means by people too numerous to thank personally. They have demonstrated in this study
what I believe to be one of the strengths of the County’s human services community a high
level of cooperaon focused on their clients’ and the community’s best interests.
This study was only possible in this meframe with the extensive support provided by County
sta. Please contact me if you have quesons or comments. It was a pleasure to work with
you on this project.
Cordially,
Herbert A. Marlowe, Jr., Ph.D.
Principal

DRAFT Lee County Human Services Gap Analysis
Intenonally le blank.
DRAFT Lee County Human Services Gap Analysis
Table of Contents
Transmial Leer
EXECUTIVE SUMMARY ................................................................................................................... 1
Chapter 1 - Introducon ................................................................................................................ 9
SECTION ONE: QUANTITATIVE DATA ............................................................................................ 15
Chapter 2 - Lee County Descripon and Demographics ............................................................. 17
Chapter 3 - Behavioral Outcomes ................................................................................................ 31
Chapter 4 - Comparison of Recent Community Surveys ............................................................. 79
SECTION TWO: INFRASTRUCTURE ............................................................................................... 89
Chapter 5 - Housing ..................................................................................................................... 91
Chapter 6 - Transportaon ........................................................................................................ 105
Chapter 7 - Food Security and Nutrion ................................................................................... 111
Chapter 8 - Employment ........................................................................................................... 131
Chapter 9 - Stang .................................................................................................................... 135
Chapter 10 - County Facilies .................................................................................................... 153
Chapter 11 - Organizaonal Capacity ........................................................................................ 155
Chapter 12 - Informaon Technology ........................................................................................ 161
SECTION THREE: DEVELOPMENT - THE FOUNDATION .............................................................. 165
Chapter 13 - Children and Youth Development ........................................................................ 167
SECTION FOUR: SYSTEMS OF CARE ........................................................................................... 197
Chapter 14 - Behavioral Health ................................................................................................. 199
Chapter 15 - Criminal Jusce and Behavioral Health ................................................................ 217
Chapter 16 - Child Abuse and Neglect, Foster Care and Adopon ........................................... 241
Chapter 17 - Domesc Violence ................................................................................................ 255
Chapter 18 - Elder Abuse, Neglect and Exploitaon ................................................................. 259
Chapter 19 - Sexual Violence and Stalking ................................................................................ 269
Chapter 20 - Trauma and Eects of Violence Exposure ............................................................ 277
Chapter 21 - Suicide and Self-harm ........................................................................................... 289
Chapter 22 - Juveniles ............................................................................................................... 297
Chapter 23 - Homelessness ....................................................................................................... 307

DRAFT Lee County Human Services Gap Analysis
SECTION FIVE: SPECIAL POPULATIONS ...................................................................................... 325
Chapter 24 - Persons with Intellectual and Developmental Disabilies ................................... 327
Chapter 25 - Deafness and Blindness: Birth or Early Childhood Development......................... 353
Chapter 26 - Persons with other Physical Disabilies ............................................................... 361
Chapter 27 - Seniors .................................................................................................................. 373
Chapter 28 - Veterans ................................................................................................................ 385
SECTION SIX: GEOGRAPHY......................................................................................................... 391
Chapter 29 - Spaal Match Analysis .......................................................................................... 393
SECTION SEVEN: FUNDING ........................................................................................................ 397
Chapter 30 - Funding Responsibilies ....................................................................................... 399
Chapter 31 - Equity Funding ...................................................................................................... 403
Chapter 32 - County Funding ..................................................................................................... 405
SECTION EIGHT: CONCLUSIONS ................................................................................................. 413
Chapter 33 - Core Drivers .......................................................................................................... 415
Chapter 34 - Board of County Commissioners - Specic Issues ................................................ 445
Chapter 35 - Conclusions ........................................................................................................... 449
APPENDICES ............................................................................................................................... 457
Appendix A - Human Services Gap Survey ................................................................................ 459
Appendix B - Comprehensive Health Needs Assessment ......................................................... 467
Appendix C - Needs Assessment for CSBG Work Plan ............................................................... 467
Appendix D - 2019 - 2023 Consolidated Plan HUD.................................................................... 467
Appendix E - Connuum of Care Plan ....................................................................................... 467
Appendix F - Impediments to Fair Housing Choice ................................................................... 467
Appendix G - Lee County Parks and Recreaon CIP .................................................................. 469
Appendix H - Lee Count Library CIP ........................................................................................... 473
Appendix I - Child Well-Being Index Summary .......................................................................... 475
Appendix J - Calculang Household Income ............................................................................. 491
Appendix K - The Bell Curve and Smoothing Data .................................................................... 495

DRAFT Lee County Human Services Gap Analysis
Index of Data Tables
Table 1. Populaon Change Countywide ..................................................................................... 19
Table 2. Limited English Prociency Language Group, 2017 ........................................................ 20
Table 3. Lee County Race/Origin ................................................................................................... 22
Table 4. Income and Benets (In 2018 Inaon Adjusted Dollars) ............................................... 24
Table 5. Percentage Below Poverty Level in the Last 12 Months ................................................. 25
Table 6. Florida Occupaonal Employment and Wages; Cape Coral-Fort Myers MSA ................. 27
Table 7. Comparison of Aggregated Data ..................................................................................... 34
Table 8. Behavioral Health Outcomes ........................................................................................... 35
Table 9.Comparison of Violence related Behaviors ...................................................................... 41
Table 10. Comparison of Nutrional Related Outcomes .............................................................. 45
Table 11. Comparison of Alzheimer’s and HIV Outcomes ............................................................ 47
Table 12. Comparison of Health Pracces .................................................................................... 48
Table 13. Access to Services .......................................................................................................... 50
Table 14. Facilies ......................................................................................................................... 53
Table 15. Comparave Housing Data ............................................................................................ 54
Table 16. Birth Data ....................................................................................................................... 55
Table 17. Health Indicators for Children and Youth ...................................................................... 56
Table 18. Violence Outcomes regarding Children and Youth ........................................................ 58
Table 19. Foster Care Outcomes ................................................................................................... 59
Table 20. Home Status of Children and Youth .............................................................................. 59
Table 21. Overall Child Wellbeing Rankings: Top 10 Counes 3-Year Average ............................. 62
Table 22. Comparison of Overall CSC Counes and Lee County Ranks on Child Wellbeing ......... 63
Table 23. County Rankings on Specic Child Wellbeing Variables ................................................ 64
Table 24. Ranked Comparison Results for Lee County on Specic Kids Count Metrics ................ 66
Table 25. Comparison of Average County Scores ......................................................................... 69
Table 26. CSC Funding and Per Capita (Youth) .............................................................................. 70
Table 27. Poverty ........................................................................................................................... 73
Table 28. Mental Health Services .................................................................................................. 80
Table 29. Housing .......................................................................................................................... 82
Table 30. Transportaon ............................................................................................................... 84
Table 31. Child-care ....................................................................................................................... 85
Table 32. Homelessness ................................................................................................................ 86
Table 33. Special Populaons ........................................................................................................ 87
Table 34. Comparave Housing Data ............................................................................................ 92
Table 35. Lee County Renter Household Income .......................................................................... 93
Table 36. Lee County Distribuon of Paid Rent Ranges ................................................................ 93
Table 37. Annotated Distribuon of Paid Rent Ranges ................................................................. 94
Table 38. Aordable Rent Income (@30%) vs Available Units at that Income ............................. 94
Table 39. Low Income Housing in Lee County .............................................................................. 95
Table 40. Rental Cost-burden in Lee County ................................................................................. 97
Table 41. Comparison of Various Access Indicators ...................................................................... 98

DRAFT Lee County Human Services Gap Analysis
Table 42. Cost Burden for Households in Florida Including at Least One Person with a Disability
(Age 5+) ....................................................................................................................................... 102
Table 43. Comparison of Nutrional Related Outcomes ............................................................ 114
Table 44. Food Insecurity in Lee County ..................................................................................... 116
Table 45. Percentage of Income Spent on Food by Quinles ..................................................... 123
Table 46. Esmaon of Severe Financial Constraint* ................................................................. 124
Table 47. Health Care Stang Comparison Data ........................................................................ 138
Table 48. Lee County Fastest Growing Industries by NAICS Title (PROJECTIONS ....................... 142
Table 49. Lee County Industries Gaining the Most New Jobs (PROJECTIONS) ........................... 143
Table 50. Lee County Fastest-Growing Occupaons (PROJECTIONS) ......................................... 144
Table 51. Lee County Occupaons Gaining the Most New Jobs (PROJECTIONS) ....................... 148
Table 52. Community Demographics .......................................................................................... 173
Table 53. 2018 Unemployment and Income by Educaon Level ................................................ 184
Table 54. Kindergarten Readiness Scores ................................................................................... 189
Table 55. Educaon ..................................................................................................................... 190
Table 56. Violence Outcomes Regarding Children and Youth ..................................................... 191
Table 57. Median and Mean Hourly Wages for Selected Jobs in Florida .................................... 192
Table 58. 2015 Poverty Guidelines for the 48 Conguous States and the District of Columbia 195
Table 59. Child Poverty in Lee County ......................................................................................... 196
Table 60. Behavioral Health Indicators - Lee County .................................................................. 203
Table 61. State Rankings: Mental Health Expenditures as a Percentage of Total State
Expenditures, Average of FY 2012 and 2013 .............................................................................. 208
Table 62. Funding Equity ............................................................................................................. 211
Table 63. Child Abuse and Neglect Indicators in Lee County ...................................................... 243
Table 64. Domesc Violence in Lee County ................................................................................ 257
Table 65. Rates of Domesc Violence – Lee County, FDLE Data ................................................. 257
Table 66. Dependency Rao Over Time ...................................................................................... 260
Table 67. Elderly Abuse Cases in Florida per 1,000 Persons ....................................................... 261
Table 68. Adult Protecon Scorecard Department of Children and Families Suncoast Region:
20th Circuit (Lee, Collier, Charloe, Hendry, Glades) ................................................................. 262
Table 69. Adult Protecve Invesgators Workload ..................................................................... 263
Table 70. Suicide Rates Adults 60+.............................................................................................. 263
Table 71. Comparison Data ......................................................................................................... 271
Table 72. Rates of Forcible Sexual Oences in Lee County Compared to the State of Florida
Average, 2018 ............................................................................................................................. 271
Table 73. Rates of Rape and Forcible Sex Oences, FDLE data ................................................... 271
Table 74. Child Abuse and Neglect Indicators in Lee County ...................................................... 281
Table 75. Domesc Violence in Lee County ................................................................................ 284
Table 76. Rates of Domesc Violence – Lee County, FDLE Data ................................................. 284
Table 77. Rates of Forcible Sexual Oences in Lee County Compared to the State of Florida
Average, 2018 ............................................................................................................................. 284
Table 78. Rates of Rape and Forcible Sex Oences, FDLE Data .................................................. 285
Table 79. Comparave Data on Rape and Violent Crime ............................................................ 285

DRAFT Lee County Human Services Gap Analysis
Table 80. Young Adults Aging Out of Out-of-Home Care who did not Perpetrate Abuse by their
25th Birthday by County ............................................................................................................. 286
Table 81. Suicide Rates in Lee County, FL .................................................................................... 286
Table 82. Suicide rates in Lee County .......................................................................................... 293
Table 83. Risk and Protecve Factors by Domain ....................................................................... 297
Table 84. School Data .................................................................................................................. 301
Table 85. Family History with Criminal Jusce System ............................................................... 301
Table 86. Peer Associaons ......................................................................................................... 301
Table 87. Mental Health History ................................................................................................. 301
Table 88. Alcohol Usage .............................................................................................................. 301
Table 89. Drug Usage .................................................................................................................. 302
Table 90. History of Physical Abuse ............................................................................................. 302
Table 91. History of Sexual Abuse ............................................................................................... 302
Table 92. Connuum of Care, Lee County 2018 Funding............................................................ 314
Table 93. Client Age Ranges Receiving Homelessness Prevenon Services (2013 – 2018) ........ 315
Table 94. Elderly Clients Served by HVS ...................................................................................... 315
Table 95. Income Level of Persons Receiving Homelessness Prevenon Assistance ................. 316
Table 96. Emergency Response Funding by Households ............................................................ 318
Table 97. Volunteer Summary ..................................................................................................... 319
Table 98. Percepons of Barriers to Hiring Persons with Disabilies (PWD) .............................. 334
Table 99. Cost Burden for Households in Florida Including At Least One Person with a Disability
(Age 5+) ....................................................................................................................................... 343
Table 100. Other HACFM data: Characteriscs of Residents ...................................................... 344
Table 101. Disability Status of Seniors ........................................................................................ 365
Table 102. Age Group Populaon Esmates for Lee County ...................................................... 374
Table 103. Financial Status of Seniors ......................................................................................... 375
Table 104. Elder Households with Cost Burden .......................................................................... 376
Table 105. Food Insecurity in Lee County ................................................................................... 376
Table 106. Seniors and SNAP 2017 ............................................................................................. 376
Table 107. Medically Underserved (65+) .................................................................................... 376
Table 108. Disability Status of Seniors ........................................................................................ 377
Table 109. Health Care Facilies for Seniors ............................................................................... 380
Table 110. Fiduciary Responsibilies and Other Roles ............................................................... 400
Table 111. Non-Acute Funding for Mental Health Services, Central Florida Behavioral Network
..................................................................................................................................................... 403
Table 112. Mandated Services .................................................................................................... 407
Table 113. Policy Choice funding FY 18-19 Actuals ..................................................................... 408
Table 114. Court System FY 18-19 Actuals .................................................................................. 409
Table 115. Discreonary Grants/Donaons ................................................................................ 410
Table 116. Total Human Services Expenditure ............................................................................ 411
Table 117. Cost-burdened Data ................................................................................................... 427
Table 118. Shares of average expenditures on selected major components by composion of
consumer unit, 2018 ................................................................................................................... 428
Table 119. Moderate and Severe Housing Cost-Burden ............................................................. 429


DRAFT Lee County Human Services Gap Analysis
Index of Figures
Figure 1. Lee County, Florida Locaon .......................................................................................... 17
Figure 2. Populaon Growth Esmates ........................................................................................ 18
Figure 3. Map of Limited English Prociency Language Group, 2017 .......................................... 21
Figure 4. Food Insecurity ............................................................................................................. 116
Figure 5. Map of Lee County Parks, Conservaon Lands and Libraries ...................................... 153
Figure 6. Revenue Collected by Tax Exempt Organizaons in Lee County, Florida ..................... 155
Figure 7. Number of Births in each County, Rolling Three-year Average .................................... 174
Figure 8. Percentage of Live Births under 2,500 grams, Rolling Three-year Average ................. 174
Figure 9. Infant Death Rate per 1,000 Live Births, Rolling Three-year Average .......................... 175
Figure 10. Percentage of Children Ages 3-6 with Selected School Readiness Skills by Poverty
Status........................................................................................................................................... 178
Figure 11. Florida Per Capita Funding for Mental Health Services Compared to Other States .. 205
Figure 12. State Mental Health Agencies per Capital Expenditure ............................................. 206
Figure 13. Comparison of State of Florida Funding Trends for Behavioral Health Compared to
Naonal Trends ........................................................................................................................... 207
Figure 14. Rao of Populaon to Mental Health Providers, 2016 .............................................. 210
Figure 15. State Mental Health Agency Expenditures by Type of Program as a Percent of Total
Expenditures ............................................................................................................................... 212
Figure 16. Jails and Mental Disorders ......................................................................................... 220
Figure 17. The Sequenal Intercept Model ................................................................................ 223
Figure 18. Children and Young Adults Receiving DCF Services in Lee County ............................ 245
Figure 19. Children’s Network of SWFL System-of-Care Overview ............................................. 246
Figure 20. Illustrates the Process Stages of the System-of-Care ................................................. 247
Figure 21. State of Florida Ombudsman 2017-2018 Annual Report .......................................... 265
Figure 22. Children and Young Adults Receiving DCF Services in Lee County ............................ 283
Figure 23. Suicide Deaths by Method ......................................................................................... 290
Figure 24. Suicide Rates in the United States ............................................................................. 292
Figure 25. Declining Rate of Arrests for Juvenile Oenses ......................................................... 299
Figure 26. Decline in the Number of Juveniles on Probaon ..................................................... 299
Figure 27. The Number of Lee County Children in Some Form of Residenal Restricon ......... 300
Figure 28. Lee County Homeless Point in Time 2009-2018 ........................................................ 313
Figure 29. Coordinated Entry Homeless Households and Income Reporng............................. 316
Figure 30. Employment First ....................................................................................................... 332
Figure 31. Housing Components ................................................................................................. 341
Figure 32. NED/Mainstream Housing Vouchers for Individuals with Disabilies in Florida ....... 345
Figure 33. Lee County Populaon Projecons ............................................................................ 375
Figure 34. Dependency Rao Projecons ................................................................................... 377
Figure 35. Map United Way 211 Providers ................................................................................. 393
Figure 36. Map HUD Low/Mod Income Areas with 211 Service Providers ................................ 394
Figure 37. Map Parks, Preserves, Conservaon Land and Public Libraries................................. 395
Figure 38. Map Childcare Providers ............................................................................................ 396


DRAFT Lee County Human Services Gap Analysis
Executive Summary Page | 1
EXECUTIVE SUMMARY
Introducon
The Lee Board of County Commissioners directed sta to idenfy gaps in the public and
private systems of delivering vital human services in Lee County. The results of this Gap
Analysis are reported here.
This comprehensive assessment addresses mulple services, including those that may
not be under the purview of County Commissioners. This report, which idenes gaps
but does not recommend specic soluons, is intended by design to be of value to the
enre community rather than to be used specically as an internal County document.
The Gap Analysis ulizes a system model that incorporates tradional needs assessment
– a focus on the gap between an idened need and the capacity of exisng services to
meet that need – as only one of a set of analycal methods. The full set of analyses are
summarized below.
Gap Analysis: The Analycal Methodology
Gaps in this assessment are examined from mulple perspecves. These include:
Need/Capacity. This is the most common understanding of “gap,” in that the number of
people needing a service is greater than the level of services that can be provided.
Behavioral Outcomes. The ulmate test of the value and validity of any human service
program is its impact on behavior and/or life condion. To assess this gap perspecve,
databases reporng various populaon-correlated stascs on behaviors such as drug
use per capita rates or homeless persons who were housed in permanent housing were
used to compare Lee County with other counes in the state.
Evidence-Based Pracces. Known as evidence-based pracces, these programs have
been evaluated by academic researchers and found to be eecve. All human service
programs are well intenoned. However, intenons do not always result in posive or
long-term change. Evidence-based programs, or “best pracces,” have been found to
eecvely turn intenon into posive impacts.

DRAFT Lee County Human Services Gap Analysis
Executive Summary Page | 2
Policy/Process. In some cases, regulaons or organizaonal processes inadvertently
result in service gaps. For example, this may result from eligibility restricons or
communicaon gaps.
Access/Geography. This examines whether a gap exists between where people who
need services reside and the locaon where those services are provided.
Equity Funding. There are variees of funding streams involved in the human services
eld. Various formulas exist that underlie those funding streams. The queson here is
whether Lee County is funded equitably when compared with other counes in the
state.
Scope of the Analysis
The assessment examined the various dimensions of the human services system. This
included:
Systems of Care. These systems range in formality from highly linked to a loose network
of providers. They focus on a set of issues or behaviors that are problemac from some
perspecve. The following systems were analyzed:
Behavioral health;
Behavioral health and criminal justice interface;
Child abuse and neglect;
Domestic violence;
Elder abuse, neglect and exploitation;
Sexual violence and stalking;
Trauma and effects of violence exposure;
Suicide and self-harm;
Juvenile delinquency; and,
Homelessness.
Special Populaons. These are persons who are grouped by either age, disability, or life
status and who also share a common set of issues. While they are likely served in
mulple systems of care, they bring their own issues, which are best idened in
separate discussions. The issues of the following special populaons were examined:
Intellectual and developmental disabilities;
Congenital hearing and visual disabilities;

DRAFT Lee County Human Services Gap Analysis
Executive Summary Page | 3
Persons with other physical disabilities;
Senior citizens; and,
Veterans.
Development. The systems of care and special populaons are characterized by some
diculty, or risk, that require an extra level of aenon and intervenon. Development
is concerned with normal development paerns and tasks and how they can be
fostered for everyone. The perspecve examined child and youth development.
Infrastructure. This dimension encompasses the basic human needs of housing,
transportaon, food and employment. It also encompasses the organizaonal
infrastructure needed to deliver services such as sta, facilies, organizaonal structure
and technology.
Findings
When compared to either naonal, state or local data or to accepted best pracces,
there are gaps of varying degrees of signicance in each system-of-care as well as in the
services provided to various special populaons, child and youth development and
infrastructure. The three most crical of these are:
Behavioral Health. Consistently, the data-collecon tools used for this analysis point to
behavioral health services as having the most serious gaps in the County. These data-
collecon tools included various surveys that have been conducted in Lee County, the
perspecves of professionals, comparave nancial data showing that Florida ranks
anywhere from 48
th
to 50
th
in terms of per-capita funding for mental health services,
and the fact that behavioral health problems are found to be factors in almost all the
systems of care assessed in this analysis.
Housing. With the same consistency across the methods used, housing for special-
needs clients (supporve housing) and housing for workers (aordable housing using
HUD denions) were idened as one of the three most signicant gaps from a
countywide perspecve. From a clinical perspecve, the eecveness of any treatment
intervenon is weakened if the person is in an unstable, unsafe or otherwise poor
housing situaon. If people are homeless, in highly transitory housing or in housing
that is stressful because of crime, violence or poor quality, the resultant stressors can
become overwhelming. These stressors can lead to relapse into more problemac

DRAFT Lee County Human Services Gap Analysis
Executive Summary Page | 4
behavior or regression. From a system-of-care perspecve, housing is a crical
component to overall success.
Transit. Just as housing was consistently idened as a dominant gap, so was transit.
While not as crical to posive outcomes as housing, transit remains a key component
for the success of systems of care. Being able to access care and support, employment
or basic-life necessies are all elements needed by system-of-care plans. This gap is
crical for residents dependent upon public transportaon to access support services
and/or the employment and educaonal opportunies required to address their needs.
Other common issues. Variees of services were examined in this analysis. Several
gaps, in addion to the above three, were found to exist across the various services.
These are detailed in the “Conclusions” chapter.
Staffing. There is a significant shortage of professionals in the various fields such as
nursing, psychiatry, psychology and social work. Low-compensation issues make
retention of technicians, first-line or direct care workers, whose salaries are most
often in the $10-$12 an hour range, difficult.
The increasing complexity of the work. Increased knowledge of the human brain,
the growing body of evidence-based practices that require specialized training, and
the diversity of clients, make the work of delivering outcome-based human services
increasingly complex. For example, child-care workers would ideally have at least an
Associate’s degree in child development. Early childhood educators are discussing
Bachelor degrees as the minimum standard.
The need for more integrated service delivery systems. Clients overlap various
systems of care, particularly physical and mental health, which are strongly linked. A
more integrated approach is needed. There has been an emphasis on greater
integration of physical and mental health services among professionals, but for a
variety of factors that has not yet been achieved.
Evidence-based practices. Many providers in the area use a variety of evidence-
based practices. Continuing to emphasize the use of such practices should be
encouraged by all funders. An example of evidence-based practice is various forms
of Cognitive Behavioral Therapy, which has been studied with control groups and
found to be effective. Providing the training required to use these practices is
challenging due to costs and limited staffing.

DRAFT Lee County Human Services Gap Analysis
Executive Summary Page | 5
More coordinated and flexible funding streams. Local decision-making would be
strengthened if there were a greater opportunity to target external funds in ways
more consistent with local needs. For example, the eligibility requirements for
Healthy Start funding leaves parents who would benefit ineligible because their
income is slightly above eligibility limits while being insufficient to pay for these
services.
Prevention and early intervention. Widely recognized as the most effective long-
term strategies, finding the means to dedicate funds to these interventions would
bring long-term benefit to the community.
The Silver Wave. The proportion of Lee County residents who are elderly will
continue to increase. Preparing to address the human service issues that will arise is
a key future task. Various programs define the age that constitutes an elderly status
as 55, 60, 62 or 65. For data analysis purposes, the age that was used was whatever
age criterion the program being examined used.
Public understanding and education. Some people are not aware of services for
which they are eligible. There can be prejudice or bias toward certain groups of
people for whom human services is a necessity.
Data gaps. The need for greater information collection and sharing, especially across
systems, will grow. For example, real-time data about the psychiatric status of jail
inmates would be beneficial to those agencies responsible for mental health
planning. Many of these systems of care have high-demand users who often cycle
through their services. Between systems, interagency information sharing on high-
demand users could be helpful to provide actions that are more effective.
Affordability. As communities become more economically dynamic and diverse,
they become more expensive. Housing, transportation and food comprise a larger
proportion of their living costs than considered reasonable. For example, housing
affordability is worse in the larger and more economically diverse counties of
Florida, affordability challenges also exist in Lee. As noted in the report, it is
estimated that 22% of children in the county live in poverty and 37% of households
are cost-burdened for housing.
1
1
This data will be found in chapter 3.

DRAFT Lee County Human Services Gap Analysis
Executive Summary Page | 6
For approximately 44% of the households, only 16% of the rental housing stock is
affordable.
2
Transportation costs are considered affordable if they are 15% or less
of household income. This would be $7,281 per year for the average Lehigh Acres
household. The estimated driving costs for Lehigh Acres are $12,822 per year.
3
According to a USDA survey, 18.1% of Lee County adults report a time in the past
year (“often” or “sometimes”) when the food they bought just did not last, and they
did not have money to get more.
4
For 8% of the senior population (65 or older), or
slightly more than 19,000 persons, their household income falls below the federal
poverty guideline.
5
In-home services. For reasons of transportation and clinical benefit, greater delivery
of services in-home is needed. These in-home services have been found to be highly
beneficial because they allow the clinician to observe the family in a natural setting
and remove some of the barriers to accepting interventions.
Trauma. People who are exposed to violence, natural or manmade disaster, feel at
risk of harm or seeing others harmed can be traumatized by the event. If this
exposure is repeated or occurs with regularity, the likelihood some of one being
traumatized increases. The experience of trauma has both physical, physiological
and psychological effects. Both victims and those working with victims can
experience trauma. Post-traumatic stress disorder in the military is one example of
the impacts of experiencing or observing traumatic events. There is a need for a
broader understanding of trauma by behavioral health professionals as well as other
professionals who deliver human services.
Education for non-behavioral health disciplines. There is a need for other
professionals who interact with the various systems of care to have a better
understanding of various behaviors associated with differing conditions. There has
been a recent emphasis on more training on mental health issues or developmental
disability issues for law enforcement personnel as one example. These same
recommendations can be made for other elements of the criminal justice system.
2
This data will be found in chapter 5.
3
www.esri.com/software/american-community-survey
4
Lee County Health Needs Assessment, Lee Health
5
This data will be found in chapter 27.

DRAFT Lee County Human Services Gap Analysis
Executive Summary Page | 7
Assessment. An improved ability to assess individuals and families would be of value
across the various systems of care. For example, a greater ability to more fully
assess the mental status of people who are homeless or entering jail could lead to
better decisions about interventions. Being able to better assess potential elder
abuse is another example of improvement potential.
Employment. For the adult-oriented human service systems of care, employment is
a consistent concern. The benefits of employment are obvious. Barriers include
transportation, employer bias, the need for some special accommodations and
training. People with developmental disabilities, histories of drug abuse or mental
illness, or people with jail or prison records face employment challenges of differing
types.
Language and cultural diversity. As the County becomes more culturally and
linguistically diverse, demands are being placed upon the human service field to
respond with bi- or multi-lingual staff and more culturally sensitive interventions or
services.
Growing service demand in Lehigh Acres. The demographics are becoming more
diverse and households are cost-burdened from a combination of housing and
transportation costs. Services are currently limited as the chapter on spatial
matching demonstrates.
Technology. As with the rest of society, technology is changing how work is done.
There are potential benefits for service provision. Telepresence, in which services
could be delivered remotely through the internet, is one example of how technology
could improve access to services.
Chapter 34 addresses those services for which the BoCC has certain responsibilies
and/or which are of the most signicant nancial impact. This chapter addresses topics
such as:
Behavioral health and criminal jusce. The County funds the jail and other
criminal jusce components. A signicant proporon of jail inmates have
mental health or substance- abuse issues that are a cost-burden to the County.
Examining alternave or addional approaches could have a nancial impact.

DRAFT Lee County Human Services Gap Analysis
Executive Summary Page | 8
Performance-For-Results Funding. The County funds various nonprots.
Examining these programs from a system-of-care approach and evidence-based
pracces perspecves could enhance their value.
Homelessness. The County serves as the lead agency for the Connuum of Care.
There has been an increased emphasis on diversion and prevenon. Addional
resources on those points could be cost-eecve.
Housing. While the County is not a housing developer, it has several tools that
could assist the development community to respond to the need for supporve
and aordable housing.

DRAFT Lee County Human Services Gap Analysis
Secon One: Quantave Data
Chapter 1 | Introduction Page | 9
CHAPTER 1
Introducon
Purpose of the Study
This report addresses potenal gaps in the human services system in Lee County,
Florida. It is a comprehensive assessment covering not only those services provided by
the Lee Board of County Commissioners, but also services provided through federal and
state governments, as well as those provided through private means. It is intended to
be of use to the community in determining priories and investments.
The Denion of Human Services in this Assessment
Human services are dened in this study as:
Development services. These are eorts intended to strengthen, enrich or improve the
quality of life for members of the community through developing resiliency, social skills
and development of the whole person. Excluded from the denion for the scope of
this study are arts and culture acvies (except those designed for therapeuc
purposes), general educaon and the acvies of civic and faith communies. Included
in this denion are recreaon programs for persons of any age and quality child-care
programs.
Prevenon services. Certain behaviors can be harmful to self or others, regardless of
any demographic or socio-economic category. Communies wish to prevent those
behaviors from developing in the rst place. Programs and eorts to prevent the
development of problemac behavior, such as an-smoking campaigns, are examples of
programs that would be covered in this assessment. These services are targeted to the
community at-large.
Early Intervenon services. These are services that are targeted to more specic groups
that are deemed to be at a higher level of risk. This risk may have been determined by
research studies that have found a certain category of people to be more likely to
develop a problemac behavior or that face a challenging situaon requiring addional
support. The risk may also be determined by an early set of behaviors that have been
shown to be related to the development of more serious problems. For example,

DRAFT Lee County Human Services Gap Analysis
Secon One: Quantave Data
Chapter 1 | Introduction Page | 10
children who enter school without a certain level of reading skill are challenged and
may have greater dicules in school.
Intervenon and Treatment. These are services designed to intervene to:
Modify problematic behavior;
Address a complex social condition that results from a combination of personal
behavior, social and economic forces and/or geographic factors;
Address issues that arise from physical or personal disaster, victimhood, loss of
support systems or relationships;
Provide basic needs such as housing, food, and transportation.
What is excluded from this study are any comprehensive assessments of the following
systems:
The public education system, at any level, except where there are direct linkages to
social services such as addressing the needs of homeless children;
Private elementary, middle, high school, vocational or higher education services.
Child-care and pre-K programs are examined;
The public and private physical health care systems of the community, except for
physical disabilities that have significant social service implications such as people
whose disability requires personal care;
The arts and culture entities.
Gap Analysis: A Mul-dimensional Perspecve
Gaps in this assessment are examined from mulple perspecves. These include:
The gap between need and capacity. This is the most common understanding of “gap”
in that the number of people needing a service is greater than the level of services that
can be provided. This gap is referred to as the Needs / Capacity Gap.
Behavioral outcomes. The ulmate test of the value and validity of any human service
program is its impact on behavior (such as no use of drugs) or life status or condions
(such as being in permanent housing). To assess this gap perspecve, several data-

DRAFT Lee County Human Services Gap Analysis
Secon One: Quantave Data
Chapter 1 | Introduction Page | 11
bases reporng various populaon-level stascs on behaviors were used to compare
Lee County with other counes in the State.
Best pracces. Known as evidence-based pracces, these are programs that have been
evaluated and found to be eecve. All human service programs are well intenoned.
However, intenons do not always result in posive or long-term change. Evidence-
based programs, or best pracces, have been found to eecvely turn intenon into
posive impacts.
Policy/Process. In some cases, regulaons or organizaonal processes inadvertently
result in service gaps. This may be due to eligibility restricons, communicaon gaps or
other sources.
Access and Geography. This gap examines whether a gap exists between where the
people needing services reside and the locaon in which those services are provided.
Equity Funding. There are a variety of funding streams involved in the human services
eld. Various formulas exist that underlie those funding streams. The queson here is
whether Lee County is funded equitably when compared with other counes in the
State.
Methodology
This assessment used a variety of data sources to idenfy gaps. When mulple sources
idened a gap, the conclusion was determined to be more reliable and valid than if
the gap was only idened by one source. The data sources for the assessment
included:
Populaon Data. This data came from both public and private databases that reported
prevalence of certain behaviors or condions. Data gathered included a variety of
metrics, such as per-capita raos or percentages. Wherever possible, data specic to
Lee County was used and compared with the State of Florida averages, raos,
percentages, etc. It is considered populaon data because it is measuring a condion in
a populaon, such as seniors in Lee County, rather than an individual’s status.
Research Studies and Expert Opinion. The topics addressed in this study do not solely
exist in Lee County. These are issues every community in the naon faces to some

DRAFT Lee County Human Services Gap Analysis
Secon One: Quantave Data
Chapter 1 | Introduction Page | 12
degree. For most of these issues, there is a long history of eorts and intervenons
intended to address the issue or problem. For many of these topics, there is a research
base that seeks to determine scope, causality, eecveness of various soluons and
implicaons. In addion to research and evaluaon studies, professional associaons
have developed a process in which knowledge is shared and skills and soluons are
promoted. This results in a body of expert opinion of people who have worked in the
eld for years and understand its strengths and weaknesses. This informaon was
gathered by the means listed below:
Surveys
Focus groups
Interviews
Literature reviews
Program Data. Each service program maintains some level of data about their services.
These vary in comprehensiveness, detail, length of data collecon, reliability and
validity. Whatever the varying quality, this is sll a source of informaon. Some of the
data types examined here include:
Outputs
Financials
Staffing
Report Format
The report is organized in eight secons as described below:
Secon One: Descripve and Quantave data. This secon uses various quantave
data sources to examine potenal gaps in human services. It consists of three chapters
as listed below:
Lee County Demographics
Behavioral Outcomes
Comparison of Surveys
Secon Two: Infrastructure. This secon addresses basic needs such as housing,
transportaon, employment and food, as well as the organizaonal infrastructure
needed to provide services such as stang, facilies, organizaonal capacity and
technology.

DRAFT Lee County Human Services Gap Analysis
Secon One: Quantave Data
Chapter 1 | Introduction Page | 13
Housing
Transportation
Food
Employment
Staffing
Facilities
Organizational Capacity
Information and Technology
Secon Three: Development. This chapter addresses the rst element of a service
system – development. It consists of one chapter on child and youth development.
Secon Four: Systems of Care. These are systems designed to address a specic issue,
such as homelessness or domesc violence. There are 10 chapters in this secon and
they are organized in the chapter format presented below. They may cover prevenon,
early intervenon or treatment services from both a Needs / Capacity perspecve
and/or a Best Pracce perspecve. Each concludes with a lisng of gaps.
Secon Five: Special Populaons. This secon addresses four populaons for which
there are disncve issues as well as disncve funding sources. These populaons are
persons with intellectual and developmental disabilies, persons with congenital deaf
and blind issues, persons with disabilies and veterans.
Secon Six: Geography. This secon consists of one chapter that examines spaal
mismatch.
Secon Seven: Financial. This secon examines which enes are responsible for
funding the various services, funding equity issues and a determinaon of the Lee
Board of County Commissioners’ current human services related expenditures.
Secon Eight: Conclusions. This secon examines the core drivers underlying the
human services issues such as behavioral health, trauma and cost-burdened
households. It concludes with an examinaon of the Lee County strategy.

DRAFT Lee County Human Services Gap Analysis
Secon One: Quantave Data
Section One: Quantitative Data Page | 14
Intenonally le blank.

DRAFT Lee County Human Services Gap Analysis
Secon One: Quantave Data
Section One: Quantitative Data Page | 15
Secon One: Quantave Data

DRAFT Lee County Human Services Gap Analysis
Secon One: Quantave Data
Section One: Quantitative Data Page | 16
Intenonally le blank.
DRAFT Lee County Human Services Gap Analysis
Secon One: Quantave Data
Chapter 2 | Lee County Description and Demographics Page | 17
CHAPTER 2
Lee County Descripon and Demographics
County Descripon
Assessment of demographic characteriscs can indicate the need for access to a variety
of services in a community. Factors such as populaon growth, age trends and
economy help to shape regional needs and also play a role in idenfying potenal gaps
in available services and resources.
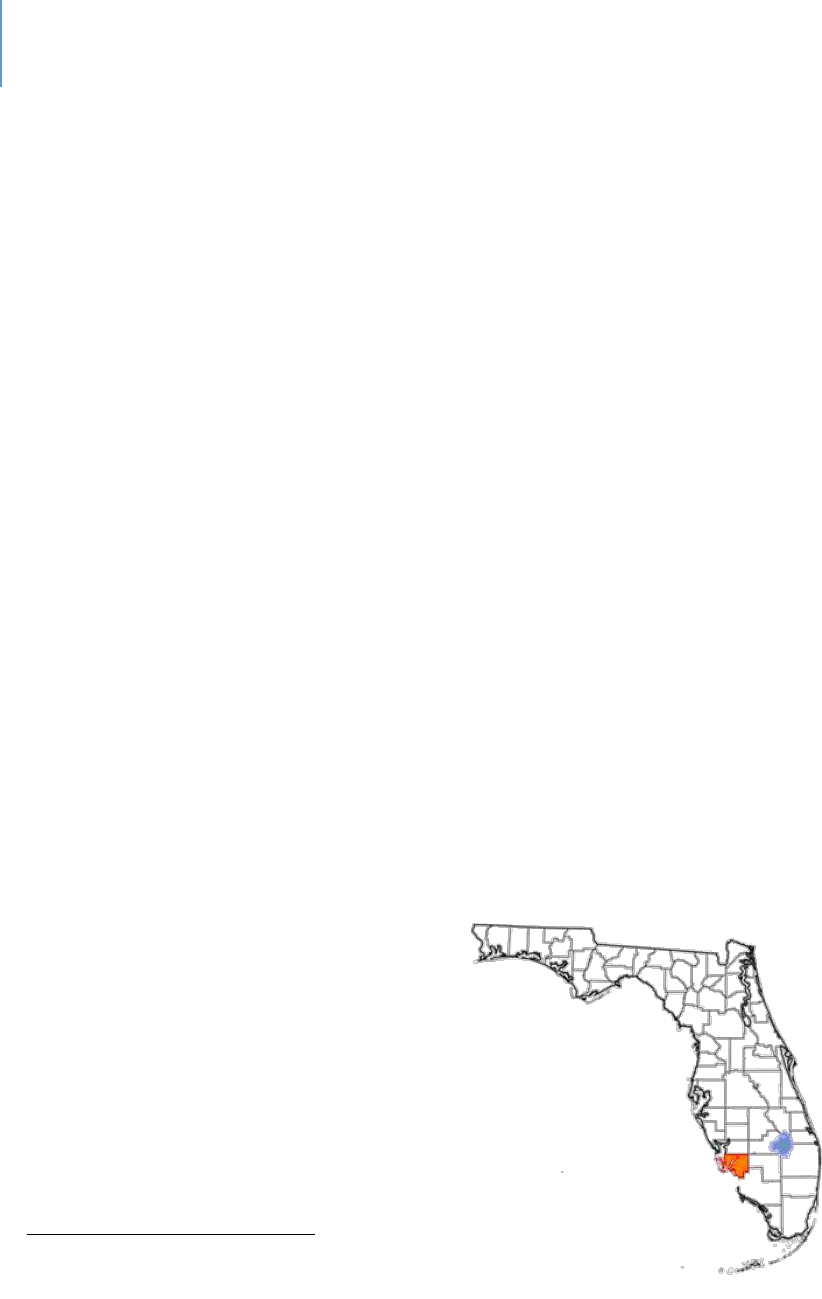
Lee County is the eighth most populated county in the State of Florida. Located on the
Gulf Coast of Florida, Lee County encompasses approximately 813 square miles of land
including several small islands in the Gulf of Mexico. The County is bordered by
Charloe County to the north, Hendry County to the east and Collier County to the
south. Lee County comprises the Cape Coral – Fort Myers, FL Metropolitan Stascal
Area (MSA). The City of Cape Coral is the largest City within the MSA. Other units of
local government within the MSA are the City of Bonita Springs, the City of Fort Myers,
the Town of Fort Myers Beach, the Village of Estero, and the City of Sanibel.
Unincorporated areas of the County are mostly divided into named communies.
These include: Bayshore, Boca Grande, Buckingham, Caloosahatchee Shores, Olga,
Capva, Greater Pine Island, Matlacha, Lehigh Acres, Northeast Lee County, Alva, North
Olga, North Fort Myers, Page Park, San Carlos Island, Southeast Lee County, Tice and
others.
Figure 1. Lee County, Florida Location
Lee County, Florida
Populaon 754,610
6
Number of Households 281,222
7
Median Age is 48.8
8
Median Household Income $56,129
9
Poverty Rate 12.2
10
6
American Community Survey, Quick Facts, https://www.census.gov/quickfacts/leecountyflorida
7
American Community Survey, DP03, 2018 1-Year Estimates
8
American Community Survey, S0101: 2018 ACS 1-Year Estimates
9
American Community Survey, DP03, 2018 1-Year Estimates
10
American Community Survey, S1701, 2018 1-Year Estimates
DRAFT Lee County Human Services Gap Analysis
Secon One: Quantave Data
Chapter 2 | Lee County Description and Demographics Page | 18
Populaon Growth
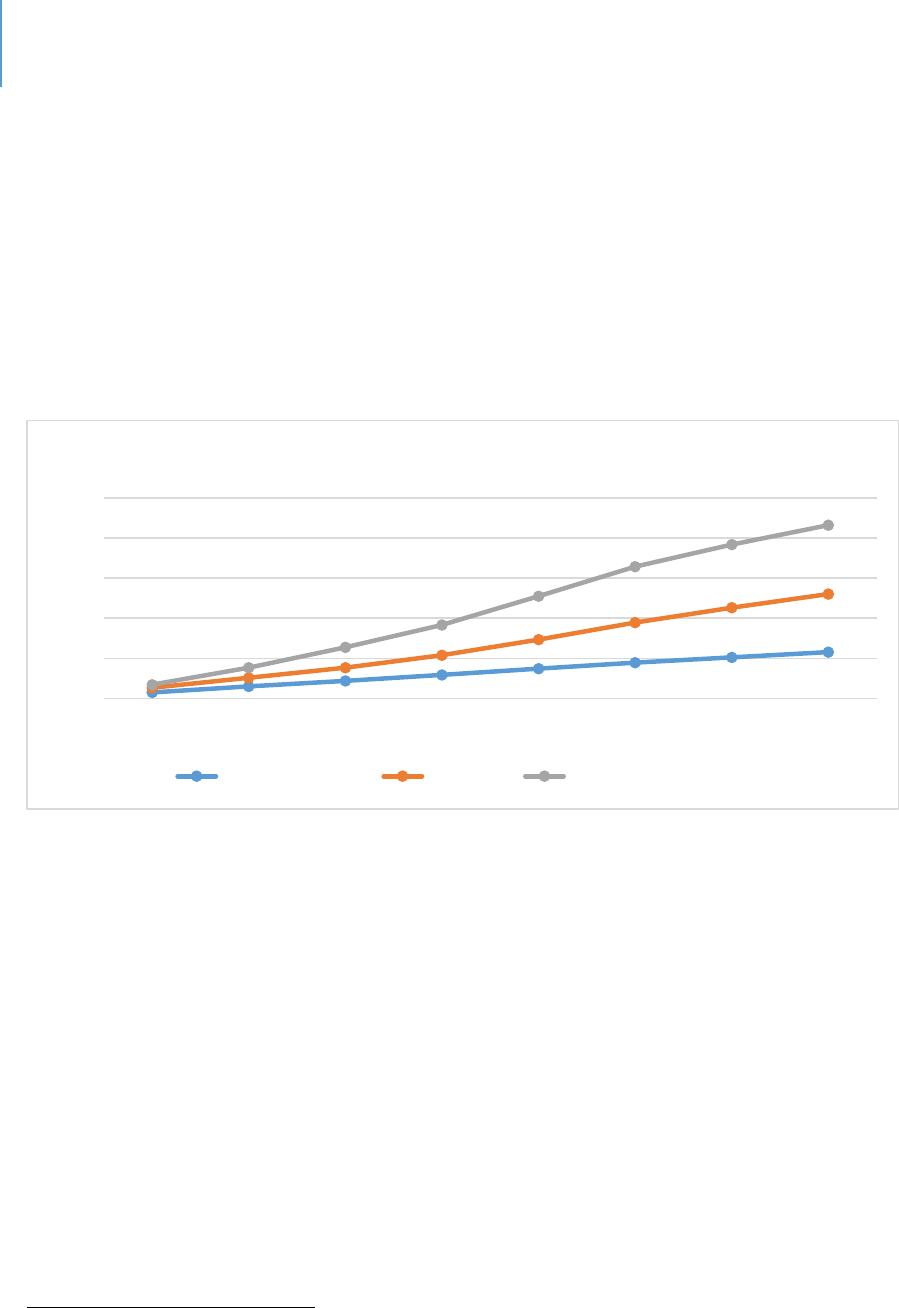
The 2018 American Community Survey One-Year Populaon Esmate indicates a total
populaon of 754,610 in Lee County, a 22% increase over the 2010 census of 620,454.
Figure 2 displays a comparison of Lee County to the populaon growth in Florida and
the United States.
Figure 2. Population Growth Estimates
11
In addion to the growth of the permanent residents, Lee County has a cyclical,
seasonal populaon increase of 18% in standard dwelling units.
12
Data from the Bureau of Economic and Business Research at the University of Florida
indicates a projected populaon growth for 2030. Projecons ancipate that
unincorporated Lee County will experience the greatest growth at 140,000 or 38%. The
City of Cape Coral will see an inux of populaon, growing 34.5% by 2030. The enre
Lee County populaon is ancipated to grow by more than 240,000, or 32.8% by 2030;
18% over the ancipated State populaon growth rate.
11
American Community Survey, B01003: 2018 ACS 1-Year Esmates
12
Lee County Community Development
0%
5%
10%
15%
20%
25%
2011 2012 2013 2014 2015 2016 2017 2018
Population Growth Estimates, 2010 - 2018
United States Florida Lee County, Florida
DRAFT Lee County Human Services Gap Analysis
Secon One: Quantave Data
Chapter 2 | Lee County Description and Demographics Page | 19
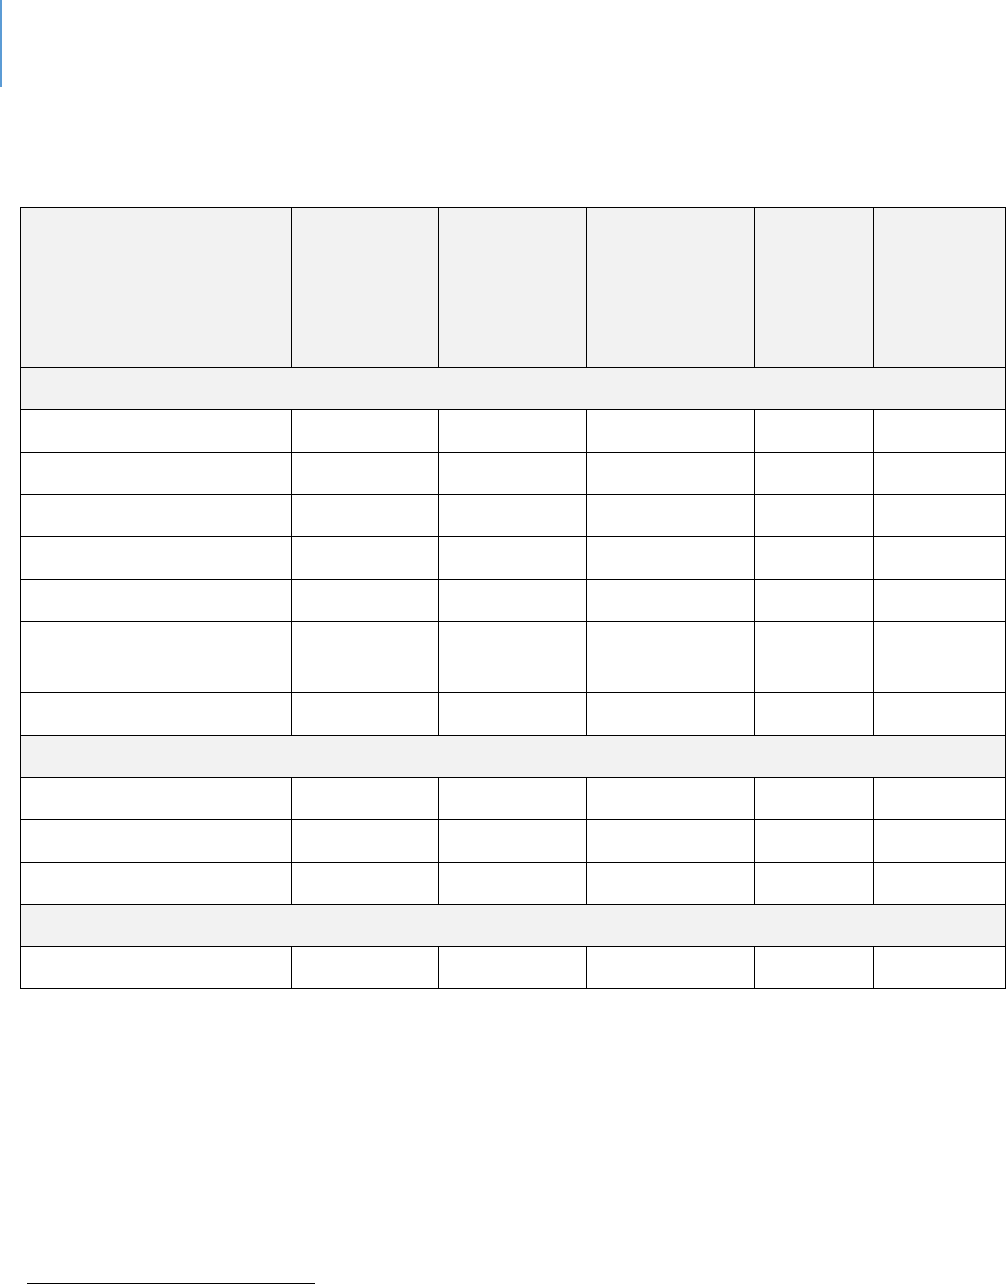
Table 1. Population Change Countywide
13
University of Florida, Bureau of Economic and Business Research (BEBR)
Jurisdicon
Total
Populaon
2010
Esmated
Populaon
2019
Total
Populaon
2030
(Projecon)
14
Percent
Change
2010 -
2019
Projected
Percent
Change
2019 -
2030
Urban County
Bonita Springs
43,857
54,437
62,645
24.1%
15.1%
Fort Myers Beach
6,277
6,520
5,818
3.9%
-10.8%
Sanibel
6,469
6,756
6,920
4.4%
2.4%
Estero*
0
32,412
48,125
15
N/A
48.5%
Unincorporated
345,548
361,315
501,646
4.6%
38.8%
Unincorporated (Plus
Estero)*
345,548
393,727
549,771
13.9%
Total Urban County
402,151
461,440
625,154
14.7%
35.5%
Entlement Jurisdicons
Cape Coral
154,305
185,837
249,942
20.4%
34.5%
Fort Myers
62,298
87,871
101,525
41.0%
15.5%
Total Lee County
618,754
735,148
976,621
18.8%
32.8%
State of Florida
State of Florida
18,801,332
21,208,589
24,340,500
12.8%
14.8%
*Estero Incorporated in December 2014.
13
Bureau of Economic and Business Research (BEBR), University of Florida 201
14
2030 City projections from Bureau of Economic and Business Research (BEBR), University of Florida 2017
15
Metro Forecasting Models projections, The Village of Estero Comprehensive Plan
DRAFT Lee County Human Services Gap Analysis
Secon One: Quantave Data
Chapter 2 | Lee County Description and Demographics Page | 20
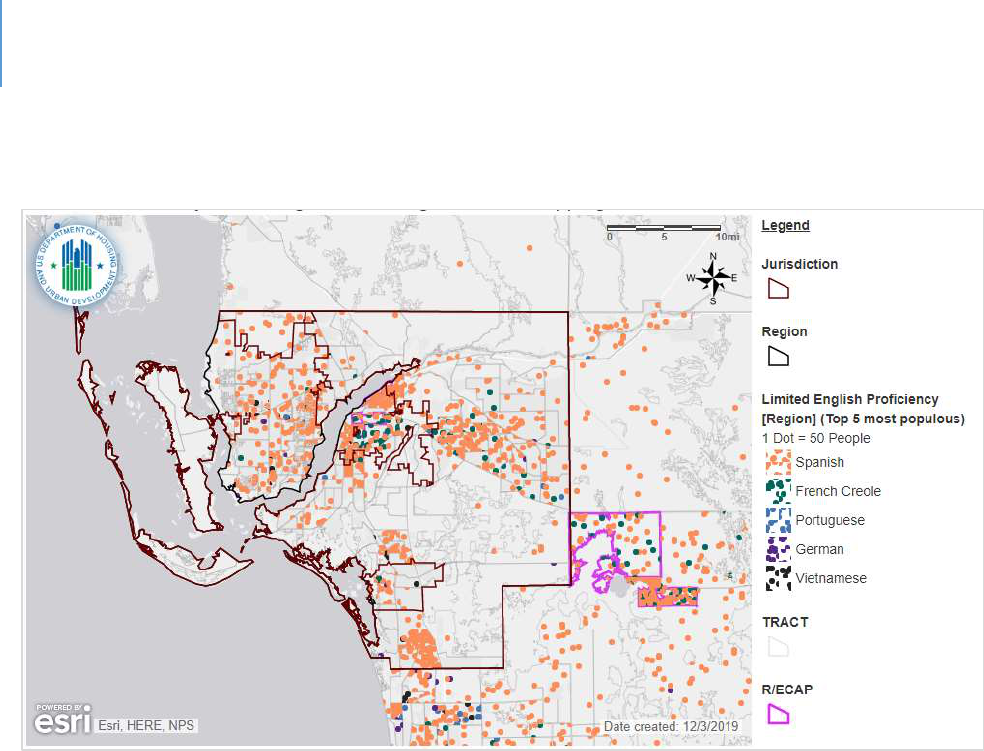
Limited English Prociency
People with Limited English Prociency (LEP) are dened by the federal government as
those with a limited ability to read, write, speak or understand English. American
Community Survey data reports on households in which English is not spoken at home.
In 2017, the Census Bureau reported that 147,361 people across Lee County (21.1
percent of the populaon) spoke at least one language other than English. Of these,
62,713 (9.4 percent of the populaon) spoke English less than “very well.” Translaon
of vital documents is required for HUD entlement communies if the number of LEP
persons in a single language group constutes 5% or 1,000, whichever is less. The
language group to qualify according to this threshold is Spanish.
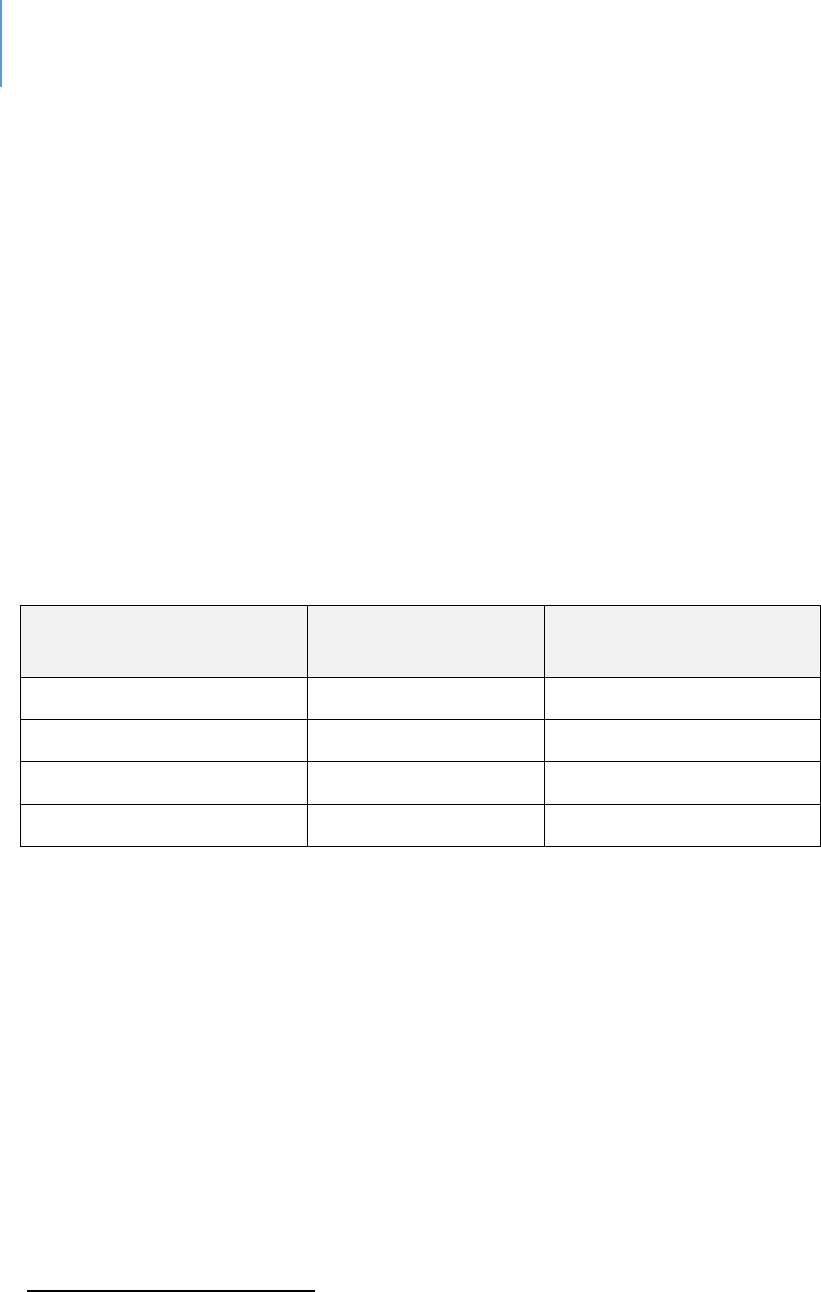
Table 2. Limited English Proficiency Language Group, 2017
16
Language Group
Number of LEP
Speakers
Percent of Total
Populaon
Spanish
47,083
7.83%
French Creole
4,633
0.77%
Portuguese
1,130
0.19%
German
1,049
0.17%
16
HUD AFFH Data (AFFHT0004) Released November 17, 2017.
DRAFT Lee County Human Services Gap Analysis
Secon One: Quantave Data
Chapter 2 | Lee County Description and Demographics Page | 21
Figure 3. Map of Limited English Proficiency Language Group, 2017
Race, Ethnicity and Naonal Origin
Overall, Lee County has become more diverse since 2010. This is due to two factors: an
increase in racial and ethnic minority populaon and a decrease in the percentage of
white populaon. Aer white residents, the largest racial/ethnic group in Lee County is
Hispanic. Hispanic or Lano is an ethnic classicaon by the U.S. Census Bureau.
However, Hispanic individuals can be of any race.
The 2018 Census esmates indicated a major shi in populaon composion from
2010, which showed a 70.8% white (not Hispanic or Lano) and Hispanic or Lano (any
race) populaon, comprising 18.4% of the County’s total populaon. In 2018, 66.3% of
the populaon idened as white (not Hispanic or Lano) and Hispanic or Lano (any
race) populaons, comprised 21.9% of the County’s total populaon.
The County’s populaon that is Hispanic or Lano increased from 114,098 to 165,233
people from 2010 and 2018, an increase of 45%.
DRAFT Lee County Human Services Gap Analysis
Secon One: Quantave Data
Chapter 2 | Lee County Description and Demographics Page | 22
Table 3. Lee County Race/Origin
17
US Census American Community Survey, 2018.
Race/Origin
2018
2010
#
%
#
%
Not Hispanic or Lano
589,377
78.1%
506,053
81.6%
White alone
500,358
66.3%
438,950
70.8%
Black or African American alone
64,553
8.6%
48,326
7.8%
American Indian and Alaska Nave alone
487
0.1%
680
0.1%
Asian alone
12,098
1.6%
8,631
1.4%
Nave Hawaiian and Other Pacic Islander alone
272
0.0%
0
0.0%
Some other race alone
3,730
0.5%
1,970
0.3%
Two or more races:
7,879
1.0%
7,496
1.2%
Hispanic or Lano - All Races
165,233
21.9%
114,098
18.4%
TOTAL
754,610
620,151
Age
The age characteriscs of a community give insight into current and future demand for
resources. The age composion of a community aects housing and service demands
since dierent age groups have very dierent needs. Seniors may seek healthcare
services, community acvies and nancial assistance to manage budgeng on a xed
income.
Lee County’s overall median age of 48.8 years old is six years greater than the State’s
median age of 42.2 years old.
18
The proporon of residents over 65 years of age has increased 5% since 2010.
17
American Community Survey, B03002: 2018 ACS 1-Year Esmates
18
American Community Survey, S0101: 2018 ACS 1-Year Estimates

DRAFT Lee County Human Services Gap Analysis
Secon One: Quantave Data
Chapter 2 | Lee County Description and Demographics Page | 23
The populaon projecon by BEBR indicates that between 2020 through 2030, Lee
County’s populaon of 65 and older residents will increase by 44%; and between 2020
through 2045 that populaon is projected to increase by more than 54%.
19
Poverty, Employment, and Economy
Household income, employability and economy are potenally the most important
factors in determining the resources needed in a community. Economic factors play an
important role in a household’s health, housing stability, educaonal opportunies,
transportaon opons and the ability to engage in community acvies.
Area Median Income and Poverty Level
In 2012, the median household income (MHI) in Lee County was $46,278 (in 2012
inaon adjusted dollars). In 2018, the esmated median family income was $56,129,
an increase of $9,851 from 2012.
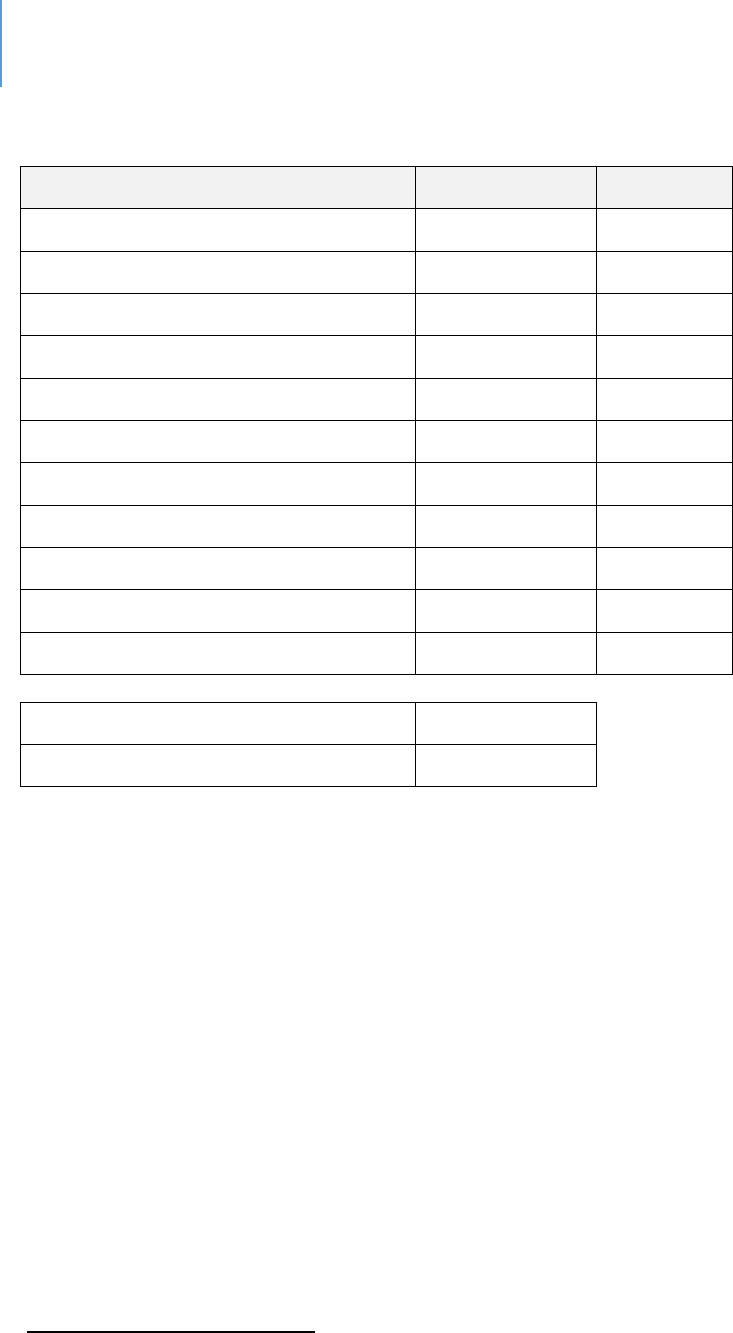
More than 30% of the County households earned less than $35,000 in 2018, and 36.4%
earned more than $75,000 in 2018. Those with household income of $35,000 to
$74,999 represented 33.5% of all income groups.
19
hps://www.bebr.u.edu/populaon
DRAFT Lee County Human Services Gap Analysis
Secon One: Quantave Data
Chapter 2 | Lee County Description and Demographics Page | 24
Table 4. Income and Benefits (In 2018 Inflation Adjusted Dollars)
20
#
%
Total Households
281,222
100%
Less than $10,000
17,520
6.20%
$10,000 to $14,999
12,359
4.40%
$15,000 to $24,999
28,058
10.00%
$25,000 to $34,999
26,702
9.50%
$35,000 to $49,999
40,002
14.20%
$50,000 to $74,999
54,356
19.30%
$75,000 to $99,999
32,815
11.70%
$100,000 to $149,999
38,900
13.80%
$150,000 to $199,999
14,006
5.00%
$200,000 or more
16,504
5.90%
Median Household Income
$56,129.00
Mean Household Income
$80,438.00
Based on ve-year esmates, approximately 10.2% of all families and 14.9% of all
individuals in Lee County had an income below the poverty level. Overall, Lee County’s
poverty rates are lower than the statewide rate. However, disparies exist for female-
headed households, especially those with children under the age of 18.
20
American Community Survey, DP03: 2018 ACS 1-Year Estimates
DRAFT Lee County Human Services Gap Analysis
Secon One: Quantave Data
Chapter 2 | Lee County Description and Demographics Page | 25
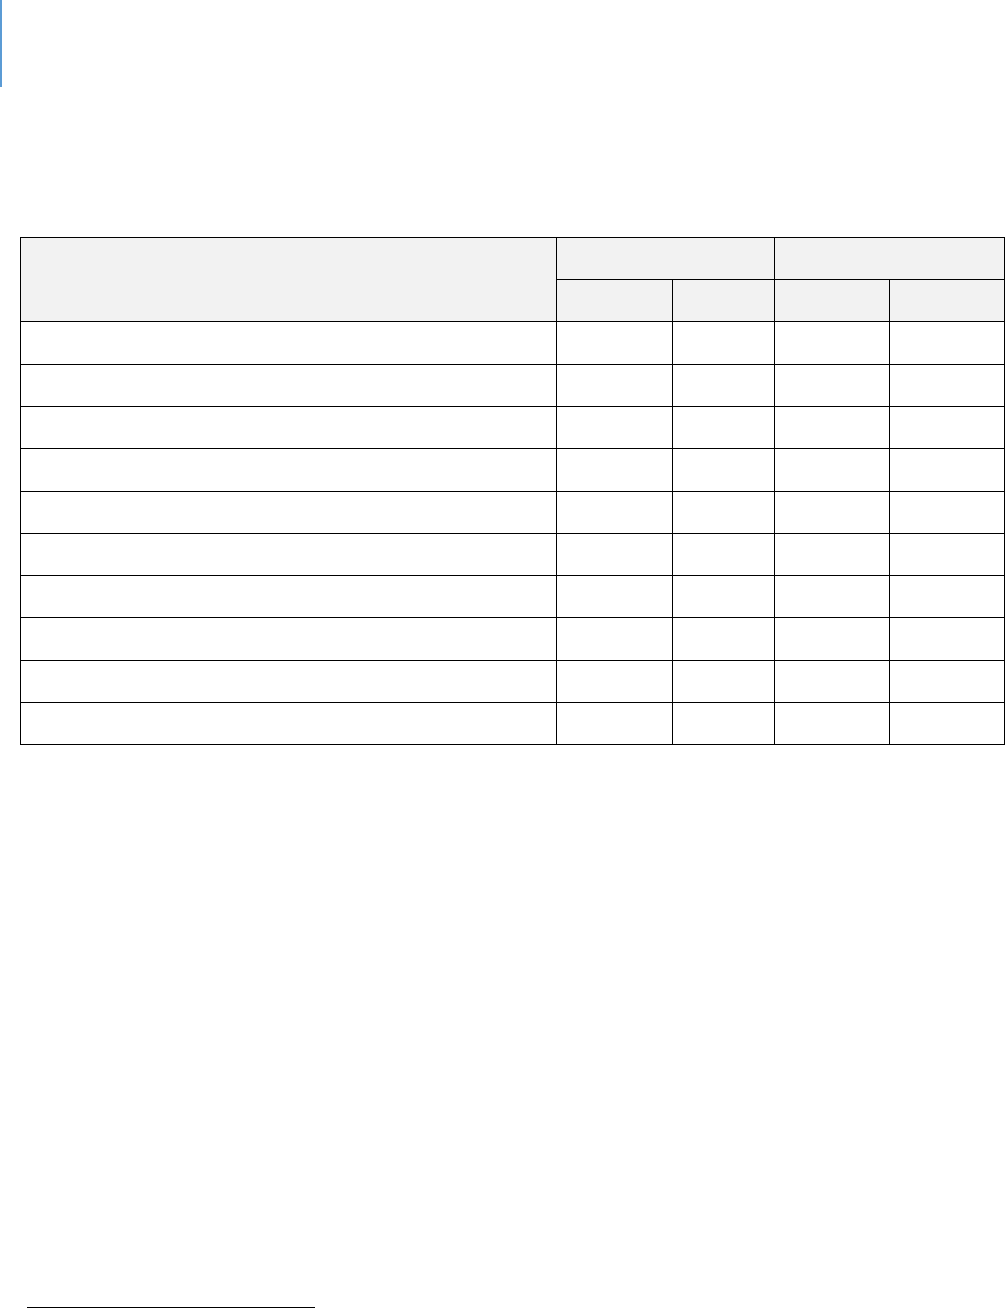
Table 5. Percentage Below Poverty Level in the Last 12 Months
(ACS 5-year Esmates 2013-2017)
21
Florida
Lee
County
All families
11.10%
10.20%
With related children of the householder under 18 years
18.20%
19.80%
With related children of the householder under 5 years only
17.00%
17.30%
Married couple families
6.30%
5.90%
With related children of the householder under 18 years
8.90%
9.90%
With related children of the householder under 5 years only
7.00%
7.20%
Families with female householder, no husband present
26.80%
28.90%
With related children of the householder under 18 years
36.50%
39.20%
With related children of the householder under 5 years only
39.10%
40.40%
All people
15.50%
14.90%
Under 18 years
22.30%
24.90%
Related children of the householder under 18 years
22.00%
24.60%
Related children of the householder under 5 years
24.60%
27.00%
Related children of the householder 5 to 17 years
21.00%
23.70%
18 years and over
13.70%
12.60%
18 to 64 years
14.80%
15.00%
65 years and over
10.30%
7.80%
People in families
12.60%
12.40%
Unrelated individuals 15 years and over
26.60%
24.90%
21
American Community Survey, S1702 and S1701: 2013-2017 ACS 5-Year Estimates

DRAFT Lee County Human Services Gap Analysis
Secon One: Quantave Data
Chapter 2 | Lee County Description and Demographics Page | 26
Employment and Other Sources of Income
Employment is the primary source of income for most Lee County residents. More than
265,000 residents in Lee County are employed. A key factor in determining the needs
of Lee County residents is determining if they have enough income to maintain a
normal standard of living.
According to data from the Florida Department of Economic Opportunity, the
occupaons with the most employment are as follows:
22
22
Florida Department of Economic Opportunity, Wage Estimates, http://www.floridajobs.org/workforce-
statistics/data-center/statistical-programs/occupational-employment-statistics-and-wages

DRAFT Lee County Human Services Gap Analysis
Secon One: Quantave Data
Chapter 2 | Lee County Description and Demographics Page | 27
Table 6. Florida Occupational Employment and Wages; Cape Coral-Fort Myers MSA
(Released.)
2018
Hourly Wage
(2018 wage estimates in dollars)
Title
Employment
Mean
Median
Entry**
Exp***
Total all occupations
265,780
20.67
15.83
10.36
25.83
Retail Salespersons
14,150
12.50
10.64
8.97
14.27
Waiters and Waitresses
8,290
11.21
9.33
8.85
12.40
Cashiers
7,880
11.00
10.39
9.04
11.99
Combined Food Preparation and
Serving Workers, Including Fast
Food
6,780
10.36
9.88
8.87
11.11
Customer Service Representatives
6,650
14.88
13.61
10.77
16.94
Landscaping and Grounds-keeping
Workers
5,940
13.07
12.29
10.60
14.31
Office Clerks, General
5,900
15.52
14.59
10.41
18.07
Registered Nurses
5,660
32.26
31.66
25.76
35.51
Construction Laborers
4,480
15.63
15.12
11.16
17.87
Secretaries and Administrative
Assistants, Except Legal, Medical,
4,330
17.13
16.36
12.37
19.51
Stock Clerks and Order Fillers
4,290
12.91
12.00
10.08
14.32
Cooks, Restaurant
4,100
13.74
13.57
10.65
15.28
General and Operations Managers
3,680
49.58
38.47
22.47
63.13
Carpenters
3,360
18.98
18.57
13.96
21.49
Nursing Assistants
3,350
14.13
13.90
11.46
15.47
Receptionists and Information
Clerks
3,000
14.32
14.16
11.58
15.69
First-Line Supervisors of Retail
Sales Workers
2,990
22.75
21.07
13.93
27.17
First-Line Supervisors of Office and
Administrative Support Worker
2,960
26.77
24.76
16.77
31.78
Janitors and Cleaners, Except
Maids and Housekeeping Cleaners
2,900
12.61
11.75
10.13
13.86
Maids and Housekeeping Cleaners
2,870
11.52
11.21
9.57
12.49
Bookkeeping, Accounting, and
Auditing Clerks
2,650
18.62
18.31
12.92
21.48
DRAFT Lee County Human Services Gap Analysis
Secon One: Quantave Data
Chapter 2 | Lee County Description and Demographics Page | 28
2018
Hourly Wage
(2018 wage estimates in dollars)
Title
Employment
Mean
Median
Entry**
Exp***
Sales Representatives, Wholesale
and Manufacturing, Except
Technical and Scientific Products
2,640
32.35
28.31
15.99
40.53
Laborers and Freight, Stock, and
Material Movers, Hand
2,630
14.34
13.85
10.88
16.07
Maintenance and Repair Workers,
General
2,630
17.57
16.93
12.45
20.14
First-Line Supervisors of
Construction Trades and Extraction
Work
2,530
28.17
27.22
19.70
32.40
First-Line Supervisors of Food
Preparation and Serving Workers
2,510
21.29
15.07
11.13
26.37
Food Preparation Workers
2,500
11.78
11.12
9.24
13.04
Elementary School Teachers,
Except Special Education
2,370
63,684
*
64,661*
49,469
*
70,791
*
Heavy and Tractor-Trailer Truck
Drivers
2,260
18.91
17.82
13.51
21.61
Security Guards
2,200
13.10
12.68
10.14
14.58
Medical Assistants
2,120
15.96
15.47
13.05
17.41
Light Truck or Delivery Services
Drivers
2,040
15.75
13.89
9.93
18.66
* Annual Wage.
** Entry Wage - This is the wage an entry-level worker might expect to make. It is dened as the average (mean)
wage earned by the lowest third of all workers in a given occupaon.
*** Experienced Wage - This wage represents what an experienced worker might expect to make. It is dened as
the average (mean) wage earned by the upper two-thirds of all workers in a given occupaon.
Wages based on 2nd qtr. 2018 survey.
In addion to income from employment, there are other sources from which
households can gain income. Social Security and rerement income are the largest
non-employment income sources in Lee County. The percent of the populaon that
receives public assistance and / or Food Stamps / SNAP is lower in Lee County (11.6%)
than statewide (15%).
23
23
American Community Survey, B19058: 2017 5-Year Estimates

DRAFT Lee County Human Services Gap Analysis
Secon One: Quantave Data
Chapter 2 | Lee County Description and Demographics Page | 29
Labor Force
Labor is dened as members of the populaon who are available and willing to work,
and who are currently employed or have recently looked or a job. Lee County’s labor
force parcipaon rate is 52.9%, indicang that approximately 337,314 individuals over
the age of 16 are currently employed or are seeking employment. Lee County’s
unemployment rate is 4.4%.
24
24
American Community Survey, 2018 1-Year Estimates

DRAFT Lee County Human Services Gap Analysis
Secon One: Quantave Data
Chapter 2 | Lee County Description and Demographics Page | 30
Intenonally le blank.

DRAFT Lee County Human Services Gap Analysis
Secon One: Quantave Data
Chapter 3 | Behavioral Outcomes Page | 31
CHAPTER 3
Behavioral Outcomes
Introducon
Behaviors, or outcomes, are the “boom-line” gap in that the goal of human services
programming of almost any type is to aect some degree of behavioral change. That
change may be posive in the sense of exhibing more pro-social or construcve
behavior. It may be negave from the perspecve of diminishing an-social,
destrucve, or harmful behavior. This is the ulmate test of the value of any
intervenon – does it make some dierence in a person’s life as well as provide an
overall benet to society at large?
This chapter examines both behavioral outcomes as directly measured, as well as
condions that can inuence behavioral outcomes. For example, binge drinking is a
direct behavioral outcome; diculty in accessing a physician can inuence and shape a
behavioral outcome.
This chapter also includes a case study examining the impact of addional funding on
populaon outcomes. Children’s outcomes in Lee County are compared to those of
Florida counes who have a Children’s Services Council as either an independent taxing
district or a dependent one.
Methodology
Comparison of Public Databases. This analysis is based on a variety of public databases
that compare a behavior in Lee County with the same behavior in other Florida
counes. In a few cases, a naonal comparison is used if there are no state
comparave data.
Why compare Lee to other Florida counes and not naonal data points? While there
are local dierences in Florida counes, they all operate within the same state policy
framework and, for the most part, all have the same tools to work with to address the
needs and concerns of the county they serve. Counes or parishes in other states have

DRAFT Lee County Human Services Gap Analysis
Secon One: Quantave Data
Chapter 3 | Behavioral Outcomes Page | 32
dierent tools and must work within dierent state policy frameworks. While
comparisons among diering Florida counes are rarely “apple to apple” comparisons,
they are at least “apple to fruit”. Trying to compare a Florida county to a county in any
other state may become an “apple to vegetable” exercise.
The Limitaons of Public Databases. Public databases have several limitaons:
1) They usually have a time lag of one to three years. Data is always collected
retrospectively and sometimes not annually.
2) There may be challenges of not using consistent practices in collection and coding,
so that the data from one jurisdiction may not be fully comparable to that of
another.
3) There may be some anomalous event that creates an outlier situation that can skew
those databases where averages are reported.
4) The data may not allow the level of detailed analysis one would desire. Some
databases only compare state level data. Some have data at a county level and not
at a census tract level.
Given these limitaons, cauon should always be exercised in the interpretaon of
comparisons. That stated, these are the tools that exist to compare behavioral
outcomes.
Findings
Data gathered from the various public databases compares Lee County data to data for
the State of Florida. The comparisons are color coded as follows:
Green: The Lee County data point is better than the State data point by 10% or
more
Yellow: The Lee County data point is within a 10% range, above or below, the
State data point
Red: The Lee County data point is worse than the State data point by 10% or
more.
Appendix K explains the methodological reasoning behind these determinaons. The
ndings are organized in the following categories:

DRAFT Lee County Human Services Gap Analysis
Secon One: Quantave Data
Chapter 3 | Behavioral Outcomes Page | 33
Aggregated Data. These are databases that combine various data sources to create
summary or index scores. Their value is that they help make overall paerns clear and
provide a bigger picture. In addion, because it is aggregated data, it is likely to be
somewhat more stable. However, there can be signicant year-to-year variance on
specic behaviors simply due to survey response variaon, data collecon variances,
coding error or diering interpretaon of quesons.
Behaviors of Concern and Signicance. These databases examine various behaviors that
can be understood as posive and desirable, or problemac and concerning. It is these
behaviors that oen raise public concern and that6 are oen the focus of various
intervenons. This secon reports data for behavioral health outcomes, violence and
crime outcomes, and various health outcomes.
Service Capacity and Infrastructure Data. These tables present data on behaviors
themselves or service and access data that shape behavior. Specic tables address
various indicators of access to services, treatment capacity and housing.
The tables present the comparave data from various databases. The source database
is idened in each table.
Aggregated Data
Comparison of Aggregated Data. Some of the databases aggregate various specic
behaviors to generate a score ranking Lee County within the State. As Table 7 shows,
Lee County on six of the eight aggregates is ranked in the Top 25% or higher of Florida
counes on those six indexes. Of the remaining two indexes, Lee is average on one and
below average on the other. From an overall perspecve, behavioral outcomes in Lee
County are superior to the average county in the State and, for the most part, Lee
County is in the Top 25% of the State as to preferred or desired direcon for behavioral
outcomes.
DRAFT Lee County Human Services Gap Analysis
Secon One: Quantave Data
Chapter 3 | Behavioral Outcomes Page | 34
Table 7. Comparison of Aggregated Data
25
Source
Data Title
Year
Lee
County
State
Avg
Comparison to
State
County Health
Rankings
Health Outcomes
(overall) of 67
Counes
2019
11
34
Higher than
average
County Health
Rankings
Length of Life of 67
Counes
2019
18
34
Higher than
average
County Health
Rankings
Quality of Life of 67
Counes
2019
12
34
Higher than
average
County Health
Rankings
Health Factors
(overall) of 67
Counes
2019
18
34
Higher than
average
County Health
Rankings
Health Behaviors of 67
Counes
2019
9
34
Higher than
average
County Health
Rankings
Clinic Care of 67
Counes
2019
14
34
Higher than
average
County Health
Rankings
Social Economic Issues
of 67 Counes
2019
32
34
Within 10%
average
County Health
Rankings
Physical Environment
of 67 Counes
2019
46
34
Below average
Behaviors of Concern and Signicance
Behavioral Health. Table 8 reports various indices related to behavioral health, including
mental health and substance abuse data points. As shown in the table, the data is
mixed for Lee County. The preponderance of “worse” comparisons are related to either
adult or youth alcohol-related behaviors. The other “worse” cluster is depression at any
age and suicide for persons 19-21. Lee County has fewer hospitalizaons for mental
disorders than other counes. This could be related to the higher alcohol indicators.
However, there are a variety of factors that can determine this number (such as a lower
25
hps://www.countyhealthrankings.org/app/orida/2019/rankings/lee/county/outcomes/overall/snapshot
DRAFT Lee County Human Services Gap Analysis
Secon One: Quantave Data
Chapter 3 | Behavioral Outcomes Page | 35
capacity of beds), so one should be cauous in concluding that mental illness is less
problemac in Lee. The two clearly posive indicators are that Lee County residents
have fewer unhealthy mental days than the average State resident and that the County
is ranked ninth in the State on overall health behaviors.
Table 8. Behavioral Health Outcomes
Source
Data Point
Year
Lee
State
Comparison
Lee Drug Free
Coalion Need
Assessment 2019
26
Past 30 day use of
alcohol by students -
middle school
2018
6.50%
7.30%
Beer
Lee Drug Free
Coalion Need
Assessment 2019
Past 30 day use of
alcohol by students -
high school
2018
26.30
%
21.20
%
Worse
Lee Drug Free
Coalion Need
Assessment 2019
Percent of students
who used alcohol
before or during
school in the past 12
months - middle
school
2018
3.10%
3.70%
Beer
Lee Drug Free
Coalion Need
Assessment 2019
Percent of students
who used alcohol
before or during
school in the past 12
months - high school
2018
7%
6.70%
Within 10%
average
Lee Drug Free
Coalion Need
Assessment 2019
Percent of students
reporng that in the
last 12 months they
had aacked
someone with the
intent to harm -
middle school
2018
6.30%
6.70%
Within 10%
average
26
Lee Drug Free Coalition
DRAFT Lee County Human Services Gap Analysis
Secon One: Quantave Data
Chapter 3 | Behavioral Outcomes Page | 36
Source
Data Point
Year
Lee
State
Comparison
Lee Drug Free
Coalion Need
Assessment 2019
Percent of students
reporng that in the
last 12 months they
had aacked
someone with the
intent to harm - high
school
2018
6%
7%
Beer
Lee Drug Free
Coalion Need
Assessment 2019
Past 30 day use of
alcohol by students -
ages 10-14
2018
8.50%
8.10%
Within 10%
average
Lee Drug Free
Coalion Need
Assessment 2019
Past 30 day use of
alcohol by students -
ages 15-17
2018
24%
20.90
%
Worse
Lee Drug Free
Coalion Need
Assessment 2019
Past 30 day use of
alcohol by female
students
2018
18.40
%
16.80
%
Worse
Lee Drug Free
Coalion Need
Assessment 2019
Past 30 day use of
alcohol by male
students
2018
17.20
%
13.80
%
Worse
Lee Drug Free
Coalion Need
Assessment 2019
Percent of students
binge drinking in past
30 days - age 10-14
2018
4.90%
3.20%
Worse
Lee Drug Free
Coalion Need
Assessment 2019
Percent of students
binge drinking in past
30 days - Age 15-17
2018
10.40
%
9.40%
Worse
Lee Drug Free
Coalion Need
Assessment 2019
Percent of female
students binge
drinking in past 30
days
2018
7.70%
6.70%
Worse
Lee Drug Free
Coalion Need
Assessment 2019
Percent of male
students binge
drinking in past 30
days
2018
8.70%
6.90%
Worse
Lee Drug Free
Coalion Need
Assessment 2019
Past 30 day use of
marijuana by
2018
3.5%
3.70%
Within 10%
average
DRAFT Lee County Human Services Gap Analysis
Secon One: Quantave Data
Chapter 3 | Behavioral Outcomes Page | 37
Source
Data Point
Year
Lee
State
Comparison
students - middle
school
Lee Drug Free
Coalion Need
Assessment 2019
Past 30 day use of
marijuana by
students - high
school
2018
14.80
%
16.30
%
Within 10%
average
Lee Drug Free
Coalion Need
Assessment 2019
Lifeme use of
depressants by
students - middle
school
2018
2.60%
2.30%
Within 10%
average
Lee Drug Free
Coalion Need
Assessment 2019
Lifeme use of
depressants by
students - high
school
2018
4.10%
5.90%
Beer
Lee Drug Free
Coalion Need
Assessment 2019
Lifeme use of
prescripon pain
relievers - middle
school
2018
2.40%
2.60%
Within 10%
average
Lee Drug Free
Coalion Need
Assessment 2019
Lifeme use of
prescripon pain
relievers - high
school
2018
4.70%
5%
Within 10%
average
Lee Drug Free
Coalion Need
Assessment 2019
Lifeme use of
amphetamines -
middle school
2018
1.80%
1.20%
Worse
Lee Drug Free
Coalion Need
Assessment 2019
Lifeme use of
amphetamines - high
school
2018
3.80%
3.60%
Within 10%
average
Lee Drug Free
Coalion Need
Assessment 2019
Past 30 day use of
depressants - middle
school
2018
0.50%
0.90%
Beer
Lee Drug Free
Coalion Need
Assessment 2019
Past 30 day use of
depressants - high
school
2018
2.20%
1.60%
Worse
DRAFT Lee County Human Services Gap Analysis
Secon One: Quantave Data
Chapter 3 | Behavioral Outcomes Page | 38
Source
Data Point
Year
Lee
State
Comparison
Lee Drug Free
Coalion Need
Assessment 2019
Age adjusted Death
Rate Per 100,000
Suicide all means
2012
-
2014
16.60
%
14%
Worse
Health Equity
Prole
27
Hospitalizaons for
mental disorders, Per
100,000 populaon
2017
625.1
975.4
Beer
2018
598.5
978.2
Beer
Healthiest Weight
Prole
28
Average number of
unhealthy mental
days in the past 30
days
2016
2.8
3.6
Beer
Healthiest Weight
Prole
Adults whose poor
physical or mental
health kept them
from doing usual
acvies on 14 or
more of the past 30
days (Among adults
who have had at
least one day of
poor mental or
physical health)
2016
20.8%
18.6%
Worse
Social and Mental
Health
29
Hospitalizaons for
mental disorders 3-Yr
Rate Per 100,000
2014
-16
592.4
983.5
Beer
2016
-18
595.2
958.4
Beer
Social and Mental
Health
Hospitalizaons for
mental disorders,
except drug and
alcohol-induced
mental disorders 3-Yr
Rate Per 100,000
2014
-16
417.1
821.5
Beer
2016
-18
393.3
792.9
Beer
27
Florida Health Charts; Health Equity Profile:
http://www.flhealthcharts.com/ChartsReports/rdPage.aspx?rdReport=ChartsProfiles.HealthEquityProfile
28
Florida Health Charts; Healthiest Weight Profile:
http://www.flhealthcharts.com/ChartsReports/rdPage.aspx?rdReport=ChartsProfiles.HealthiestWeightCountyProfi
le Data source: Behavioral Risk Factor Surveillance System (BRFSS)
29
Florida Health Charts; County Health Profile:
http://www.flhealthcharts.com/ChartsReports/rdPage.aspx?rdReport=ChartsProfiles.CountyHealthProfile
DRAFT Lee County Human Services Gap Analysis
Secon One: Quantave Data
Chapter 3 | Behavioral Outcomes Page | 39
Source
Data Point
Year
Lee
State
Comparison
Social and Mental
Health
Hospitalizaons for
mental disorders age
18-21
2016
-18
733.5
1197.
5
Beer
Social and Mental
Health
Hospitalizaons for
mental disorders age
22-24
2016
-18
829.4
1227.
0
Beer
Social and Mental
Health
Hospitalizaons for
mental disorders age
25-44
2016
-18
880.8
1313.
6
Beer
Social and Mental
Health
Hospitalizaons for
mental disorders age
45-64
2016
-18
922.2
1226.
0
Beer
Social and Mental
Health
Hospitalizaons for
mental disorders age
65-74
2016
-18
476.3
586.7
Beer
Social and Mental
Health
Hospitalizaons for
mental disorders age
75 or older
2016
-18
229.5
347.8
Beer
Social and Mental
Health
Hospitalizaons for
mood and depressive
disorders
2016
-18
258.5
480.2
Beer
Social and Mental
Health
Hospitalizaons for
schizophrenic
disorders
2016
-18
98.4
251.3
Beer
Social and Mental
Health
Alcohol-suspected
Motor Vehicle
Crashes 3-Yr Rate Per
100,000
2015
-17
65.3
52.8
Worse
Social and Mental
Health
Alcohol-suspected
Motor Vehicle
Crashes
2016
-18
62.4
49.5
Worse
Social and Mental
Health
Alcohol-suspected
Motor Vehicle Crash
Deaths 3-Yr Rate Per
100,000
2016
-18
2.5
2.8
Within 10%
average
DRAFT Lee County Human Services Gap Analysis
Secon One: Quantave Data
Chapter 3 | Behavioral Outcomes Page | 40
Source
Data Point
Year
Lee
State
Comparison
Social and Mental
Health
Alcohol-suspected
Motor Vehicle Crash
Injuries 3-Yr Rate Per
100,000
2015
-17
42.2
34.9
Worse
2016
-18
31.7
24.0
Worse
Social and Mental
Health
Suicide (Age-
Adjusted Death rate)
2016
-18
15.5
14.5
Worse
County Death Data
Comparison
30
Suicide Age Adjusted
Death Rate Per
100,000 Total
Populaon
2017
14.3
14.1
Within 10%
average
2018
15.3
17.0
Within 10%
average
Community Health
Needs Assessment
31
% Diagnosed
Depression
2017
22.1
16.5
Worse
Community Health
Needs Assessment
Suicide (age adjusted
death rate)
2017
16.9
14
Worse
Aging in FL Prole
32
Engage in heavy or
binge drinking 65+
2016
14.8
8.7
Worse
Child Health Status
33
Suicide death rate,
ages 19-21 Per
100,000 populaon
2015
-17
16.1
12.6
Worse
2016
-18
15.9
12.7
Worse
Child Health Status
Suicide death rate,
ages 12-18 Per
100,000 populaon
2015
-17
5.3
5.3
Within 10%
average
2016
-18
5.2
5.8
Within 10%
average
30
Florida Health Charts; County Death Data Comparison:
http://www.flhealthcharts.com/ChartsReports/rdPage.aspx?rdReport=ChartsProfiles.CountyDeathDataCompariso
n
31
2017 Community Health Needs Assessment Report; Lee Health and FL Dept. of Health in Lee County
32
Florida Health Charts; Aging in Florida Profile:
http://www.flhealthcharts.com/ChartsReports/rdPage.aspx?rdReport=ChartsProfiles.AgingInFloridaProfile
33
Florida Health Charts: Child Health Status Profile:
http://www.flhealthcharts.com/ChartsReports/rdPage.aspx?rdReport=ChartsProfiles.ChildHealthStatusProfile
DRAFT Lee County Human Services Gap Analysis
Secon One: Quantave Data
Chapter 3 | Behavioral Outcomes Page | 41
Violence Related Behavior. Table 9 reports outcome data of violence-related behaviors.
As with behavioral health, the outcomes are mixed.
Lee County’s outcomes are beer than the State on various specic crime indices such
as domesc violence, rape or assault. The county is average on various child abuse
indicators. Where the numbers are worse than the State of Florida are with youth.
Youth in Lee County experience higher rates of homicide, suicide (as noted in Table 8),
sexual violence and arrests.
Table 9.Comparison of Violence related Behaviors
Sources
Data Title
Year
Lee
County
State
Comparison
to State
Community
Health Needs
Assessment
Violent Crime per
100,000
2017
359.2
514.6
Beer
Child Health
Status Prole
Violent Crime per
100,000
2017
327.8
416.2
Beer
Health Equity
Prole
Incarceraon rate
2017
2.3
2.6
Beer
2018
2.7
2.7
Within
10%
average
Social and
Mental Health
Index Crimes 3-Yr
Rate Per 100,000
2015-17
2085
3156.
9
Beer
2016-18
1931.9
2948.
5
Beer
Social and
Mental Health
Larceny 3-Yr Rate
Per 100,000
2015-17
1229.3
2016.
8
Beer
2016-18
1154.4
1906.
0
Beer
Social and
Mental Health
Burglary 3-Yr Rate
Per 100,000
2015-17
369.8
490.9
Beer
2016-18
311.2
422.2
Beer
Social and
Mental Health
Aggravated Assault
3-Yr Rate Per
100,000
2015-17
242.1
298.9
Beer
2016-18
220.5
280.4
Beer
DRAFT Lee County Human Services Gap Analysis
Secon One: Quantave Data
Chapter 3 | Behavioral Outcomes Page | 42
Sources
Data Title
Year
Lee
County
State
Comparison
to State
Social and
Mental Health
Motor Vehicle The
3-Yr Rate Per
100,000
2015-17
128.3
208.5
Beer
2016-18
134.7
205.8
Beer
Social and
Mental Health
Robbery 3-Yr Rate
Per 100,000
2015-17
75.5
98.6
Beer
2016-18
68.4
90
Beer
Social and
Mental Health
Rape 3-Yr Rate Per
100,000
2015-17
34.3
38.0
Beer
2016-18
36.7
38.8
Within
10%
average
Social and
Mental Health
Murder 3-Yr Rate Per
100,000
2015-17
5.7
5.3
Within
10%
average
2016-18
6.0
5.3
Worse
Social and
Mental Health
Forcible Sex
Oenses 3-Yr Rate
Per 100,000
2015-17
53.4
53.4
Within
10%
average
2016-18
55.7
54.4
Within
10%
average
Social and
Mental Health
Domesc Violence
Oenses 3-Yr Rate
Per 100,000
2015-17
414.8
527.8
Beer
2016-18
424.1
514.3
Beer
County Death
Data Comparison
Homicide Age
Adjusted Death Rate
Per 100,000 Total
Populaon
2107
6.6
6.5
Within
10%
2018
6.7
6.6
Within
10%
average
Kids Count
(Florida Child
Well-being Index)
34
Delinquency Cases
Received (Percent
reducon from
2007/08 counts
2008-17
(46%)
(55%)
Worse
34
Florida Kids Count (Annie E. Casey Foundation): http://www.floridakidscount.org/
DRAFT Lee County Human Services Gap Analysis
Secon One: Quantave Data
Chapter 3 | Behavioral Outcomes Page | 43
Sources
Data Title
Year
Lee
County
State
Comparison
to State
through 2016/17
counts)
MyFLFamilies.co
m
35
Chart - Abuse during
In-Home Services (%
of Children Not
Abused)
2007-19
93.58%
95.07
%
Within
10%
average
MyFLFamilies.co
m
Chart - Young Adults
Aging out who did
not Perpetrate
Abuse by their 25
th
birthday.
2014-19
84.21%
86.85
%
Within
10%
average
MyFLFamilies.co
m
Chart - Removal
Rate per 100
2009-19
4.70%
4.80%
Within
10%
average
Child Health
Status
Homicide deaths 5-
11 Per 100,000
populaon
2015-17
0
.7
Within
10%
average
0
.7
Within
10%
average
Child Health
Status
Homicide deaths 12-
18 Per 100,000
populaon
2015-17
9.3
5.4
Worse
7.2
5.3
Worse
Child Health
Status
Homicide deaths 19-
21 Per 100,000
populaon
2015-17
19.3
13.7
Worse
19.1
14.9
Worse
Child Health
Status
Children
experiencing child
abuse ages 5-11
2015-17
850.4
932.8
Within
10%
average
Child Health
Status
Children
experiencing sexual
violence ages 5-11
2015-17
73.5
59.8
Worse
35
Florida Department of Children and Families; Planning and Performance Measures
https://myflfamilies.com/programs/childwelfare/dashboard/abuse-during-in-home-services.shtml
DRAFT Lee County Human Services Gap Analysis
Secon One: Quantave Data
Chapter 3 | Behavioral Outcomes Page | 44
Sources
Data Title
Year
Lee
County
State
Comparison
to State
Per 100,000
populaon
Child Health
Status
Arrests, All Oenses
by County, Youth
Ages 10-17 Per
100,000 populaon
2014-16
4473.1
4028.
3
Worse
Child Health
Status
Referrals to
Department of
Juvenile Jusce Per
100,000 populaon
2017
3888.3
3479.
3
Worse
2018
3784.3
3121.
7
Worse
Child Health
Status
School
Environmental
Safety Incidents
(Violent acts K-12)
2017
2802.9
2408.
0
Worse
Child Health
Status
Out of School
Suspensions K-12
2017
4390.4
5044.
4
Beer
DRAFT Lee County Human Services Gap Analysis
Secon One: Quantave Data
Chapter 3 | Behavioral Outcomes Page | 45
Health Related Behavior – Nutrion. Table 10 reports comparave nutrional
outcomes, in which physical characteriscs may impact the human services system. As
the table shows, Lee County is basically the same as the rest of the State. There is
mixed data on obesity. However, underweight individuals occur at rates greater than
the State average.
Table 10. Comparison of Nutritional Related Outcomes
Source
Data Title
Year
Lee
County
State
Comparison
to State
Healthiest Weight
Prole
Adults who
consume at least 5
servings of fruits
and vegetables a
day
2013
17.9%
18.3%
Within 10%
average
Healthiest Weight
Prole
Adults who are
overweight
2016
37.7%
35.8%
Within 10%
average
Healthiest Weight
Prole
Adults who are
obese
2016
27.5%
27.4%
Within 10%
average
Healthiest Weight
Prole
Adults who are at
a healthy weight
2016
31.5%
34.5%
Within 10%
average
Healthiest Weight
Prole
Adults who are
underweight
2016
3.3%
2.3%
Worse
Community Health
Needs Assessment
%Obese (BMI 30+)
2017
31.2%
26.8%
Worse
healthcharts.com
36
Obesity (Births to
Obese Mothers at
me Pregnancy
Occurred)
2018
29.2%
26.2%
Worse
healthcharts.com
Obesity (WIC
children >=2 who
are overweight or
obese)
2018
29%
27.1%
Within 10%
average
36
Florida Health Charts (Interactive):
http://www.flhealthcharts.com/Charts/DataViewer/BirthViewer/BirthViewer.aspx?cid=0606
DRAFT Lee County Human Services Gap Analysis
Secon One: Quantave Data
Chapter 3 | Behavioral Outcomes Page | 46
Source
Data Title
Year
Lee
County
State
Comparison
to State
Child Health Status
High School
students who are
underweight
2016
4.7%
3.6%
Worse
2018
5.2%
4.2%
Worse
Child Health Status
Middle School
students who are
underweight
2016
5%
5.2%
Within 10%
average
2018
3.6%
4.7%
Worse
Healthiest Weight
Prole
Middle and high
school students
who are at a
healthy weight
2016
66.7%
66.4%
Within 10%
average
Healthiest Weight
Prole
Middle and high
school students
who are
underweight
2016
4.8%
4.2%
Worse
Healthiest Weight
Prole
Middle and high
school students
who are
overweight or
obese
2016
28.5%
29.4%
Within 10%
average
Healthiest Weight
Prole
Middle and high
school students
who are obese
2016
13.2%
13.0%
Within 10%
average
Healthiest Weight
Prole
Middle and high
school students
who are
overweight
2016
15.3%
16.3%
Within 10%
average
Health Related Behavior – Alzheimer’s / HIV. Table 11 reports data for two physical
health condions that oen create the need for social service supports – Alzheimer’s
and HIV/Aids. As the chart shows, Lee County data is beer than the average county in
the State.
DRAFT Lee County Human Services Gap Analysis
Secon One: Quantave Data
Chapter 3 | Behavioral Outcomes Page | 47
Table 11. Comparison of Alzheimer’s and HIV Outcomes
Source
Data Title
Year
Lee
County
State
Comparison
to State
Community
Health Needs
Assessment
Alzheimer's Disease
(age adjusted death
rate) per 100,000
2017
12.1
19.2
Beer
Aging in Florida
Prole
Probable Alzheimer's
Cases 65+
2017
12.7%
13.3%
Within 10%
average
Aging in Florida
Prole
Alzheimer's Age-
Adjusted Death Rate
2018
17%
20%
Beer
Community
Health Needs
Assessment
HIV Aids (age adjusted
death rate) per
100,000
2017
3.1
5.9
Beer
Community
Health Needs
Assessment
HIV Prevalence per
100,000
2017
294.3
606.1
Beer
County Death
Data
Comparison
HIV/AIDS Age Adjusted
Death Rate Per
100,000 Total
Populaon
2017
1.2
3.2
Beer
2018
2.0
2.9
Beer
County Health
Data
Comparison
37
AIDS Cases per
100,000
2017
6
9.9
Beer
2018
5.3
9.2
Beer
County Health
Prole
HIV/AIDS - 3-year age
adjusted death rates
per 100,000
2015-
17
1.4
3.7
Beer
2016-
18
1.7
3.3
Beer
County Health
Prole
AIDS Cases (3-Yr Rate
Per 100,000)
2016-
18
6.2
9.8
Beer
37
Florida Health Charts; County Health Status Comparison:
http://www.flhealthcharts.com/ChartsReports/rdPage.aspx?rdReport=ChartsProfiles.CountyHealthStatusComparis
on

DRAFT Lee County Human Services Gap Analysis
Secon One: Quantave Data
Chapter 3 | Behavioral Outcomes Page | 48
Health Related Behaviors – Health Pracces. Table 12 reports data on the health
pracces of Lee County residents. Poor health pracces can lead not only to physical
dicules, but also to stress upon the human services of a community. With several
posive excepons, the residents of Lee County are like the other residents of Florida.
Table 12. Comparison of Health Practices
Source
Data Title
Year
Lee
County
State
Comparison to
State
Community
Health Needs
Assessment
% Meeng Physical
Acvity Guidelines
2017
26.8%
21.8%
Beer
Aging in FL Prole
Reported good,
very good or
excellent health
status 65+
2016
78.5%
75.7%
Within 10%
average
Aging in FL Prole
Physically
unhealthy days in
the past month 65+
2016
4.7%
4.9%
Within 10%
average
Aging in FL Prole
Reported fair or
poor health status
65+
2016
21.5%
24.3%
Beer
Aging in FL Prole
Meet aerobic
acvity
recommendaons
65+
2016
50.4%
45.7%
Beer
Aging in FL Prole
Meet muscle
strengthening
recommendaons
65+
2016
36.1%
31.0%
Beer
Healthiest Weight
Prole
Adults who are
sedentary
2016
27.8%
29.8%
Within 10%
average
Healthiest Weight
Prole
Adults who meet
aerobic
recommendaons
2016
48.5%
44.8%
Within 10%
average
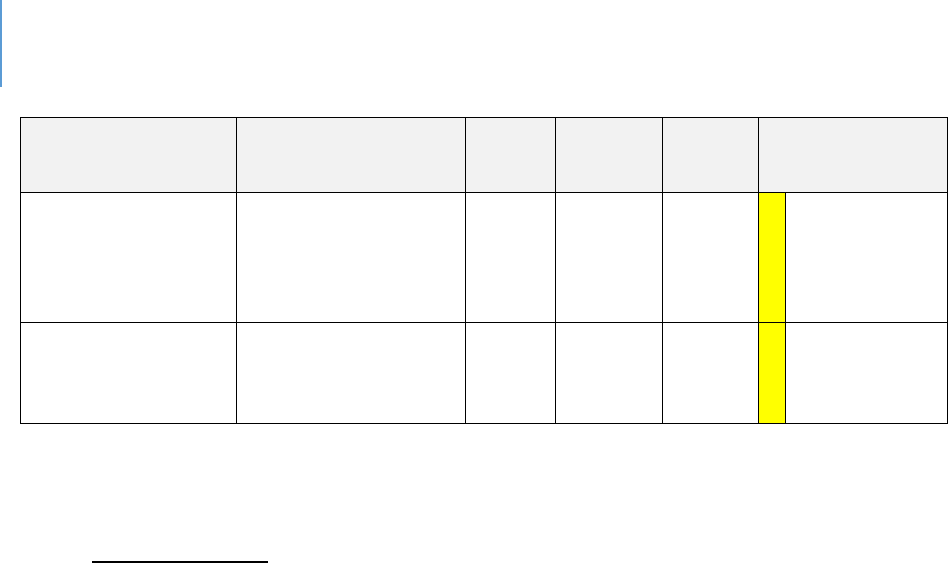
DRAFT Lee County Human Services Gap Analysis
Secon One: Quantave Data
Chapter 3 | Behavioral Outcomes Page | 49
Source
Data Title
Year
Lee
County
State
Comparison to
State
Healthiest Weight
Prole
Adults who meet
muscle
strengthening
recommendaons
2016
35.6%
38.2%
Within 10%
average
Healthiest Weight
Prole
Adults who are
inacve or
insuciently acve
2016
52.5%
56.7%
Within 10%
average
Service Capacity and Infrastructure Data
Access to Services. Table 13 presents comparave access data. Access is dened in
several ways, including:
1) geographic accessibility of a service or benefit
2) a financial definition, as indicated by insurance coverage
3) language barriers
4) availability of service providers
5) transportation
In this table, some state comparave data was not available so naonal level data were
used. The data are color coded orange.
As with the other tables, data for Lee County are mixed, with the County being beer
on some data points, average on others and worse on others. Most the “worse” data
points occur when compared to naonal data. It is possible that all Florida counes
would be worse on these comparisons so they should not be viewed as overly
signicant. One other “worse” data point is of quesonable value. It covers private
recreaonal facilies. Since public recreaonal facilies are more important, this data
point should be ignored. Two other data points, related to distance from healthy food
sources or recreaonal parks, are due to the suburban nature of the county in that the
populaon is highly distributed in a low-density paern.
Two indicators that are more signicant are the higher percentage of children 0-17
without health insurance and the lower rates of pre-natal care in the rst trimester.
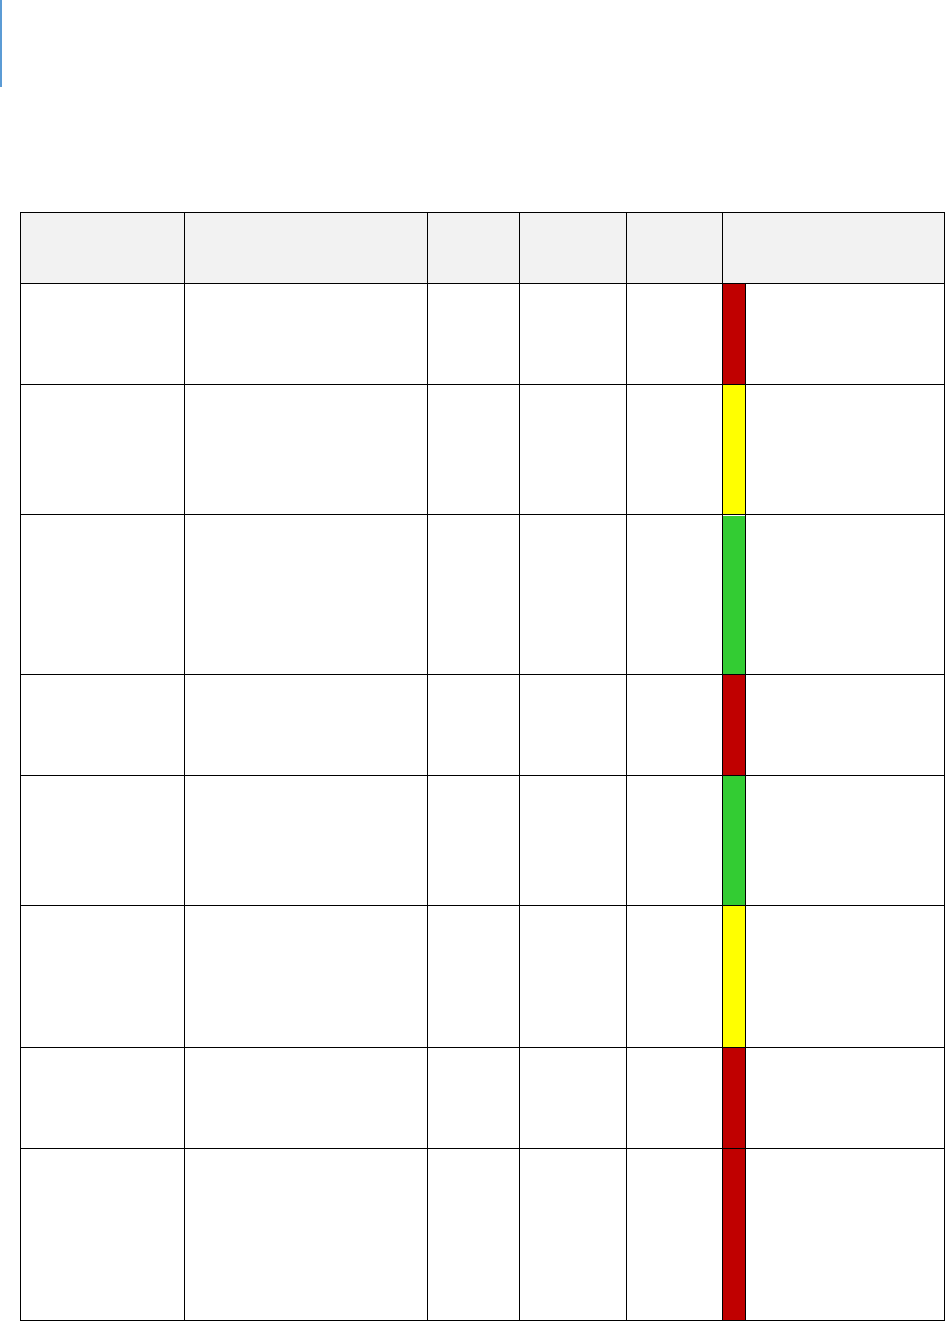
DRAFT Lee County Human Services Gap Analysis
Secon One: Quantave Data
Chapter 3 | Behavioral Outcomes Page | 50
Each of these can have signicant health implicaons.
Table 13. Access to Services
Source
Data Title
Year
Lee
County
State
Comparison
Healthiest
Weight
Prole
Populaon that live
within a 1/2 mile of
healthy food source
2016
21.8%
30.9%
Worse
Healthiest
Weight
Prole
Populaon that live
within a 1/2 mile of
a fast food
restaurant
2016
31.9%
33.9%
Within 10%
average
Healthiest
Weight
Prole
Populaon that live
within a ten-minute
walk (1/2 mile) of an
o-street trail
system
2016
39.5%
18.2%
Beer
Health
Equity
Prole
Populaon living
within ½ mile of a
park
2016
22.6%
43.2%
Worse
Healthiest
Weight
Prole
Workers who used
taxicab, motorcycle,
bicycle, or other
means to work
2016
5-yr
Est
3.1%
2.2%
Beer
Healthiest
Weight
Prole
Workers who used
car, truck, or van -
drove alone Workers
who walk to work
2016
5-yr
Est
79.8%
79.5%
Within 10%
average
Healthiest
Weight
Prole
Workers who walk to
work
2016
5-yr
Est
1.0%
1.5%
Worse
Community
Health
Needs
Assessment
Private
Recreaon/Facilies
per 100,000
2017
7.4
9.8
Worse
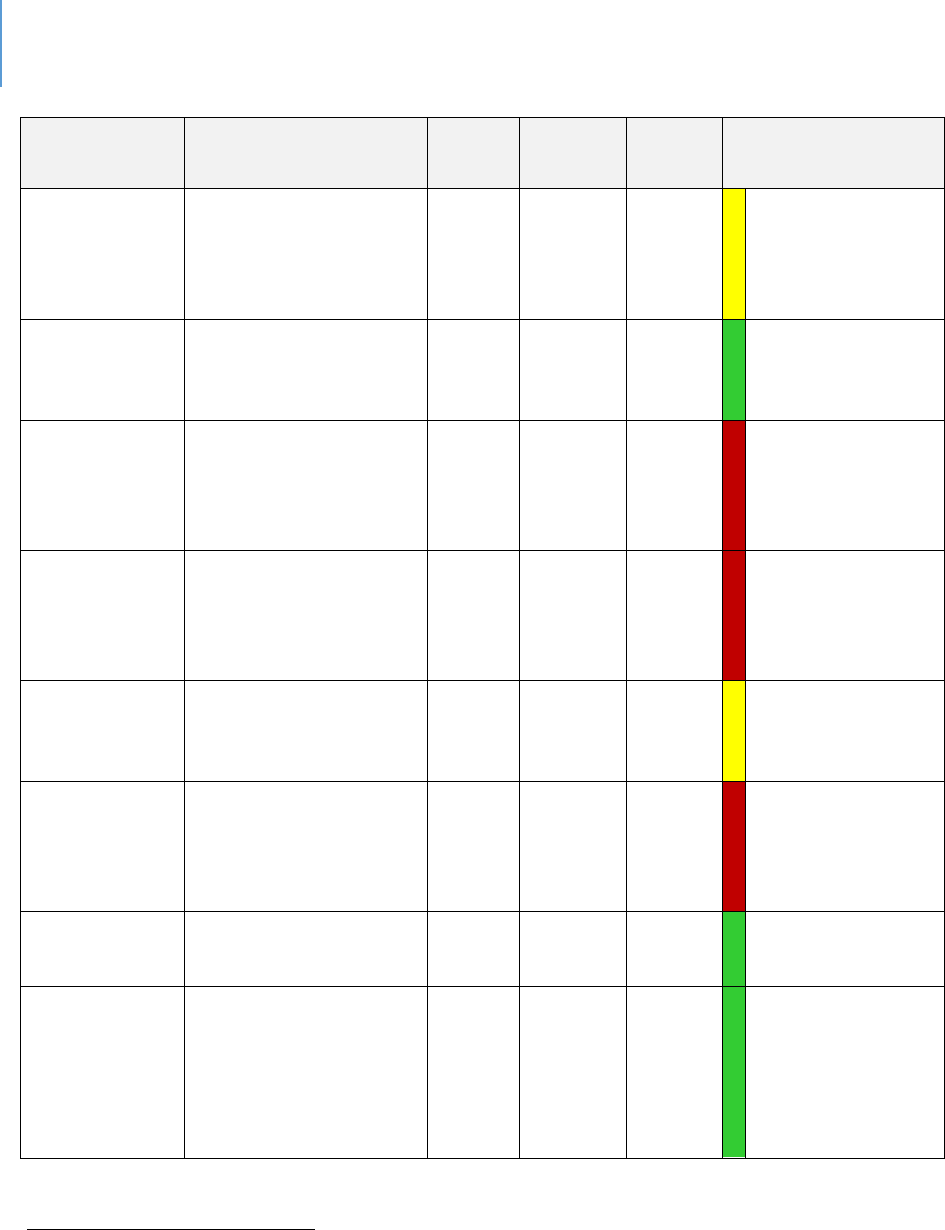
DRAFT Lee County Human Services Gap Analysis
Secon One: Quantave Data
Chapter 3 | Behavioral Outcomes Page | 51
Source
Data Title
Year
Lee
County
State
Comparison
Community
Health
Needs
Assessment
Linguiscally Isolated
Populaon
2017
5.6%
6.5%
Within 10%
average
Healthiest
Weight
Prole
Populaon 5+ that
speak English less
than very well
2016
5-yr
Est
9.3%
11.7%
Beer
Community
Health
Needs
Assessment
Populaon with Low
Food Access
2017
38.2%
25.7%
Worse
Community
Health
Needs
Assessment
No Prenatal Care
First Trimester
2017
36.6%
28.3%
Worse
County Birth
Data
Comparison
Births with Adequate
Prenatal Care
(Kotelchuck index)
2015-
17
73.8%
70.5%
Within 10%
average
School Age
Child
Adolescent
Prole
38
Children ages 0-17
without health
insurance
2012-
16
10.9%
8.9%
Worse
US Census
39
Uninsured children
2018
9.3%
7.2%
Worse
Community
Health
Needs
Assessment
% (18-64) Lack
Health Insurance
2017
14.7%
20.9%
Beer
38
Florida Health Charts; School-aged Child and Adolescent Profile:
http://www.flhealthcharts.com/ChartsReports/rdPage.aspx?rdReport=ChartsProfiles.School-
agedChildandAdolProfile
39
US Census; Uninsured children: https://www.census.gov/programs-surveys/sahie.html
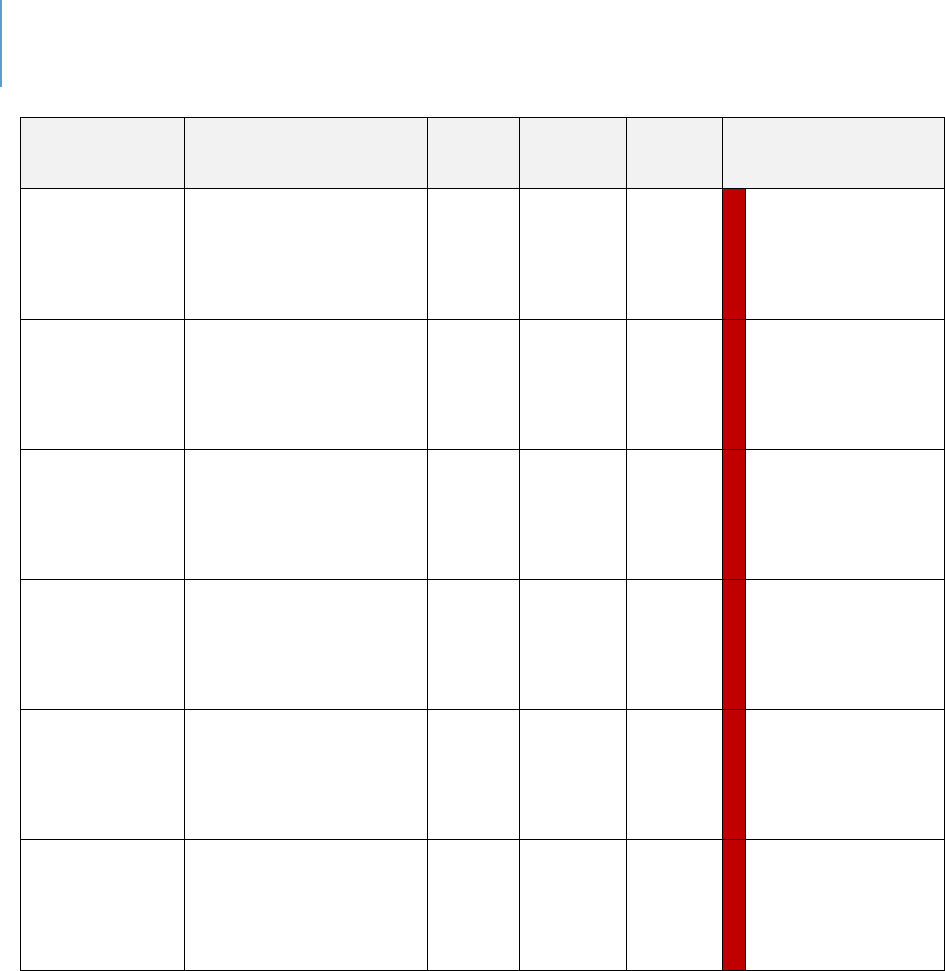
DRAFT Lee County Human Services Gap Analysis
Secon One: Quantave Data
Chapter 3 | Behavioral Outcomes Page | 52
Source
Data Title
Year
Lee
County
State
Comparison
Community
Health
Needs
Assessment
% have Dental
Insurance
2017
50.6%
66.5%
Worse
Community
Health
Needs
Assessment
% have Dental
Insurance
2017
50.6%
66.5%
Worse
Community
Health
Needs
Assessment
% Diculty
accessing healthcare
past year
2017
43.5%
35%
Worse
Community
Health
Needs
Assessment
% Diculty Geng
Appointment past
year
2017
20.4%
15.4%
Worse
Community
Health
Needs
Assessment
% Diculty Finding
Physician past year
2017
14%
8.7%
Worse
Community
Health
Needs
Assessment
% Transportaon
Hindered Doctors
Visit past year
2017
9.3%
5%
Worse
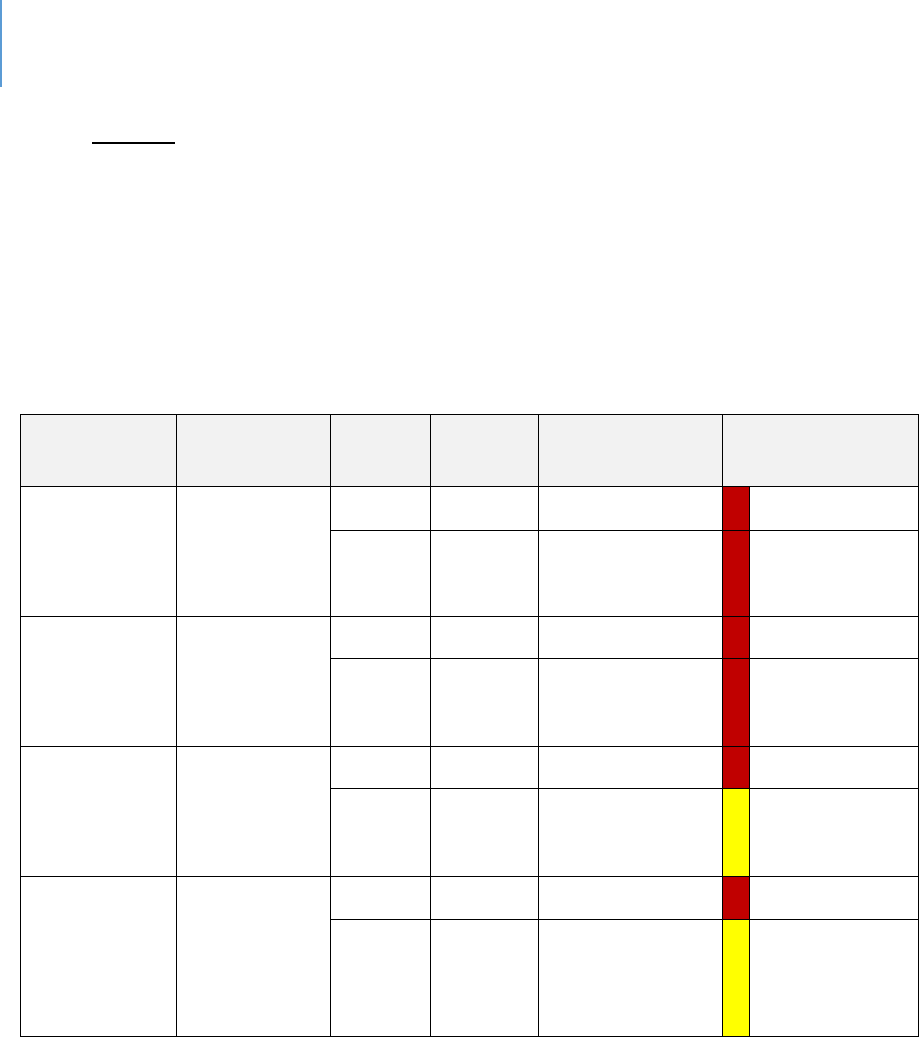
DRAFT Lee County Human Services Gap Analysis
Secon One: Quantave Data
Chapter 3 | Behavioral Outcomes Page | 53
Facilies. Table 14 reports data on comparave facility capacity. As shown in the table,
Lee County falls below the state average on a variety of treatment or care beds. This
can be aributed in part to the high growth rate of Lee County. In fast growing
counes, it is dicult for the service infrastructure to keep up as it takes longer to build
the facilies than it does to grow the populaon. The impact of this data on behavioral
outcomes is that it may be dicult to access services.
Table 14. Facilities
Source
Data Title
Year
Lee
County
State
Comparison
Health
Resources
Availability
Total
Hospital
Beds Rate
Per 100,000
2017
259.55
312.3
Worse
2108
260.6
308.2
Worse
Health
Resources
Availability
Total Acute
Care Beds
Rate Per
100,000
2017
207.61
253.5
Worse
2018
201.8
248.9
Worse
Health
Resources
Availability
Total
Specialty
Beds Rate
Per 100,000
2017
51.94
58.8
Worse
2018
58.8
59.2
Within 10%
average
Health
Resources
Availability
Total
Nursing
Home Beds
Rate Per
100,000
2017
318.19
407.6
Worse
2018
393.2
399.8
Within 10%
average
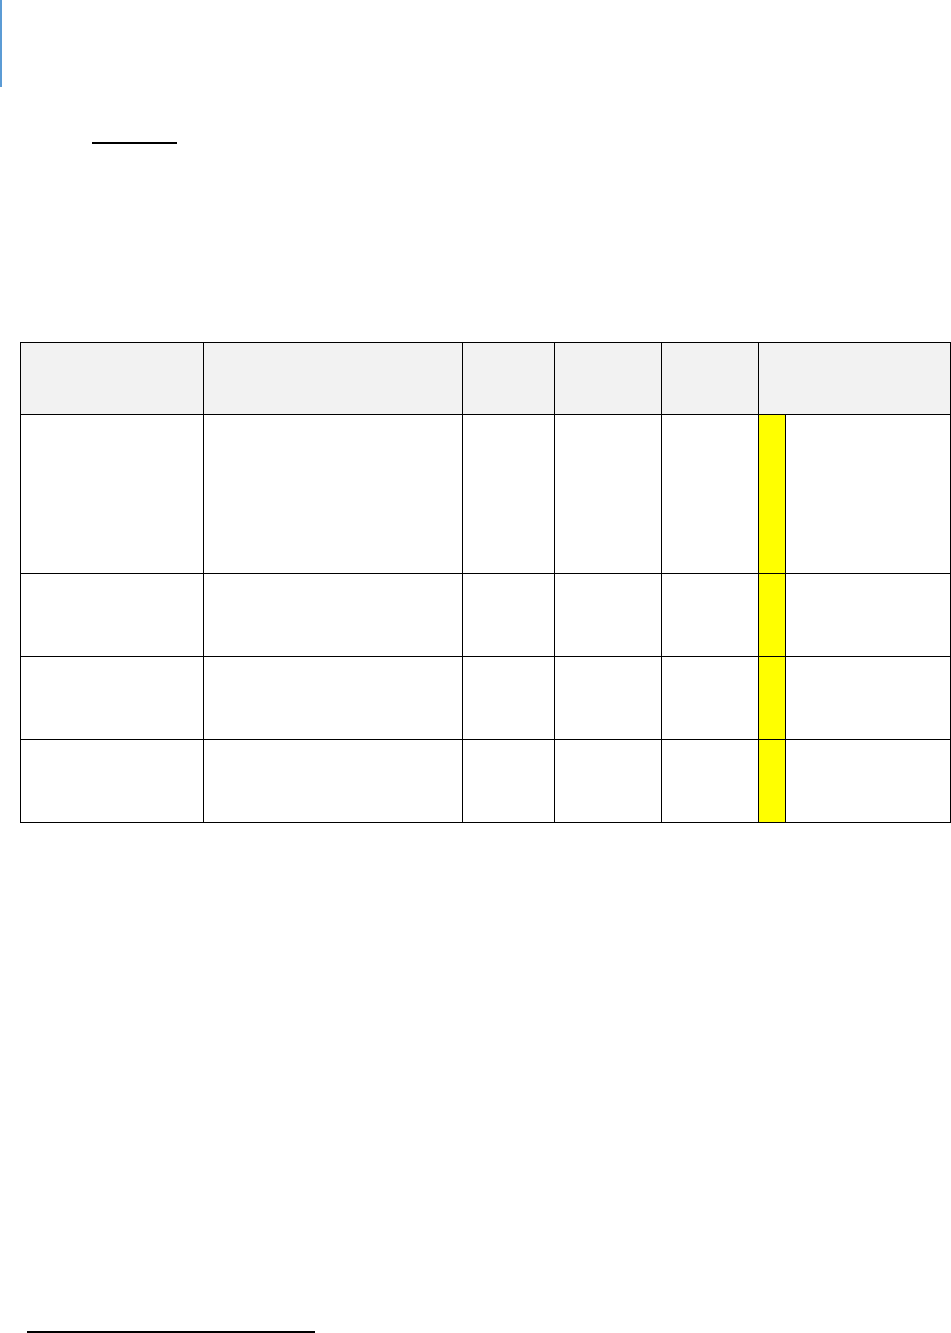
DRAFT Lee County Human Services Gap Analysis
Secon One: Quantave Data
Chapter 3 | Behavioral Outcomes Page | 54
Housing. Table 15 compares housing in Lee County with the State. As the table
indicates, the County faces the same housing challenges as the rest of the State. This
data can impact behavior due to the stresses that occur from being cost-burdened or
living in sub-standard, or crowded, housing.
Table 15. Comparative Housing Data
Source
Data Title
Year
Lee
County
State
Comparison
Health Equity
Prole
Renter-occupied
households with gross
rent cosng 30% or
more of household
income
2013-
17
52%
57%
Within 10%
average
Health Equity
Prole
Severe housing
problems
2015
18.5%
20.8%
Within 10%
average
US Census –
Quick Facts
40
Owner-occupied
housing unit rate
2013-
17
69.8%
64.8%
Within 10%
average
US Census –
Quick Facts
Median gross rent
2013-
17
$1035
$1077
Within 10%
average
40
US Census – Quick Facts: https://www.census.gov/quickfacts/leecountyflorida
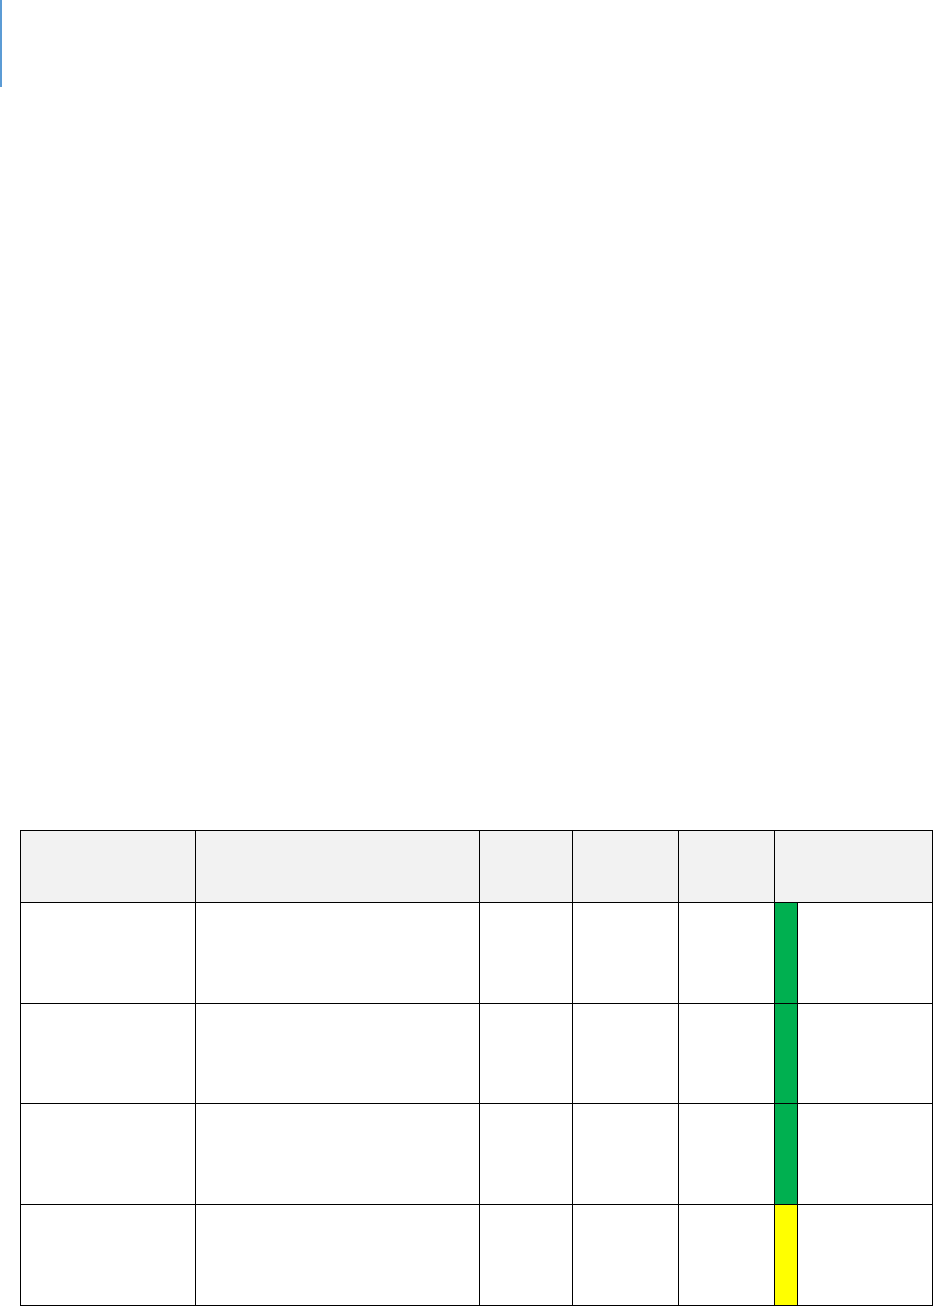
DRAFT Lee County Human Services Gap Analysis
Secon One: Quantave Data
Chapter 3 | Behavioral Outcomes Page | 55
Children and Youth
This secon addresses a variety of outcomes related to children and youth. It follows
the same color-coding as prior tables.
Table 16 presents data about a variety of birth factors. As with other tables, Lee County
has a mix of beer and worse indicators when compared to State of Florida averages.
Table 17 presents data on various health outcomes. Health outcomes are like the State.
Table 18 presents data regarding violence outcomes. In these cases, outcomes for
youth in Lee County are consistently worse than the State average.
Table 19 presents data on the status of foster care in the County. Lee County youth are
in foster care at rates higher than the State average.
Table 20 presents data on the percentage of children in single-parent homes. Lee
County has a similar percentage as the State of Florida.
Table 16. Birth Data
Sources
Data Title
Year
Lee
County
State
Comparison
to State
Community
Health Needs
Assessment
Births to Teenagers
under 20
2017
6.8%
5.9%
Worse
Kids Count
Births to Mothers under
age of 20 (27th in State
in 2017)
2017
5.51%
4.83%
Worse
County Death
Data
Comparison
Infant Mortality Rate Per
1,000 live Births Per
100,000 Total Populaon
2107
5.2
6.1
Lower
Kids Count
Low-birthweight babies
2017
8.0%
8.8%
Within
10%
average
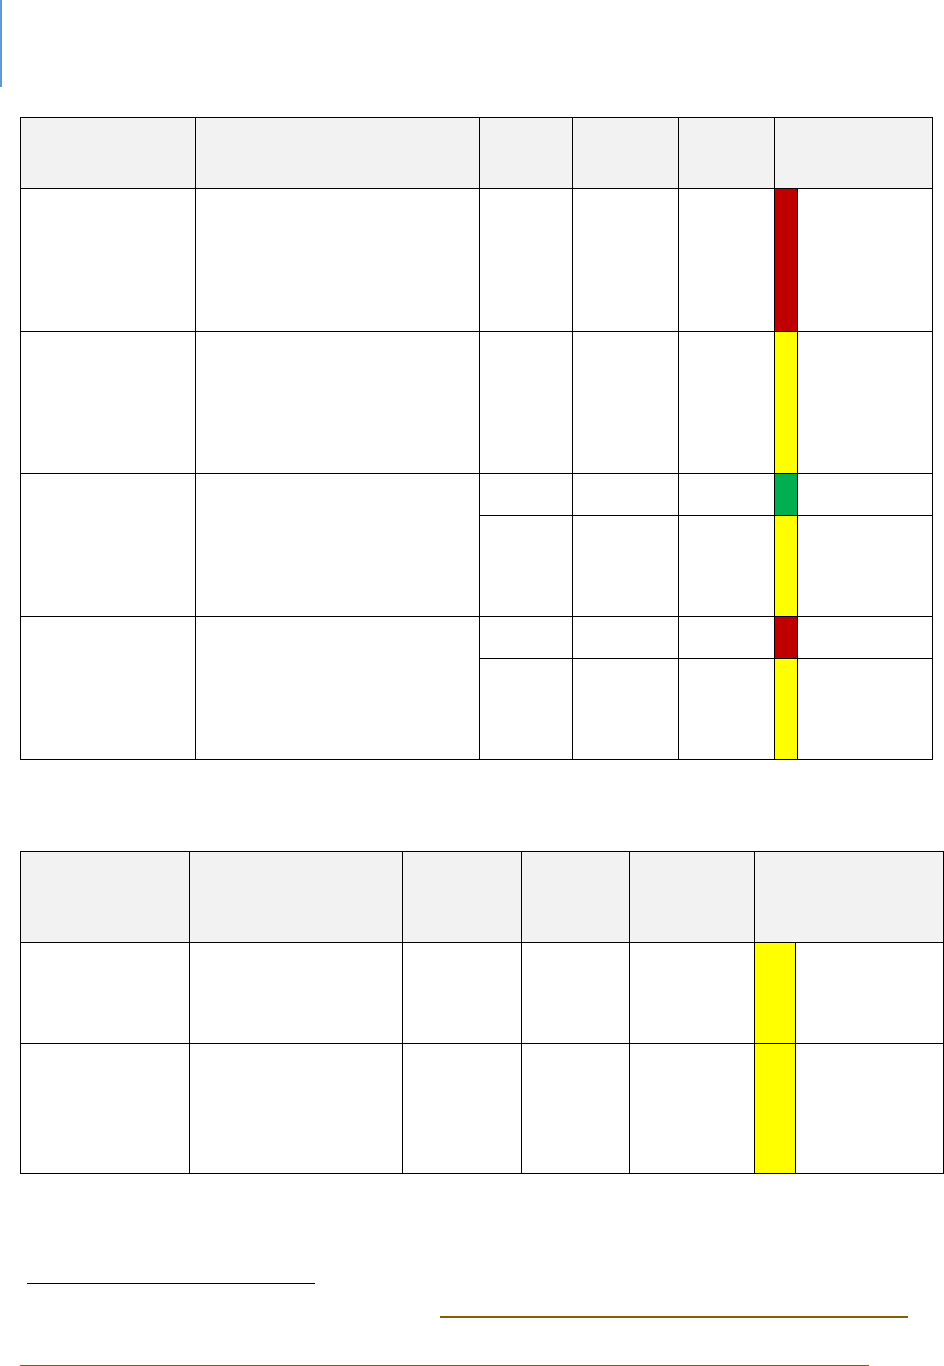
DRAFT Lee County Human Services Gap Analysis
Secon One: Quantave Data
Chapter 3 | Behavioral Outcomes Page | 56
Sources
Data Title
Year
Lee
County
State
Comparison
to State
Community
Health Needs
Assessment
No Prenatal Care First
Trimester
2017
36.6%
28.3%
Worse
County Birth
Data
Comparison
Births with Adequate
Prenatal Care
(Kotelchuck index)
2015-
17
73.8%
70.5%
Within
10%
average
Florida
Health
41
Resident Infant Deaths
(Rate per 1000)
2017
5.2
6.1
Beer
2018
5.9
6
Within
10%
average
Florida Health
Resident Fetal Deaths
(Rate per 1000)
2017
7.9
6.9
Worse
2018
7.2
6.7
Within
10%
average
Table 17. Health Indicators for Children and Youth
Sources
Data Title
Year
Lee
County
State
Comparison to
State
Kids Count
Immunizaon
Levels in
Kindergarten
2006-18
94.10%
93.70%
Within
10%
average
WIC Children
42
Obesity (WIC
children >=2 who
are overweight or
obese)
2018
28.95%
27.10%
Within
10%
average
41
FL Health Charts, Infant Deaths and Fetal Deaths, http://www.flhealthcharts.com/charts/SearchResult.aspx
42
FL Health Chats, WIC Children,
http://www.flhealthcharts.com/charts/OtherIndicators/NonVitalIndRateOnlyDataViewer.aspx?cid=0679
DRAFT Lee County Human Services Gap Analysis
Secon One: Quantave Data
Chapter 3 | Behavioral Outcomes Page | 57
Sources
Data Title
Year
Lee
County
State
Comparison to
State
Child Health
Status
Percent of middle
school students
without sucient
vigorous physical
acvity
2016
78.5%
78.3%
Within
10%
average
Kids Count
Overweight &
obese 1st, 3rd
and 6th grade
students
2016/17
33.6%
34.3%
Within
10%
average
Healthiest
Weight
Prole
Middle and high
school students
who are
overweight
2016
15.3%
16.3%
Within
10%
average
Child Health
Status
High School
students who are
underweight
2016
4.7%
3.6%
Worse
Child Health
Status
Percent of high
school students
without sucient
vigorous physical
acvity
2016
79.3%
80.6%
Within
10%
average
Child Health
Status
Percent of high
school students
without sucient
vigorous physical
acvity
2016
79.3%
80.6%
Within
10%
average
School Age
Child
Adolescent
Prole
Children ages 0-
17 without health
insurance
2012-16
10.9%
8.9%
Worse
DRAFT Lee County Human Services Gap Analysis
Secon One: Quantave Data
Chapter 3 | Behavioral Outcomes Page | 58
Table 18. Violence Outcomes regarding Children and Youth
Sources
Data Title
Year
Lee
County
State
Comparison
to State
Child
Health
Status
Children experiencing
sexual violence ages 5-
11 Per 100,000
populaon
2015-17
73.5
59.8
Worse
Child
Health
Status
Arrests, All Oenses by
County, Youth Ages 10-
17 Per 100,000
populaon
2014-16
4473.1
4028.3
Worse
Child
Health
Status
Referrals to Department
of Juvenile Jusce Per
100,000 populaon
2017
3888.3
3479.3
Worse
Kids Count
Youth contacts with the
juvenile jusce system
2017/18
16.8%
16.4%
Within 10%
average
Child
Health
Status
Homicide deaths 12-18
Per 100,000 populaon
2015-17
9.3
5.4
Worse
Child
Health
Status
Homicide deaths 19-21
Per 100,000 populaon
2015-17
19.3
13.7
Worse
DRAFT Lee County Human Services Gap Analysis
Secon One: Quantave Data
Chapter 3 | Behavioral Outcomes Page | 59
Table 19. Foster Care Outcomes
Sources
Data Title
Year
Lee
County
State
Comparison
to State
School Age Child
Adolescent Prole
Children in foster
care ages 5-11 Per
100,000
2017
563.4
413.7
Worse
Child Health
Status
Children under 18
in Foster Care Per
100,000
populaon
2017
708.3
537.7
Worse
Census -
American
Community
Survey
Independent Living
Diculty Perc - 18
to 24
2013-
2017
2.80%
2.30%
Worse
MyFLFamilies.com
Chart - Young
Adults Aging out
with Educaonal
Achievement (also
see link)
2007-
19
90.91%
88.55%
Within
10%
average
Table 20. Home Status of Children and Youth
Sources
Data Title
Year
Lee
County
State
Comparison
to State
Child
Health
Status
Children under 18 in
single-parent households
2013-
17
39.4%
38.1%
Within
10%
average

DRAFT Lee County Human Services Gap Analysis
Secon One: Quantave Data
Chapter 3 | Behavioral Outcomes Page | 60
Conclusion
From the broader perspecve of aggregated data, Lee County behavioral outcomes are
in the top quarle of the State. As would be true for any other County, whether in the
top quarle or not, there is variaon within the specic outcome level. Every County in
the top quarle will have a mix of “beer, same or worse” indicators. There is always
room for improvement, even for those behaviors where the rates are “beer”.
Within this context, there are specic indicators that warrant further invesgaon and
aenon. Invesgaon is needed because even though none of these indicators should
be viewed as the nal word, they should be considered as signals for concern. For Lee
County, the signals that warrant further examinaon include:
Alcohol-related Behaviors. Among both adults and youth there are higher rates
of problematic alcohol-related behavior reported for the County. The Drug Free
Coalition 2019 Needs Assessment discusses this topic in some detail and offers
several explanatory factors as well as strategies. It should form the basis for
further community conversation and action.
Suicide, particularly Youth Suicide. Existing data indicates higher rates in Lee
County. This data should be more thoroughly investigated to ensure these are
not reporting anomalies and do indeed represent an issue of concern for the
community. If accurate, community strategy and action is warranted.
Youth Violence. Rates of homicide and sexual violence among youth are higher
in Lee County. As with Youth Suicide, this data should be more thoroughly
investigated to ensure these are not reporting anomalies and do indeed
represent an issue of concern for the community. If accurate, community
strategy and action is warranted.

DRAFT Lee County Human Services Gap Analysis
Secon One: Quantave Data
Chapter 3 | Behavioral Outcomes Page | 61
Impacng Populaon Outcomes: A case study
Introducon
The goal of any intervenon is change toward more construcve, producve and
healthier behaviors and atudes. It is a common assumpon that increased funding
will increase the likelihood of moving a selected outcome in a desired direcon. In
Florida, data exists that allows this assumpon to be tested.
Eight Florida counes have independent taxing districts that provide funds for services
for children 18 and younger. These funds are not to replace K-12 educaon funds, but
rather to provide for services not available through public educaon sources. These
counes have used these resources to provide a variety of services including early
childhood educaon, parenng educaon, youth intervenon programs for a variety of
risk-behaviors, children’s mental health and other programs that would benet children
and youth. Without doubt, numerous children have beneted personally from these
programs and services. Two counes (Duval and Manatee) have dependent districts,
meaning that these fall under the Board of County Commissioners.
The queson here, however, is not whether children have beneed, but rather if these
investments have been suciently powerful that populaon-level behaviors have
changed. More specically, how do outcomes and key indicators in these counes
compare to Lee? The hypothesis that this analysis will test is presented below.
The Hypothesis
Populaon level child wellbeing and certain behavioral outcomes in Florida counes
with Children Service Councils (CSC) will be consistently beer than in Lee County
(which does not have a special taxing district for children’s programs).
DRAFT Lee County Human Services Gap Analysis
Secon One: Quantave Data
Chapter 3 | Behavioral Outcomes Page | 62
Methodology
The Florida Child Well-Being Index was used as the data source for this analysis.
Appendix H describes the components and sources for the index that can be found at
hp://oridakidscount.org/.
The Data
Tables 21 to 24 provide the data that will be used to test this hypothesis. The database
for this analysis was Kids Count data -- the largest and most widely used database for
populaon stascs about children. Data are reported annually as a Child Well-Being
Index. It includes relevant socio-economic indicators that impact the wellbeing of
children as well as behavioral outcomes.
Ranked Comparisons
Table 21 idenes the top ten counes in Florida using the overall Kids Count ranking
averaged across the most recent three years. One of these, Marn, has an independent
Children’s Services Council (CSC). The remaining counes do not have a CSC.
Table 21. Overall Child Wellbeing Rankings: Top 10 Counties 3-Year Average
43
County
2019
2018
2017
Rank of 67 Counes
3-Year Average
Saint Johns
1
1
3
1.7
Okaloosa
3
2
4
3.0
Sarasota
5
4
1
3.3
Nassau
6
3
2
3.7
Santa Rosa
2
6
8
5.3
Marn
8
8
5
7.0
Clay
12
5
6
7.7
Brevard
14
9
12
11.7
Wakulla
7
16
19
14.0
Leon
16
10
18
14.7
43
http://floridakidscount.org/docs/2019Index/2019-cwbi.pdf
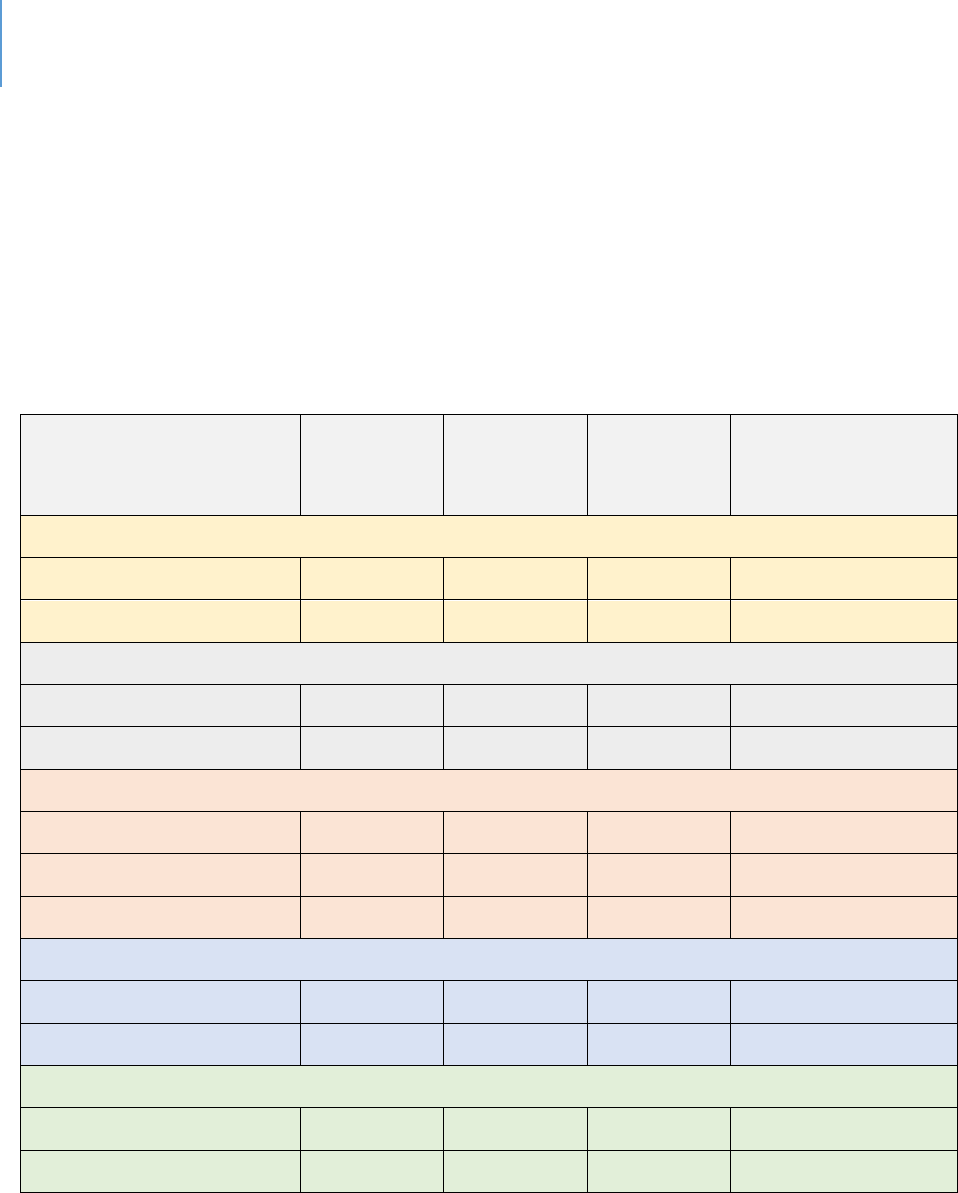
DRAFT Lee County Human Services Gap Analysis
Secon One: Quantave Data
Chapter 3 | Behavioral Outcomes Page | 63
Table 22 reports the overall CSC county rankings from one being best to 67 being worst
compared to Lee County. Consistent with normal data analysis, the best and worst
outliers were removed but are shown at the boom of the table. Four clusters were
then determined based on the criterion of being ve points or less from each other. Lee
County ranks in cluster three along with Hillsborough and Pinellas. As the table shows,
aer removing outliers, four CSC counes have a higher ranking on overall child-
wellbeing than Lee.
Table 22. Comparison of Overall CSC Counties and Lee County Ranks on Child Wellbeing
County
2019
2018
2017
Rank of 67
Counes
3-Year Average
Cluster One
Palm Beach
10
13
27
16.7
Broward
18
19
23
20.0
Cluster Two
Manatee*
27
28
20
25.0
St Lucie
37
40
10
29.0
Cluster Three
Hillsborough
28
35
40
34.3
Pinellas
29
45
32
35.3
Lee**
42
36
37
38.3
Cluster Four
Duval*
48
43
51
47.3
Miami-Dade
44
46
56
48.7
Outliers
Marn
8
8
5
7.0
Okeechobee
59
59
65
61.0
*Dependent CSCs
** No CSC
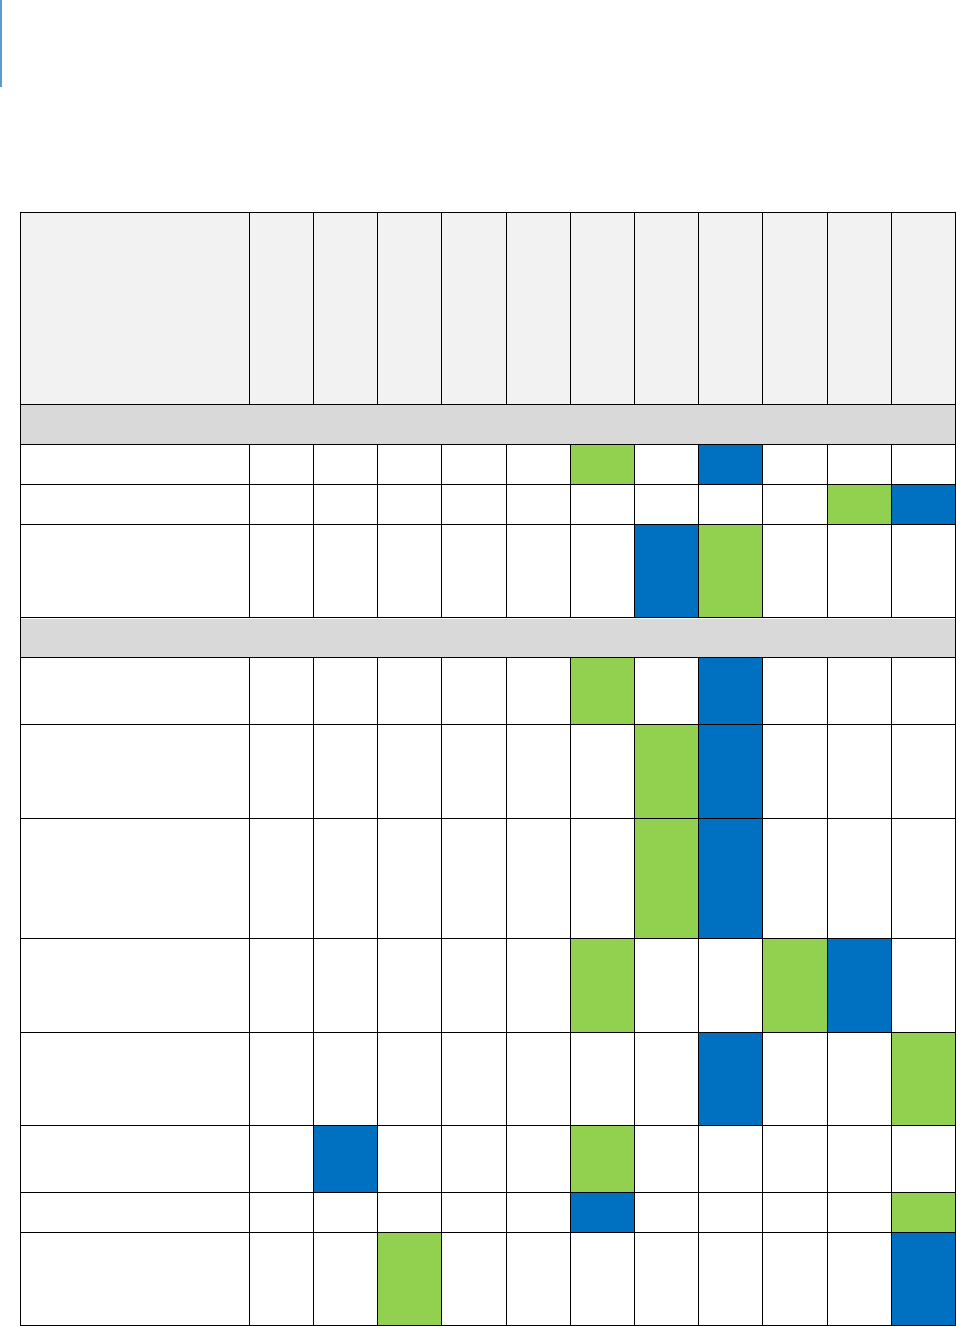
DRAFT Lee County Human Services Gap Analysis
Secon One: Quantave Data
Chapter 3 | Behavioral Outcomes Page | 64
Table 23 provides a more detailed view of the rankings on specic metrics.
Table 23. County Rankings on Specific Child Wellbeing Variables
BROWARD
DUVAL
HILLSBOROUGH
LEE
MANATEE
MARTIN
MIAMI
-DADE
OKEECHOBEE
PALM BEACH
PINELLAS
ST. LUCIE
Economic Variables
Children in poverty
5
10
8
7
3
1
9
11
2
4
6
Unemployment rate
2
6
3
3
3
4
2
7
5
1
8
High housing cost-
burden (>30%
income spent)
10
5
6
4
3
2
11
1
9
7
8
Intervenons
Teens not in school
and not working
4
10
5
8
9
1
6
11
3
7
2
3 & 4-year-old
children not enrolled
in school
2
6
7
10
9
4
1
11
3
5
8
4th grade students
not procient in
English Language
Arts
2
7
4
6
3
5
1
9
2
5
8
8th grade students
not procient in
math
3
8
8
2
6
1
5
4
1
9
7
High school students
not graduang on
me
8
7
5
9
6
2
6
10
3
4
1
Low-birthweight
babies
9
10
8
3
2
1
4
8
5
7
6
Uninsured children
6
2
4
8
5
10
3
9
7
2
1
Overweight and
obese 1st, 3rd & 6th
grade students
3
4
1
7
2
6
10
9
8
5
11
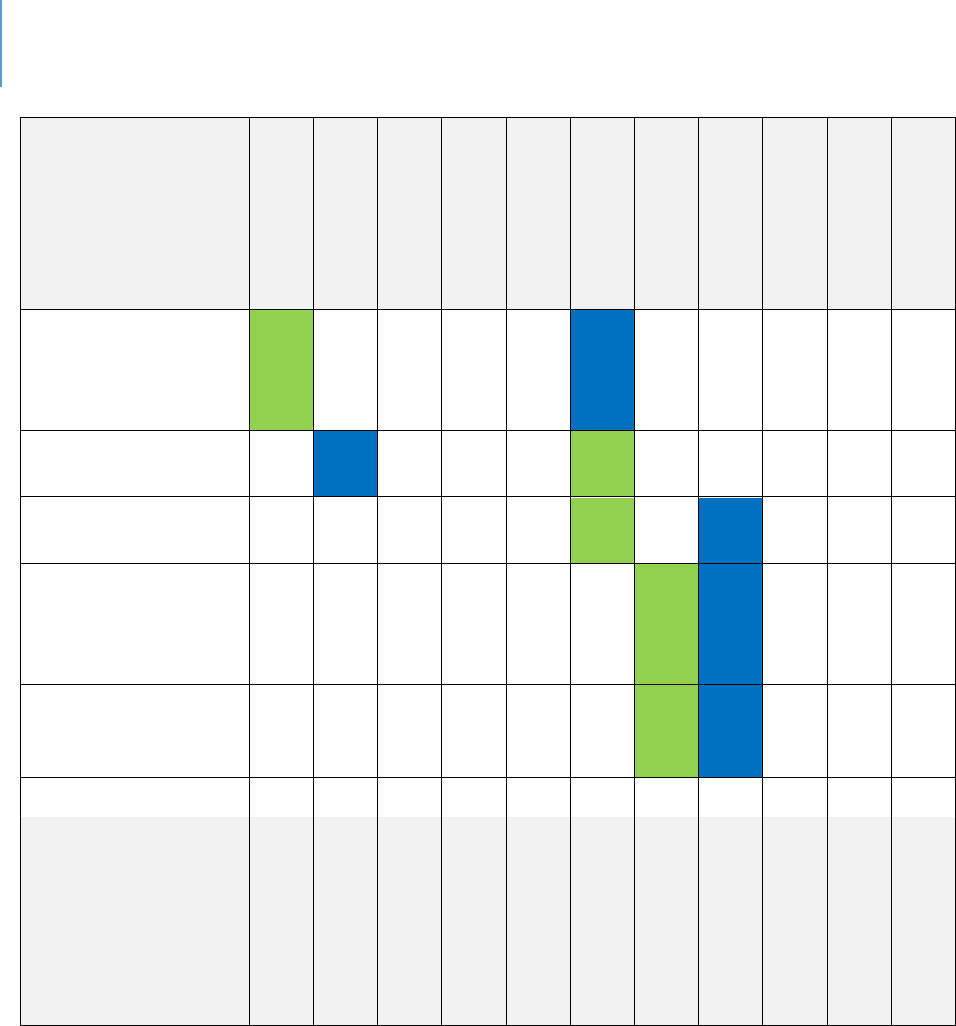
DRAFT Lee County Human Services Gap Analysis
Secon One: Quantave Data
Chapter 3 | Behavioral Outcomes Page | 65
BROWARD
DUVAL
HILLSBOROUGH
LEE
MANATEE
MARTIN
MIAMI
-DADE
OKEECHOBEE
PALM BEACH
PINELLAS
ST. LUCIE
High school teens
who used
alcohol/drugs (past
30 days)
1
2
3
8
7
11
5
9
6
4
10
Children in single
parent families
6
11
8
9
4
1
10
2
3
7
5
Children living in
high poverty areas
3
8
7
6
8
1
9
10
5
2
4
Children with
veried
maltreatment (per
1,000)
7
8
5
3
9
6
1
11
2
10
4
Youth contacts with
the juvenile jusce
system (per 1,000)
2
3
7
6
10
5
1
11
4
8
9
AVERAGES
4.3
6.6
5.5
6.5
6.2
4.2
4.8
8.8
4.0
5.8
5.8
BROWARD
DUVAL
HILLSBOROUGH
LEE
MANATEE
MARTIN
MIAMI
-DADE
OKEECHOBEE
PALM BEACH
PINELLAS
ST. LUCIE
Note: If the same value was reported, then the comparisons repeat ranking number (a e).
Green = Highest ranking of the group
Blue = Lowest ranking of the group
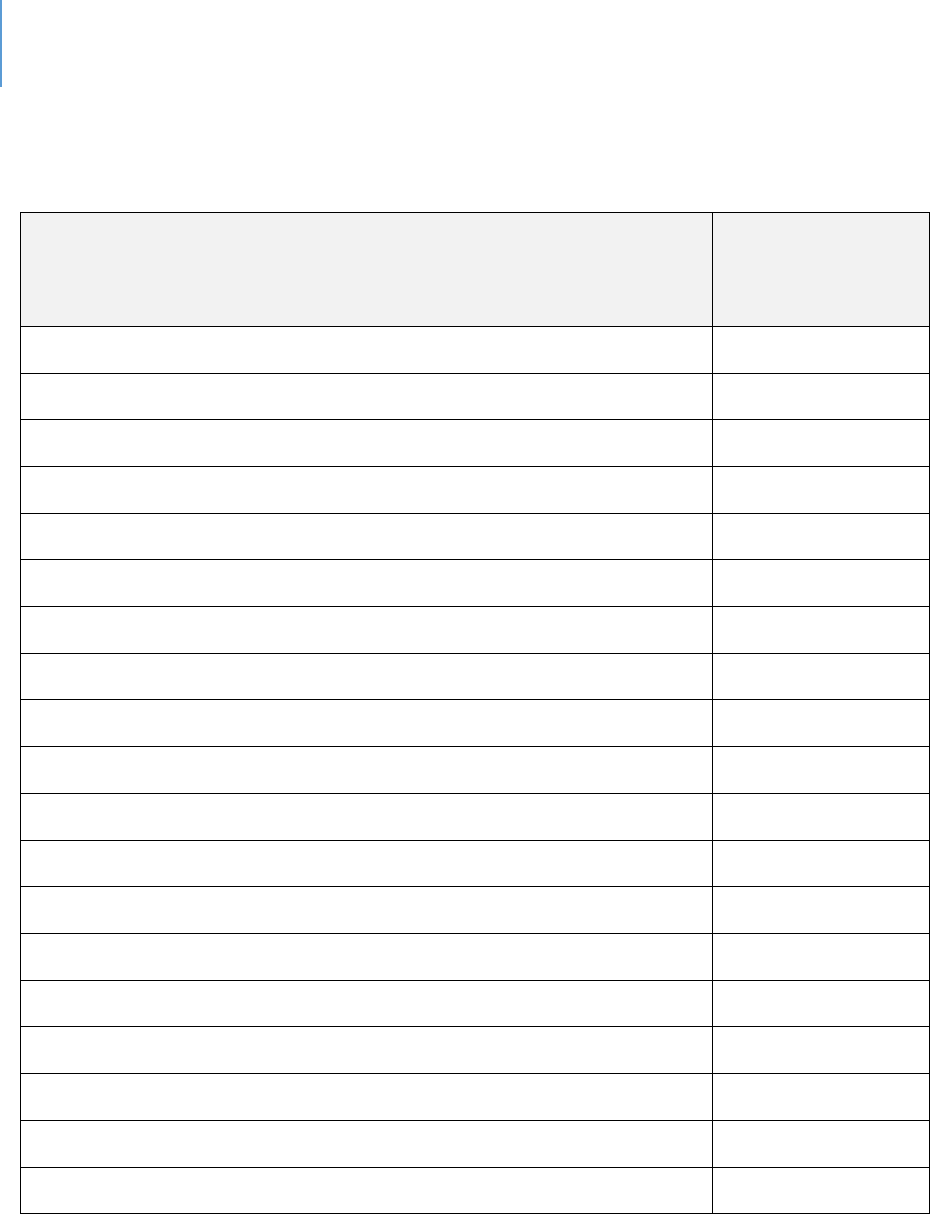
DRAFT Lee County Human Services Gap Analysis
Secon One: Quantave Data
Chapter 3 | Behavioral Outcomes Page | 66
Table 24 breaks out the specic Lee County rankings solely for ease of reference.
Table 24. Ranked Comparison Results for Lee County on Specific Kids Count Metrics
Metric
Lee County Rank:
1=highest,
11=lowest
Economic Variables
Children in Poverty
7
Unemployment
3
Housing Cost Burden
4
Intervenons
Teens not in school and not working
8
3 & 4-year-old children not in school
10
4th grade students not procient in English Arts
6
8th grade students not procient in math
2
High school students not graduang on me
9
Low birthweight babies
3
Uninsured children
8
Overweight & Obese, 1st, 3rd and 6th grades
7
High school teens who used alcohol/drugs last 30 days
8
Children in single-parent families
9
Children living in high poverty areas
6
Children with veried maltreatment (per 1000)
3
Youth contacts with Juvenile Jusce system (per 1,000)
6
Average Rank
6.5

DRAFT Lee County Human Services Gap Analysis
Secon One: Quantave Data
Chapter 3 | Behavioral Outcomes Page | 67
Table 24 is divided into two secons. The rst secon reports comparave economic
variables. Because these are outside of the mission of a CSC, they are not used for
comparave purposes but are legimate potenal explanatory variables. The second
secon is tled intervenons because each of these metrics could be addressed
through a program or service. Investments in these programmac areas would be
expected to yield some impact.
Among the 11 counes being compared, Lee’s average rank is 6.5. There are two low
rankings that skew the ranking. Lee is 10
th
among the comparison counes on 3-and 4-
year-old children not being school. The other variable that clearly impacts this is the
fact that Lee County is ranked ninth in terms of high school students not graduang on
me.
As the data in Tables 21 to 24 indicate, the CSC counes are not consistently superior to
Lee County in outcomes and key indicators of child wellbeing. In fact on the overall Kids
Count score, Lee is exceeded substanvely only by ve of the 10 counes with CSCs. On
certain outcomes, some exceed Lee, while on those same outcomes Lee exceeds
others.
Comparison of Averages
A problem with ranked comparison is that a small dierence, for example a tenth of a
point, results in one county being ranked higher or lower than another. Given the
vagaries of data collecon, the two counes are more likely equal. Therefore, a ranking
can be misleading.
An alternave is to consider average scores. An average score can also mislead if there
are substanve outliers. For example, calculang average salary is misleading if 99 of
100 people make $50,000 or less but one person makes $2 million. Because the Kids
Count data does not have such signicant outliers, an average score would result in an
accurate comparison.
Table 25 reports three average scores on the Kids Count variables. The State, Lee
County and the average score of the CSC counes as equal units. Scores were not
calculated based on populaon, as the unit of measure here is the county itself.

DRAFT Lee County Human Services Gap Analysis
Secon One: Quantave Data
Chapter 3 | Behavioral Outcomes Page | 68
To increase the reliability of the data, the averages are based on the number of years of
reported data in the Kids Count reports, which range from three years to six years.
These varying years (by metric) were averaged to smooth the data. The one anomaly
from this approach is that the average unemployment rate covered the years 2010 to
2019. As such, it is much higher than today’s rate. However, it is sll a legimate
comparison across the three comparison units.
Using the same methodology as with prior tables, scores within a 10% range of the
State or CSC average are considered equivalent to account for data collecon error.
Applying this standard to Table 25, Lee County is equal to either the CSC counes and
State averages in all cases except for three which are coded “Green” for beer than
average or “Red” for worse than average.
As reported in Table 25, there is a higher percentage of 3-and 4-year-old children not in
school in Lee County compared to averages. An interesng observaon is that by the
fourth grade County students are equivalent to the rest on the state on prociency in
English Arts and by the eighth grade in prociency in math. This data can be
interpreted to mean that the quality of elementary educaon is sucient to help these
students catch up to their peers or the impact of early schooling does not provide any
lasng advantage.
Other signicant data in Table 25 is percentage of children living in high poverty areas
and the percentage being maltreated are lower (more than 10%) than the CSC or state
averages. These data support a theory, discussed later in this chapter, that
neighborhoods or where one lives signicantly impacts a child’s wellbeing and future
development.
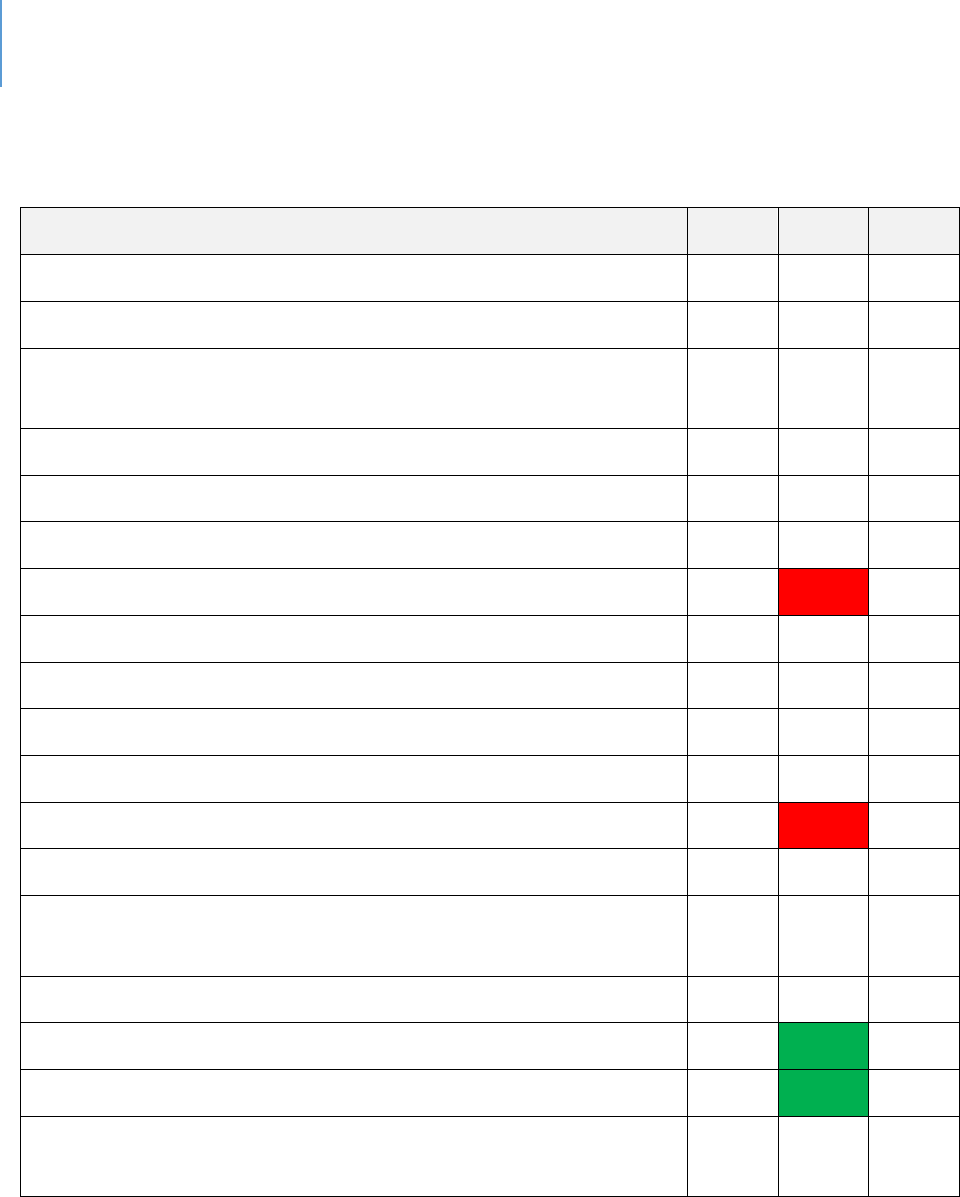
DRAFT Lee County Human Services Gap Analysis
Secon One: Quantave Data
Chapter 3 | Behavioral Outcomes Page | 69
Table 25. Comparison of Average County Scores
(Child Well-being Indexes from 2017, 2018, and 2019)
Metric
CSC
Lee
State
Economic Variables
Percentage of Children in Poverty
23.33
22.52
22.54
Percentage of Households (Owners or Renters) with Housing
Cost Burden
39.97
37.08
39.58
Unemployment Rate
7.12
7.28
6.98
Intervenons
Percentage of Teens not in school and not working
8.96
8.67
8.47
Percentage of 3 & 4-year-old children not in school
50.25
57.53
49.30
Percentage of 4th grade students not procient in English Arts
73.85
74.00
72.00
Percentage of 8th grade students not procient in math
80.78
78.50
79.50
Percentage of High school students not graduang on me
20.19
22.82
19.70
Percentage of births that are Low birthweight babies
8.55
7.96
8.70
Percentage of Uninsured children
11.81
13.52
8.82
Percentage of Overweight & Obese, 1st, 3rd and 6th grades
35.44
32.97
28.97
Percentage of High school teens who used alcohol/drugs last 30
days
37.17
36.64
36.54
Percentage of Children in single-parent families
35.35
36.50
34.98
Percentage of Children living in high poverty areas
13.76
10.58
12.93
Number of Children with veried maltreatment (per 1000)
9.87
7.68
8.63
Number of Youth contacts with Juvenile Jusce system (per
1,000)
25.78
25.78
25.52
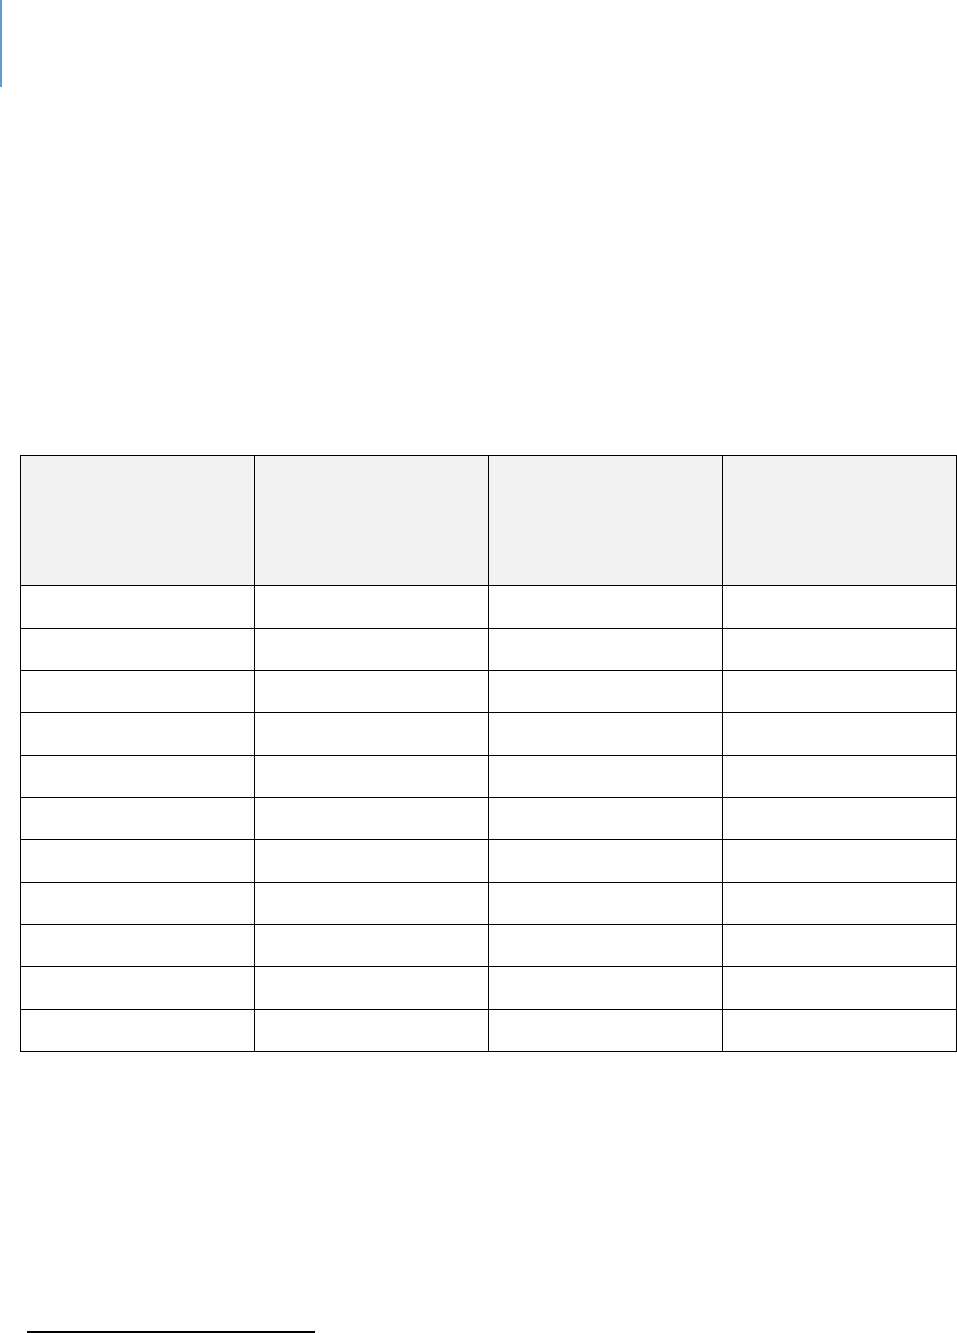
DRAFT Lee County Human Services Gap Analysis
Secon One: Quantave Data
Chapter 3 | Behavioral Outcomes Page | 70
CSC Funding
The hypothesis being tested is that child wellbeing in Lee County will be worse when
compared to that of the CSC counes who have a dedicated funding source for
children’s services. Table 26 summarizes the funding of the independent and
dependent CSCs. The table reports the total funding for the past ve years, the
number of children in each county under 18 and an annualized average per capita (child
under 18) investment.
Table 26. CSC Funding and Per Capita (Youth)
County
Total CSC Funding
Last Five Years*
Number of Children
18 and Younger
44
Annualized Per
capita ((Five Year
Funding/5)/total
number)
Broward
$415,003,533
412,226
$201
Duval (Jacksonville)
$143,399,420
214,790
$134
Hillsborough
$194,812,891
323,828
$120
Manatee
$54,587,889
72,457
$151
Marn
$36,182,349
26,502
$273
Miami-Dade
$615,231,848
558,719
$220
Okeechobee
$3,419,162
8,872
$77
Palm Beach
$565,392,516
283,443
$399
Pinellas
$330,882,227
157,685
$420
St. Lucie
$44,225,976
63,151
$140
TOTALS
$2,403,137,811
2,121,673
$227
44
American Community Survey, B09001. 2018 1-Year Estimates

DRAFT Lee County Human Services Gap Analysis
Secon One: Quantave Data
Chapter 3 | Behavioral Outcomes Page | 71
Conclusion regarding the Hypothesis
The hypothesis is rejected. Child wellbeing and certain behavioral outcomes in the CSC
counes are not comprehensively or consistently beer than those in Lee County.
There are excepons for both beer and worse specic outcomes as reported above.
Understanding the Conclusion
Why does Lee County have comparable rangs? As Table 26 shows, these counes as a
group during the past ve years have invested roughly $2.4 billion in children services.
This is around $480 million annually. These are signicant investments from anyone’s
perspecve. On a per capita basis, the annual investment averages $227 per child as
shown in Table 26.
Potenal Explanaons
Discussed below are several alternave explanaons for the fact that child wellbeing
and behavioral outcomes in Lee County are comparable to the CSC counes despite the
lack of an independent taxing district.
Lee has invested just as much, just through programs under the Board of County
Commissioners.
This explanaon would contend that Lee County has made a similar level of
investment, just through its own departments. It is true that the County
provides several such services that benet children and youth. However, just as
the Lee Board of County Commissioners make investments in recreaon,
libraries and human services, so do the County Commissions where these CSC’s
are located. We cannot then conclude that Lee County is just funding children
services via a dierent funding stream and that would explain why the outcomes
in Lee are like those of other counes.

DRAFT Lee County Human Services Gap Analysis
Secon One: Quantave Data
Chapter 3 | Behavioral Outcomes Page | 72
Children and Youth in Lee County do not face the same challenges as the youth in these
more urbanized counes.
First, neither St. Lucie, Marn or Manatee counes are more urbanized than Lee
County. Second, as various tables presented earlier show, children and youth in
Lee County have both beer and worse behavioral outcomes compared to state
averages. While one would hope the explanaon to be true, it is implausible.
Poverty is less of an issue in Lee County compared to these other counes.
Table 27 shows the poverty rates for the CSC counes and the percentage of
renters who are cost-burdened. This laer data is important because cost-
burdened households are under more stress and can be less stable. If poverty
levels were lower in Lee County, one conclusion could be that it would be more
eecve in Lee County to focus on connued eorts to reduce poverty. These
poverty reducon eorts might be more eecve than service programs.
However, as the table indicates, child poverty in Lee County is beer than some
of the CSC counes and worse than others. Poverty is not an explanatory
variable.
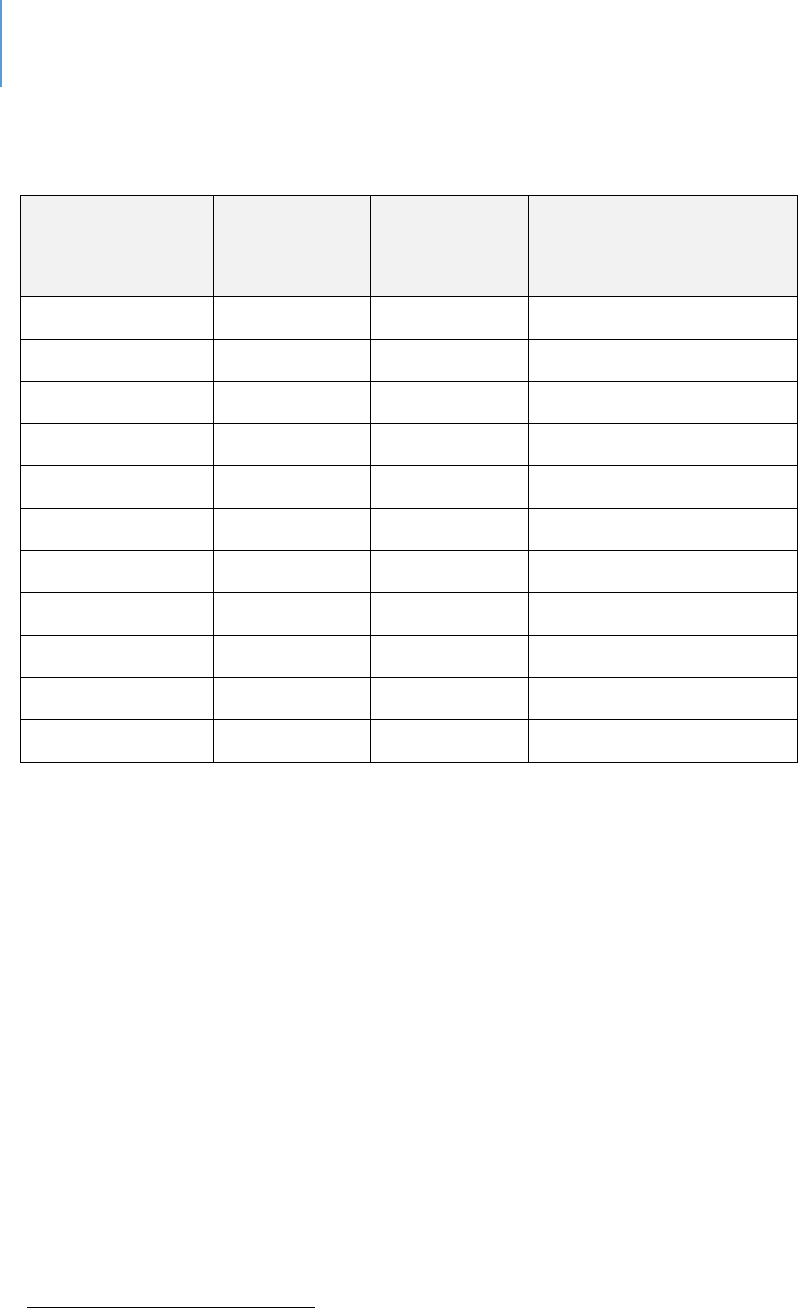
DRAFT Lee County Human Services Gap Analysis
Secon One: Quantave Data
Chapter 3 | Behavioral Outcomes Page | 73
Table 27. Poverty
45
County
Overall
Poverty
Rate
Child
Poverty
Rate
% of Owner or Renter
Cost-Burdened
46
Lee
11.8%
20.4%
33.0%
Broward
13.1%
18.0%
43.5%
Duval
15.1%
23.0%
34.9%
Hillsborough
15.5%
21.4%
35.1%
Manatee
10.8%
17.0%
31.9%
Marn
10.9%
16.7%
31.8%
Miami-Dade
16.7%
22.0%
48.5%
Okeechobee
21.8%
31.1%
25.3%
Palm Beach
11.8%
16.8%
39.1%
Pinellas
12.2%
17.2%
35.3%
St. Lucie
12.8%
19.1%
36.2%
Programmac intervenons by themselves have minimal long-term impact.
In this analysis, as well as many other data sources, professionals in the eld have
emphasized the need for housing, employment, transportaon and in-home services.
Any intervenon that does not have these types of supports (oen called wrap-around
care) has one key aw. Without these services, the individual is highly likely to return to
his or her home community. In doing so they return to their peer networks, their
physical environment and their network of drug suppliers, alcohol sources and overall
opportunies for some illegal acon. In eect, they are placed back into the same
environment that allowed, encouraged or did not stop problem behavior. Any place you
are in 24/7 for the long term has much greater impact than any program of several
hours a week or for several weeks of intervenon.
45
https://www.census.gov/programs-surveys/saipe.html 2017.
46
U.S. Census Bureau, American Community Survey 2013-2017 5 year estimates, table B25106

DRAFT Lee County Human Services Gap Analysis
Secon One: Quantave Data
Chapter 3 | Behavioral Outcomes Page | 74
These comparison counes have the same challenges as Lee County in terms of
housing, transportaon, distressed neighborhoods, and alcohol and drug abuse. While
any stand-alone programs or services they supported could have short-term benet,
there would not be any impact at the level of populaon stascs.
Given these dynamics, this explanaon has some explanatory power. It can account for
at least some of the fact that Lee County is comparable in child outcomes to these case
comparison counes.
Disperse Allocaon of Funds
CSCs are using public funds. As such, they must respond to a variety of public needs.
This is enrely understandable and every investment they make is responding to some
legimate need.
The diculty is that the more diluted the funding, the lesser the likelihood of long-term
impact. To address the factors underlying any complex and challenging outcome
requires the following:
There must be concentrated effort. Enough funding must be provided to meet
the quality, scope and intensity of service needed to impact a population-level
outcome;
There must be sustained effort. For many of the most challenging situations
facing children, a multi-year effort is required. Programs offering several months
of service are unlikely to make any long-term impact;
One or more evidence-based practices must be used. Proven quality matters;
and
Specific interventions must be nested in a system-of-care approach. As
discussed in the explanation that stand-alone programming has minimal impact,
a system-of-care is required to affect behavior change long term. Operationally,
however, this means that there are the added costs of wrap-around services.
When all these costs are totaled, it will be a substantive investment. Any entity
is limited in the number of such investments it can make.

DRAFT Lee County Human Services Gap Analysis
Secon One: Quantave Data
Chapter 3 | Behavioral Outcomes Page | 75
Neighborhood Maers
On Table 27 it is reported that Lee County has a substanvely lower proporon of
children living in high poverty areas than the average CSC county or the State. There is
growing scienc evidence that neighborhood has a signicant impact on outcomes for
young children. Hendren found that every year a child spends in a beer neighborhood
improves their adult outcomes such as earnings, college aendance, aending more
selecve colleges and the likelihood of marriage increased while decreasing the
incidence of teenage births.
47
Chey, et.al., found that moving to a lower-poverty
neighborhood before the age of 13 increased college aendance and earning and
reduced single parenthood rates.
48
This is not to minimize the importance of families in childhood development. Other
studies have found that the correlaons between neighborhood and academic
achievement is small once family background is controlled
49
. These contrasng studies
demonstrate that mulple factors aect outcomes. Neighborhood is just one of these.
However, the fact that in Lee County there is a lower proporon of children living in
high-poverty areas certainly appears to have some impact on outcomes.
The fact that fewer children in Lee County live in high-poverty neighborhoods oers a
defensible, if paral, explanaon for Lee County’s comparavely good rankings on Child
Well-Being measures. It also oers a defensible, again if paral, explanaon for lower
rates of child mal-treatment.
Conclusion
It is important to remember that this is a discussion about populaon level behavioral
outcomes. Certainly, individual children have beneted from CSC programming. But
just as in school classes, some children benet more than others. A class in school can
be life changing for one person and very forgeable for another. The same phenomena
apply to human service intervenons of any type. The same intervenon can change
47
Hendren, N. 2016. Effects of moving to opportunity: Both statistically and social significant. NYU Furman Center.
www.nyufurman.edu
48
Chetty, R., et.al. 2016. The effects of exposure to better neighborhoods on children. The American Economic
Review. 106(4): 855-902.
49
Duncan, G. et.al. 2001. Sibling, peer, neighbor and schoolmate correlations as indicators of the importance of
context for adolescent development. Demography. 38(3): 437-447.

DRAFT Lee County Human Services Gap Analysis
Secon One: Quantave Data
Chapter 3 | Behavioral Outcomes Page | 76
one person’s life and have no impact on the next person. Just as CSCs have posive
impacts on individuals, so do recreaon programs, libraries or eorts to make a
neighborhood safer and more user-friendly.
Because CSCs are public enes and must broadly disburse funds to a variety of
legimate public needs, it is very dicult for them to concentrate and sustain funding
at a sucient level to move a behavioral outcome very far in a desired direcon. Many
other factors inuence these outcomes that are outside of the control of the CSC
(family, neighborhood, peer groups, economic condions, public safety, etc.) It may
even be unfair or unrealisc to expect the CSC to play a role in these factors.
Neighborhoods appear to be parcularly powerful if joined with other more targeted
intervenons. It is reasonable that they would be so. A child is exposed to their
neighborhood seven days a week and for hours at a me. The me devoted to any
human service intervenon is much less and intervenons are arcial no maer the
quality. Neighborhoods are natural and a child can observe a range of behavior and
make decisions from all that informaon. As good as evidence-based programs are,
they pale in both me of exposure and amount of informaon exposure.
Long-term impact on outcomes results from mulple sources. For example, a
longitudinal study of in-home services found long-term posive outcomes such as lower
rates of substance abuse among the children, lower rates of running away and fewer
arrests
50
. It can be argued it is the locaon of the service, as well as its quality, that
makes a dierence. In-home services reduce the arciality aspect and address the
family in their natural seng. Neighborhoods and in-home services are two factors.
Quality of the school system is a third factor
51
. Family and individual aributes are also
signicant factors.
That said, and individual benet acknowledged, there is sll a public duciary queson
to be considered. How legimate is it to use public funds to address an issue when the
likelihood of having a long-term impact on behavior is minimal? If funds were
50
Olds, D. et.al. 1998. Long-term effects of nurse home visitation on children’s criminal and anti-social behavior.
JAMA. 250(14): 1238-1244.
51
Slavin. Robert E., Nancy L. Karweit. and Barbara A- Wasik. 1993. "Preventing Early School
Failure: What Works?" Educational Leadership 50(4): 10-18.

DRAFT Lee County Human Services Gap Analysis
Secon One: Quantave Data
Chapter 3 | Behavioral Outcomes Page | 77
unlimited, this queson would not need to be asked. However, funds are limited and so
the queson is whether there is some other use of these funds that would yield greater
public benet? These are quesons of public policy and worthy of broad discussion and
analysis.

DRAFT Lee County Human Services Gap Analysis
Secon One: Quantave Data
Chapter 3 | Behavioral Outcomes Page | 78
Intenonally le blank.

DRAFT Lee County Human Services Gap Analysis
Secon One: Quantave Data
Chapter 4 | Comparison of Recent Community Surveys Page | 79
CHAPTER 4
Comparison of Recent Community Surveys
Introducon
This chapter compares the results of ve community surveys and the Consolidated Plan
HUD:
2019 Human Services Gap Analysis Survey. This survey was developed for this
project. The survey is provided in Appendix A.
2017 Community Health Needs Assessment Report by Professional Research
Consultants, Inc. (PRC). This was a community health survey conducted for Lee
Health. It is provided in Appendix B.
2019 Needs Assessment for Community Services Block Grant (CSBG) Work Plan. This
survey was conducted as part of developing the CSBG work plan. It is provided in
Appendix C.
2019-2023 Consolidated Plan HUD. This is a required submission to HUD. The
Community Development Block Grant (CDBG), HOME Investment Partnership
Program (HOME), and the Emergency Solutions Grant (ESG) programs are continued
through this process. It is provided in Appendix D.
2019-2028 Continuum of Care Plan for Homeless Services. This survey was
conducted as part of the development of the strategic plan for homeless services. It
is provided in Appendix E.
2019-2023 Analysis of Impediments to Fair Housing Choice. This survey was
conducted as an element of meeting HUD requirements. It is included in Appendix
F.

DRAFT Lee County Human Services Gap Analysis
Secon One: Quantave Data
Chapter 4 | Comparison of Recent Community Surveys Page | 80
Results
Mental Health Services
Table 28 shows a consistent rang that Mental Health Services are not meeng community
needs across the various surveys (excluding the Impediments survey, which did not ask any
Mental Health Services quesons).
Table 28. Mental Health Services
Gap Informaon Source
Service Descripon / Feedback
2019 Human Services Gap Analysis
Survey
Rated Most Inadequate Services:
- Available Residenal Mental Health Services
- Available Mental Health Services for Crisis
- Available Mental Health Services for Children and
Adolescents
- Available Out-paent Mental Health Services
Group with Poorly Met Needs Ranking:
- Mentally Ill Needs
Most Inadequate - Pick 3:
- Available Mental Health Services for Children and
Adolescents
2017 PRC Community Health Needs
Assessment Report - Lee County, FL
- “Fair/Poor” Mental Health
- Diagnosed Depression
- Symptoms of Chronic Depression
- Suicide Deaths
- Mental Health ranked as a top concern in the Online
Key Informant Survey
2019 Needs Assessment for CSBG
Work Plan
- Increase mental health and substance abuse
treatment programs (Homelessness)
- Increase mental health and substance abuse (Public
Services - Adults)
- Increase mental health and substance abuse
treatment programs (Public Services Youth)
2019-2023 Consolidated Plan HUD
N/A

DRAFT Lee County Human Services Gap Analysis
Secon One: Quantave Data
Chapter 4 | Comparison of Recent Community Surveys Page | 81
2019-2028 Connuum of Care
- Action Step 1.2b: Create and support initiatives to
increase the availability of, and successful linkages to,
necessary mainstream benefits, physical health care,
behavioral health care, education, employment,
childcare, and legal assistance programs to promote
housing stability.
- Action Step 1.2c: Implement a collaborative to
compare data from across systems and identify
solutions for persons who have high service needs
and frequently access multiple service systems.
2019-2023 Analysis of Impediments
to Fair Housing Choice
N/A

DRAFT Lee County Human Services Gap Analysis
Secon One: Quantave Data
Chapter 4 | Comparison of Recent Community Surveys Page | 82
Housing
Table 29 shows that Housing is widely idened as a community gap.
Table 29. Housing
Gap Informaon Source
Service Descripon / Feedback
2019 Human Services Gap Analysis
Survey
Rated Most Inadequate Services:
- Affordable Workforce Housing
- Emergency / Temporary Shelters
- Supportive Housing for Persons Needing Additional
Support
- Temporary Housing Assistance
- Rapid Re-housing
- Transitional Housing
Most Inadequate - Pick 3
- Affordable Workforce Housing
2017 PRC Community Health Needs
Assessment Report - Lee County, FL
N/A
2019 Needs Assessment for CSBG
Work Plan
- Increase number of affordable rental units
- Repair rental housing units
- Increase the number of affordable, owner occupied
units (Housing)
- Increase opportunities in areas with high lower-
income and minority populations (Fair Housing)
- Provide education about fair housing laws for
landlord/mortgage lenders/ realtors, etc. (Fair
Housing)
- Provide education about fair housing laws for renters
and homebuyers (Fair Housing)
- Increase the number of affordable housing units in
high opportunity areas.
- Increase programs to assist with repairs on aging
housing units, both renter and owner occupied.

DRAFT Lee County Human Services Gap Analysis
Secon One: Quantave Data
Chapter 4 | Comparison of Recent Community Surveys Page | 83
Gap Informaon Source
Service Descripon / Feedback
2019-2023 Consolidated Plan HUD
- Affordable Housing
- Housing Rehabilitation and Reconstruction
- Down Payment Assistance
- Housing for Persons who are Homeless
2019-2028 Connuum of Care
- Action Step 1.2a: Advocate for community-wide
policies and practices that support the development
of safe and affordable housing.
2019-2023 Analysis of Impediments
to Fair Housing Choice
- Reduce incidence of discrimination in the sale or
rental of housing.
- Increase racial and ethnic minority’s access to home
financing.
- Affirmatively further fair housing programs in the
County.
- Improve housing accessibility for persons with
disabilities.
- Improve LEP persons’ access to fair housing
information.
- Ensure that the members of protected classes are
represented on local planning/zoning boards.
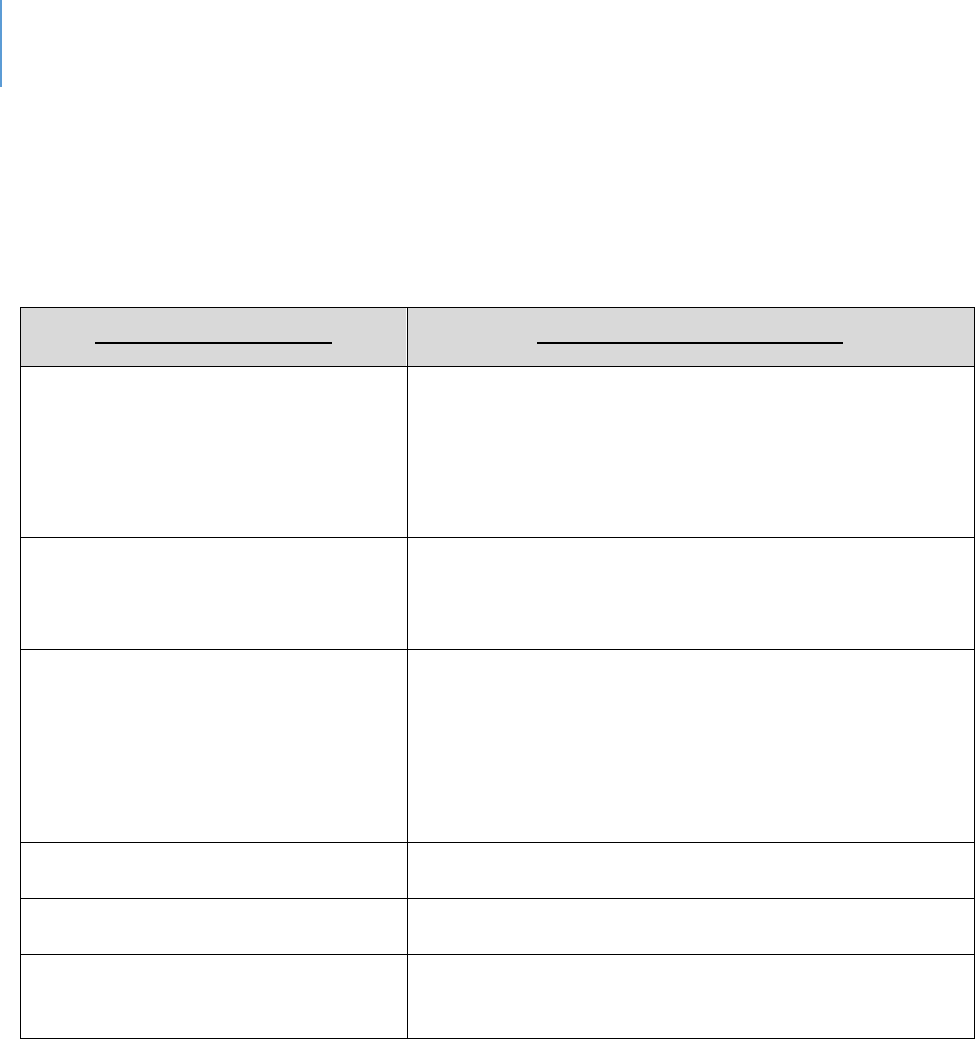
DRAFT Lee County Human Services Gap Analysis
Secon One: Quantave Data
Chapter 4 | Comparison of Recent Community Surveys Page | 84
Transportaon
Table 30 shows that Transportaon is commonly menoned as a community gap.
Table 30. Transportation
Gap Informaon Source
Service Descripon / Feedback
2019 Human Services Gap Analysis
Survey
Rated Most Inadequate Services:
- Public Transportation
Most Inadequate - Pick 3:
- Affordable Workforce Housing
2017 PRC Community Health Needs
Assessment Report - Lee County, FL
Barriers to Access:
- Lack of Transportation
2019 Needs Assessment for CSBG
Work Plan
- Increase bus routes to areas where jobs are located
- Increase bus routes in areas with high low-income
and minority populations
- Increase transportation options for persons who are
elderly and/or disabled (Transportation)
2019-2023 Consolidated Plan HUD
N/A
2019-2028 Connuum of Care
N/A
2019-2023 Analysis of Impediments
to Fair Housing Choice
- Improve regional transportation.
DRAFT Lee County Human Services Gap Analysis
Secon One: Quantave Data
Chapter 4 | Comparison of Recent Community Surveys Page | 85
Child-care
Table 31 shows that Child-care was rated as one of the most serious gaps in two surveys.
Table 31. Child-care
Gap Informaon Source
Service Descripon / Feedback
2019 Human Services Gap
Analysis Survey
Rated Most Inadequate Services:
- Affordable Child-care
2017 PRC Community Health
Needs Assessment Report - Lee
County, FL
N/A
2019 Needs Assessment for CSBG
Work Plan
- Increase low cost child-care programs (Public Services
Youth)
- Increase mental health and substance abuse treatment
programs (Public Services Youth)
- Increase afterschool programs (Public Services Youth)
2019-2023 Consolidated Plan
HUD
N/A
2019-2028 Connuum of Care
N/A
2019-2023 Analysis of
Impediments to Fair Housing
Choice
N/A
DRAFT Lee County Human Services Gap Analysis
Secon One: Quantave Data
Chapter 4 | Comparison of Recent Community Surveys Page | 86
Homelessness
Table 32 shows that Homelessness was rated as a community need in three surveys.
However, it should be noted that some of these comments are duplicave of Table 28 –
Mental Health Services and Table 29 – Housing.
Table 32. Homelessness
Service Descripon / Feedback
Service Descripon / Feedback
2019 Human Services Gap
Analysis Survey
N/A
2017 PRC Community Health
Needs Assessment Report - Lee
County, FL
N/A
2019 Needs Assessment for CSBG
Work Plan
- Increase mental health and substance abuse treatment
programs
- Increase rental assistance programs
- Increase emergency shelter beds (Homelessness)
2019-2023 Consolidated Plan
HUD
- Housing for Persons who are Homeless
2019-2028 Connuum of Care
- Goal 2.4: Assist people to move from homelessness to
permanent housing, within 30 days, through
appropriate and person-centered services.
2019-2023 Analysis of
Impediments to Fair Housing
Choice
N/A

DRAFT Lee County Human Services Gap Analysis
Secon One: Quantave Data
Chapter 4 | Comparison of Recent Community Surveys Page | 87
Special Populaons
Table 33 addresses gaps in services provided to Special Populaons. The major concern
is housing, which mirrors Table 29 – Housing.
Table 33. Special Populations
Gap Informaon Source
Service Descripon / Feedback
2019 Human Services Gap
Analysis Survey
N/A
2017 PRC Community Health
Needs Assessment Report - Lee
County, FL
N/A
2019 Needs Assessment for CSBG
Work Plan
- Provide accessible housing
- Provider services to support independent living
- Increase the capacity of adult daycare or other assisted
living facilities
- Increase assisted living beds and permanent housing
units for low-income seniors.
- Increase the number of housing units accessible to
persons with disabilities and those on a fixed income.
2019-2023 Consolidated Plan
HUD
N/A
2019-2028 Connuum of Care
- Action Step 2.2d: Advocate for the development of low-
barrier temporary and permanent housing facilities,
with co-located services, for sub-populations with high
service needs such as, youth and survivors of domestic
violence, dating violence, sexual assault, and human
trafficking.
2019-2023 Analysis of
Impediments to Fair Housing
Choice
N/A

DRAFT Lee County Human Services Gap Analysis
Secon One: Quantave Data
Chapter 4 | Comparison of Recent Community Surveys Page | 88
Conclusion
The three common concerns across all current surveys are Mental Health, Housing and
Transportaon. Aordable Child-care was noted in two of the surveys.

DRAFT Lee County Human Services Gap Analysis
Secon Two: Infrastructure
Section Two: Infrastructure Page | 89
Secon Two: Infrastructure

DRAFT Lee County Human Services Gap Analysis
Secon Two: Infrastructure
Section Two: Infrastructure Page | 90
Intenonally le blank.

DRAFT Lee County Human Services Gap Analysis
Secon Two: Infrastructure
Chapter 5 | Housing Page | 91
CHAPTER 5
Housing
Introduction
This analysis will examine the potential of housing gaps from several perspectives:
1) A comparison of housing issues in Lee County with other counties in the State.
The question here is whether Lee County is an outlier in the field of housing.
2) A cost-burdened examination. This analysis seeks to determine if the cost of
housing in Lee County creates a significant financial burden such that residents
are, at times, challenged to meet all their expenses. There are two parts to this
analysis. One looks at the cost of housing by itself. The second part examines
other costs, such as transportation, that may add to the cost-burden so that
although the rental or mortgage costs may be manageable, high transportation
costs result in a cost-burden.
3) An analysis of the housing location with regard to the location of everyday life
needs. If housing is far from various services, it represents a different kind of
cost-burden in terms of time as well as transportation costs. This perspective is
labeled “access.”
4) An examination of the community’s response to the housing gap, if it indeed
exists. This perspective examines status of the infrastructure needed to develop
attainable, affordable, workforce or supportive housing, the planning process to
develop such housing, the need for public education and engagement, and the
regulatory environment.
5) An analysis of housing issues for select demographic groups.
6) An analysis of the impact of housing costs on the economic development of the
community.
Note on Definitions of Housing Cost Burden. A housing cost-burden is defined by having
to pay more than 30% of one’s income for housing (rent/mortgage plus utilities). Severe
housing cost-burden is defined as 50% of one’s income. There are several critiques of
these definitions, most of which center on it being too generic, non-applicable to those
with higher incomes, or ignoring costs that may be associated with housing (such as
transportation costs if one must commute significant distances to work to afford
housing). Granted these difficulties, the measure still provides a useful indicator of the
housing challenge.
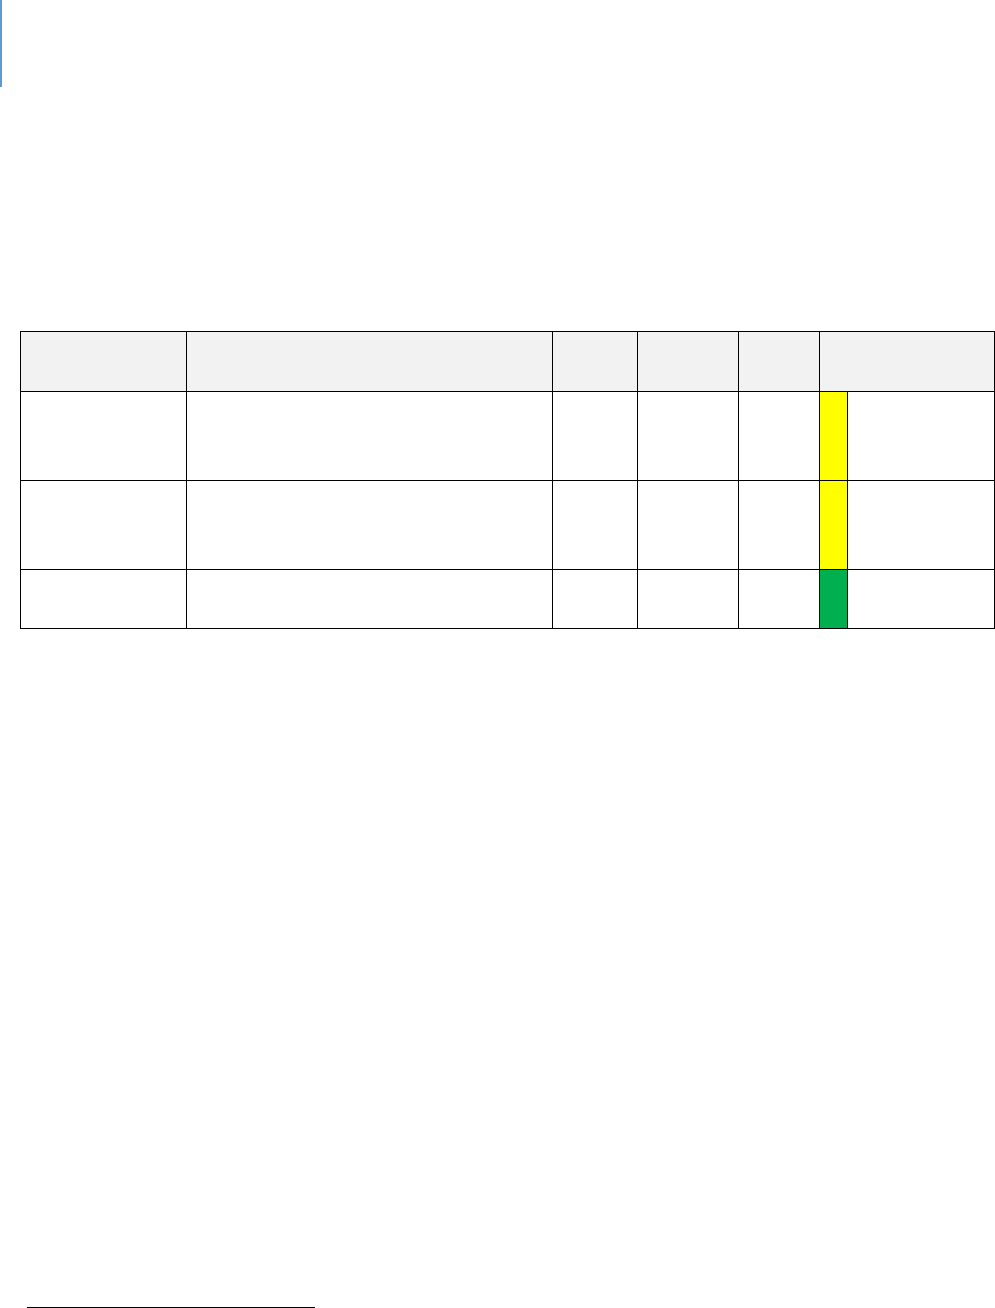
DRAFT Lee County Human Services Gap Analysis
Secon Two: Infrastructure
Chapter 5 | Housing Page | 92
Lee County Compared to the State of Florida
Table 34 reports comparable housing data for Lee County against the State. Lee County
is essentially on par with the State regarding housing challenges.
Table 34. Comparative Housing Data
Source
Data Title
Year
Lee
County
State
Comparison
Health Equity
Profile
52
Owner-occupied households with
gross rent costing 30% or more of
household income
2013-
17
26.5%
27%
Within 10%
average
Health Equity
Profile
Renter-occupied households with
gross rent costing 30% or more of
household income
2013-
17
52%
57%
Within 10%
average
Health Equity
Profile
Severe housing problems
2015
18.5%
20.8%
Better
Is there an Affordability Gap? – Cost Burdened Housing
Cost-burdened housing is primarily defined as having to pay more than 30% of one’s
income for housing. Another approach to defining cost-burdened is to add in energy
and/or transportation costs to reflect that, while the housing itself may be affordable,
the costs associated with its energy efficiency (or lack thereof) or its location (that
requires high transportation costs) may lead to a cost-burden. Tables 35 and 36 report
local data that show the extent of the housing challenge in Lee County. Table 35 shows
the rent that residents in various income categories can afford without being housing
cost-burdened. Table 36 shows the percentage of rental units available in various cost
ranges.
52
Florida Health Charts, Health Equity Profile,
http://www.flhealthcharts.com/ChartsReports/rdPage.aspx?rdReport=ChartsProfiles.HealthEquityProfile
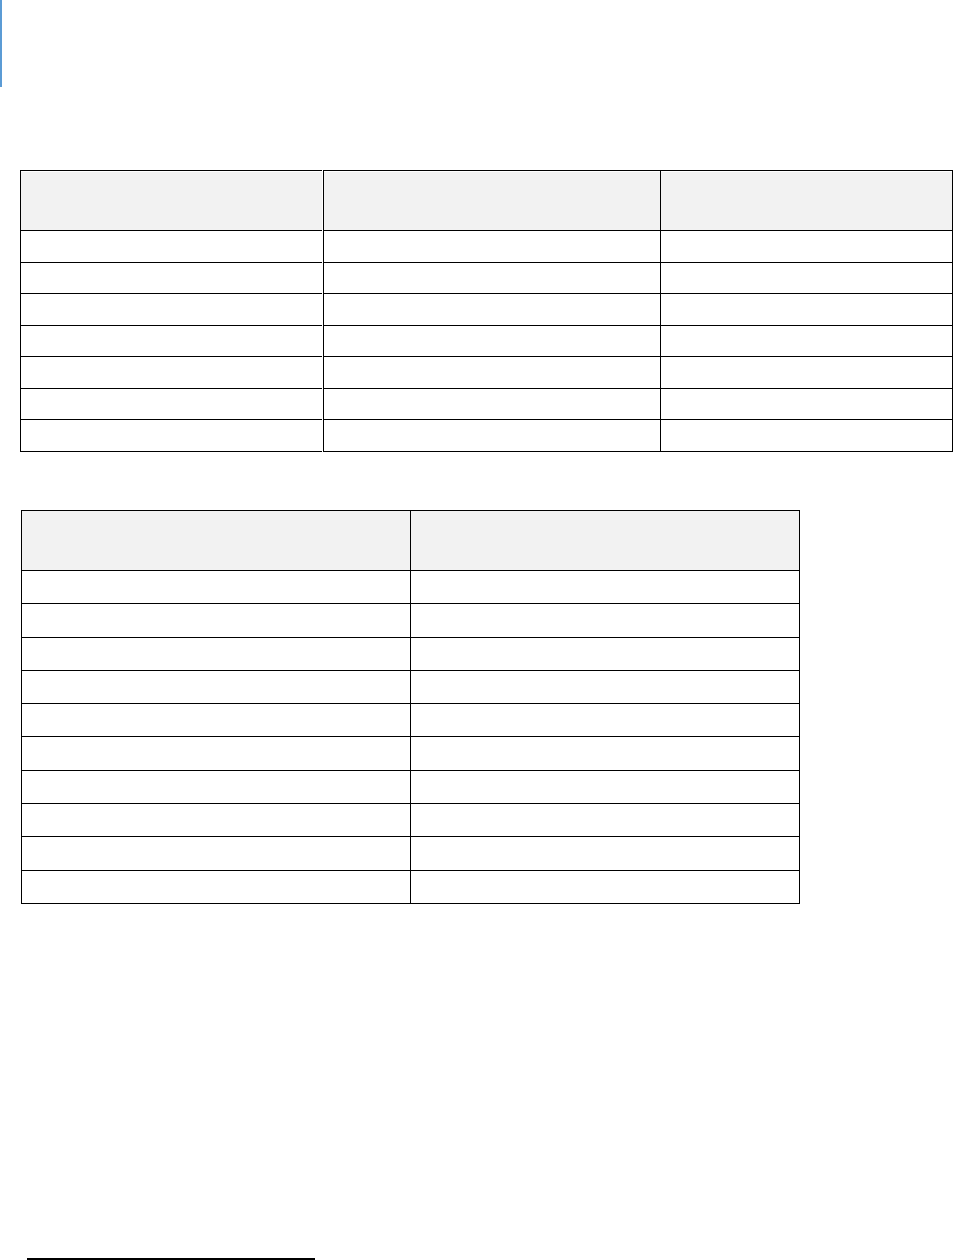
DRAFT Lee County Human Services Gap Analysis
Secon Two: Infrastructure
Chapter 5 | Housing Page | 93
Table 35. Lee County Renter Household Income
53
Income Group
Monthly Rent at 30% Housing
Cost
% of Households in this
income range
Under $10,000
Under $250
7.8
$10,000-24,999
$251-625
21.1
$25,000-34,999
$626-875
15
$35,000-49,999
$876-1,250
20.4
$50,000-74,999
$1,251-1,875
19
$75,000-99,999
$1,876-2,500
8.9
$100,000-149,000
$2,501-3,750
6.4
Table 36. Lee County Distribution of Paid Rent Ranges
54
Rent Range
Percentage of Rental Units in this
Range
<$300
1%
$300-399
0.8%
$400-499
1.1%
$500-599
1.8%
$600-699
3.1%
$700-799
4.5%
$800-999
11%
$1,000-1,249
40.7%
$1,250-1,499
17.9%
$1,500+
18.2%
However, Table 36 groups the rent data in ranges that differ from the income ranges in
Table 35. Therefore, this analysis made three presumptions to allow for a more
seamless comparison of the data:
1. It was presumed that the small percentage of rental units costing between $250-
$300 per month (less than 1% of all units) was not significant enough to require an
interpolation of this rental range category.
2. It was presumed that the percentage of rental units costing in the $600-$699 and
$800-$999 rental ranges is evenly distributed throughout the ranges; and
53
Need for Multi-Family Rental Apartments, City of Cape Coral, Reinhold P. Wolff Economic Research, Inc. L. Keith
White, President June 2019
54
Need for Multi-Family Rental Apartments, City of Cape Coral, Reinhold P. Wolff Economic Research, Inc. L. Keith
White, President June 2019
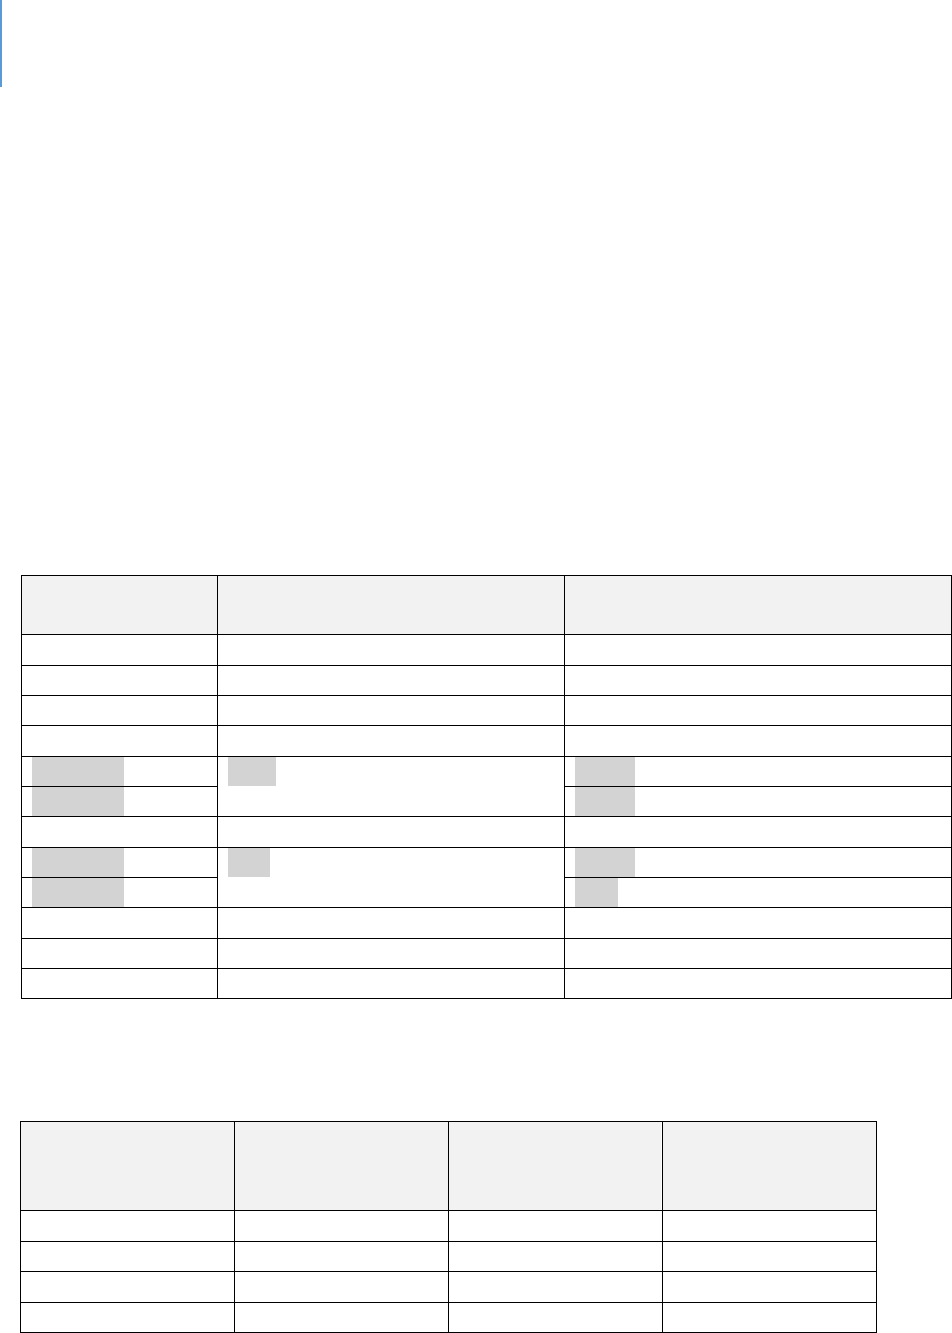
DRAFT Lee County Human Services Gap Analysis
Secon Two: Infrastructure
Chapter 5 | Housing Page | 94
3. Data were interpolated in those two ranges to split the ranges into four: $600-$625,
$626-$699, $800-$875, $876-$999.
These presumptions and interpolations allow for the percentage of rental units in the
rental ranges ending in $625 and $875 to correspond more accurately to the income
groups presented in Table 35. The presumption of equal distribution within the range
assigned 25% of the percentage of units in the $600-$699 rental range to the $600-$625
range, with the remaining 75% being assigned to the $626-$699 range. Similarly, 37.5%
of the percentage of rental units in the $800-$999 range were assigned to the $800-
$875 range, with the remaining 62.5% being assigned to the $876-$999 range. Table 37
presents the data in the interpolated rent range and percentage of rental unit
categories.
Table 37. Annotated Distribution of Paid Rent Ranges
Rent Range
Original Percentage of Rental
Units in this Range (Table 36)
Annotated Percentage of Rental
Units in this Range
<$300
1%
1%
$300-499
0.8%
0.8%
$400-499
1.1%
1.1%
$500-599
1.8%
1.8%
$600-625
3.1%
0.78%
$626-699
2.33%
$700-799
4.5%
4.5%
$800-875
11%
4.13%
$876-999
6.88
$1,000-1,249
40.7%
40.7%
$1,250-1,499
17.9%
17.9%
$1,500+
18.2%
18.2%
Table 38 summarizes the data from Table 36 and Table 37.
Table 38. Affordable Rent Income (@30%) vs Available Units at that Income
Income Group
Monthly Rent at
30% Housing Cost
% of Households in
this income range
Percentage of
Rental Units in this
Range
Under $10,000
Under $250
7.8%
1%
$10,000-24,999
$251-625
21.1%
4.48%
$25,000-34,999*
$626-875
15%
10.96%
TOTAL
43.9%
16.44%
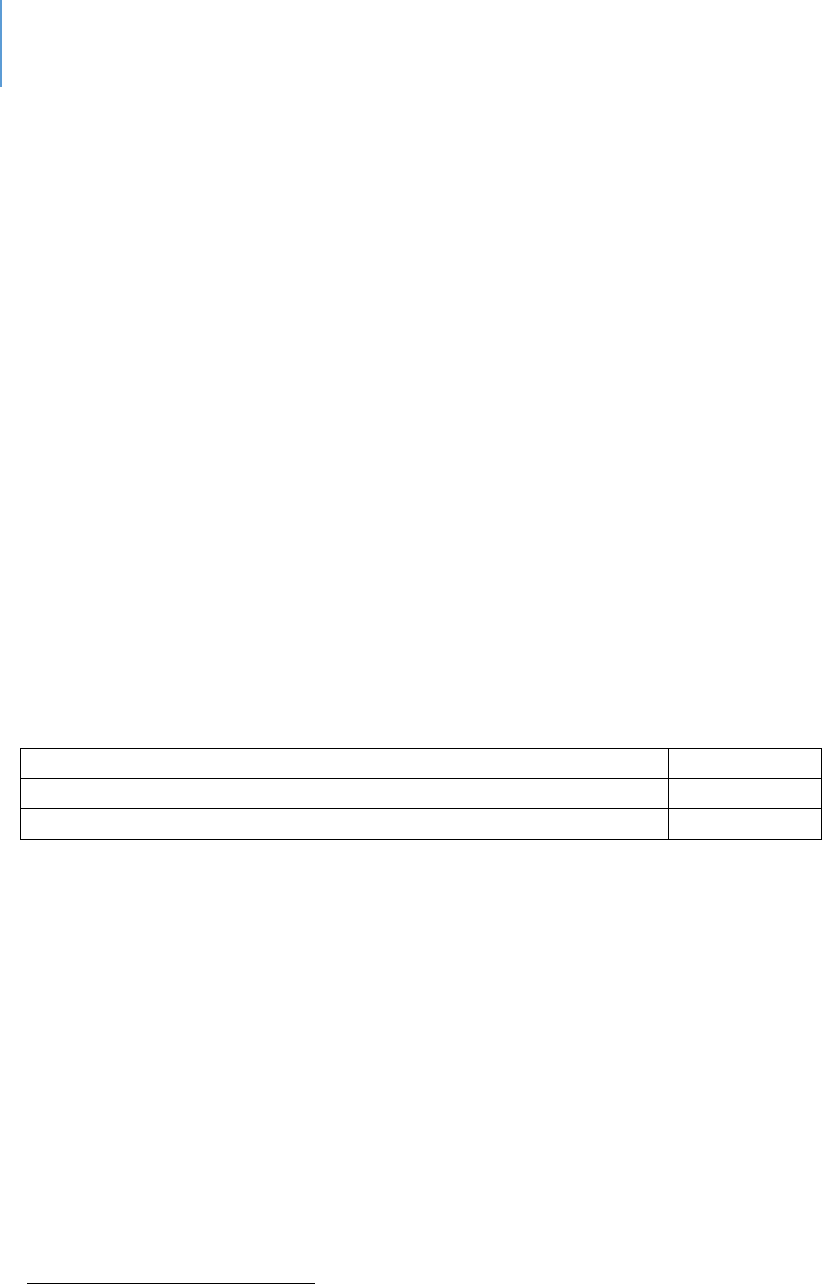
DRAFT Lee County Human Services Gap Analysis
Secon Two: Infrastructure
Chapter 5 | Housing Page | 95
An examination of Table 38 shows the housing challenge in Lee County: The 28.9% of
residents who earn less than $25,000, to avoid being housing cost-burdened (spending
more than 30% of income on rent), must find rent at $625 a month or less. However,
only 5.48% of rental units are available at this amount or less. Because this rental cost
may not include utilities, the actual percentage of residents that are housing cost-
burdened could be higher. For those in the $25,000-$34,999 income category, the rent
range would be $626 to $875 per month; and only 10.96% of rental units are available
at those amounts.
Under these presumptions, as Table 38 shows, approximately 43.9% of households are
competing for 16.44% of the housing in the Lee County market that is affordable to
them. At these ratios, it is likely that 27.46% (43.9 minus 16.44) of households earning
less than $35,000 are cost-burdened by rent. This data should be considered as
conservative estimates as other data sources report higher percentages such as shown
in Tables 39 and 40. These differences are due to the use of varying categories for
income, various databases and differing years of data. The significant point is that a
substantive portion of county residents are cost-burdened.
Table 39. Low Income Housing in Lee County
55
Total Low Income Apartments
4,545
Total Housing Units with Rental Assistance
1,785
Percentage of Renters Cost-Burdened
52.25%
Section 8 vouchers are intended to assist low-income persons with housing costs. The
Fort Myers Housing Authority issues 1,768 vouchers of various categories
56
and the Lee
County Authority issues 260.
57
The above presumptions can, and should, be challenged in several ways, which include:
While most of the above tables address rental cost-burden, Table 34 includes
owned homes. A proportion of these households are longer-term residents and
own or inherited their homes from a period when housing costs were much
lower. On a pure income basis, they would be cost-burdened. However, they
may not be.
55
www.affordablehousingonline.org/LeeCounty
56
Fort Myers Housing Authority
57
Lee County Housing Authority

DRAFT Lee County Human Services Gap Analysis
Secon Two: Infrastructure
Chapter 5 | Housing Page | 96
Some people moving into the county bring equity from home sales and can
reduce their monthly housing costs with that equity. From a current income
perspective, they would appear to be cost-burdened. However, they may not
be.
Various other forms of financial assistance may be provided, and they are not
showing up in the income categories.
The final piece of data indicating the Lee County housing challenge is the fact that
vacancy rates in tax-credit housing is less than 1.5%.
58
Transportation Cost Burden
Housing in Lehigh Acres is comparatively affordable and has become a major housing
focus for many service workers. While the housing is comparatively affordable, what
occurs due to commute distances is that households are now cost-burdened with
transportation costs. Transportation costs are considered affordable if they are 15% or
less of household income. This would be $7,281 per year for the average Lehigh Acres
household. The estimated driving costs for Lehigh Acres are $12,822 per year.
59
The
average household in Lehigh Acres commits 50% of its income to housing and
transportation (24% housing, 26% transportation).
60
Table 40 presents more detailed rental housing cost-burden data for Lee County.
61
This
data is from a real estate data firm that tracks larger scale apartments. Mom and Pop
rental units are not included in this data.
58
Lee County Economic Development Office
59
www.esri.com/software/american-community-survey
60
Center for Neighborhood Technology, H+T Fact Sheet
61
Salviati, C. 2019. 2018 Cost Burden Report. www.apartamentlist.com
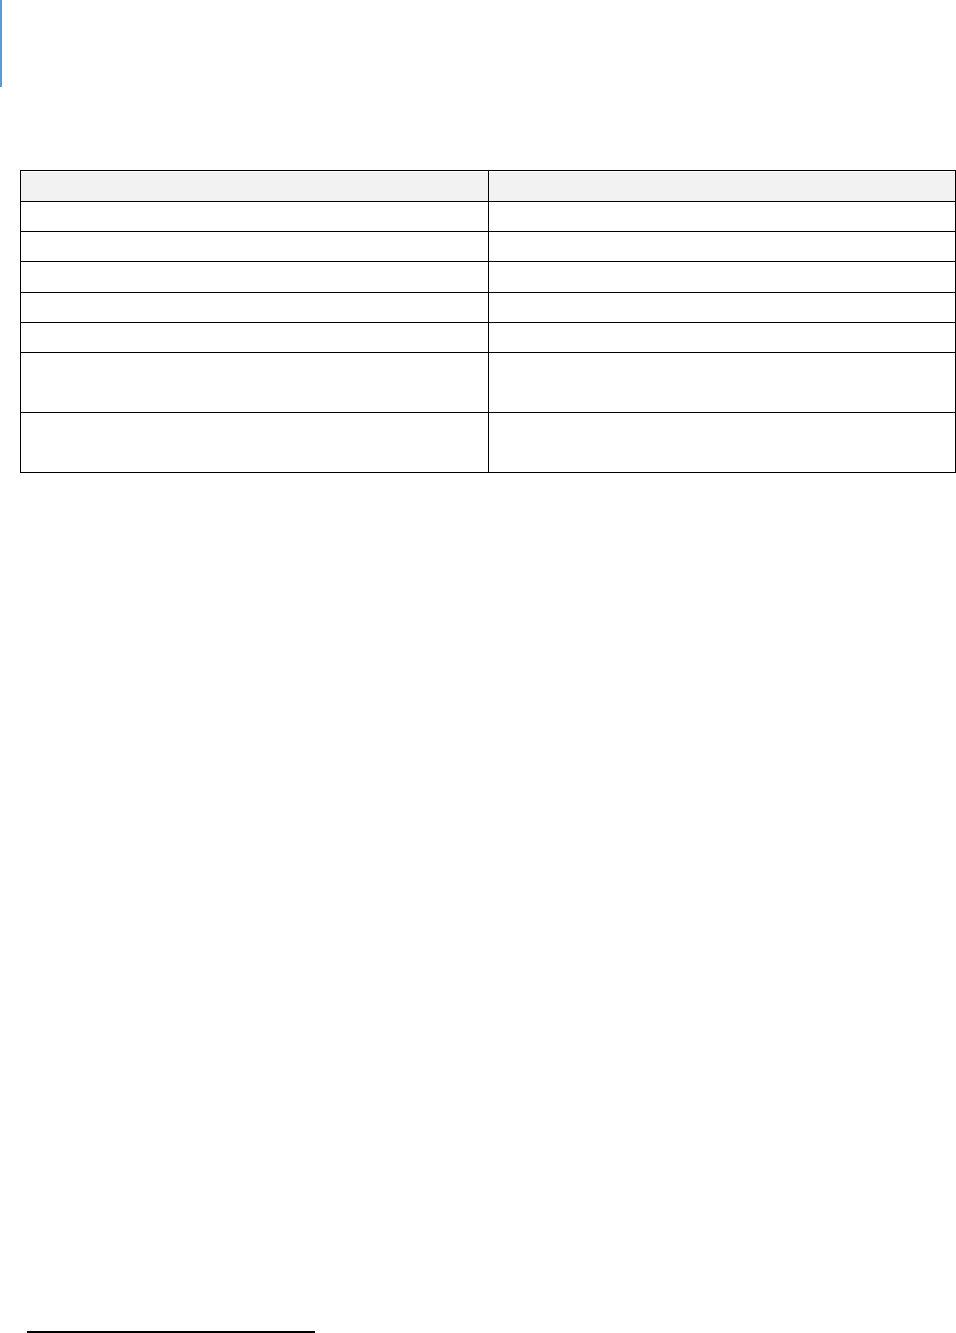
DRAFT Lee County Human Services Gap Analysis
Secon Two: Infrastructure
Chapter 5 | Housing Page | 97
Table 40. Rental Cost-burden in Lee County
(Larger apartment complexes)
62
Category 2018 Data
Data
Total Number of Rental households
71,442
Overall percentage that are cost-burdened
55.4%
Percentage moderately cost-burdened
27.0%
Percentage severely cost-burdened (50%)
28.4%
Total Number of Cost burdened
39,614
Total Number of moderately cost-burdened
households
19,325
Total number of severely cost-burdened
households
20,289
Access and Housing
Table 41 examines various “access” indicators. “Access” in this table is measured in
terms of distance from various services. This data is only reported and is not used for
comparative analysis. As a review of the color codes indicate the data are mixed.
Otherwise, there is little to distinguish Lee County from the State’s norms.
62
Salviati, C. 2019. 2018 Cost Burden Report. www.apartamentlist.com
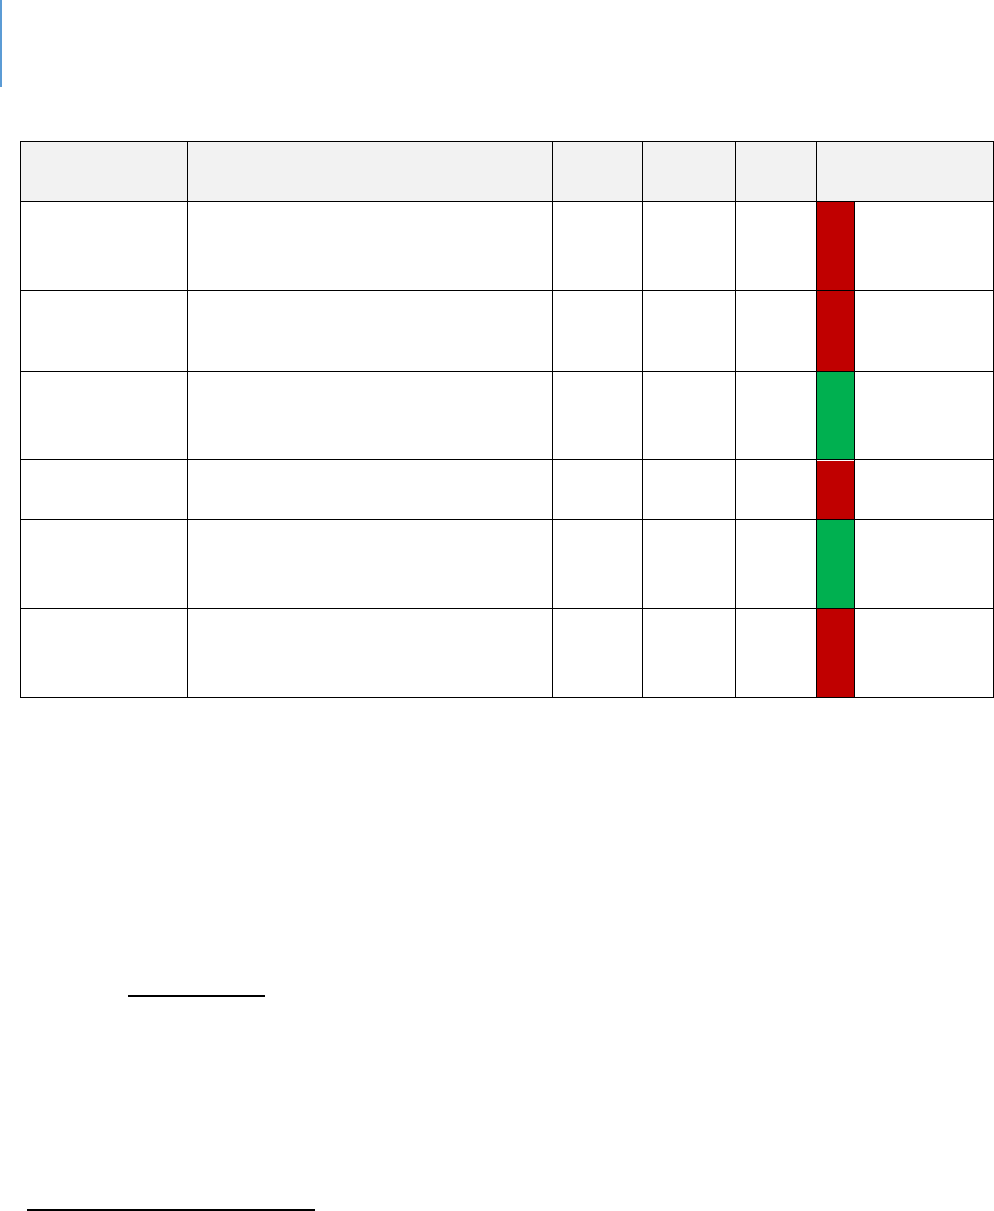
DRAFT Lee County Human Services Gap Analysis
Secon Two: Infrastructure
Chapter 5 | Housing Page | 98
Table 41. Comparison of Various Access Indicators
Source
Data Title
Year
Lee
County
State
Comparison
Healthiest
Weight
Profile
63
Population that live within a 1/2
mile of healthy food source
2016
21.8%
30.9%
Worse
Healthiest
Weight Profile
Population that live within a 1/2
mile of a fast food restaurant
2016
24.8%
33.9%
Worse
Healthiest
Weight Profile
Population that live within a ten-
minute walk (1/2 mile) of an off-
street trail system
2016
39.5%
18.2%
Better
Health Equity
Profile
64
Population living within ½ mile of a
park
2016
22.6%
43.2%
Worse
Healthiest
Weight Profile
Workers who used taxicab,
motorcycle, bicycle, or other
means to work
2016
5-yr
Est
3.1%
2.2%
Better
Community
Health Needs
Assessment
65
Population with Low Food Access
2017
38.2%
25.7%
Worse
Community Infrastructure and Culture
This perspective addresses a variety of topics, all of which relate to the community
capacity and readiness to address its housing challenges. In no priority order, these
issues are:
Silos of Effort. There are a variety of efforts to address the housing issues of Lee
County. These include faith-based efforts, nonprofit housing developers, local
governments, private individuals and public housing authorities. The issue is that
these efforts all too often operate in silos, missing the opportunity to leverage each
other’s knowledge, skills and resources.
63
Florida Health Charts, Healthiest Weight Profile,
http://www.flhealthcharts.com/ChartsReports/rdPage.aspx?rdReport=ChartsProfiles.HealthiestWeightCountyProfi
le
64
Florida Health Charts, Health Equity Profile,
http://www.flhealthcharts.com/ChartsReports/rdPage.aspx?rdReport=ChartsProfiles.HealthEquityProfile
65
2017 Community Health Needs Assessment.
DRAFT Lee County Human Services Gap Analysis
Secon Two: Infrastructure
Chapter 5 | Housing Page | 99
Public Attitude. A negative public perception exists for terms such as “attainable,
affordable, workforce and supportive” housing. This often leads to the phenomenon
of NIMBYism (Not In My Backyard) and pressure upon elected officials to deny
various housing projects. This perception is often based on erroneous
understandings of various housing projects and emanates from a concern that
property values will be negatively affected. Projects of this type require a more
proactive community engagement approach that helps identify community needs
and concerns and incorporates them into final designs.
Landlord Attitudes. With respect to persons with various special needs, or who have
problematic backgrounds, landlords can be reluctant to rent. Outreach programs
and support programs that assist landlords to enter this sub-market are an
important feature.
Organizational Structures. There are organizations, such as Community
Development Corporations (CDCs), that provide tools to organize various housing
efforts.
The Complexity of Financing and Developing Market Alternative Housing. There are
several tools that can be used to make “market alternative” housing feasible.
However, these require specialized knowledge and skill sets that are unfamiliar to
most developers. Examples of some financing tools include low-income housing tax
credits, bonding through a Housing Finance Agency, a multi-family mortgage
revenue bond, the community contribution tax credit, and project-based rental
assistance (Section 202 and 811).
Land Assembly. To develop projects of an impactful size, assembly of contiguous
parcels can be required. The time to assemble a property of feasible and impactful
size, however, often exceeds a developer’s capacity or timeframe.
The Expiration of Current Affordable Housing Units. Affordable housing units have
been built with timeframes in which the affordability requirements terminate and
the units can be rented at market rates. The low-income rent requirements for 585
housing units in Lee County will have expired by the end of 2019. An additional 53
will expire by the end of 2020, and another 158 by the end of 2023
66
. Depending
66
HUD REAC, HUD MF contracts.

DRAFT Lee County Human Services Gap Analysis
Secon Two: Infrastructure
Chapter 5 | Housing Page | 100
upon location and maintenance, some of these may be sold to re-enter as market
rate housing. For others, there is the option to raise rents to a more market
comparable rate. At the moment, more subsidized housing is being lost than is
currently being developed. A strategy to replace these units is missing.
The Regulatory Framework. The regulations on development may bring another set
of challenges to “alternative to market” housing. For example, parking
requirements may be different when a housing unit is composed of residents whose
ability to afford automobiles is limited. Setbacks and other requirements may need
to be modified in the case of duplexes or garage apartments in which owners could
rent out these additional units.
Credit Repair and First Time Home Buyer Assistance. This service is self-explanatory,
but it is a key feature in helping families purchase their own homes.
Housing and Selected Demographic Groups
Seniors. Lee County is a retirement destination and therefore has a substantive
proportion of seniors. An emerging housing issue is the higher needs associated
with the growth of the age 85 or older portion of the population. As one spouse dies
and family income decreases, and as homes are not designed for aging-in-place; the
housing needs of seniors likely will grow in significance.
Individuals with Developmental Disabilities (IDDs). As federal and state policy is to
move these persons away from institutions and into the community, there is limited
housing that is both affordable and responsive to some of their specific needs. What
will make this issue more challenging in the future is that a high proportion of these
persons currently reside with their parents. As these parents either die or become
unable to continue to live in their current residences, the issue arises as to where
persons with developmental disabilities will live. Some of the special housing issues
facing persons with IDDs include:
In Florida, 33% of individuals living with a family have a caregiver age 60 or older,
which is approximately 75% higher than the national rate. This means that
Florida, the third-most populous state, has more than 75,000 individuals with
IDDs that have caregivers age 60 or older.

DRAFT Lee County Human Services Gap Analysis
Secon Two: Infrastructure
Chapter 5 | Housing Page | 101
Connected Housing Post-Family-Care. When assessing these figures, it becomes
apparent that many individuals may need to transition from ad-hoc family based
housing and transportation systems to other available systems, when their aging
caregiver dies or becomes incapacitated. Given the numbers of individuals
involved – both nationally and in Florida – it is expected that demand for housing
in areas readily connected to services, supports the services, and then effective
transportation can increase by a significant degree.
Stereotypes and Prejudices. Landlords are sometimes reluctant to rent to
persons with an IDD due to various stereotypes and prejudices.
Affordability and Residential Choice. The issue of housing costs and affordability
is particularly important when placed side-by-side with data from the National
Core Indicators (NCI) Florida results. NCI Florida results show that 50% of
respondents did not choose where they live. Forty percent did not choose who
they live with.
67
Affordability, by its nature impacts residential choice, which in
turn limits residential options. Similarly, location and physical environment
impact residential choices and options.
Cost-Burden. For households in Florida with at least one person with a disability
(including but not limited to IDD households), the following table (Table 42)
illustrates the cost-burden for these households. For example, in extremely low-
income households (<=30% AMI) with a disabled individual, 66% (171,083
households) have a housing cost-burden greater than 50% of their income.
68
(AMI is “Average Monthly Income” for all households).
67
“What We Learned from the National Core Indicators (NCI) Adult Consumer Survey: Results from People Across
Florida That Used NCI in 2011-12.” Alexandria, VA: National Association of State Directors of Developmental
Disabilities Services and Human Services Research Institute, 2012: pp. 14-15.
68
State of Florida Consolidated Plan, FFY 2011-2015. Tallahassee: Department of Community Affairs, p. 15.
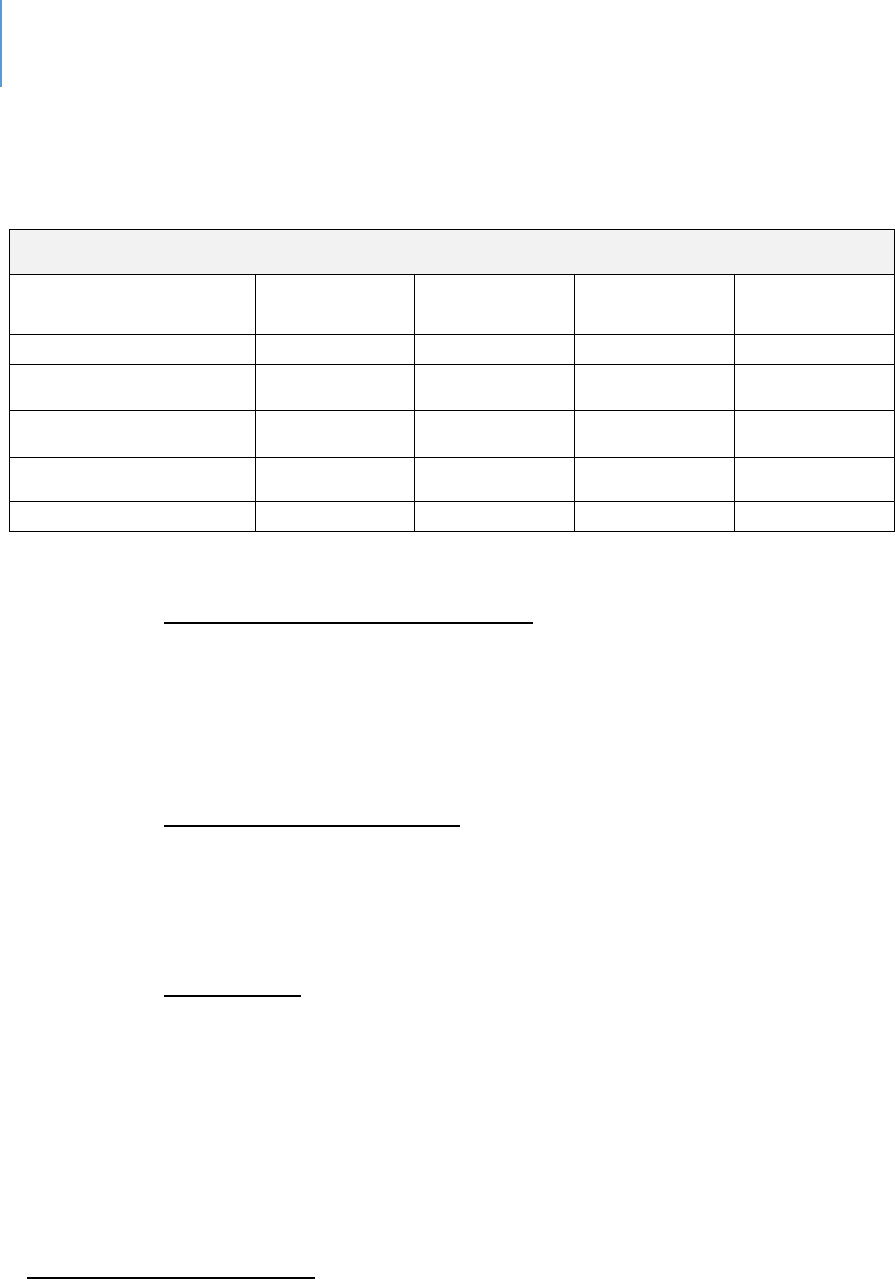
DRAFT Lee County Human Services Gap Analysis
Secon Two: Infrastructure
Chapter 5 | Housing Page | 102
Table 42. Cost Burden for Households in Florida Including at Least One Person with a
Disability (Age 5+)
69
Cost Burden
Household Income
Less Than
30%
30.01% to
50%
Greater Than
50%
Total
Households
30% of AMI or Less
56,629
30,900
171,083
258,612
30.01% to 50% AMI
76,256
72,058
124,361
272,675
50.01% to 80% AMI
163,797
108,360
74,221
346,378
80.01% to 120% AMI
220,205
79,180
29,280
328,665
Grand Total
516,887
290,498
398,945
1,206,330
Persons with Behavioral Health Issues. Persons with serious mental illness
issues, serious substance abuse issues or both face more than just housing
challenges. They also face the challenge of obtaining wrap-around services that
assist them to remain in a housing situation. Housing challenges are one of
affordability, access to services and public perception and attitude.
Persons with Criminal Records. Persons re-entering society from jail, or prison,
face difficulties securing jobs and affordable housing. In addition to the
affordability issue, there is the resistance of landlords and the broader
community to having such persons nearby.
The Homeless. A proportion of homeless persons have serious behavioral health
issues. However, for many, it is a true affordability issue. The challenge is
intervening to prevent the onset of homelessness. In the absence of that
intervention, the challenge becomes how to secure housing once homeless.
69
State of Florida Consolidated Plan, FFY 2011-2015, p. 15. Original data sources for chart: Shimberg Center for
Housing Studies, 2009 American Community Survey.

DRAFT Lee County Human Services Gap Analysis
Secon Two: Infrastructure
Chapter 5 | Housing Page | 103
Housing and Economic Development
The discussion so far has focused on housing as a human need – and this is certainly the
proper approach. However, there is another reason to be concerned about housing
affordability. As housing costs in regions become more and more expensive, the ability
to retain or attract those businesses for whom housing costs can be a significant
employee issue becomes more difficult. There are numerous stories about businesses
relocating from Silicon Valley, or other very high cost areas, to communities where
homes are more affordable.
While the significance of this issue is only one factor in relocation decisions, it is one
that local communities should address because it is one they can influence. Major
employers have noted the difficulty of filling lower-level positions due to housing costs.
Conclusion
From an overall poverty perspective, Lee County does not have the proportion of severe
poverty that other counties do. What it does have is a somewhat higher proportion of
residents who are on the margins of financial difficulty and must make a variety of
financial tradeoffs, particularly with respect to housing. It is this marginality which puts
residents at various risks including housing or transportation. This is particularly
significant in the case of housing, in which at least 28% of the population is housing
cost-burdened, thereby lacking the resources to address other needs as they emerge.
For instance, when housing and transportation costs are combined, another significant
percentage of residents become cost-burdened.
Special Note
There are methodological critiques of how both household income and federal poverty
levels areas measured. These critiques will be found in Appendix J.

DRAFT Lee County Human Services Gap Analysis
Secon Two: Infrastructure
Chapter 5 | Housing Page | 104
Gaps and Opportunies
Several strategies can be deployed to address housing needs. Some will require a
community-level response, while others will require involvement from Lee County
Government. Potential measures include:
Convening all interested and affected parties to develop multi-partner efforts;
Appointment of a lead person, office or contractor to coordinate internal County
Housing efforts among departments and to identify funding tools;
Development of a strategic or master plan for specific areas;
Development of a planning process that addresses the financing and
development dimensions distinctively associated with non-market rate housing;
Active monitoring and strategy development for subsidized units which are
nearing the end of their time requirements for providing below-market rents;
Development and deployment of public education and engagement strategies to
proactively address community concerns;
Development of knowledge in the real estate, developer and banking sector of
financing options and tools;
Establishment of a community land trust;
Securing of grants and philanthropic contributions;
Additional provision of emergency financial assistance to assist people to stay in
their homes; and,
Credit repair programs.

DRAFT Lee County Human Services Gap Analysis
Secon Two: Infrastructure
Chapter 6 | Transportation Page | 105
CHAPTER 6
Transportaon
Introducon
Whatever the data source (survey, interview, focus group), public transportaon is
consistently idened as a need. The same is true when the analysis is across-services
or across-populaons – one of the consistent barriers is inadequate public
transportaon.
In recognion of this need, the Board of County Commissioners has an annual transit
operaonal budget of $25 million. Approximately $7 million of that budget is obtained
through state and federal grants. Nearly $5 million is generated directly from Lee
County Transit (LeeTran) via fare box and adversing. The remaining $13 million a year
is allocated from general fund tax dollars.
Yet a gap remains. The queson is why? Essenally, it boils down to a combinaon of
demographics, design and convenience.
Populaon and Transit Market. The transit market in this case refers to the size of the
populaon that could be users of the system. Sheer numbers aect the feasibility of
public transportaon. What also aects transit is age, race, gender, disability and
related factors that shape the need and/or desire to use transit. As the populaon of
the county grows both older and more disabled (which are indicated trends), a growing
need for transit services will exist. While it is subsidized and not fully dependent upon
fares, the fare box sll maers. It maers not simply because of the income it
generates but the eligibility it creates for other funds. While populaon maers, what
maers even more is the density of the populaon, which leads to the next factor –
design.
Land Use and Transportaon Policy. For public transportaon to be viable (frequent,
reliable and accessible), the design of the community is crical. Public transportaon
systems funcon well (or at least adequately) in dense, urban environments with a high
number of residents clustered together per square mile. Land use and zoning
regulaons determine density limits. The market ulmately determines density levels
within allowable parameters. Eecve public transportaon is dicult in suburban

DRAFT Lee County Human Services Gap Analysis
Secon Two: Infrastructure
Chapter 6 | Transportation Page | 106
communies with low density and dispersed clustering of residences. Lee County is a
suburban community.
Another design feature is the physical infrastructure. Transportaon infrastructure is
driven by transportaon policy. Roadways designed to allow, if not encourage,
suburban development result in low-density housing. In addion, they may not be
designed to facilitate bus use by not providing pull-os or ease-of-use features. Auto-
centric communies are designed for individual automove use, not mass transit of any
type. Another dimension to roadway design is that for buses to aract riders,
meliness maers. Dedicated lanes that allow buses to move rapidly, especially during
rush hours, can help gain ridership. However, unless these are designed in roadways
from the start, they may be impraccal from either a space perspecve or a nancial
perspecve. Parking requirements are another example of how policy can impact the
use of transit. Where parking is expensive or limited, there is a push to use transit.
Convenience. One of the cricisms of public transit is that it is not convenient. It takes
too long to get where you are going, or the hours of service are not convenient. This is
where a vicious cycle begins. There are not enough riders to add more lines or
frequency, so people do not ride. Fewer people ride, so it is hard to jusfy exisng
routes, much less new ones.
Context and Background: LeeTran and other Public Transport Providers
LeeTran is a department of Lee County government, responsible for operang the
public transit system that serves the County. It operates 26 bus routes, a paratransit
service for the disabled (called Passport – in compliance with the Americans with
Disabilies Act) and an employer van pool program.
LeeTran employs approximately 287 people and has a eet of 51 full-size buses, 12
trolleys, ve trams and 51 paratransit vans. Half of its full-size eet is hybrid, greatly
reducing carbon emissions and increasing fuel eciency.
Medicaid Clients. Medicaid clients may receive their Medicaid transportaon through
Good Wheels or a local Florida Managed Medical Assistance Provider (MMA),
depending on Medicaid program criteria. Good Wheels is a Medicaid Provider as well
as the designated Community Transportaon Coordinator (CTC) for Lee County (under

DRAFT Lee County Human Services Gap Analysis
Secon Two: Infrastructure
Chapter 6 | Transportation Page | 107
Florida Statute F.S. 427). In addion to Medicaid clients, other individuals who are
unable to provide for their own transportaon due to age, disability, or income may be
eligible for Transportaon Disadvantaged service.
Conclusion
LeeTran provides crical services both to the workforce and to many people who rely
on it to get to various services. LeeTran itself is exploring ways to expand ridership and
meet community needs. Examples include van pools for employers, updang the core
transit network, and smaller vehicles that can serve as a mobility-on-demand opon in
low-density areas. Some will prove to be eecve; others will not. This is all to be
encouraged and supported. However, any expectaon that Lee County will have a
public transportaon system comparable to those of major urban areas is unrealisc for
the near-term.
The end goal is not necessarily to have a system comparable to major urban areas (they
have issues too), but to have an eecve and usable system adapted for the needs and
goals of Lee County. The alternaves discussed below can be worked in conjuncon
with transit to reach this objecve in a realisc meframe.
The queson then becomes, what opons are there in addion to the connued
development of transit services? Those are discussed in the next secon. The purpose
of an alternaves discussion is to encourage service providers, who idenfy
transportaon as a signicant barrier for their clients, to consider opons that have the
potenal of lowering the demand placed upon clients to transport themselves and to
provide services in dierent ways.
Complementary Strategies for Further Enhancement Public Transportaon
Opons exist for service providers and employers with low-wage employees who rely
on public transportaon. None of these represents a full or total soluon to eliminate
the transportaon challenge. However, each could have some impact by making it
easier for their clients to obtain services.
Telepresence. Because of advances in technology, the provision of services through
some form of telepresence is becoming more feasible. While there are certainly cases

DRAFT Lee County Human Services Gap Analysis
Secon Two: Infrastructure
Chapter 6 | Transportation Page | 108
or treatments that require the physical presence of the person, services exist that can
be delivered remotely, alleviang the need for transportaon. There is currently an
emphasis on the expanded delivery of clinical services through telemedicine or the
broader management of health issues through telehealth
70
. Therapy and counseling
services are now delivered through online chat, video or phone by private providers
71
.
These services are being used in the areas such as domesc and family violence
72
,
substance abuse
73
, elder abuse
74
and vision impairment
75
. Psychiatric medicaon
adjustments are being provided remotely
76
. The ability for physical engagement is
another opon as telehealth now encompasses physical therapy treatments
77
, child
abuse
78
, evaluaons of domesc violence
79
and sexual assault
80
.
Given the gap in mental health services in the County, the potenal for service delivery
via telepresence technologies should be considered. This is parcularly true for special
populaons for whom the delivery of mental health services is challenging. One
example is the deaf populaon; scholars in deaf studies have long called for mental
health services to be delivered remotely.
81
With the spread of 5G capacity and an increasing knowledge base about the eecve
use of telepresence tools, clients’ transportaon needs could diminish.
Locaon of Services along Major Bus Routes. Service agencies locate for nancial or
space availability reasons. While these cannot be ignored, another decision factor
should be locaons along exisng public transportaon corridors. While it is obviously
not feasible to move enre agencies, it is more feasible to examine whether specic
services could be provided at these locaons while the administrave funcons are
70
www.healhtit.gov/topic/health-it-initiatives/telemedicine-and-tele-health. 2017
71
www.mdive.com/counseling
72
https://www.thehotline.orgr
73
https://mhealthintelligence.com
74
https://eldermistreatment.usc.edu
75
www.ncbi.nim.nih.gov
76
https://chironhealth.com
77
https://www.apta.org/practice&patientcare
78
https://pediatrics.asppublications.org/pediatrics/223.full.pdf
79
https://www.ncbi.nim.nih.gov/pubmed
80
https://safetcenter.psu.edu/new-technology-for-sexual-assault
81
Wilson, J. & Wells, M. 2009. Telehealth and the deaf: A comparison study. The Journal of Deaf Studies and
Educaon, 14(3): 386.402. hps://doi.org/10.1093/deafed/enp008

DRAFT Lee County Human Services Gap Analysis
Secon Two: Infrastructure
Chapter 6 | Transportation Page | 109
housed elsewhere. To the degree that locaons of these services could be coordinated
to minimize locaonal changes for the client, this also would serve to migate the
transportaon barrier.
Encouragement of Workforce Housing near Employment. The above two concepts
apply to the provision of human or health services. The other primary users of public
transport are low-wage employees who rely upon it for transport to work. There are
examples of employers who design housing into their development concept
82
. Land use
regulaons and zoning codes that allow or encourage such developments will reduce
the need for public transportaon.
Development of New Business Centers. The area along Interstate 75 and Southwest
Florida Internaonal Airport will be the locaon of future commercial development.
There is the potenal for 50,000 jobs in this area during the long-term. As this
develops, it will change the commung paerns in the County. It will also oer the
opportunity to provide workforce transportaon, broadening the customer base of
LeeTran. Planning a mul-modal transportaon network for the coming economic core
of the County will be an important element of future transportaon planning.
Locaon of services, workforce housing locaon and new business centers are policy
decisions in which transportaon impacts and opons should be a signicant factor.
These policy decisions impact populaon density and community design.
Gaps
The Needs / Capacity Gap. Due to factors of populaon design, community design and
consumer convenience, a gap exists between the current level of service and the level
of service that is desired by sectors of the community. This is the needs/capacity gap
that transportaon professionals connually seek to narrow.
The Transportaon Policy Gap. The other gap is one of policy. Planning and regulaons
that shape the future design of the community do not adequately incorporate public
transportaon planning into those plans and policies. Over me, this policy gap can
impact the Needs / Capacity Gap.
82
https://www.winknew.com/2018/12/14/develperplanningaffordalblehousing

DRAFT Lee County Human Services Gap Analysis
Secon Two: Infrastructure
Chapter 6 | Transportation Page | 110
Intenonally le blank.

DRAFT Lee County Human Services Gap Analysis
Secon Two: Infrastructure
Chapter 7 | Food Security and Nutrition Page | 111
CHAPTER 7
Food Security and Nutrion
Introducon
Common perceptions about food insecurity – episodic worries about the amount of
food in the refrigerator or uncertainty about what the next meal will be – sometimes
lead to incorrect conclusions about hunger and predictions that high percentages of
people are going to bed hungry. While some certainly do, it is important to interpret
the data correctly. This chapter addresses the link between food security and nutrition,
and it concludes with an explanation of how food security is measured in the United
States. The USDA itself states that “households can be classified as having very low food
security based on a single, severe episode during the year. Readers should be mindful of
this when interpreting food-insecurity statistics.”
83
Various programs will be reviewed that are intended to reduce food insecurity. These
programs aid families in relieving their food insecurity. They were never meant to be
the full source of food for a family. Therefore, if the programs are readily available and
all eligible people are participating, the question is whether there is a gap large enough
to direct more local resources to this problem.
This chapter analyzes data about food insecurity surveys, examines statistics about
nutrition-related outcomes and identifies sources and distribution systems for food and
expenditures for assistance. There are data issues that make this analysis challenging;
they also are discussed in the chapter.
The chapter concludes that food and nutrition services in Lee County were not identified
as having as significant a gap as other service areas. However, food is a daily need and
the conclusion does not mean there is no need to address food insecurity continually. It
is to acknowledge, that the scope of the community’s efforts make this area a less
serious one from the perspective of comparative gaps.
83
Household Food Security in the United States in 2018. U.S. Department of Agriculture

DRAFT Lee County Human Services Gap Analysis
Secon Two: Infrastructure
Chapter 7 | Food Security and Nutrition Page | 112
Context and Background
Both government and private programs address food security in the United States. The
dominant federal programs are the Supplemental Nutrion Assistance Program (SNAP -
commonly thought of as “food stamps”), Special Supplemental Nutrion Program for
Women, Infants and Children (WIC) and the Naonal School Lunch Program (NSLP),
along with other minor federal programs. The private sector addresses food security
and nutrion primarily through a variety of nonprot food banks and pantries run by
nonprots and religious instuons.
In 2018, 88.9% of U.S. households always had access to enough food for an acve,
healthy life for all household members. A study by the U.S. Department of Agriculture
categorized the remaining 11.1% of households, down from 11.8% in 2017, as food-
insecure for at least some period during the year. Of those, 4.3% had very low food
security, not signicantly dierent from 4.5% in 2017. These were households in which
the food intake of one or more members was reduced and their eang paerns
disrupted at mes because the household lacked money and other resources for
obtaining food. In 2018, prevalence of food insecurity declined to pre-recession (2007)
levels. Among children as a separate stascal group, changes from 2017 in food
insecurity and very low food security were not stascally signicant. Very low food
security among children was 0.6%. About 7.1% of U.S. households with both children
and adults were categorize as food insecure in 2018. In 2018, the typical food-secure
household spent 21% more on food than the typical food-insecure household of the
same size and household composion. About 56% of food-insecure households
parcipated in one or more of the three largest federal food and nutrion assistance
programs – SNAP, WIC or a school lunch program – during the month prior to the 2018
survey.
84
Lee County Data
During 2018 in the County, $10,165,356 in SNAP assistance (food stamps) was provided
to 43,590 households including 87,892 people. The average benet per person was
approximately $116, and the average household benet was $233 as of August 2019.
85
84
Household Food Security in the United States, 2018. U.S. Department of Agriculture, Economic Research Service.
85
https://www.fns.usda.gov/pd/snap-program

DRAFT Lee County Human Services Gap Analysis
Secon Two: Infrastructure
Chapter 7 | Food Security and Nutrition Page | 113
In Florida during 2017, 468,867 women and children parcipated in the WIC program.
86
WIC funding in Lee County in 2018 provided food and associated services at a monthly
cost of $732,958, or an annualized esmate of $8,795,495.
87
The average WIC food cost
per person per month was approximately $49
88
. That year, 15,066 people received WIC
assistance and 22,874 were eligible; the Lee County parcipaon rate was 65.9%. The
state of Florida parcipaon rate was 67.8%.
89
Various explanaons have been oered
as to why one-third of eligible parcipants does not take advantage of the WIC
program. These explanaons include a lack of knowledge about eligibility, mis-
understanding of the program, avoiding the perceived shame of welfare, transportaon
barriers and income variaons that could preclude eligibility at some points.
During 2018, 21.8% of Lee County adults “often” or “sometimes” worried about
whether their food would run out before they had money to buy more, based on USDA
survey data. This same study reports that an additional 18.1% “often” or “sometimes”
in the past year experienced a lack of food with no money to buy more.
90
Table 43 presents 15 nutrion-related outcomes for Lee County. On 10 indicators that
address consumpon of healthy food and weight issues, Lee County was within 10% of
the Florida averages. (Please refer to appendix K for an explanaon of this
methodology). In four categories, Lee County had outcomes that diered from the state
averages by more than 10%. These outliers include:
The percentage of underweight adults – at 3.3% in Lee County, that’s one
person-per-hundred more than the state average. While the percentage
difference is large, the numerical difference is not;
Obese persons – at 31.2% in Lee, that’s four people-per-hundred more than the
state average;
Births to obese mothers at the time of pregnancy – at 29.24%, that’s three more
pregnant women per-100 than the state average; and
Overweight high school students – at 5.2%, Lee County has one more
overweight high schooler per-hundred than the state average.
86
National WIC Association. 2019-fl-wic-fact-sheet.pdf. www.nwlca.org
87
https://www.fns.usda.gov/pd/wic-program
88
ibid
89
www.flhealthcarts.com/charts/otherindicators/nonvital
90
Lee County Health Needs Assessment, Lee Health
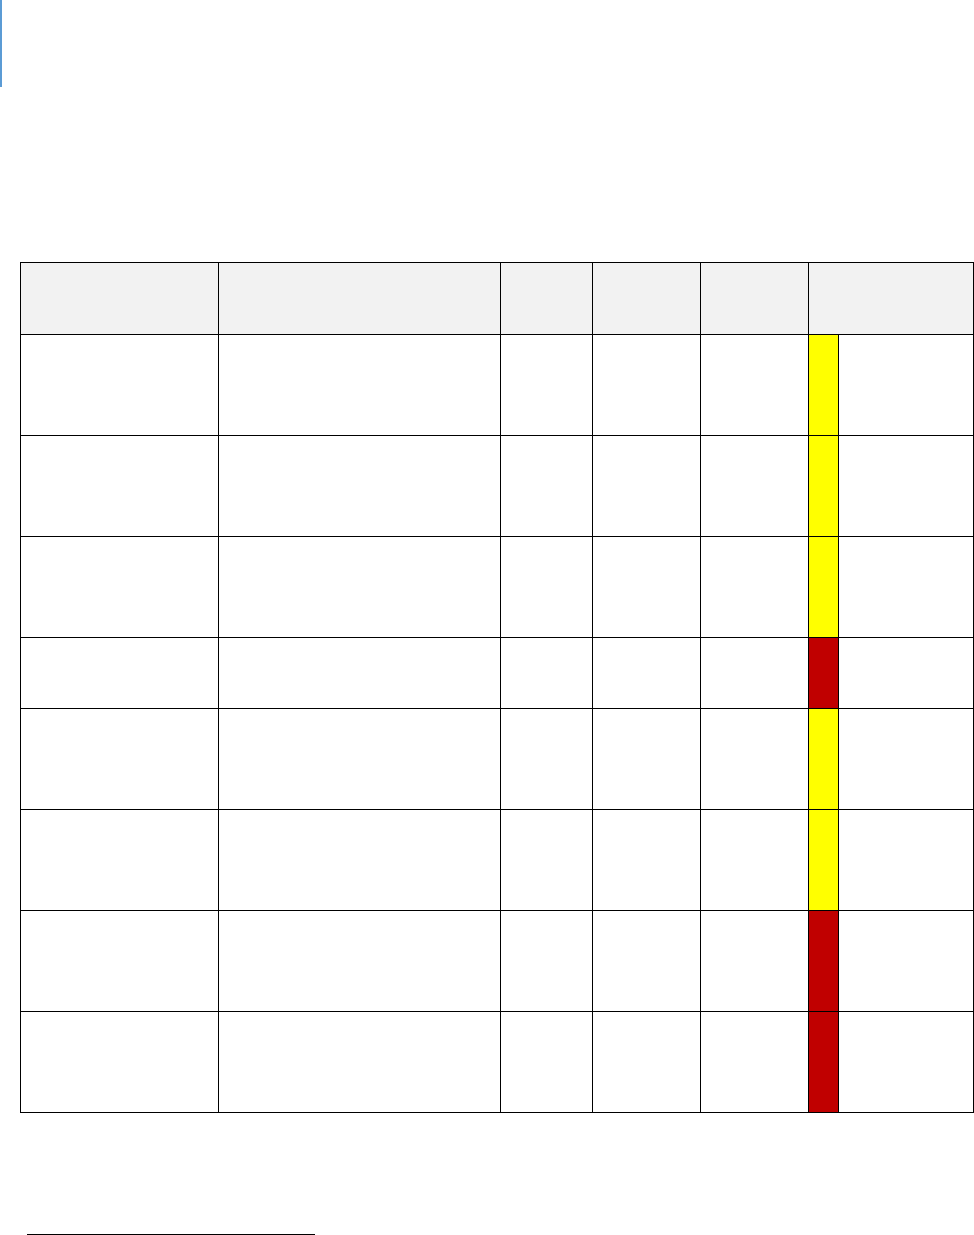
DRAFT Lee County Human Services Gap Analysis
Secon Two: Infrastructure
Chapter 7 | Food Security and Nutrition Page | 114
While higher rates of being over- or under-weight can be related to food intake, they
also are inuenced by other variables and may not relate directly to food insecurity.
Table 43. Comparison of Nutritional Related Outcomes
Sources
Data Title
Year
Lee
County
State
Comparison
to State
Healthiest
Weight Prole
91
Adults who consume at
least 5 servings of fruits
and vegetables a day
2013
17.9%
18.3%
Within
10%
average
Healthiest
Weight Prole
Adults who are
sedentary
2016
27.8%
29.8%
Within
10%
average
Healthiest
Weight Prole
Adults who are at a
healthy weight
2016
31.5%
34.5%
Within
10%
average
Healthiest
Weight Prole
Adults who are
underweight
2016
3.3%
2.3%
Worse
Healthiest
Weight Prole
Adults who are
overweight
2016
37.7%
35.8%
Within
10%
average
Healthiest
Weight Prole
Adults who are obese
2016
27.5%
27.4%
Within
10%
average
Community
Health Needs
Assessment
92
%Obese (BMI 30+)
2017
31.2%
26.8%
Worse
Maternal and
Child Health
93
Obesity (Births to Obese
Mothers at me
Pregnancy Occurred)
2018
29.24%
26.20%
Worse
91
Florida Health Charts,
http://www.flhealthcharts.com/ChartsReports/rdPage.aspx?rdReport=ChartsProfiles.HealthiestWeightCountyProfi
le
92
2017 Community Health Needs Assessment Report; Lee Health and FL Dept of Health in Lee County
93
http://www.flhealthcharts.com/charts/DataViewer/BirthViewer/BirthViewer.aspx?cid=0606
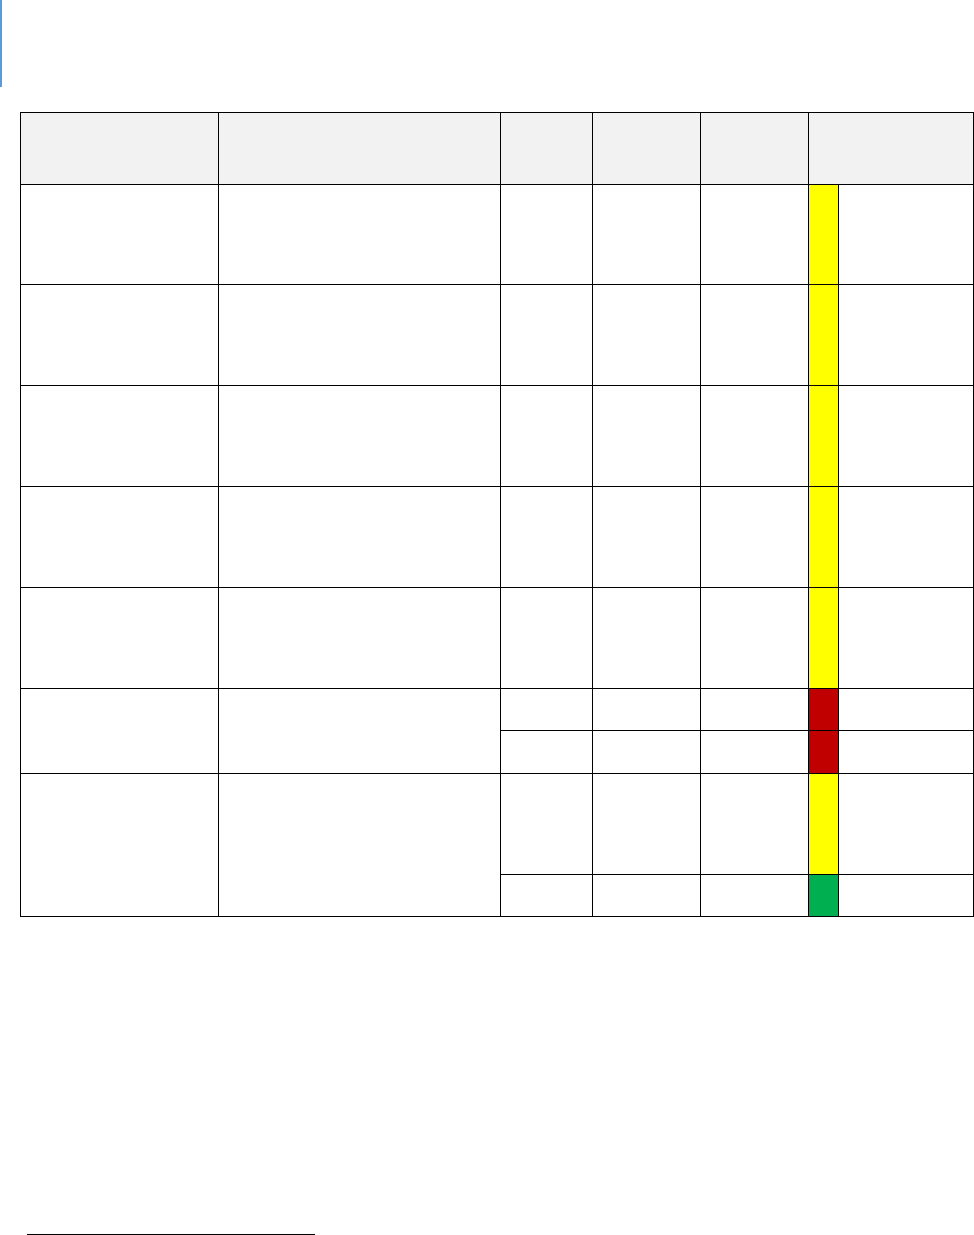
DRAFT Lee County Human Services Gap Analysis
Secon Two: Infrastructure
Chapter 7 | Food Security and Nutrition Page | 115
Sources
Data Title
Year
Lee
County
State
Comparison
to State
WIC Children
94
Obesity (WIC children
>=2 who are overweight
or obese)
2018
28.95%
27.10%
Within
10%
average
Healthiest
Weight Prole
Middle and high school
students who are at a
healthy weight
2016
66.7%
66.4%
Within
10%
average
Healthiest
Weight Prole
Middle and high school
students who are
overweight
2016
15.3%
16.3%
Within
10%
average
Healthiest
Weight Prole
Middle and high school
students who are obese
2016
13.2%
13.0%
Within
10%
average
Healthiest
Weight Prole
Middle and high school
students who are
underweight
2016
4.8%
4.2%
Within
10%
average
Child Health
Status
95
High School students
who are underweight
2016
4.7%
3.6%
Worse
2018
5.2%
4.2%
Worse
Child Health
Status
96
Middle School students
who are underweight
2016
5%
5.2%
Within
10%
average
2018
3.6%
4.7%
Beer
94
http://www.flhealthcharts.com/charts/OtherIndicators/NonVitalIndRateOnlyDataViewer.aspx?cid=0679
95
Florida Health Charts, Child Health Status
http://www.flhealthcharts.com/ChartsReports/rdPage.aspx?rdReport=ChartsProfiles.ChildHealthStatusProfile
96
Florida Health Charts, Child Health Status
http://www.flhealthcharts.com/ChartsReports/rdPage.aspx?rdReport=ChartsProfiles.ChildHealthStatusProfile
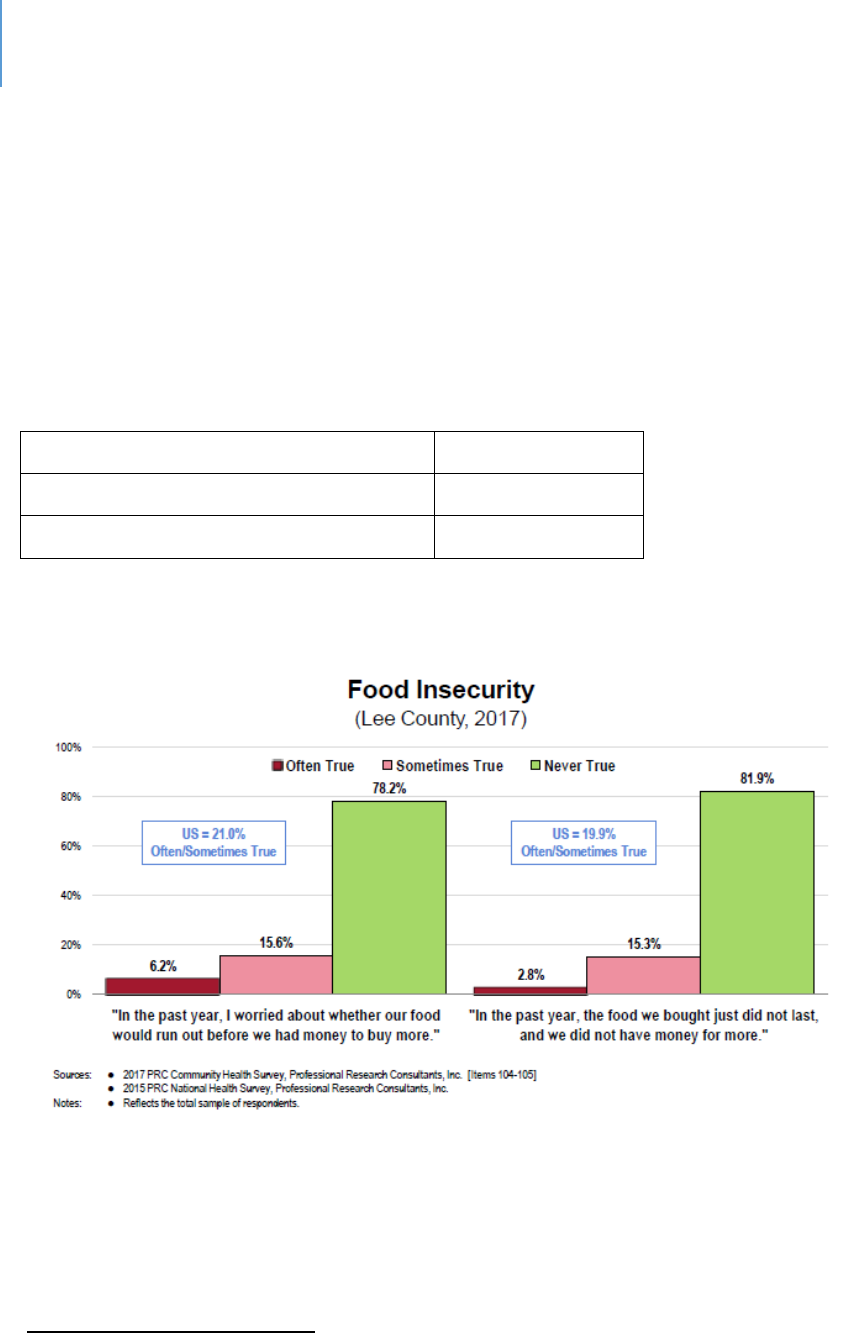
DRAFT Lee County Human Services Gap Analysis
Secon Two: Infrastructure
Chapter 7 | Food Security and Nutrition Page | 116
Table 44 and Figure 4 show the levels of food insecurity in the County. As Figure 4
shows, data for Lee County are similar to naonal data on the queson of worry
regarding food availability but has a lower percentage of residents whose food did not
last unl more food could be purchased. Extrapolaons from Table 44 suggests 12% to
15% of the total populaon and 4% of children provided responses that indicate they
are food insecure. At the naonal level, about 20-21% of households provide responses
that indicate food insecurity.
Table 44. Food Insecurity in Lee County
97
Populaon
700,165
Overall Food-Insecure Populaon
86,050
Food-Insecure Children
26,400
Figure 4. Food Insecurity
Florida ranks 48th out of 50 states for highest percentage of households receiving food
stamps at 2.3%. Only Alabama and Delaware, at 2.9%, had a higher percentage of their
populaon receiving food stamps. The study is based on 7,510,882 Florida households
that reported whether food stamps were received. 1,587,429 households in Florida
97
Harry Chapin Food Bank

DRAFT Lee County Human Services Gap Analysis
Secon Two: Infrastructure
Chapter 7 | Food Security and Nutrition Page | 117
received food stamps in 2018, of which 43,590 were in Lee County.
98
There are stated
concerns that the receipt of food stamps is no guarantee of food security since the per
meal amount is limited. Again, these programs were never designed to be other than
supplementary.
The System of Food Security in Lee County
Governmental Assistance: SNAP, WIC, School Lunch
The Florida Department of Children and Families and the Department of Elder Aairs
administer the SNAP “food stamp” program here. The Florida Department of Health
administers WIC, the program for woman, infants and children. The Naonal School
Lunch Program is administered by the USDA via local school systems. Some households
may parcipate in mulple programs.
The Florida Department of Elder Aairs
Elder Affairs provides technical assistance to help Older Americans Act nutrition
providers and USDA program providers to deliver quality services. In addition to the
state’s Congregate and Home Delivered Meals program, the unit administers the
following federally funded programs:
Adult Care Food Program
This program assists eligible Adult Care Centers and Mental Health Day Centers in
providing meals to elders. Eligibility extends beyond seniors (60 or older) to people
age 18 or older with a funconal disability.
Senior Farmers’ Market Nutrion Program
This program improves the nutrional health of low-income elders by providing
coupons that can be redeemed for locally grown fresh fruits and vegetables at
approved farmers’ markets.
98
www.fns.usda.gov/pd/supplemental-nutrition-assistance-program-snap

DRAFT Lee County Human Services Gap Analysis
Secon Two: Infrastructure
Chapter 7 | Food Security and Nutrition Page | 118
Nutrion Services Incenve Program (NSIP)
The NSIP reimburses Area Agencies on Aging and service providers for the costs of
congregate and home-delivered meals through a supplement of approximately
$0.72 per meal as of 2015. Younger adults with disabilies also can be included.
Supplemental Nutrition Assistance Program (SNAP)
Formerly known as the food stamp program, this is for seniors (60 or older) and is
administered through Elder Affairs.
Charitable Assistance
The Harry Chapin Food Bank collects and distributes food through more than 120
partner providers. Food pantries are open daily in Lee County. Every week about
28,000 people are fed through partner agencies and mobile pantries. The system works
through several corporate contributors and extensive volunteer parcipaon.
Harry Chapin provides in-school pantry programs and food kits at places where pantries
are not present. The kits provide an average of 15 meals for a family. It also oers
mobile pantries to make access easier.
In addion to Harry Chapin, other organizaons in the community oer food pantries
that distribute food from Harry Chapin as well as donaons from their own members.
In addion to food pantries, several enes provide meals to needy people including
the homeless. A board network of organizaons oering food opons exist.
Nutrional Educaon
In addion to the provision of food, there are eorts to educate the community about
nutrion, wellness and nancial management to assist in ensuring food security. The
leader in this eort is the Instute for Food and Agricultural Sciences (IFAS) local
extension oce.

DRAFT Lee County Human Services Gap Analysis
Secon Two: Infrastructure
Chapter 7 | Food Security and Nutrition Page | 119
Gaps in Food Security
Food Quality
A key term in the USDA food security framework is “balanced meals.” This includes
protein, carbohydrates, vegetables and fruit. At mes with respect to food banks, fruit
and vegetables are limited, with the preponderance of donated food being highly
processed food that can be easily stored. At other mes, fresh produce is provided
when seasonably available. Harry Chapin at mes has 24% of its food in fresh produce
form. However, food kits rounely include non-fresh items, such as canned vegetables
and canned meat, cereal, spaghe, macaroni and cheese, soups and stews, peanut
buer, jelly, pasta, rice and beans. Fresh food is rarely supplied.
Fresh food can be purchased with food stamps. Emphasizing this is encouraged by
educaonal programs. It is emphasized in the Florida Fresh eorts of the Florida
Department of Agriculture, which promotes the use of fresh Florida food.
The data do not exist to determine what proporon of food assistance in the County
could be considered as providing balanced meals. It is not unreasonable to assume that
the proporon is less than preferred, primarily due to challenges in storing fresh food
for later distribuon.
Recommended diets and food models are provided through USDA and IFAS.
Food Quanty
As Table 44 indicates, more than 86,000 people are food insecure. More than 26,000 of
them are children. It is esmated that 15% of these are seniors.
99
The purpose of a gap
analysis is to understand what these numbers mean on a praccal basis. If they mean,
for example, that 26,000 children in Lee County go to bed hungry daily, then there is a
community crisis. However, this gure does not indicate that at all.
The challenge in understanding the actual human implicaons of these numbers lies in
the USDA’s methodology as presented below in the denions secon. Take the
99
www.harrychapin.org

DRAFT Lee County Human Services Gap Analysis
Secon Two: Infrastructure
Chapter 7 | Food Security and Nutrition Page | 120
quesons about children, for example. Several of the quesons ask if a food-shortage
condion ever existed in the last 12 months. For some quesons, the response choices
are yes/no. For others, it is oen/somemes/never. There are two problems in trying
to interpret these data. For the yes/no quesons, there is a vast dierence between
someone who experiences a shortage condion once or twice a year compared with
someone who experiences that condion monthly or weekly. For the
oen/somemes/never, what may be “oen” to one person could be “somemes” for
another.
This crique is not to deny the existence of food shortages, nor is it to imply that our
societal goal of food shortages not occurring is invalid. However, it is to point out that
determining the actual scope of the shortage is dicult based on this data. If one were
trying to determine the actual size of the gap and the appropriate level of response,
data that are more granular would be useful.
Esmang Scope of Food Insecurity in Lee County – A Hypothesis
To esmate actual scope, the following hypothesis will be tested:
People receiving SNAP or WIC are not food-insecure, therefore no food
insecurity exists in Lee County.
Some key facts for use in tesng this hypothesis include:
USDA reports that in 2018, 88.9% of U.S. households had access at all times to
enough food for an active, healthy life for all household members. This is a valid
percentage because these people never responded affirmatively to any of the
USDA survey questions.
Lee County’s population will be estimated at 739,506 for purpose of this
experiment.
This means that 654,753 people in Lee County were food secure and 84,753 are
estimated to be food insecure at some level. This is consistent with the 86,000-
person estimate reported in Table 44.

DRAFT Lee County Human Services Gap Analysis
Secon Two: Infrastructure
Chapter 7 | Food Security and Nutrition Page | 121
87,892 people received food stamps, and another 15,066 received WIC benefits.
There may be overlaps in this number but that cannot be determined from the
available data sources. For this analysis, the numbers will be calculated as non-
duplicative. This means 102,958 people received food assistance. In addition,
there were school meals.
When SNAP and WIC funds are combined, a total of nearly $19 million was
provided to purchase food.
Breakfast and lunch are free of charge at all 79 traditional Lee County public
schools for the 2019-2020 school year. This will be the second school year both
meals are being provided to all students through the Food and Nutrition Services
Department Community Eligibility Program (CEP).
100
The School District of Lee County Food Service Budget is $72 million. The food
service program of the School District of Lee County is supported by federal and
state funds and through meal charges to adults and students. Federal and State
funding programs include National School Lunch Program, School Breakfast
Program and the Summer Lunch Program.
101
Rejecon of the Hypothesis
The hypothesis is that people receiving SNAP or WIC are not food-insecure,
therefore there is no food insecurity in Lee County. This most likely is a
fallacious hypothesis given the regular use of food banks.
Explanations for why the hypothesis was rejected.
How can the fact that the total of 654,753 self-reported food secure plus
the 112,958 SNAP/WIC people equal 767,711 people, exceeding the
County population? Here are some possible explanations:
SNAP/WIC do not equate to food security.
100
School District of Lee County, https://www.leeschools.net/news/2019-
2020/august_2019/breakfast_and_lunch_to_be_free_at_all_schools
101
LCSD Final Budget 2019-2020 https://www.leeschools.net/common/pages/DisplayFile.aspx?itemId=24269200

DRAFT Lee County Human Services Gap Analysis
Secon Two: Infrastructure
Chapter 7 | Food Security and Nutrition Page | 122
The average per-person per-month benefit was $48.95 in 2018.
The average SNAP benefit in 2018 was $115.55. The average
household benefit for SNAP was $233.20.
WIC only reports per-person data. If a three-person household is
presumed, the benefit would be $146.85.
The USDA thrifty food plan, which is designed for people on
benefits, recommends differing budgets for different ages with
monthly ranges for individual adults from $159 per month to
$186. For two-person families, the range is $367 to $386; for
four-person families it is $564 to $647.
102
Clearly SNAP/WIC programs aid, but do not equate to food
security on their own. It should be noted, however, these
programs were never intended to be more than assistance.
The proportion of income that lower-income families spend on food is
higher than higher-income families.
Table 45 presents a national data estimation. The purpose of this
table is not to present verified data specific to Lee County. Rather
it is simply to demonstrate that it is logical that poorer people
would spend a higher proportion of their income on food because
one can only consume so much food. Higher income people may
consume more expensive food or dine out more often and at
more expensive restaurants, but there is still a limitation;
The lowest income quintile likely is also the cost-burdened for
housing. Combining the 35% of income spent on food with 30%
to 40% for housing, cost-burdened families are devoting 65% to
75% of their income to food and housing alone. Even at the next
quintile level, budgeting 19% for food and 30% for housing leaves
half of income for all other expenses.
102
www.usda.gov
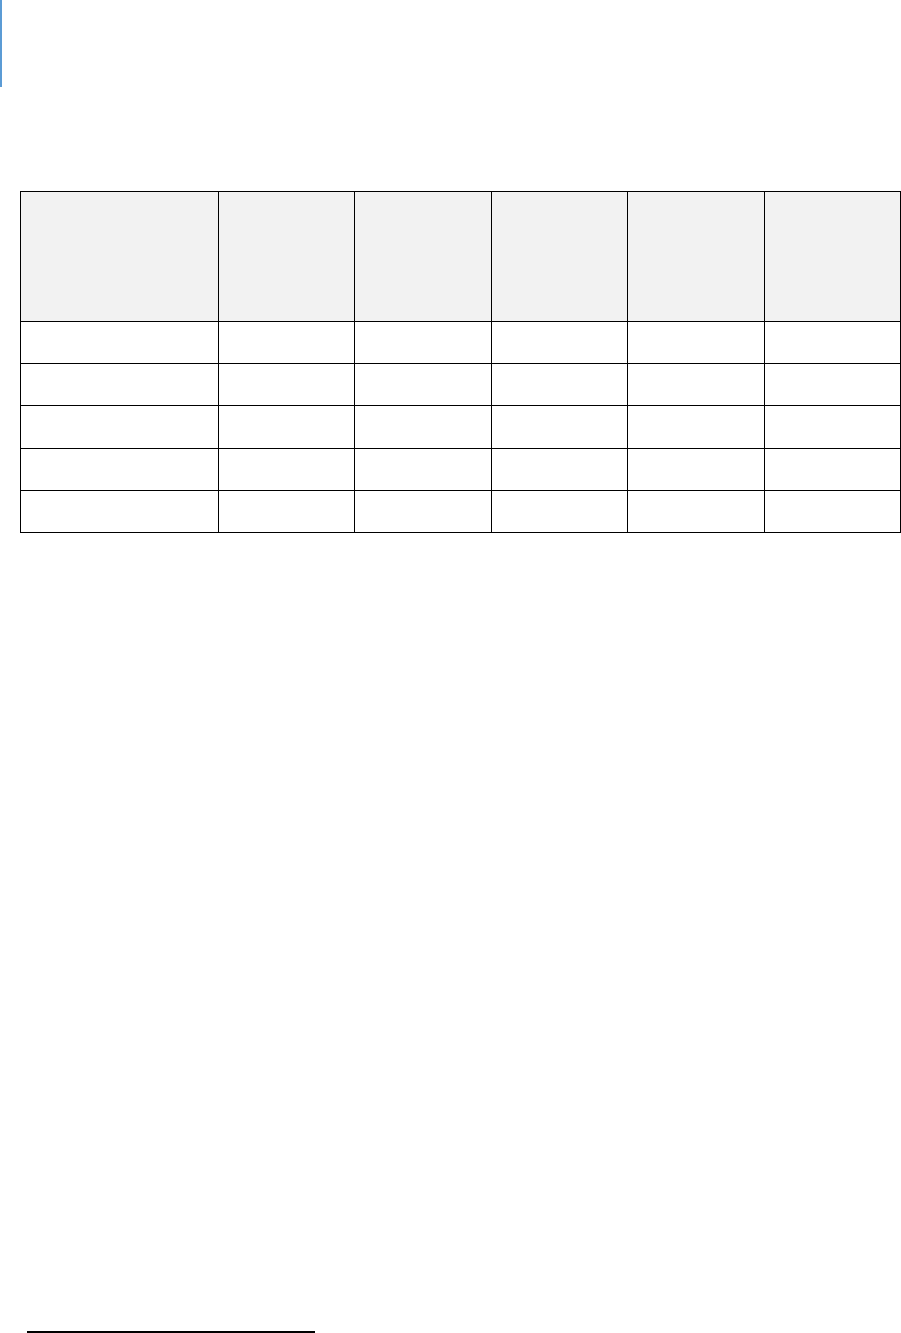
DRAFT Lee County Human Services Gap Analysis
Secon Two: Infrastructure
Chapter 7 | Food Security and Nutrition Page | 123
Table 45. Percentage of Income Spent on Food by Quintiles
103
Income Quinle
Average
Annual
Income
Groceries
Dining
Out
Total
Food
Percent of
income
spent on
food
Lowest 20%
$11,394
$2,582
$1,488
$4,070
35.72%
Next 20%
$29,821
$3,622
$2.049
$5,671
19.02%
Third 20%
$52,431
$4,038
$3,023
$7,061
13.47%
Fourth 20%
$86,363
$4893
$3,863
$8,756
10.14%
Top 20%
$188,103
$6,677
$6,402
$13,079
6.95%
Gaps
Based on this analysis, it is reasonable to conclude that approximately at least 20% of
Lee County households are challenged each month to meet their basic needs for
shelter, ulies, food and transportaon. Table 46 presents the basis for this conclusion.
Each family priorizes the needs that will be met each month and one can presume that
a need other than food is somemes priorized. While all families priorize, not all
families have to choose between having the money to buy food or having enough
money to pay the rent. For 20% of Lee County households, this choice could occur
occasionally.
Given the vagueness of how food insecurity is measured combined with the signicant
amount of public funds commied to providing food, it is dicult to accurately state
the size or signicance of a gap in food security in the County. The fact that 20% of
households are cost-burdened to meet all their costs for housing, transportaon and
food would lend credence to the posion that there is a food security gap. The number
of individuals fed via the Harry Chapin food bank also lends credence to the possibility
that some people need food assistance. In Southwest Florida (including Charloe,
Collier, Glades, Hendry and Lee counes), Harry Chapin feeds about 28,000 persons per
week and esmate about 151,000 people struggle to provide food for themselves.
103
www.thestreet.com

DRAFT Lee County Human Services Gap Analysis
Secon Two: Infrastructure
Chapter 7 | Food Security and Nutrition Page | 124
Presuming populaon proporons among counes, Lee County residents would be a
substanve proporon of these people. Harry Chapin reports that most of its clients
are working families.
104
While acknowledging the good work of Harry Chapin and its many community partners,
one can argue that the combinaon of private actors and public food funds either
eliminate or reduce to a low level actual food insecurity in the county. Since food is
needed daily, the need for private contribuons and connued public funding does not
go away. But what it does mean is that Lee County has successfully established a
system of food supply so that food insecurity in the County is not a major gap.
Table 46. Estimation of Severe Financial Constraint*
Income
Group
Monthly
Rent at
30%
housing
cost
% of
Households
in this
income
range
% of
Rental
Units
in this
Range
Low
Esmated %
of
Households
Severe cost-
burdened
(50%) for
housing
Esmated %
of Income
Spent on
Food
Total %
for
Housing
& Food
Under
$10,000
Under
$250
7.8
1
5
35%
85%
$10,000-
$24,999
$251-
625
21.1
3.7
15
25%**
75%
*This table is constructed from Table 38 of chapter 5 on housing and Table 45 of this chapter.
** The combinaon of these two incomes groups crosses the lowest and next-lowest income
quinles in which food percent ranges from 19% to 35%. 25% was selected as a deliberately
conservave esmate, although more than half of the 10,000 to 25,000 income group would
fall into the lowest quinle in which 35% of income is spent on food.
104
www.harrychapin.org

DRAFT Lee County Human Services Gap Analysis
Secon Two: Infrastructure
Chapter 7 | Food Security and Nutrition Page | 125
Conclusion
After analyzing data about food insecurity surveys, examining statistics about nutrition-
related outcomes, identifying sources and distribution systems for food and
expenditures for assistance, it can be stated that food and nutrition services in Lee
County were not identified as having as significant of a gap as other service areas.
However, food is a daily need and the conclusion does not mean there is no need to
address food insecurity continually. Rather it is to acknowledge the scope of the
community’s efforts make this area a less serious one from the perspective of a gap.
Denions and Measurement
Food Security discussions oen are based on the Department of Agriculture’s Food
Security Survey. For these discussions to be producve, they must be based on an
understanding of the method of the study and how food insecurity is dened. The
following are direct quotes from the USDA study.
105
“How Was the Study Conducted?
Data for the ERS food security reports come from an annual survey conducted by the
U.S. Census Bureau as the December supplement to the monthly Current Populaon
Survey. ERS sponsors the annual Food Security Supplement survey, compiles and
analyzes the responses. The 2018 survey covered 37,300 households, comprising a
representave sample of about 130 million U.S. households. The survey asked one adult
respondent per household quesons about experiences and behaviors that indicate
food insecurity during the calendar year, such as being unable to aord balanced meals,
cung the size of meals, or being hungry because of too lile money for food. The food
security status of the household was assigned based on the number of food-insecure
condions reported.
105
Household Food Security in the United States in 2018. U.S. Department of Agriculture.

DRAFT Lee County Human Services Gap Analysis
Secon Two: Infrastructure
Chapter 7 | Food Security and Nutrition Page | 126
How was Food Security determined?
Responses to the 18 food security quesons are reported in tables S-5 to S-6 of the
Stascal Supplement (Coleman-Jensen et al., 2019). The food security status of each
interviewed household is determined by the number of food-insecure condions and
behaviors the household reports. Households are classied as food secure if they report
no food-insecure condions or only one or two food-insecure condions. Food-insecure
condions are indicated by responses of “oen” or “somemes” to quesons 1-3 and
11-13; “almost every month” or “some months but not every month” to quesons 5, 10
and 17; and “yes” to the other quesons. They are classied as food insecure if they
report three or more food-insecure condions, based on quesons 1-10 for households
without children and quesons 1-18 for households with children. Households are
classied as having food-insecure children if they report two or more food-insecure
condions among the children in response to quesons 11-18.
Food-insecure households are further classified as having either low food security or
very low food security. The very low food security category identifies households in
which the food intake of one or more members was reduced and eating patterns
disrupted because of insufficient money and other resources for food. Households
without children are classified as having very low food security if they report six or more
food-insecure conditions (based on questions 1-10). Households with children age 0-17
are classified as having very low food security if they report eight or more food-insecure
conditions among adults and/or children (based on questions 1-18). They are further
classified as having very low food security among children if they report five or more
food-insecure conditions among the children (that is, if they respond affirmatively to
five or more of questions 11-18).”
The Food Security Quesons in the CPS Food Security Supplement
The quesons of the survey are listed below.
1. We worried whether our food would run out before we got money to buy more.”
Was that oen, somemes, or never true for you in the last 12 months?
2. “The food that we bought just didn’t last and we didn’t have money to get more.”
Was that oen, somemes, or never true for you in the last 12 months?

DRAFT Lee County Human Services Gap Analysis
Secon Two: Infrastructure
Chapter 7 | Food Security and Nutrition Page | 127
3. “We couldn’t aord to eat balanced meals.” Was that oen, somemes, or never
true for you in the last 12 months?
4. In the last 12 months, did you or other adults in the household ever cut the size of
your meals or skip meals because there wasn’t enough money for food? (Yes/No)
5. (If yes to queson 4) How oen did this happen—almost every month, some months
but not every month, or in only 1 or 2 months?
6. In the last 12 months, did you ever eat less than you felt you should because there
wasn’t enough money for food? (Yes/No)
7. In the last 12 months, were you ever hungry, but didn’t eat, because there wasn’t
enough money for food? (Yes/No)
8. In the last 12 months, did you lose weight because there wasn’t enough money for
food? (Yes/No)
9. In the last 12 months, did you or other adults in your household ever not eat for a
whole day because there wasn’t enough money for food? (Yes/No)
10. (If yes to queson 9) How oen did this happen—almost every month, some
months but not every month, or in only 1 or 2 months?
(Quesons 11-18 were asked only if the household included children age 0-17)
11. “We relied on only a few kinds of low-cost food to feed our children because we
were running out of money to buy food.” Was that oen, somemes, or never true
for you in the last 12 months?
12. “We couldn’t feed our children a balanced meal, because we couldn’t aord that.”
Was that oen, somemes, or never true for you in the last 12 months?
13. “The children were not eang enough because we just couldn’t aord enough
food.” Was that oen, somemes, or never true for you in the last 12 months?
14. In the last 12 months, did you ever cut the size of any of the children’s meals
because there wasn’t enough money for food? (Yes/No)
15. In the last 12 months, were the children ever hungry but you just couldn’t aord
more food? (Yes/No)
16. In the last 12 months, did any of the children ever skip a meal because there wasn’t
enough money for food? (Yes/No)
17. (If yes to queson 16) How oen did this happen—almost every month, some
months but not every month, or in only 1 or 2 months?

DRAFT Lee County Human Services Gap Analysis
Secon Two: Infrastructure
Chapter 7 | Food Security and Nutrition Page | 128
18. In the last 12 months did any of the children ever not eat for a whole day because
there wasn’t enough money for food? (Yes/No)
Coding of Responses
Quesons 1-3 and 11-13 are coded as armave (i.e., possibly indicang food
insecurity) if the response is “oen” or “somemes.” Quesons 5, 10, and 17 are coded
as armave if the response is “almost every month” or “some months but not every
month.” The remaining quesons are coded as armave if the response is “yes.”
Assessing Food Security Status in Households without Children
Households without children are classied as food insecure if they report three or more
indicaons of food insecurity in response to the rst 10 quesons; they are classied as
having very low food security if they report six or more food-insecure condions out of
the rst 10 quesons.
Assessing Food Security Status in Households with Children Age 0-17
Households with children are classied as food insecure if they report three or more
indicaons of food insecurity in response to the enre set of 18 quesons; they are
classied as having very low food security if they report eight or more food-insecure
condions in response to the enre set of 18 quesons.
The food security status of children in the household is assessed by responses to the
child-referenced quesons (quesons 11-18). Households reporng two or more of
these condions are classied as having food insecurity among children. Households
reporng ve or more are classied as having very low food security among children.”
What Is “Very Low Food Security”?
“Very low food security can be characterized in terms of the condions that households
in this category reported in the food security survey. Households without children
classied as having very low food security reported six or more food-insecure
condions, and households with children reported eight or more food-insecure
condions, including condions among both adults and children. Thus, the condions
reported by respondents reect the denion of “very low food security”: at mes
during the year, the food intake of household members was reduced and their normal
eang paerns were disrupted because the household lacked money and other
resources for food. In the 2018 survey, households classied as having very low food
security (represenng an esmated 5.6 million households naonwide) reported the
following specic condions:”

DRAFT Lee County Human Services Gap Analysis
Secon Two: Infrastructure
Chapter 7 | Food Security and Nutrition Page | 129
98% reported having worried that their food would run out before they got money
to buy more.
97% reported that the food they bought just did not last and they did not have
money to get more.
96% reported that they could not afford to eat balanced meals.
97% reported that an adult had cut the size of meals or skipped meals because there
was not enough money for food; 90% reported that this had occurred in three or
more months.
94% reported that they had eaten less than they felt they should because there was
not enough money for food.
69% reported that they had been hungry but did not eat because they could not
afford enough food.
47% reported having lost weight because they did not have enough money for food.
32% reported that an adult did not eat for a whole day because there was not
enough money for food; 25% reported that this had occurred in three or more
months.
106
As noted above, all households without children classied as having very low food
security reported at least six of these condions. Most households with very low food
security, 70%, reported seven or more food-insecure condions. (Condions reported by
households with children were like those without children, but the reported food-
insecure condions of both adults and children were considered.)
Episodic vs Constant Food Insecurity.
“The survey found that the resulng instances of reduced food intake and disrupted
eang paerns are usually occasional or episodic, but not usually constant. The food
security measurement methods used in this report are designed to register these
occasional or episodic occurrences. The quesons used to assess households’ food
security status ask whether a condion, experience, or behavior occurred at any me in
the past 12 months and households can be classied as having very low food security
106
Source: USDA, Economic Research Service using data from U.S. Department of Commerce, U.S. Census
Bureau,

DRAFT Lee County Human Services Gap Analysis
Secon Two: Infrastructure
Chapter 7 | Food Security and Nutrition Page | 130
based on a single, severe episode during the year. Readers should be mindful of this when
interpreng food-insecurity stascs. Analyses of addional informaon collected in the
food security survey on how frequently various food-insecure condions occurred during
the year, whether they occurred during the 30 days prior to the survey, and, if so, in how
many days provide insight into the frequency and duraon of food insecurity in U.S.
households.

DRAFT Lee County Human Services Gap Analysis
Secon Two: Infrastructure
Chapter 8 | Employment Page | 131
CHAPTER 8
Employment
Introducon
The value and importance of employment are self-evident. However, one or more
barriers to employment may exist. These include:
Transportation. As discussed previously, transportation difficulties in getting to
work can affect an employee’s reliability. For some people, getting to work may
be challenging because of the lack of viable transportation options.
Child-care. The hours of child-care available, or the reliance upon private
individuals to provide child-care, may make it difficult to work certain hours
during the workday. This can lead to being labeled as unreliable.
Lack of a High School Diploma. The issue of dropping out of school has been
discussed in other chapters. The lack of a high school diploma creates gaps in
opportunities.
Substance Abuse History. As with a lack of a high school diploma, a history of
substance abuse creates opportunity gaps and bias issues.
Mental Health History. As with substance abuse, a history of mental illness can
result in a spotty work history, questions of reliability and a prejudice against
employing such individuals.
Physical Disabilities. These disabilities can make some jobs unfeasible. In other
cases, employers may question the ability of a physically disabled person to do
the job.
Intellectual and Developmental Disabilities. These disabilities limit employment
options for obvious reasons. However, other factors such as employer bias,
parental concerns and potential gaps in appropriate employment settings also
limit employment opportunities.
Criminal Record. This precludes certain jobs and therefore creates opportunity
gaps. Employer bias can also be a factor.
Homelessness. The lack of a physical address or other types of documentation
can be an employment barrier. Services provided by the Homeless Continuum of
Care attempt to address this issue.

DRAFT Lee County Human Services Gap Analysis
Secon Two: Infrastructure
Chapter 8 | Employment Page | 132
The barriers listed above may aect an employee’s reliability or an employer’s
percepon of their reliability.
The System-of-Care
A variety of State and local agencies exist with a mission that includes addressing
employment opportunies. These agencies include:
Florida Division of Vocational Rehabilitation (FDVR). The FDVR is a federal-state
program that helps people with physical or mental disabilities get, or keep, a job.
The School District of Lee County can refer to FDVR.
Florida Division of Blind Services. This agency provides a variety of services to
blind and visually impaired persons including employment services in
conjunction with FDVR.
Florida Agency for Persons with Disabilities. This state agency supports persons
with developmental disabilities with a variety of services, including employment.
Southwest Florida Workforce Development Board, Inc. (DBA CareerSource
Southwest Florida) serves a five-county region including Lee County. It
administers federal and state funds designated for employment and training
services for individuals and for new or expanding businesses. It assists in
employment searches, skills training in some cases and employability skills
workshops.
GED. The School District of Lee County Adult Education Program provides GED
classes throughout the county.
Career and Technical Education. The Adult and Career Education of the School
District of Lee County provide programs in 18 clusters, all of which are
employment clusters in the County.
Technical Colleges. There are several technical colleges that provide career
training such as Fort Myers Technical College and Southern Technical College.
Public Academic institutions. Florida Gulf Coast University and Florida
SouthWestern State College offer a broad range of academic offerings.

DRAFT Lee County Human Services Gap Analysis
Secon Two: Infrastructure
Chapter 8 | Employment Page | 133
Gaps
No substanve gap exists in programmac alternaves for individuals. There are skills
gaps between the skills of the workforce and the needs of employers, as well as gaps in
number of people available to ll needed jobs.
For individuals, barriers exist such as transportaon, child-care and a person’s history.
However, these are not service gaps. For any person desiring a job and a career, there
are both opportunies and support services available.
From a provider perspecve, there may be logiscal gaps in that an academic class may
not be oered at a desired me or locaon. There are occasional scheduling dicules.
As with other service providers, stang may be a challenge.

DRAFT Lee County Human Services Gap Analysis
Secon Two: Infrastructure
Chapter 8 | Employment Page | 134
Intenonally le blank.

DRAFT Lee County Human Services Gap Analysis
Secon Two: Infrastructure
Chapter 9 | Staffing Page | 135
CHAPTER 9
Stang
Introducon
A consistent provider theme through various focus groups and interviews, has been the
challenge of stang to provide services. There are four elements involved. They are:
The difficulty of attracting and retaining professional staff with the needed
credentials. There is a national shortage.
Staff stability and turnover at the lower-level positions due to low wages and
difficult work.
The ongoing demand for more technical expertise, even at lower-level positions.
The high rate of population growth.
Each of these will be discussed in detail.
The Diculty of Aracng and Retaining Professional Sta with the Needed Credenals:
A Naonal Shortage of Health Professionals
It is dicult to recruit or retain highly qualied professionals such as physicians,
psychologists, social workers, etc. In some cases, it is a compensaon issue, but other
dimensions to the challenge exist.
There is a genuine naonal shortage in some elds. One such eld is child psychiatry.
107
In Florida during 2018, there were 412 child and adolescent psychiatrists to serve
4,131,400 children. That is a rao of 10 child-and-adolescent psychiatrists per 100,000
children under 18. In Lee County during 2018, there were 126,740 youth under 18 and
only 10 child-and-adolescent psychiatrists. It is worth nong that the average age of a
child / adolescent psychiatrist in Florida is 52. The only county in the state with a
sucient supply of child / adolescent psychiatrists is Alachua. This stasc of
suciency is biased by the presence of the University of Florida’s Department of
Psychiatry in the Medical School.
107
Workforce issues, 2019. America Academy of Child & Adolescent Psychiatry. www.aacap.org

DRAFT Lee County Human Services Gap Analysis
Secon Two: Infrastructure
Chapter 9 | Staffing Page | 136
With respect to psychologists, the Health Resources and Services Administraon
(HRSA)
108
expects the psychology workforce to grow by 1% between now and 2025
while the needed growth naonally is esmated at 6%. Using dierent assumpons
about rerement (one-third of psychologists are 55 or older), this could mean a
shortage of between 8,000 and 52,000 by 2025.
109
The same is true for Licensed Clinical Social Workers
110111
and Registered Nurses.
112
The
Bureau of Labor Stascs projects the need for 203,700 new RNs each year through
2026; while actual workforce growth is expected to be 50,000 per year.
113
The Bureau
of Labor Stascs projects the need for social workers to grow 11% from 2018 to 2028,
much faster than the average for all occupaons.
114
There are a variety of reasons for the exisng and growing shortage. These include:
The current and upcoming retirement of these professionals without a re-supply
in the pipeline.
115
Geographic disparities between large urban areas that have an adequate supply
and rural or suburban areas that do not.
116
The need for increased specialty care, such as opioid addition, for which many
professionals are not trained.
117
An aging society that requires more behavioral health care.
118
High turnover rates due to compensation and burn-out issues.
119
The sheer number of people needing behavioral health services exceeds the
current capacity.
120
108
Health workforce projections: Clinical, Counseling and School Psychologists. HRSA Health Workforce.
www.bhw.hrsa.gov
109109
Lange, S. 2018. Is there a shortage of clinical psychologists in the U.S. www.quora.com.
110
Jackson, K. The behavioral health care workforce shortage. Social Work Today 19(3), 16.
111
Burrows, H. 2019. The shortage of Licensed Social Workers in Central Florida. Dissertaon. Walden University.
112
Nursing Shortage, 2019. American Association of Colleges of Nursing
113
Employment projections, 2016-2026. Bureau of Labor Statistics
114
Occupational Outlook Handbook, 2018. www.bls.gov
115
Jackson, op.cit.
116
ibid
117
ibid
118
ibid
119
ibid
120
ibid

DRAFT Lee County Human Services Gap Analysis
Secon Two: Infrastructure
Chapter 9 | Staffing Page | 137
A shortage of nursing school faculty is restricting nursing school enrollments.
121
These factors are all present and are impacng Lee County service providers.
Another issue, more specic to Lee County, is that professional recruitment is locally
challenging. Some of the potenal reasons are:
The trailing spouse issue. While the economy of the region is certainly
diversifying, it is still not always easy for the spouse to find employment in his or
her field. Larger, urban areas have an advantage.
The dominance of retirement and tourism as economic drivers. While Lee
County is highly attractive to retirees and tourists, new professionals do not fit
these categories. In terms of professional interaction opportunities and lifestyle
choices, the region must compete against other regions that may offer a broader
range of options.
Table 47 provides various indicators regarding health care. Some stang shortages are
indicated by looking purely at sta raos, while others are indirectly indicated by
looking at the diculty of geng appointments or the lack of available beds. The
issues with appointments and the lack of beds certainly have other variables associated
with them, but they do indicate stang challenges as well.
121
Nursing shortage, ibid.
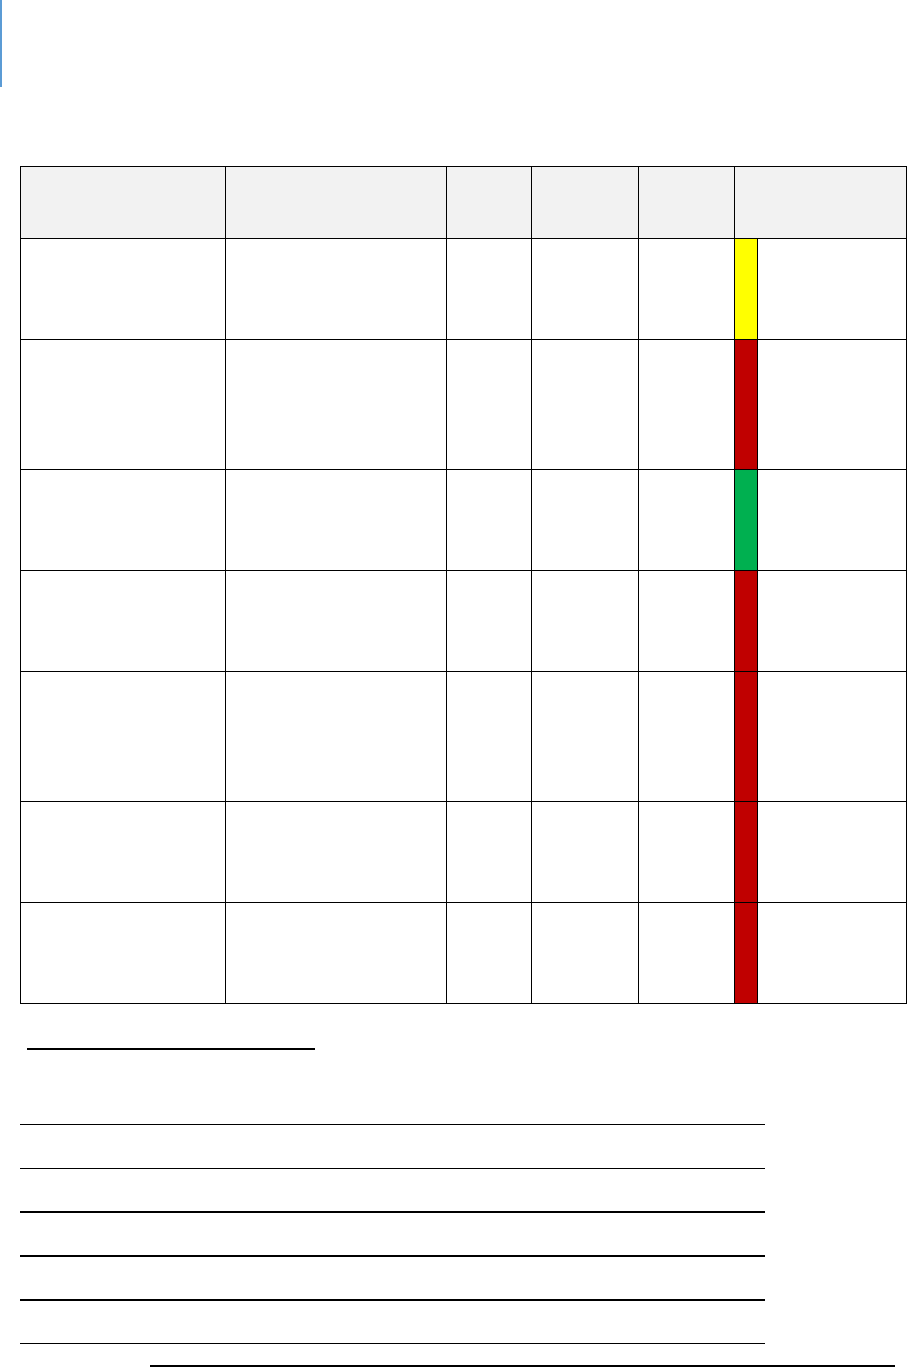
DRAFT Lee County Human Services Gap Analysis
Secon Two: Infrastructure
Chapter 9 | Staffing Page | 138
Table 47. Health Care Staffing Comparison Data
Source
Data Title
Year
Lee
County
State
Avg
Comparison
to State
Health
Resources
Availability
122
Total Licensed
Physicians per
100,000
2017
319.2
310.6
Within
10%
average
Health
Resources
Availability
123
Total Licensed
Family Pracce
Physicians per
100,000
2017
17.0
19.2
Worse
Health
Resources
Availability
124
Total Licensed
Internists per
100,000
2017
56.9
47.8
Beer
Health
Resources
Availability
125
Total Licensed
Pediatricians per
100,000
2017
19.0
22.3
Worse
Health
Resources
Availability
126
Total Licensed
Mental Health
Counselors per
100,000
2017
33.7
52.7
Worse
Health
Resources
Availability
127
Total Licensed
Psychologists per
100,000
2017
13.8
22.5
Worse
Health
Resources
Availability
128
Total Hospital Beds
Rate Per 100,000
2018
260.6
308.2
Worse
Florida Health Charts:,
122
Licensed Physicians,
http://www.flhealthcharts.com/charts/OtherIndicators/NonVitalIndNoGrpDataViewer.aspx?cid=0327
123
License Family Practice,
http://www.flhealthcharts.com/charts/OtherIndicators/NonVitalIndNoGrpDataViewer.aspx?cid=0328
124
Licensed Internists,
http://www.flhealthcharts.com/charts/OtherIndicators/NonVitalIndNoGrpDataViewer.aspx?cid=0329
125
Licensed Pediatricians,
http://www.flhealthcharts.com/charts/OtherIndicators/NonVitalIndNoGrpDataViewer.aspx?cid=0331
126
Licensed Mental Health Counselors,
http://www.flhealthcharts.com/charts/OtherIndicators/NonVitalIndNoGrpDataViewer.aspx?cid=9737
127
Licensed Psychologists,
http://www.flhealthcharts.com/charts/OtherIndicators/NonVitalIndNoGrpDataViewer.aspx?cid=9738
128
Hospital Beds, http://www.flhealthcharts.com/charts/OtherIndicators/NonVitalIndNoGrpDataViewer.aspx?cid=0313
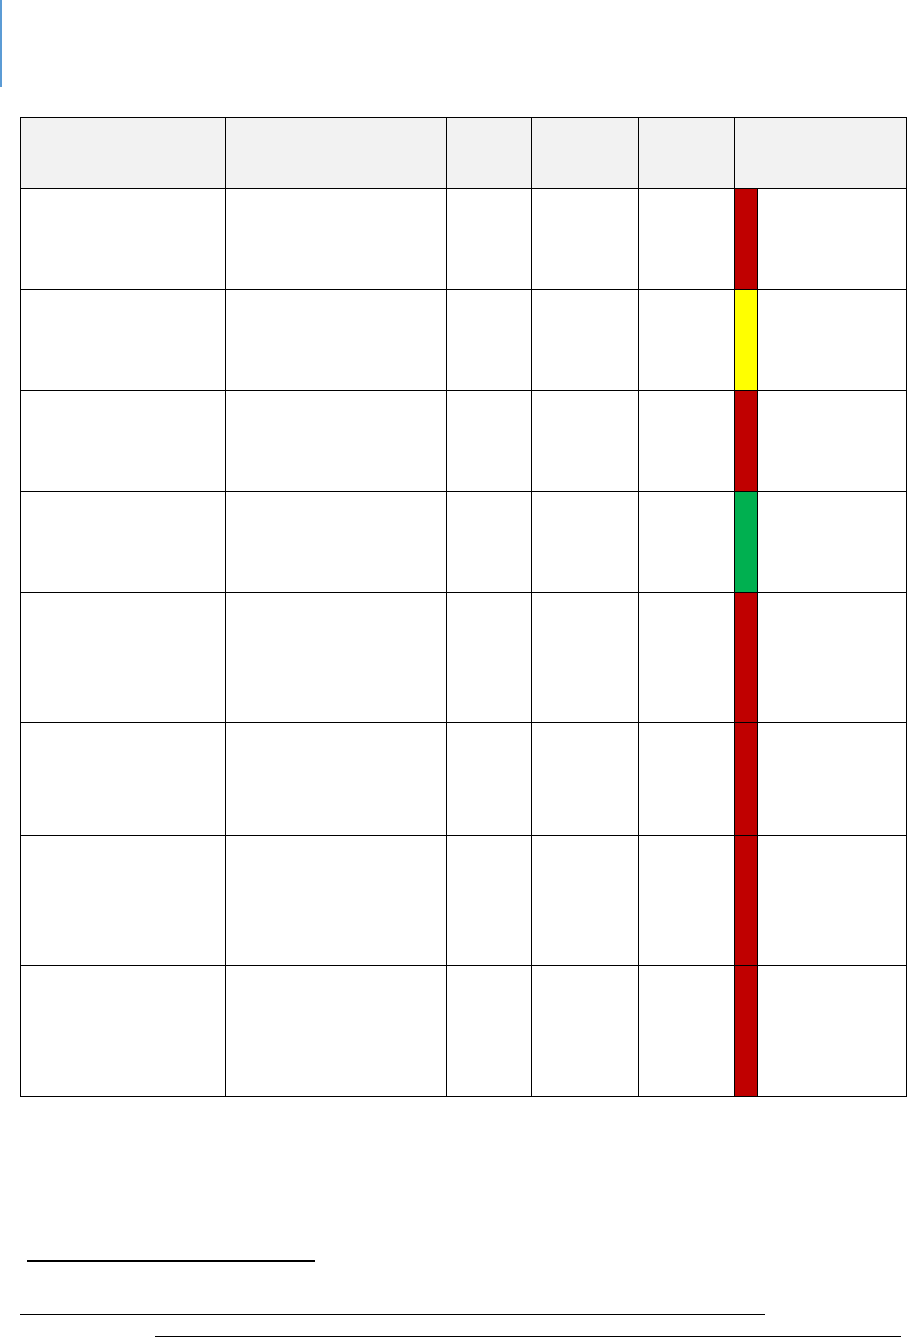
DRAFT Lee County Human Services Gap Analysis
Secon Two: Infrastructure
Chapter 9 | Staffing Page | 139
Source
Data Title
Year
Lee
County
State
Avg
Comparison
to State
Health
Resources
Availability
129
Total Acute Care
Beds Rate Per
100,000
2018
201.8
248.9
Worse
Health
Resources
Availability
130
Total Specialty
Beds Rate Per
100,000
2018
58.8
59.2
Within
10%
average
Community
Health Needs
Assessment
131
Primary Doctors
per 1000
2017
64.3
79.8
Worse
Community
Health Needs
Assessment
Live in a health
professional
shortage area
2017
26.5
54.7
Beer
Community
Health Needs
Assessment
% Diculty
Geng
Appointment past
year
2017
20.4%
US
Avg
15.4%
Worse
Community
Health Needs
Assessment
% Diculty
Finding Physician
past year
2017
14%
US
Avg
8.7%
Worse
Community
Health Needs
Assessment
% Diculty
accessing
healthcare past
year
2017
43.5%
US
Avg
35 %
Worse
Community
Health Needs
Assessment
% Diculty
Geng Childs
Healthcare past
year
2017
12.5%
US
Avg
3.9%
Worse
129
Total Acute Care Beds,
http://www.flhealthcharts.com/charts/OtherIndicators/NonVitalIndNoGrpDataViewer.aspx?cid=0314
130
Specialty Beds, http://www.flhealthcharts.com/charts/OtherIndicators/NonVitalIndNoGrpDataViewer.aspx?cid=0315
131
2017 Community Health Needs Assessment Report; Lee Health and FL Dept. of Health in Lee County

DRAFT Lee County Human Services Gap Analysis
Secon Two: Infrastructure
Chapter 9 | Staffing Page | 140
Sta Stability and Turnover at the Lower-Level Posions
Due to Low Wages and Dicult Work
Most direct-service sta at provider agencies are paid between $10 and $12 an hour. At
this rate of pay, even when small hourly increases are implemented, sta turnover
occurs as employees leave for other posions.
Another factor causing turnover is that the work is dicult and at mes dangerous.
Whether it is a bus driver being verbally abused, a mental health technician being
physically aacked, or an employee observing the pain of others, none of this work is
easy. For these reasons, front line employees burn out regularly and nd dierent
employment.
The growth rate of the County osets this turnover to some degree. New residents
who need work are always arriving. While this may be a numerical oset, there are
both management and quality challenges. Program consistency is an important
component of many service programs. However, it is challenging to achieve with sta
turnover.
The Ongoing Demand for More Technical Experse, even at Lower-Level Posions
There is an ongoing trend for direct-service work to be more technical in nature. In the
1970s, for example, aides in state mental hospitals were retrained to become psycho-
social technicians. This is due in part to the fact that as the knowledge base in all these
elds grows and becomes more specialized, the limitaons of unskilled posions
become apparent and the need for beer skills becomes more obvious. To illustrate
this phenomenon, take the case of child-care.
Child-care originally was just child-watching. It involved making sure no children were
injured; they were fed, they took naps, etc. An employee only needed to be responsible
to qualify for such a job.
As knowledge about the importance of brain development between the ages of 0 and 3
increased and the various forms of interacon that were helpful or harmful to children
were beer understood, simple child-watching became inadequate. Instead, the
employee needed some knowledge of child development intellectually, emoonally and
physically. Today there are minimum training standards coupled with a preference for

DRAFT Lee County Human Services Gap Analysis
Secon Two: Infrastructure
Chapter 9 | Staffing Page | 141
Child Development Associates credenals, in addion to the ideal of pursuing a
Bachelor of Arts in Child Development.
This same paern is true for almost any human service eld, be it behavioral health,
child abuse and neglect, trauma, intellectual and developmental disabilies, etc. The
knowledge base has grown signicantly and the importance of appropriate skills has
increased with that knowledge base.
The High Rate of Populaon Growth
Lee County is in one of the naon’s fastest growing regions. Growth is certainly
preferable to populaon decline. However, it brings its own challenges. One of these is
that the development of infrastructure needed to serve the growth in populaon is
always slower than the growth itself. This is certainly true for physical infrastructure
such as roads, water lines, etc. It is also true of human infrastructure.
In eect, people are coming to Lee County at a faster pace than the professionals
needed to address the new residents’ needs. Over me, this human infrastructure will
catch up, just as physical infrastructure can catch up.
Table 48 shows the Florida Department of Economic Opportunity’s projecons for job
growth in various industries between 2018 and 2026.
132
Table 49 shows new job
growth by industry category. Table 50 shows the fastest-growing occupaons and Table
51 shows growth of new jobs in the various occupaons. Many of these are posions in
the human services eld.
Conclusion
The challenge of stang will remain into the near future. A factor to consider in
decisions regarding new or expanded programs is the feasibility of securing adequately
skilled sta to perform the required work.
132
Florida Department of Economic Opportunity, http://www.floridajobs.org/workforce-statistics/data-
center/statistical-programs/employment-projections

DRAFT Lee County Human Services Gap Analysis
Secon Two: Infrastructure
Chapter 9 | Staffing Page | 142
Table 48. Lee County Fastest Growing Industries by NAICS Title (PROJECTIONS
Employment
Rank
NAICS Title
2018
2026
Growth
Percent
Growth
1
Educaonal Services
3,485
4,351
866
24.9%
2
Ambulatory Health Care
Services
15,931
19,821
3,890
24.4%
3
Nursing and Residenal Care
Facilies
6,885
8,543
1,658
24.1%
4
Furniture and Related Product
Manufacturing
714
880
166
23.3%
5
Social Assistance
3,887
4,658
771
19.8%
6
Support Acvies for
Transportaon
825
976
151
18.3%
7
Health and Personal Care
Stores
2,563
3,024
461
18.0%
8
Nonmetallic Mineral Product
Manufacturing
788
929
141
17.9%
9
Transit and Ground Passenger
Transportaon
265
311
46
17.4%
10
Insurance Carriers and Related
Acvies
3,160
3,694
534
16.9%
11
Sporng Goods, Hobby, Book,
and Music Stores
1,872
2,171
299
16.0%
12
Construcon of Buildings
5,634
6,497
863
15.3%
13
Miscellaneous Manufacturing
546
629
83
15.2%
14
Professional, Scienc, and
Technical Services
14,820
17,039
2,219
15.0%
15
Specialty Trade Contractors
21,757
24,948
3,191
14.7%
16
Local Government
36,780
42,167
5,387
14.7%
17
Administrave and Support
Services
18,128
20,724
2,596
14.3%
18
State Government
4,816
5,487
671
13.9%

DRAFT Lee County Human Services Gap Analysis
Secon Two: Infrastructure
Chapter 9 | Staffing Page | 143
Employment
Rank
NAICS Title
2018
2026
Growth
Percent
Growth
19
Air Transportaon
676
768
92
13.6%
20
Couriers and Messengers
981
1,111
130
13.3%
Table 49. Lee County Industries Gaining the Most New Jobs (PROJECTIONS)
Employment
Rank
NAICS Title
2018
2026
Growth
Percent
Growth
1
Local Government
36,780
42,167
5,387
14.7%
2
Ambulatory Health Care
Services
15,931
19,821
3,890
24.4%
3
Specialty Trade Contractors
21,757
24,948
3,191
14.7%
4
Food Services and Drinking
Places
30,438
33,417
2,979
9.8%
5
Administrave and Support
Services
18,128
20,724
2,596
14.3%
6
Professional, Scienc, and
Technical Services
14,820
17,039
2,219
15.0%
7
Nursing and Residenal Care
Facilies
6,885
8,543
1,658
24.1%
8
Educaonal Services
3,485
4,351
866
24.9%
9
Construcon of Buildings
5,634
6,497
863
15.3%
10
Food and Beverage Stores
8,553
9,383
830
9.7%
11
Social Assistance
3,887
4,658
771
19.8%
12
Motor Vehicle and Parts
Dealers
5,672
6,386
714
12.6%
13
State Government
4,816
5,487
671
13.9%
14
Amusement, Gambling, and
Recreaon Industries
6,333
6,955
622
9.8%

DRAFT Lee County Human Services Gap Analysis
Secon Two: Infrastructure
Chapter 9 | Staffing Page | 144
15
Insurance Carriers and Related
Acvies
3,160
3,694
534
16.9%
16
Health and Personal Care
Stores
2,563
3,024
461
18.0%
17
Building Material and Garden
Equipment and Supplies
Dealers
4,082
4,525
443
10.9%
18
Repair and Maintenance
3,372
3,763
391
11.6%
19
Personal and Laundry Services
3,201
3,585
384
12.0%
20
Real Estate
4,457
4,836
379
8.5%
Table 50. Lee County Fastest-Growing Occupations (PROJECTIONS)
Employment
Educaon
Rank
SOC Title
2018
2026
Percent
Growth
2017
Median
Hourly
Wage ($)*
FL†
BLS†
1
Physician
Assistants
245
341
39.20%
44.81
B
M
2
Nurse Praconers
185
256
38.40%
46.15
M+
M
3
Personal Care
Aides
1,127
1,506
33.60%
10.64
PS
HS
4
Business Teachers,
Postsecondary
153
204
33.30%
-
B
D
5
Respiratory
Therapists
539
713
32.30%
27.99
A
A
6
Health Speciales
Teachers,
Postsecondary
149
196
31.50%
-
M+
D
7
Physical Therapist
Assistants
272
353
29.80%
29.3
A
A
8
Medical Assistants
2,137
2,771
29.70%
15.09
PS
PS
9
Logiscians
200
257
28.50%
26.31
B
B

DRAFT Lee County Human Services Gap Analysis
Secon Two: Infrastructure
Chapter 9 | Staffing Page | 145
Employment
Educaon
Rank
SOC Title
2018
2026
Percent
Growth
2017
Median
Hourly
Wage ($)*
FL†
BLS†
10
Diagnosc Medical
Sonographers
229
294
28.40%
35.51
PS
A
11
Physical Therapists
441
560
27.00%
41.68
M+
D
12
Market Research
Analysts and
Markeng
Specialists
443
561
26.60%
26.52
B
B
13
Physical Therapist
Aides
140
177
26.40%
11.84
PS
HS
14
Food Servers,
Nonrestaurant
377
476
26.30%
9.25
NR
NR
15
Financial
Managers
492
620
26.00%
49.84
B
B
16
Soware
Developers,
Applicaons
679
854
25.80%
33.7
A
B
17
Massage
Therapists
376
470
25.00%
20.81
PS
PS
18
Occupaonal
Therapists
191
236
23.60%
43.29
M+
M
19
Medical and
Health Services
Managers
260
321
23.50%
49.22
B
B
20
Self-Enrichment
Educaon
Teachers
390
481
23.30%
24.24
PS
HS
21
Insurance Claims
and Policy
Processing Clerks
254
313
23.20%
15.8
HS
HS
22
Healthcare Social
Workers
186
229
23.10%
23.78
M+
M

DRAFT Lee County Human Services Gap Analysis
Secon Two: Infrastructure
Chapter 9 | Staffing Page | 146
Employment
Educaon
Rank
SOC Title
2018
2026
Percent
Growth
2017
Median
Hourly
Wage ($)*
FL†
BLS†
23
Cabinetmakers
and Bench
Carpenters
403
496
23.10%
16.45
PS
HS
24
Social and
Community
Service Managers
169
208
23.10%
30.72
A
B
25
Medical Sciensts,
Except
Epidemiologists
129
158
22.50%
32.93
M+
D
26
Registered Nurses
6,110
7,473
22.30%
31.03
A
B
27
Ophthalmic
Medical
Technicians
239
292
22.20%
18.4
PS
PS
28
Medical
Secretaries
473
577
22.00%
14.28
PS
HS
29
Cooks, Instuon
and Cafeteria
474
577
21.70%
13.37
HS
NR
30
Educaonal,
Guidance, School,
and Vocaonal
Counselors
267
325
21.70%
28.1
M+
M
31
Phlebotomists
226
275
21.70%
14.65
PS
PS
32
Dental Assistants
632
767
21.40%
18.57
PS
PS
33
Dental Hygienists
328
398
21.30%
37.21
A
A
34
Surgical
Technologists
452
548
21.20%
22
PS
PS
35
Management
Analysts
1,028
1,243
20.90%
40.24
B
B
36
Nursing Assistants
3,918
4,726
20.60%
13.47
PS
PS

DRAFT Lee County Human Services Gap Analysis
Secon Two: Infrastructure
Chapter 9 | Staffing Page | 147
Employment
Educaon
Rank
SOC Title
2018
2026
Percent
Growth
2017
Median
Hourly
Wage ($)*
FL†
BLS†
37
Licensed Praccal
and Licensed
Vocaonal Nurses
1,575
1,892
20.10%
20.8
PS
PS
38
Pharmacy
Technicians
1,013
1,214
19.80%
14.7
PS
HS
39
Radiologic
Technologists
515
617
19.80%
28.29
PS
A
40
Helpers--Roofers
147
176
19.70%
-
NR
NR
41
Structural Iron and
Steel Workers
351
420
19.70%
20.57
PS
HS
42
Child, Family, and
School Social
Workers
492
588
19.50%
17.72
M+
B
43
Speech-Language
Pathologists
206
246
19.40%
40.03
M+
M
44
Insurance Sales
Agents
1,237
1,475
19.20%
22.11
PS
HS
45
Molders, Shapers,
and Casters,
Except Metal and
Plasc
177
211
19.20%
14.3
HS
HS
46
Cardiovascular
Technologists and
Technicians
347
413
19.00%
17.8
PS
A
47
Family and
General
Praconers
295
351
19.00%
-
M+
D
48
Dietec
Technicians
194
230
18.60%
13.54
PS
A
49
Compliance
Ocers
346
410
18.50%
23.48
PS
B

DRAFT Lee County Human Services Gap Analysis
Secon Two: Infrastructure
Chapter 9 | Staffing Page | 148
Employment
Educaon
Rank
SOC Title
2018
2026
Percent
Growth
2017
Median
Hourly
Wage ($)*
FL†
BLS†
50
Administrave
Services Managers
185
219
18.40%
35.19
A
B
Table 51. Lee County Occupations Gaining the Most New Jobs (PROJECTIONS)
Employment
Education
Rank
SOC Title
2018
2026
Total Job
Opening
s
2017
Median
Hourly
Wage
($)*
FL†
BL
S†
1
Registered Nurses
6,110
7,473
4,100
31.03
A
B
2
Retail Salespersons
13,262
14,495
17,073
10.66
HS
NR
3
Landscaping and Grounds
keeping Workers
7,392
8,571
8,722
11.48
NR
NR
4
Combined Food Preparation
and Serving Workers,
Including Fast Food
6,947
8,064
11,995
9.75
NR
NR
5
Construction Laborers
6,186
7,157
6,351
14.23
NR
NR
6
Customer Service
Representatives
6,383
7,235
7,723
13.26
PS
HS
7
Waiters and Waitresses
9,775
10,614
16,125
9.48
NR
NR
8
Nursing Assistants
3,918
4,726
4,655
13.47
PS
PS
9
Carpenters
4,728
5,437
4,367
19.09
PS
HS
10
Medical Assistants
2,137
2,771
2,702
15.09
PS
PS
11
Stock Clerks and Order
Fillers
4,717
5,262
5,568
11.67
HS
HS
12
First-Line Supervisors of
Retail Sales Workers
4,563
5,073
4,527
20.54
PS
HS

DRAFT Lee County Human Services Gap Analysis
Secon Two: Infrastructure
Chapter 9 | Staffing Page | 149
Employment
Education
Rank
SOC Title
2018
2026
Total Job
Opening
s
2017
Median
Hourly
Wage
($)*
FL†
BL
S†
13
Janitors and Cleaners,
Except Maids and
Housekeeping Cleaners
3,365
3,860
4,194
11.58
NR
NR
14
Cooks, Restaurant
3,880
4,361
5,049
12.99
PS
NR
15
First-Line Supervisors of
Construcon Trades and
Extracon Workers
2,811
3,257
2,754
26.79
A
HS
16
Childcare Workers
2,495
2,914
3,525
10.8
PS
HS
17
Receponists and
Informaon Clerks
3,061
3,473
3,772
13.68
HS
HS
18
Food Preparaon Workers
3,140
3,524
4,825
10.74
NR
NR
19
Maids and Housekeeping
Cleaners
2,782
3,164
3,473
11.04
NR
NR
20
Personal Care Aides
1,127
1,506
1,853
10.64
PS
HS
21
Cashiers
9,231
9,610
14,361
9.49
HS
NR
22
Oce Clerks, General
5,865
6,244
5,991
13.88
HS
HS
23
Laborers and Freight,
Stock, and Material
Movers, Hand
3,125
3,503
3,958
12.8
NR
NR
24
Sales Representaves,
Wholesale and
Manufacturing, Except
Technical and Scienc
Products
3,149
3,505
3,017
26.21
PS
HS
25
General and Operaons
Managers
2,481
2,835
2,063
42.51
A
B
26
Elementary School
Teachers, Except Special
Educaon
2,400
2,750
1,793
-
B
B

DRAFT Lee County Human Services Gap Analysis
Secon Two: Infrastructure
Chapter 9 | Staffing Page | 150
Employment
Education
Rank
SOC Title
2018
2026
Total Job
Opening
s
2017
Median
Hourly
Wage
($)*
FL†
BL
S†
27
Hairdressers, Hairstylists,
and Cosmetologists
2,273
2,610
2,615
12.46
PS
PS
28
Maintenance and Repair
Workers, General
2,838
3,174
2,653
16.97
PS
HS
29
Licensed Praccal and
Licensed Vocaonal
Nurses
1,575
1,892
1,288
20.8
PS
PS
30
First-Line Supervisors of
Food Preparaon and
Serving Workers
2,746
3,059
3,568
14.98
PS
HS
31
Heang, Air Condioning,
and Refrigeraon
Mechanics and Installers
2,056
2,336
1,943
20.84
PS
PS
32
Painters, Construcon and
Maintenance
2,019
2,294
1,724
14.92
PS
NR
33
Light Truck or Delivery
Services Drivers
2,212
2,487
2,253
13.18
PS
HS
34
Security Guards
2,150
2,417
2,639
12.89
PS
HS
35
Accountants and Auditors
1,948
2,206
1,705
27.49
B
B
36
First-Line Supervisors of
Oce and Administrave
Support Workers
2,873
3,121
2,562
24.33
A
HS
37
Teacher Assistants
1,629
1,873
1,652
-
PS
SC
38
Heavy and Tractor-Trailer
Truck Drivers
2,173
2,412
2,169
17.86
PS
PS
39
Insurance Sales Agents
1,237
1,475
1,263
22.11
PS
HS
40
Roofers
1,349
1,587
1,372
16.07
PS
NR
41
Cleaners of Vehicles and
Equipment
1,558
1,787
2,080
10.39
NR
NR
DRAFT Lee County Human Services Gap Analysis
Secon Two: Infrastructure
Chapter 9 | Staffing Page | 151
Employment
Education
Rank
SOC Title
2018
2026
Total Job
Opening
s
2017
Median
Hourly
Wage
($)*
FL†
BL
S†
42
Construcon Managers
1,495
1,719
1,090
34.56
A
B
43
Management Analysts
1,028
1,243
976
40.24
B
B
44
Real Estate Sales Agents
1,717
1,930
1,529
31.34
PS
HS
45
Billing and Posng Clerks
1,240
1,452
1,266
16.74
HS
HS
46
Pharmacy Technicians
1,013
1,214
885
14.7
PS
HS
47
Counter and Rental Clerks
1,649
1,840
1,948
13.25
HS
NR
48
Police and Sheri's Patrol
Ocers
1,240
1,428
862
23.01
PS
HS
49
Automove Service
Technicians and
Mechanics
1,893
2,077
1,644
17.61
PS
PS
50
Secondary School
Teachers, Except Special
and Career/Technical
Educaon
1,260
1,444
919
-
B
B
* Hourly wages for teaching occupaons were calculated using a 40-hour work week for 9½ months per year.
† Educaon levels are abbreviated as follow.
Florida
A: associate degree
B: bachelor's degree
HS: high school diploma or GED
M+: master's, doctoral or professional degree
NR: no formal educaonal credenal required
PS: postsecondary non-degree award
U.S. Department of Labor, BLS (Bureau of Labor Stascs)
A: associate degree
B: bachelor's degree
D: doctoral or professional degree
HS: high school diploma or GED
M: master's degree
NR: no formal educaonal credenal required
PS: postsecondary non-degree award
SC: some college, no degree

DRAFT Lee County Human Services Gap Analysis
Secon Two: Infrastructure
Chapter 9 | Staffing Page | 152
Intenonally le blank.
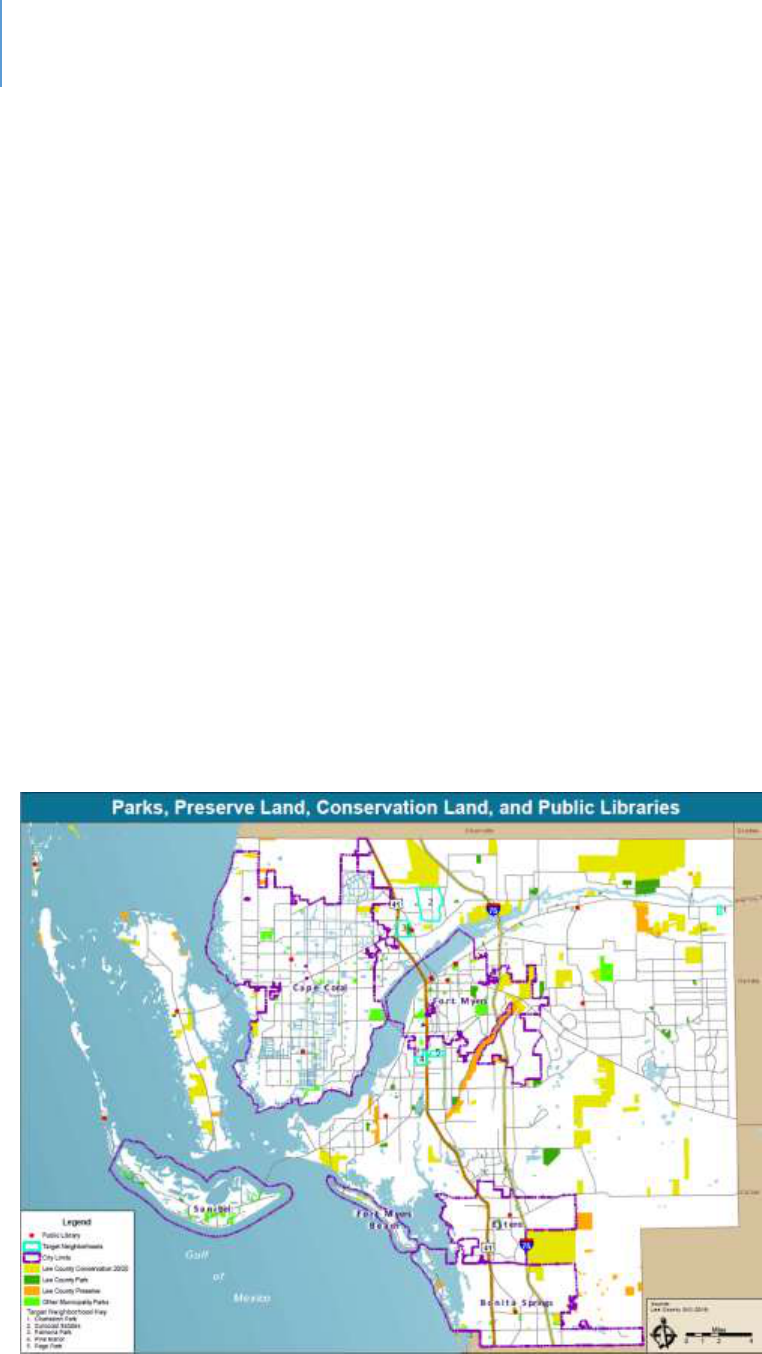
DRAFT Lee County Human Services Gap Analysis
Secon Two: Infrastructure
Chapter 10 | County Facilities Page | 153
CHAPTER 10
County Facilies
Introducon
This chapter discusses recreaonal facilies in the County with an emphasis on facilies
that the County provides. These facilies provide a variety of human service-related
funcons such as aer-school programs, youth recreaon and adult recreaon. The
libraries provide children’s programs, spaces for adolescents and meeng spaces for
community organizaons. These services contribute to the physical health of the
community for all age groups, posive youth development and alleviaon of social
isolaon for seniors.
Findings
Figure 5 shows the Parks and Recreaonal Facilies, Public Libraries and Conservaon
20/20 Lands across the County. These are widely distributed and are located near
populaon centers.
Figure 5. Map of Lee County Parks, Conservation Lands and Libraries

DRAFT Lee County Human Services Gap Analysis
Secon Two: Infrastructure
Chapter 10 | County Facilities Page | 154
Based on its comprehensive plan and needs analysis, the County plans to develop
addional parks and libraries at sites across the County. Appendix G summarizes the
County’s Parks and Recreaon Capital Improvement Projects (CIPs). Appendix H
summarizes the County’s Library System’s CIPs.
Nonprots are responsible for developing their own facilies. Other public agencies
have similar responsibilies.
Conclusion
While some facilies are more intensely used than others – and during season there is
high demand on facilies – there are no signicant gaps in recreaonal facilies in the
County.
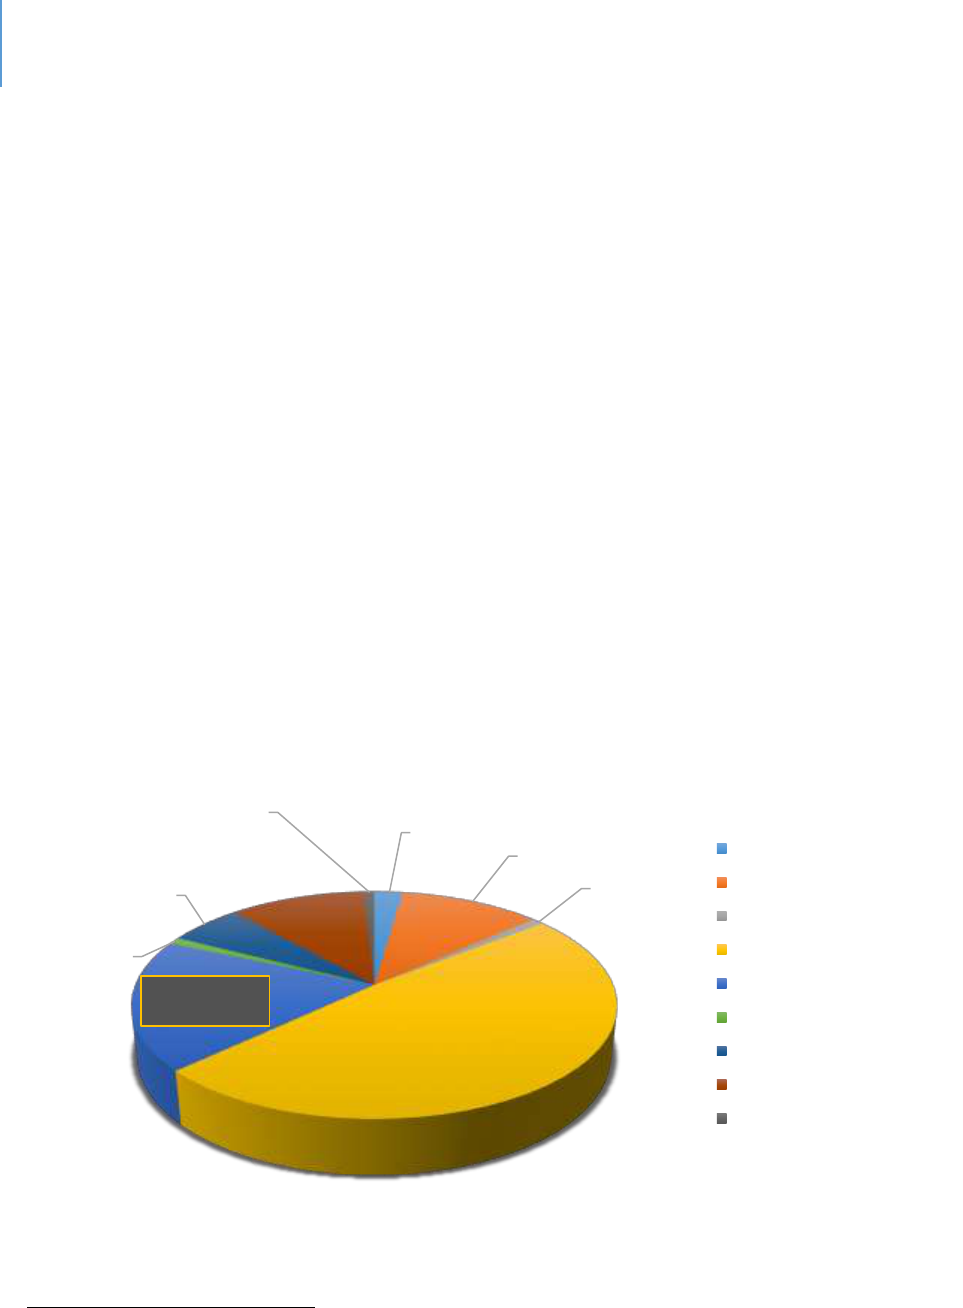
DRAFT Lee County Human Services Gap Analysis
Secon Two: Infrastructure
Chapter 11 | Organizational Capacity Page | 155
CHAPTER 11
Organizaonal Capacity
Introducon
According to the Internal Revenue Service (IRS), there are 247 nonprot organizaons in
the County that are coded as human serving, with 198 of these reporng posive
revenue. Human serving nonprots dier from the arts and culture nonprots in that
their mission is addressing some human need, oen of a decit nature. Arts and
culture nonprots oer great value to the community and address higher-level human
needs, but not basic needs such as food, physical health, illness of some sort,
disabilies, or vicmhood.
In Lee County, the proporon of revenue collected by the various nonprots is shown in
the following chart. Nonprot organizaons coded as “Human Services” collect 18% of
the total revenue.
Figure 6. Revenue Collected by Tax Exempt Organizations in Lee County, Florida
133
133
IRS Exempt Organizations Business Master File Extracts: https://www.irs.gov/charities-non-profits/exempt-
organizations-business-master-file-extract-eo-bmf
Arts, culture, and
humanities
2%
Education
11%
Environment
1%
Hospitals, Health
49%
Human Services
18%
International
1%
Mutual benefit
6%
Public and societal
benefit
11%
Religion
1%
Arts, culture, and humanities
Education
Environment
Hospitals, Health
Human Services
International
Mutual benefit
Public and societal benefit
Religion

DRAFT Lee County Human Services Gap Analysis
Secon Two: Infrastructure
Chapter 11 | Organizational Capacity Page | 156
Thirty-eight of the local nonprots form the core of the “Systems-of-Care” in the
County. These 38 local nonprots reported revenues from $49,696 up to $42,736,759.
There are several core providers that are not based in Lee County; they are not included
in these gures.
Key Trends in Human Serving Non-Prots
This chapter focuses on the human serving nonprot sector. Three trends of signicance
exist:
The growing knowledge base and specialization of services.
Economy of scale pressures.
The increasing significance of performance management capacity, if receiving public
funds.
The Growing Knowledge Base and Specializaon of Services
In recent years, there have been signicant developments in our understanding of the
human brain, of genecs and of epigenesis. Our understanding of what shapes and
inuences human behavior has vastly advanced. Of course, much is yet to be learned.
In addion to advances in brain research and related elds, therapeuc modalies are
becoming more and more specialized as we learn what treatments are eecve with
certain condions. More specialized training is demanded of sta as the number of
speciales increases within the human services eld.
Addionally as stated in a prior chapter, there is an ongoing trend for direct service
work to be more technical in nature. In the 1970s for example, aides in the state
mental hospitals were re-trained to become psycho-social technicians. This is due in
part to the fact that as the knowledge base in all these elds grows and becomes more
specialized, the limitaons of unskilled posions become apparent and the need for
beer skills becomes more obvious. To illustrate this phenomenon, take the case of
child-care.

DRAFT Lee County Human Services Gap Analysis
Secon Two: Infrastructure
Chapter 11 | Organizational Capacity Page | 157
Child-care originally was just child watching. It involved making sure no children were
injured, they were fed, they took naps, etc. A person only needed to be responsible to
qualify for such a job.
As knowledge about the importance of brain development between the ages of 0 and 3
increased, and the various forms of interacon that were helpful or harmful to children
were beer understood, and simple child-watching became inadequate. Instead, the
employee needed some knowledge of child development intellectually, emoonally and
physically. Today there are minimum training standards coupled with a preference for
Child Development Associates credenals, in addion to the ideal of pursuing a
Bachelor of Arts in Child Development.
This same paern is true for almost any human service eld, be it behavioral health,
child abuse and neglect, trauma, intellectual and developmental disabilies, etc. The
knowledge base has grown signicantly and the importance of appropriate skills has
grown with that knowledge base.
A natural outgrowth of specializaon is the need for inter-disciplinary teams. One
example of this is in the criminal jusce eld in which a variety of disciplines operate
the various specialty courts. Treatment teams are standard pracce in the behavioral
health eld.
Economy of Scale Pressures
The nonprot sector is much like the for-prot sector from the perspecve that
economy of scale maers. There is the point at which organizaons become too large
to manage eecvely. Few organizaons in the nonprot sector approach that
problem. Most are so small that they are inecient. They are inecient because:
There are so few staff that they all have to become generalists. While every
organization needs a generalist or two, organizational efficiency occurs when most
staff can specialize and complete their tasks in a timely and accurate manner
because they have mastered those tasks. In a very small organization, one person
must complete many tasks, which means they master none or a few at most.

DRAFT Lee County Human Services Gap Analysis
Secon Two: Infrastructure
Chapter 11 | Organizational Capacity Page | 158
It is difficult to invest in training, professional development or knowledge of key
trends. Small organizations tend to have very limited resources and the ability to
invest in human capital is limited. As a result, staff skills are not advancing and may
indeed be falling behind the field.
It is difficult to complete non-repetitive work effectively. Small organizations must
focus on their core work and in doing so have little time for other key tasks. For
example, preparing a grant application can require extensive work as well as
knowledge of what must go into the application for it to be competitive. When a
staff member rarely fills out a grant application and is doing so during evenings or
weekends, it will not be as competitive of an application as one completed by a
grant specialist.
Limited options for career advancement. Small organizations have very limited
career paths, if any at all. While they certainly can attract new employees, it is
difficult to keep employees who have career goals. These employees want to
advance and broaden themselves professionally. Once they master the skills of their
current job, they naturally will look for other opportunities. Small organizations are
limited in their ability to provide these opportunities and will experience higher
rates of turnover. Long-term staff are limited, which means that opportunities for
more efficient work are limited.
The Increasing Signicance of Performance Management Capacity, if Receiving Public Funds
It is a general fact that the reporng and documentaon required by public funders
usually exceeds that of private funders. Data collecon, analysis and reporng are
me-consuming acvies, which can challenge even large organizaons. For small
organizaons, it can be overwhelming. This means the reporng may not be of
acceptable quality, may be inaccurate or may be missing.
The movement to assess performance in the use of public funds will not lessen. Indeed,
the expectaon of being able to demonstrate impact and outcomes will only increase.
A larger organizaon can engage with an evaluaon and assessment professional to
assist with those tasks. For smaller organizaons, it is just another task at the end of a
long day.

DRAFT Lee County Human Services Gap Analysis
Secon Two: Infrastructure
Chapter 11 | Organizational Capacity Page | 159
Conclusion
The nonprot sector forms key partnerships with public enes to provide services as
well as generate private funding for those services. Given the broad range of needs and
challenges, as well as the increasing complexity of the work, the emphasis should be on
developing organizaons that have the capacity and skills to fully address their mission.
Concentrang the community’s resources on the core “System-of-Care” providers is the
most eecve use of those resources.

DRAFT Lee County Human Services Gap Analysis
Secon Two: Infrastructure
Chapter 11 | Organizational Capacity Page | 160
Intenonally le blank.

DRAFT Lee County Human Services Gap Analysis
Secon Two: Infrastructure
Chapter 12 | Information and Technology Page | 161
CHAPTER 12
Informaon and Technology
Introducon
Human service organizaons have high informaon needs, just like any other business.
Organizaons with governmental contracts have extensive reporng requirements and
required nancial reporng. This results in administrave investments to meet
reporng requirements as well as to fulll operaonal and strategic decision-making
needs.
Advances in technology will have a substanve impact on human services organizaons.
While there is no need to be on the cung edge, agencies cannot fall too far behind the
state-of-the-art if they are to remain viable.
The purpose of this chapter is to not only address current gaps, but also address
emerging technologies that should be considered if future gaps are to be avoided. It
will focus on trends that should be considered in future planning and development.
Trends
There are several trends that should be considered from an overall human services
system framework. These include:
New HUD Regulaons. Regulaons connue to place a greater emphasis on the use of
technology and data to inform the provision of human services.
Legislaon. Several proposed legislave acts, including the HEARTH Act HMIS Final Rule
(FR 5475), will require increased use of data systems over the next several years.
Other Iniaves. Incenves such as the monitoring of benchmark achievements for the
U.S. Interagency Council on Homelessness for ending homelessness for various sub-
populaons are ancipated to require increased reporng capabilies.
Performance Data and Funding. In many cases, including the annual HUD Connuum of

DRAFT Lee County Human Services Gap Analysis
Secon Two: Infrastructure
Chapter 12 | Information and Technology Page | 162
Care funding process, performance data is used to make funding determinaons. If
data are inaccurate or performance is substandard, funding levels could be reduced.
The need for increased data sharing among mega-systems. Within the human services
eld there are at least four mega-systems: the human serving agencies who serve a
range of individuals, the law enforcement agencies that deal with some of these same
people, the educaon system that serves some of these same people or families, and
the physical health system. Some persons cycle through these mega-systems. Families
may be involved in one or more of them. While acknowledging various privacy
concerns, there remains an on-going and potenally increasing need for informaon
sharing among these mega-systems.
The increasing viability of tele-presence as an interacon and therapeuc tool.
Telepresence is becoming more widely used in therapeuc sengs. As 5G becomes
more widespread, people become comfortable with the technology, and pressures for
increased eciency connue, there will be wider uses of telepresence technologies.
Various legal and regulatory issues need to be resolved as well as technology
investment requirements. Despite these challenges, it is a technology that cannot be
ignored.
Robocs. Japan is currently facing the need to serve an elderly populaon with a
limited workforce. In response to this challenge, it has invested in developing robots
that can provide certain supports
134
. Among the types of robocs being developed are:
Social-emotional or companion robots that provide various forms of
interaction.
135
Specialized systems such as the Roomba – a robotic vacuum cleaner, floor-
mopping robots, lawn-mowing robots and pill-dispensing robots.
136
Self-driving cars that will enhance senior and disabled mobility.
137
Robots that assist with nutrition by giving advice or reminders.
138
134
Japan’s Robots: Robots used in care for the elderly. TRT World. YouTube. 3/28/18
135
The future is elder care robots. www.waypointrobotics.com
136
Matuszek, C. 2017. How robots could help the elderly age in their homes. www.Smithosonian.com. August 29
th
.
137
Op.cit.
138
Luukasik, S. et.al. 2017. Could robots help older people with age-related nutritional problems? International
Journal of Environmental Research and Public Health. Doi: 10.3390/ijerph 15112535

DRAFT Lee County Human Services Gap Analysis
Secon Two: Infrastructure
Chapter 12 | Information and Technology Page | 163
Specialized Arcial Intelligence (AI)
A variety of specialized AI funcons are being developed that could be of value to the
human services eld. These include:
Voice. This form of AI will allow clients to interact with voice-response systems
for certain needs.
Cyber-security. Data security will continue to be an important topic.
Emotion Recognition. As this AI develops, it could have important uses in the
field.
Personalized Health Advice. This AI can provide guidance for clients and
employees.
Object and movement detection for safety or logistics. Both have potential
value.
Augmented work with AI
While some popular literature warns of AI and robots replacing humans, the near-
future reality is that human and AI systems will work together. Some of the potenal
areas of people working with, and being augmented by, an AI system include:
Clinical and Big Data Analysis. Clinicians could have AI systems that help
bring the most recent science or assist in the interpretation of various
diagnostics.
Communication. This is about being able to communicate more effectively
with team members, clients and the public.
Translation. Using natural language tools, the challenges of serving clients
with various languages could be reduced.
Virtual Assistants. These are assistants who help staff with a variety of
functions.
Augmented Reality. There may be clinical value in being able to explore
differing realities.
Conclusion
In the very near future, the delivery of human services could change signicantly. New
technology, new analycs and clearer performance standards all could develop. These

DRAFT Lee County Human Services Gap Analysis
Secon Two: Infrastructure
Chapter 12 | Information and Technology Page | 164
changes could make services more available, reduce or change costs, provide more data
to determine eecveness and eciency, and become a factor in funding decisions.

DRAFT Lee County Human Services Gap Analysis
Secon Three: Development – The Foundaon
Section Three: Development – The Foundation Page | 165
Secon Three: Development – The Foundaon

DRAFT Lee County Human Services Gap Analysis
Secon Three: Development – The Foundaon
Section Three: Development – The Foundation Page | 166
Intenonally le blank.

DRAFT Lee County Human Services Gap Analysis
Secon Three: Development – The Foundaon
Chapter 13 – Child and Youth Development Page | 167
Chapter 13
Children and Youth Development
Introduction
This chapter addresses the systems and efforts that promote healthy child and youth
development. The major system is the school system, which is not a focus of this study.
The major challenges facing public education will be noted, but an analysis of the gaps in
the School District of Lee County are not addressed. What is addressed are those efforts
prior to public-school entry.
The hope is that every child has a safe, healthy and productive path to adulthood.
Unfortunately, not all children do. The gaps in addressing their needs are addressed in
separate chapters as noted below:
Some children and youth develop mental health and/or substance abuse issues.
These are addressed in the chapter “Behavioral Health.”
Other children are neglected, abused, exposed to violence or need to be placed
out of their family home. The services to address their needs are addressed in
the chapter “Child Abuse and Neglect, Foster Care, Adoptions.”
Some children engage in problematic behaviors that make them a risk to
themselves or others and as a result engage in some way with the justice system.
The services to address their needs are addressed in the chapter “Child Abuse and
Neglect, Foster Care, Adoptions.”
Some children are victims of non-family violence, including sexual violence. The
services to address their needs are addressed in the chapter “Child Abuse and
Neglect, Foster Care, Adoptions.”
Some children are born with or develop various intellectual and developmental
disabilities. They are addressed in the chapter “Persons with Intellectual and
Developmental Disabilities (IDD).”

DRAFT Lee County Human Services Gap Analysis
Secon Three: Development – The Foundaon
Chapter 13 – Child and Youth Development Page | 168
Other children are born with or develop visual or hearing impairments. They are
addressed in the chapter “Deafness and Blindness: Birth or Early Childhood
Development.”
Some children experience homelessness. The chapter “Homelessness” addresses
this topic.
Many children live in families that are cost-burdened for housing and may rely on
public transportation to some degree. These topics are covered in the
infrastructure chapters on housing and transportation.
The above chapters discuss the community’s response to children for whom the desired
development track has failed. This chapter focuses on that track and how it might be
more effective.
The services described in this chapter are beneficial and important to the development
of any child. There has been a recognition, however, that some children are at greater
risk of failing to meet developmental milestones, live in higher-risk conditions or, for
some other reason, need additional support. The services described herein are both
“developmental” in that they support an expected and desired developmental path and
“preventative” in that they address issues that could result in deviation from that path.
Because poverty is one indicator of at-risk status, a separate section on childhood
poverty is included in this chapter. Chapter 2 provides a summary of poverty in the
County. Federal Poverty Guidelines vary by household size. As shown in Table 58 of this
chapter the Federal Poverty Level (FPL) for a four-person household is $24,250. There
are various formulas for defining poverty for program purposes that may define poverty
by a percentage of the FPL, such as 200%. Poverty statistics are developed both by the
U.S Census Bureau and the U.S. Department of Housing and Development.
The format of this chapter begins with a context and background section. Then the
system-of-care is described, followed by a gaps analysis. A section on childhood poverty
closes the chapter.

DRAFT Lee County Human Services Gap Analysis
Secon Three: Development – The Foundaon
Chapter 13 – Child and Youth Development Page | 169
Context and Background
Nearly 18% of County residents (approximately 132,000 people or 17.6%) are younger
than 18. Of those, 4.6% are under 5 years of age (approximately 34,000 children).
139
The 0-to-Age-8 Emphasis in Child Development: Advances in Brain Research
Research in child development has stressed the significance of early brain
development. The first eight years of life, including natal development, build the
foundation for future learning, health and life success.
140
In reality, the
development of a healthy brain begins before pregnancy and continues during
pregnancy.
141
Long-term negative consequences for the child’s brain can come from exposure
to stress and trauma.
142
Poverty, unstable home environments, violence and a
lack of access to quality early education can negatively affect a child’s
development and long-term health and wellbeing.
143
Therefore, it is important to
track the developmental milestones of at-risk children to detect problems early
and to use evidence-based interventions.
144
In Lee County these milestones are
tracked to various degrees by child-care providers through the Early Learning
Coalition and the school system. The Kids Count database reports some of these
milestones and is commonly used to compare counties.
Brain research is described in detail below so that the rationale for the 0-to-age-8
emphasis can be clearer.
A baby is born with roughly 100 billion neurons,
145
which is almost all the
neurons the brain will ever have.
146
139
U.S. Census
140
www.cdc.org/childdevelopment/earlybraindevelopment
141
ibid.
142
ibid
143
www.astho.org/maternalandchildhealth/earlybraindevelopment
144
ibid
145
Aoki C, Siekevitz P. Plascity in brain development. Sci Am. 1988; 259(6):56-64.
hps://www.ncbi.nlm.nih.gov/pubmed/2849807.
146
Graham J. Children and Brain Development: What We Know About How Children Learn. Cooperave Extension
Publicaons. hps://extension.umaine.edu/publicaons/4356e/.

DRAFT Lee County Human Services Gap Analysis
Secon Three: Development – The Foundaon
Chapter 13 – Child and Youth Development Page | 170
Although a newborn has about the same number of neurons as an adult, it
has only 25% of its adult brain volume. This is because an infant’s neurons
are connected by about 50 trillion connections, called synapses, whereas a
grownup has about 500 trillion synapses.
147
The human brain is fully
developed by around age 25, although it continues to develop throughout
life at a slower pace.
The network of synapses grows rapidly during the first year and continues
to do so during toddlerhood. This network ultimately determines how a
child thinks and acts. However, not all synapses remain as the child grows.
Some neurons will be activated by life experiences and create new
connections or strengthen existing ones. Unused connections will be
eliminated, which is called synaptic pruning.
The human brain in the early years has high neuroplasticity; it is easily able
to change and adapt due to experience. This is a great strength, but it also
means that the experiences a child has during the early years can have a
significant impact.
An example of synaptic pruning is quoted here:
148
“Let’s say a parent
consistently shows a toddler love and care, then the ‘love-and-care
connections’ will develop or strengthen over time. But if the parent
constantly punishes or is harsh to the child, then the ‘punitive-and-harsh
connections’ will be stronger instead. And because the love-and-care
experience is missing, those corresponding brain cells will wither and
eventually be removed from the child’s brain network. As a result, the
child grows up lacking the love-and-care understanding that is essential to
create healthy, meaningful relationships in his future life”.
There are two other key concepts in childhood brain development. They are
Critical/Sensitive Periods and the twin effects of Nature and Nurture
(Environment) on Child Development.
Critical / Sensitive Periods. A critical /sensitive period is a time when
synaptic connections in certain brain regions are higher neuroplasticity.
147
Gauvain M, Cole M. Readings on the Development of Children. 5th ed. Worth Publishers; 2008
148
Brain Development – Why a Child’s Early Years’ Matter. Parenting for Brain. 2019

DRAFT Lee County Human Services Gap Analysis
Secon Three: Development – The Foundaon
Chapter 13 – Child and Youth Development Page | 171
Connections are formed or strengthened given the appropriate
experiences. After the critical period has passed, the synapses become
stabilized with less plasticity. For example, it is easier for a young child to
learn a new language and attain proficiency before puberty. The sensitive
period for language mastery is from birth to before puberty.
Nature vs Nurture in Child Development. As noted above, early life
experiences significantly influence how the network of brain cells is
formed. However, early life experience may have another significant
impact on a child’s life.
Scientific evidence indicates that life experiences can affect how
information in a gene is used (epigenetics). In some cases, genes can be
slowed or shut off, and in other cases a gene’s output can be increased.
149
Even more important, these epigenetic changes can be permanent and
passed down from generation to generation. This latter finding has
significance for at-risk children.
While there has been a lengthy debate about the comparative significance
of nature vs. environment, the field of epigenetics offers a different way
for this discussion and analyses to develop. Both genes and environment
are important factors.
The System-of-Care: The Major Public Investment Strategies
In Florida, the development of children and youth occurs through three major areas of
public investment. Each are discussed below.
Healthy Start/Maternal Child Health/Newborns
The Florida Department of Health offers Healthy Start as “a free home visiting program
that provides education and care coordination to pregnant women and families of
149
Sles J, Jernigan TL. The Basics of Brain Development. Neuropsychol Rev. November 2010:327-348.
doi:10.1007/s11065-010-9148-4

DRAFT Lee County Human Services Gap Analysis
Secon Three: Development – The Foundaon
Chapter 13 – Child and Youth Development Page | 172
children younger than 3. The goal of the program is to lower risk factors associated with
preterm birth, low birth weight, infant mortality and poor developmental outcomes.
Healthy Start offers:
Home visiting;
Prenatal and parenting education;
Interconception education including reproductive life planning;
Stress management education; and
Care coordination to help families learn about resources available in the community
and assistance in accessing those services.
150
Florida's Healthy Start initiative was signed into law on June 4, 1991. Healthy Start
legislation provides for universal risk screening of all Florida's pregnant women and
newborn infants to identify those at risk of poor birth, health and developmental
outcomes. Healthy Start is funded from a mix of State and federal funds. Every physician
is required to offer the Healthy Start Prenatal Risk Screen. Women are then referred to
the Healthy Start program if the risk screen so indicates. A second survey is conducted at
birth. Services available if needed include:
Help to have a healthy pregnancy weight;
Phone calls or visits with a Care Coordinator, who is a trained nurse or social service
worker;
Information about local resources;
Free classes in baby care, breastfeeding and childbirth education;
Help to stop smoking;
Help with high stress, difficult problems or postpartum depression;
Help with breastfeeding, including in-home postpartum support;
Check-ups on the baby’s health and development;
Free parenting classes;
Grief counseling; and
Help with necessary baby supplies.
Healthy Start Southwest Florida covers Collier, Hendry, Glades and Lee counties. In 2018,
more than 15,000 pregnant women and infants were served. In addition to the standard
150
www.floridahealth.gov/programs&services/infant_child&adolescent/healthystart
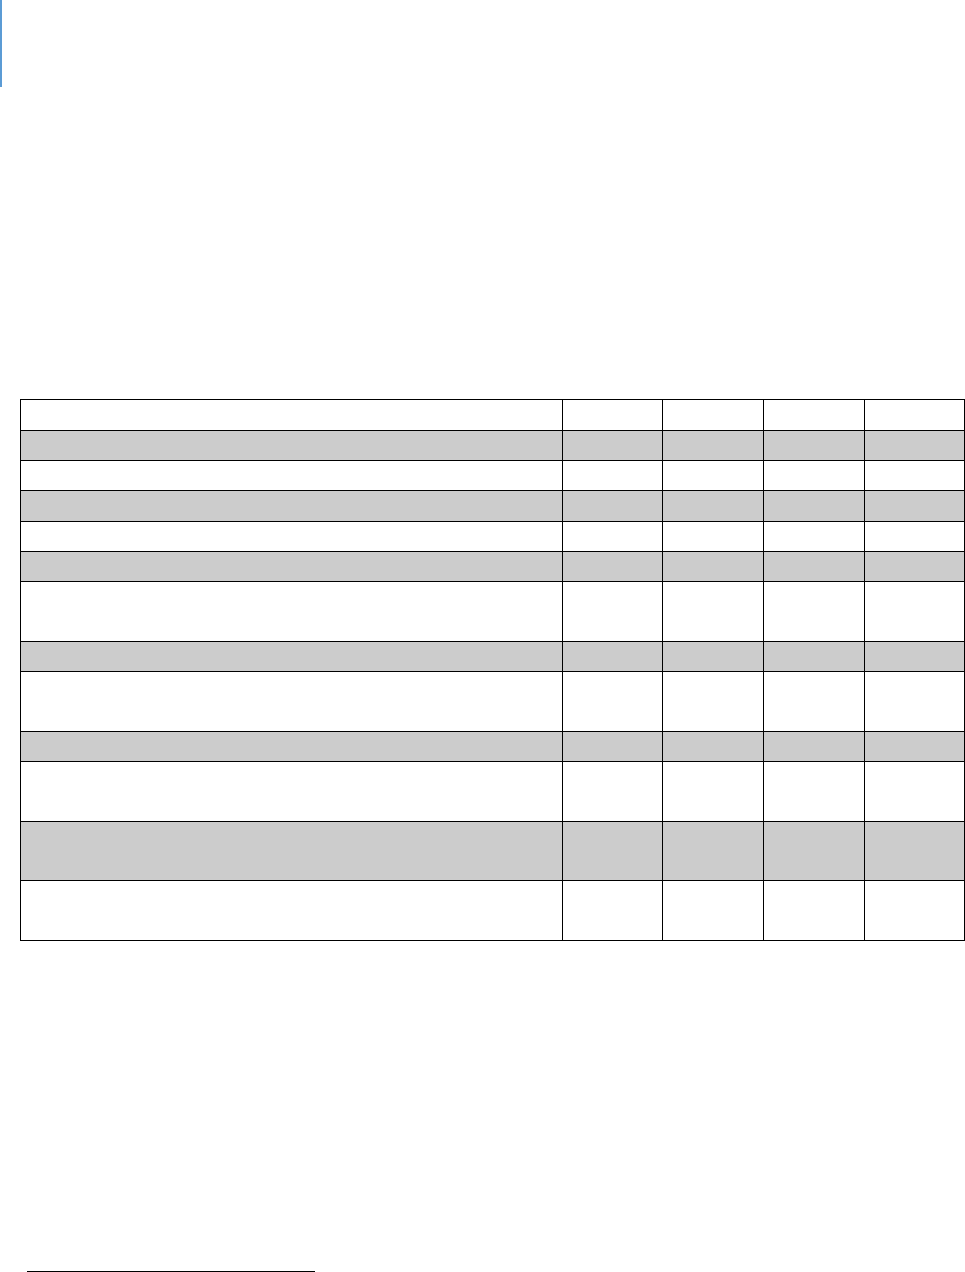
DRAFT Lee County Human Services Gap Analysis
Secon Three: Development – The Foundaon
Chapter 13 – Child and Youth Development Page | 173
services, the Help Me Grow program seeks to address early identification of
developmental or behavioral concerns. Another offered program is the Nurse-Family
Partnership for first-time, low-income mothers in which R.N. visits are provided for the
first two years. There are also classes for pregnant teens and young mothers.
Table 52 presents data relevant to Healthy Start in Lee County as well as the other
counties the program serves.
Table 52. Community Demographics
Collier
Glades
Hendry
Lee
Total Population
356,774
13,197
39,064
700,165
Number of women of childbearing age
51,385
1,613
7,324
110,253
Number of children under five
16,669
477
2,855
33,694
Percentage of population that is White
89.2%
80.8%
80.2%
86.3%
Percentage of population that is Black
7.5%
14.0%
13.7%
9.4%
Percentage of population that is some other race or
two or more races
3.3%
5.2%
6.1%
4.3%
Percentage of population that is Hispanic
151
27.2%
20.8%
51.9%
20.2%
Percentage of population with at least a high school
diploma
86.5%
73.7%
65.1%
87.3%
Median family income
$72,804
$43,206
$44,603
$61,847
Percentage of people with children under five below
the federal poverty level
25.1%
34.8%
31.8%
27.0%
Percentage of population that speaks a language
other than English at home
32.5%
22.5%
47.2%
22.1%
Percentage of population that has moved in the last
year
16.8%
11.4%
16.1%
15.8%
Source: American Community Survey, 2013-2017 estimate
The mission of Healthy Start is to increase healthy births and reduce infant deaths. Figure
7 provides context for assessing mission success by reporting the total number of births.
Figures 8 and 9 summarize two important indicators of the mission: low birth weight and
infant mortality. As figure 8 indicates, the percentage of low-birth weights in Lee County
has declined slightly during the five reporting periods. As figure 9 indicates, infant death
rates per 1,000 births has a slight decline during the five reporting periods. In both cases
the rates in Lee County are better than State averages.
151
The terms “Hispanic” and “Lano” are used interchangeably by the U.S. Census Bureau to refer to persons of
Cuban, Mexican, Puerto Rican, Central and South American, Dominican, Spanish, and other Hispanic descent.
Hispanics/Lanos may be of any race.
DRAFT Lee County Human Services Gap Analysis
Secon Three: Development – The Foundaon
Chapter 13 – Child and Youth Development Page | 174
Figure 7. Number of Births in each County, Rolling Three-year Average
Figure 8. Percentage of Live Births under 2,500 grams, Rolling Three-year Average
Source: Florida Department of Health, CHARTS
11-13 12-14 13-15 14-16 15-17
Florida
8.6% 8.6% 8.6% 8.7% 8.7%
Collier
7.2% 7.0% 6.9% 6.7% 6.9%
Glades
6.8% 5.2% 6.4% 8.3% 9.7%
Hendry
8.6% 6.7% 7.0% 7.4% 8.0%
Lee
8.5% 8.5% 8.2% 8.0% 8.1%
0%
2%
4%
6%
8%
10%
Collier Glades Hendry Lee
11-13
9,499 207 1,775 19,070
12-14
9,590 194 1,729 19,152
13-15
9,698 204 1,769 19,527
14-16
9,867 205 1,770 19,879
15-17
9,761 206 1,779 20,206
0
5,000
10,000
15,000
20,000
DRAFT Lee County Human Services Gap Analysis
Secon Three: Development – The Foundaon
Chapter 13 – Child and Youth Development Page | 175
Figure 9. Infant Death Rate per 1,000 Live Births, Rolling Three-year Average
Source: Florida Department of Health, CHARTS
Other related programs include:
Nurse-Family Partnership (NFP)
NFP is a free, voluntary program for first-time mothers. Each mother that NFP
serves is partnered with a registered nurse early in her pregnancy and receives
ongoing home visits that continue through her child's second birthday. NFP is an
evidence-based community health program with three decades of research
proving that it works.
Healthy Families Florida (HFF)
HFF is funded by the Ounce of Prevention Fund of Florida (a private nonprofit)
and is supported by the Florida Department of Children and Families. It is a
nationally accredited home visiting program for expectant parents and parents of
newborns experiencing stressful life situations. The program seeks to improve
childhood outcomes and increase family self-sufficiency through parent education
and community support. It is a voluntary program.
152
152
www.healthyfamiliesfla.org
11-13 12-14 13-15 14-16 15-17
Florida
6.2 6.1 6.1 6.1 6.1
Collier
5.1 4.9 5.8 5.4 5.8
Glades
9.7 15.5 9.8 14.6 9.7
Hendry
5.6 4.6 4.0 2.8 5.1
Lee
6.2 5.7 5.7 5.9 5.9
0
2
4
6
8
10
12
14
16

DRAFT Lee County Human Services Gap Analysis
Secon Three: Development – The Foundaon
Chapter 13 – Child and Youth Development Page | 176
Help Me Grow.
The Help Me Grow program of Healthy Start promotes early identification of
developmental, behavioral or educational concerns. It provides:
Development and behavioral screenings;
Information and resources;
Referrals;
Enrollment assistance; and
Networking opportunities for families and other stakeholders.
Connect
This is a new service being provided in Lee County. It is intended to eliminate
duplication of services with respect to in-home parenting programs. This does not
take the place of the screens that are conducted at the Obstetrician’s office or
hospital.
Clients (self-referrals or agency referrals) can refer directly to the number
provided in the Connect flier. When clients call the number, a Connect Intake
Advisor will review their information and circumstances and will decide which of
the several in-home parenting programs (Healthy Start, Nurse Family Partnership
or Healthy Families) will best fit their needs.
Drug Exposed Newborn Task Force
Because of the high number of babies exposed to drugs, a Drug Exposed Newborn
Task Force in Lee County has been established. Its focus is to seek solutions and
identify strategies to address this vulnerable population.
School Readiness and Preschool Programs
Significant emphasis and public investment have been placed on preschool programs.
There is a range of research that indicates the investment in early childhood
development programs results in long-term economic and social benefits for the children
themselves as well as society at large.
153
A 2005 Rand study found a return on
investment ranging from $1.80 to $17.07 for every dollar invested in an early childhood
153
Marlowe, H. & Arrington, L. 2009. The economic impact of investments in programs for children and youth.
Report to Collier County.

DRAFT Lee County Human Services Gap Analysis
Secon Three: Development – The Foundaon
Chapter 13 – Child and Youth Development Page | 177
intervention.
154
The $1.80 pole consists of basic childhood education programs that
would be found in any quality program. The $17.07 pole consists of highly enriched
programs that offer a range of activities and options provided consistently through a long
period of time.
As with all research however, there are mixed findings and substantive questions of
research design and data interpretation regarding the impact of preschool. Major
longitudinal (long-term, multiple-observation) studies of the Perry Preschool Project and
the Abecedarian Project criticized those highly regarded and heavily studied preschool
programs as unrealistically costly as well as dated.
155
A comprehensive meta-analysis of
preschool studies found that participants gained about a 1/3 of a year of school.
156
Another study found a gain of a half-year to a full-year.
157
Other studies have raised
concerns about the return on investment. The U.S. Department of Health and Human
Services found that third-graders who participated in Head Start as 3- and 4-year-olds
showed no clear benefits in cognitive or social-emotional development when compared
with students who didn’t attend Head Start.
158
In contrast to this conclusion, other
researchers have found longer-term benefits of Head Start that include more years of
schooling, higher earnings and better health.
159
Recognizing the possible limitations of the preschool programming, there has been an
emphasis on the ages of 0 to 8, along with a schooling emphasis on ages 3 to 8. This is
due, in part, to a recognition that there is a school-readiness gap separating
disadvantaged children from their more affluent peers. With the first 18 months, low-
income children begin to fall behind in vocabulary development and other skills critical to
school success.
160
Figure 10 provides examples of this pattern.
154
www.rand.org/publishedresearch/researchbriefs/provenbenefitsofearlychildhoodinterventions.
155
Weir, K. 2014. The preschool puzzle. Monitor on Psychology, 45(5) 41
156
Duncan, G, 2013. Investing in preschool programs. Journal of Economic Perspectives, 27(2): 109-132.
157
Yoshikawa, H. 2013. Investing in our future: The evidence based on preschool education. Society for Research in
Child Development.
158
Weir, op.cit.
159
Yoshikawa, op.cit.
160
www.gradelevelreading.net/3rdgradereadingsuccessmatters
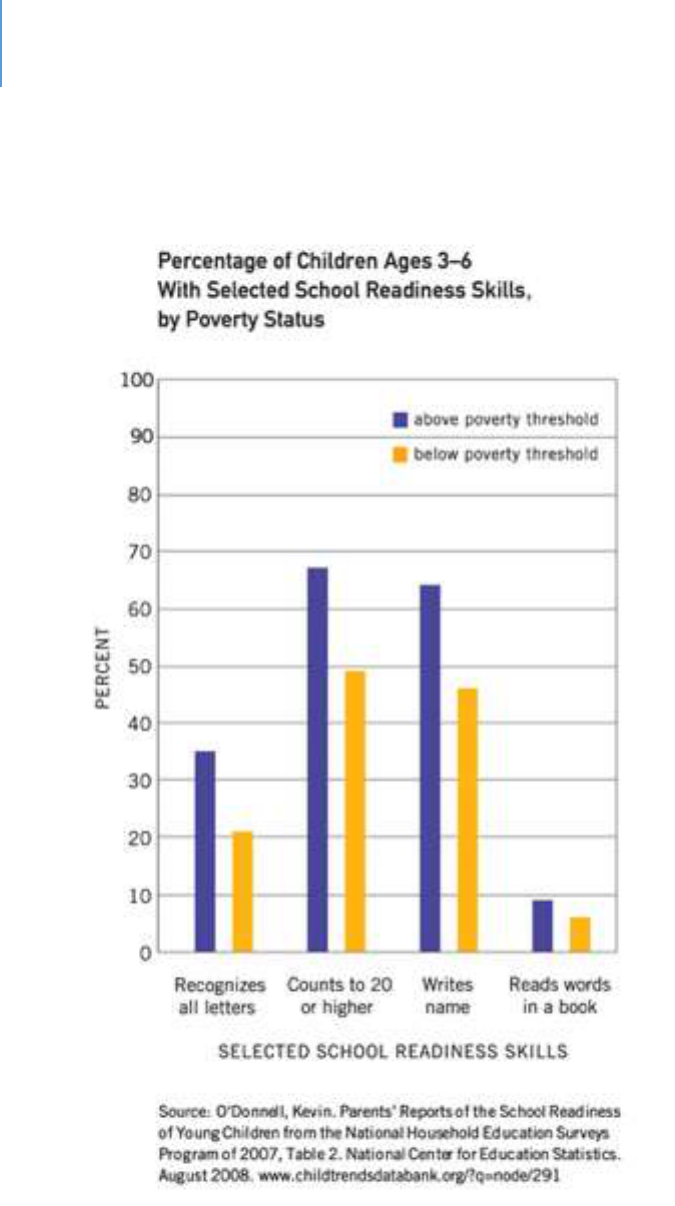
DRAFT Lee County Human Services Gap Analysis
Secon Three: Development – The Foundaon
Chapter 13 – Child and Youth Development Page | 178
Figure 10. Percentage of Children Ages 3-6 with Selected School Readiness Skills by Poverty
Status

DRAFT Lee County Human Services Gap Analysis
Secon Three: Development – The Foundaon
Chapter 13 – Child and Youth Development Page | 179
Other data points that illustrate this gap are:
161
61% of low-income children have no children’s books at home.
By age 2, poor children are already behind their peers in listening, counting and other
skills essential to literacy.
A child’s vocabulary as early as age 3 can predict third-grade reading achievement.
By age 5, a typical middle-class child recognizes 22 letters of the alphabet, compared to 9
for a child from a low-income family.
Why Success by Age 8 Matters
The reason age 8 is so significant is that it has been determined that children who are not
proficient in reading when finishing the third-grade are more likely to enter the “drop-
out of school” track.
162
Students’ reading skill level by third-grade (e.g., proficient, basic,
or below basic) affects their likelihood of graduating from high school. Twenty-three
percent of students with below-basic reading skill levels dropped out or failed to finish
high school on time, compared with 9% of students with basic skill levels and 4% of
students with proficient reading skills.
163
The impacts of dropping out of school are
discussed under the public-school system section.
Why the Quality of Early Childhood Education is Critical for Future Success.
Early Childhood Education is defined as covering the ages of 0 to 8. While preschool is
encompassed, numerous studies have indicated the importance of a continued emphasis
through age 8, particularly for at-risk children.
Neuroplasticity and epigenesis are two major cornerstones in understanding child brain
development. Parents play a significant role in brain development, and some parenting
styles have been found to be better than others.
164
161
ibid
162
Early Warning: Why Reading at 3
rd
grade matters. Annie E. Casey Foundation
163
Hernandez DJ. Double jeopardy: how third-grade reading skills and poverty inuence high school graduaon.
New York: The Annie E. Casey Foundaon; 2011
164
Impact of Parenng Pracces on Adolescent Achievement: Authoritave Parenng, School Involvement, and
Encouragement to Succeed. By Laurence Steinberg, Susie D. Lamborn, Sanford M. Dornbusch, Nancy Darling, 1992

DRAFT Lee County Human Services Gap Analysis
Secon Three: Development – The Foundaon
Chapter 13 – Child and Youth Development Page | 180
In addition to programs that provide parental education, early childhood education is
also important to a child’s cognitive growth. Quality preschools have been shown to
benefit children’s’ development in the long term.
165
Early childhood education increases
a child’s cognitive development, reduces grade retention and improves behavior during
elementary years.
166
Studies have found that when these students grow up, they tend
to be involved less in delinquency and are more likely to have a skilled job.
167
As an example of studies that examine the longer-term impacts of quality early childhood
education, the following is quoted:
“Researchers led by Arthur Reynolds, Ph.D., at the University of Minnesota,
Minneapolis, followed the 30-year progress of 989 children who attended the
Child-Parent Centers (CPC) program in inner-city Chicago as preschoolers.
“This study suggests that a high-quality, early childhood intervention program,
especially one that extends through third grade, can have benefits well into adult
life,” said James A. Griffin, Ph.D., deputy chief of the Child Development Branch at
the Eunice Kennedy Shriver National Institute of Child Health and Human
Development (NICHD).
The CPC program provides intensive instruction in reading and math, combined
with frequent educational field trips, from pre-kindergarten through third grade.
The program also provides parents with job and parenting skills training,
educational classes and social services. In addition, the program encouraged
parents to volunteer in classrooms, assist with field trips and participate in
parenting support groups.
Researchers compared the educational outcomes of graduates from 20 CPC
schools to those of 550 children from low-income families who attended five
other early randomly selected schools in the Chicago area with childhood
intervention programs. The researchers collected information on the children
165
Early Child Care and Children’s Development Prior to School Entry: Results from the NICHD Study of Early Child
Care. American Educaonal Research Journal. March 2002:133-164. doi:10.3102/00028312039001133
166
Barne WS. Long-Term Eects of Early Childhood Programs on Cognive and School Outcomes. The Future of
Children. 1995:25. doi:10.2307/1602366
167
Barne WS. Preschool educaon and its lasng eects: Research and policy implicaons. Boulder and Tempe:
Educaon and the Public Interest Center & Educaon Policy Research Unit. 2008

DRAFT Lee County Human Services Gap Analysis
Secon Three: Development – The Foundaon
Chapter 13 – Child and Youth Development Page | 181
from administrative records, schools and families, from birth through 35 years of
age.
On average, graduates of the CPC program—whether they took part in preschool
only or attended until second or third grade—completed more years of education
than those who participated in other early intervention programs.
Among those receiving an intervention in preschool, children in the CPC group
were more likely as adults to achieve an associate’s degree or higher (15.7% vs.
10.7%), including a bachelor’s degree (11% vs. 7.8%) and master’s degree (4.2%
vs. 1.5%).
CPC graduates who attended the program through second or third grade had
even higher educational gains than their counterparts: associate’s degree or
higher (18.5% vs. 12.5%), including a bachelor’s degree (14.3% vs. 8.2%) and
master’s degree (5.9% vs. 2.3%).
The authors wrote that, to their knowledge, their study is the first to follow
participants past age 25, a time in life when many people attain advanced
degrees. Their previous research has shown that CPC graduates have gone on to
have higher incomes, lower rates of serious crime and incarceration and lower
rates of depression, compared to those who participated in other early
interventions.
The authors added that successful early childhood programs can also improve
adult health. They noted that adults with less education are more likely to adopt
unhealthy habits like smoking and to experience high blood pressure, obesity and
mental health problems
168
.
What is Quality Early Childhood Education?
Quality always has an “eye of the beholder” dimension to it. However, for public
investments to be made, the term must be defined beyond consumer perception.
168
Reynolds, A.J., et al. A mulcomponent, preschool to third grade prevenve intervenon and educaonal
aainment at 35 years of age. JAMA Pediatrics. Doi:110.1001/jamapediatrics.2017.4673

DRAFT Lee County Human Services Gap Analysis
Secon Three: Development – The Foundaon
Chapter 13 – Child and Youth Development Page | 182
The following are elements of high-quality, early childhood education programs as
indicated by research and professional standards.
169
These include:
Early learning standards and curricula that address the whole child, are
developmentally appropriate, and are effectively implemented;
Assessments that consider the children’s academic, social-emotional, and physical
progress and contribute to instructional and program planning;
Well-prepared teachers who provide engaging interactions and classroom
environments that support learning;
Ongoing support for teachers, including coaching and mentoring;
Support for English learners and students with special needs;
Meaningful family engagement;
Sufficient learning time;
Small class sizes with low student-teacher ratios;
Program assessments that measure structural quality and classroom interactions;
and
A well-implemented state quality rating and improvement system.
169
Wechsler, M. et.al. 2016 The building blocks of high-quality early childhood education programs.
www.learningpolicyinstitute.org

DRAFT Lee County Human Services Gap Analysis
Secon Three: Development – The Foundaon
Chapter 13 – Child and Youth Development Page | 183
The Public-School System
While not an element of this gap analysis, the presence of the public-school system
should be acknowledged. In addition to the educational elements, public schools are a
major source of food security and nutrition, child and youth socialization and recreation
and health education and services. Success in school is highly correlated with future life
success, and failure to complete high school has several negative features as described
below.
There are many factors involved in the decision to drop out of school. These include:
Students whose parents are not involved are more likely to drop out of school.
170
Drop-out rates are higher in schools with safety and violence issues.
171
Sixth-graders who exhibit high aggression scores and low-study skills have a 50%
drop-out rate compared with sixth-graders with low-aggression scores and high
study skills who have a drop-out rate of less than 2%.
172
Dropping out of school has a negative impact for both the student who drops out and for
society. The key points are:
Half of Americans on public assistance are dropouts. A Northeastern University study
found that each high school dropout costs taxpayers $292,000 through the course of
his or her life.
173
Lifetime earnings of high school dropouts are $260,000 less than peers who earn a
diploma.
174
Table 53 shows the unemployment rates and weekly income differences
for people age 25 or older who are working full time.
170
Jaynes, WH. The relaonship between parental involvement and urban secondary school student academic
achievement. Urban Educ. 2007; 42(1):82–110.
171
Bekhuis, T. Unsafe public schools and the risk of dropping out: a longitudinal study of adolescents. Paper
presented at the annual meeng of the Eastern Psychological Associaon; 1995; Boston (MA).
172
Orpinas, P. 2018. Longitudinal examination of aggression and study skills from middle to high school. Journal of
School Health. 83(30 246
173
graduationalliance.com
174
graduationalliance.com

DRAFT Lee County Human Services Gap Analysis
Secon Three: Development – The Foundaon
Chapter 13 – Child and Youth Development Page | 184
Table 53. 2018 Unemployment and Income by Education Level
175
Education Status
Unemployment Rate
Weekly Median Income
Bachelor’s Degree
2.8
$1,198
High School Diploma
4.1
$730
Less than High School
Diploma
5.6
$553
In some areas and at some times he unemployment rate for dropouts has been 4%
higher than the national average.
176
Each year’s class of dropouts will cost the country more than $200 billion during their
lifetimes in lost earnings and unrealized tax revenue.
177
The estimated tax revenue loss from every male between the ages of 25 and 34 who
did not complete high school would be approximately $944 billion, with cost
increases due to public welfare and crime at $24 billion.
178
Students from low-income families have a dropout rate of 10%; middle-income
families have a dropout rate of 5.2%; and the high-income family dropout rate is
1.6%.
High school dropouts are more likely to have higher rates of heart disease, diabetes,
asthma and high blood pressures than high school graduates.
179
They are more likely
to die prematurely.
180
Dropouts have a higher rate of poverty (27%) when compared with high school
graduates (14%) and college graduates (5%).
181
175
U.S. Bureau of Labor Statistics
176
graduationalliance.com
177
Caerall, J. S. (1985). On the social costs of dropping out of schools. (Report No. 86-SEPT-3). Stanford, CA:
Stanford University, Center for Educaonal Research.
178
Thorstensen, B. I. If you build it, they will come: Invesng in public educaon (PowerPoint Presentaon).
Retrieved January 12, 2004. Available:hp://abec.unm.edu/resources/gallery/present/invest_in_ed.pdf
179
Vaughn, M, et.al. 2014. Dropping out of school and chronic disease in the United States. Z Gesundh Wiss 22(3):
265-27
180
DeBaum, B. et.al. 2013. Well and Well-Off: Decreasing Medicaid and Health-Care costs by increasing educational
attainment. http://alt4ed.org.
181
2012-2016 American Community Survey 5 Year Estimates. U.S. Census Bureau

DRAFT Lee County Human Services Gap Analysis
Secon Three: Development – The Foundaon
Chapter 13 – Child and Youth Development Page | 185
High school graduates are less likely to engage in criminal behavior or require social
services.
182
The good news is that the national graduation rate for 2016 was 84.1%, an all-time
high.
183
Other Elements of the System of Services and Programs Addressing Early Childhood Care and
Education
There are several components that address the years of early childhood in which
educational opportunities could occur. With overlap among these, they include:
Unlicensed Care – informal. These services are provided in a home for children from a
single family.
Unlicensed Care – family. These serve a group of non-related children.
Unlicensed Care – religious, summer camps, nonprofit membership organizations and
hotel-care organizations are exempt from licensing requirements.
Registered Family Daycare. Registered settings must meet minimal standards
including annual health and safety checks, personnel background checks and staff
training in literacy and language development. There are staffing ratio requirements.
Licensed family daycare. These facilities must meet the registered standards plus
CPR/First Aid Training and provision of accommodations for special needs children.
There are also staffing ratio requirements.
Licensed Child-care Centers. These are facilities licensed by the Florida Department
of Child and Family Services to ensure a healthy and safe environment along with
proper staffing. They are not required to be staffed by credentialed teachers or
182
Sum, A. et al. (2009). The Consequences of Dropping Out of High School: Joblessness and Jailing for High School
Dropouts and the High Costs for Taxpayer. Boston, MA: Center for Labor Market Studies
183
U.S. Department of Educaon, Naonal Center for Educaon Stascs (NCES) through Public high school 4–year
adjusted cohort graduaon rate (ACGR), by race/ethnicity and selected demographics for the United States, the 50
states, and the District of Columbia: School year 2014–15. Retrieved
from: hps://nces.ed.gov/ccd/tables/ACGR_RE_and_characteriscs_2014-15.asp.

DRAFT Lee County Human Services Gap Analysis
Secon Three: Development – The Foundaon
Chapter 13 – Child and Youth Development Page | 186
assistants but are required to have staff with 40 hours of child-care training. The age
of children in a care center can range from weeks to 12 years.
Some daycares primarily provide a child-watching service while others seek to add
support for healthy development as a basis for school readiness.
Preschools. Preschools serve children ages 2 to 4. The curriculum in preschools can
range from no curriculum at all (the children play and socialize the whole time) to
teaching young children how to read. Most preschools are a mixture of play and
learning.
Early Head Start. This is a program for infants, toddlers and pregnant women. Early
Head start occurs in three settings:
Center based;
Early child-care partnership, licensed family daycare home; and
Great Kids, Great Start, weekly home visits and twice monthly groups.
Head Start. Head Start is funded by the federal government and is available free of
charge to low-income families who have 3- to 5-year-old children. It follows a
federally mandated curriculum with the goal of preparing at-risk children to succeed
in kindergarten.
School Readiness Program. This provides financial assistance for income-eligible
families for early education and care. It is funded primarily by a federal Child-care
and Development Fund Block Grant. The State of Florida Office of Early Learning
administer the grant. Eligible children are form 0 to 8 years of age and qualifying
family incomes are 200% or less than the federal poverty level.
Voluntary Pre-Kindergarten (VPK). VPK is a state-funded program for 4-year-olds.
Early Learning Coalitions. These are nonprofit organizations that manage local child-
care and development programs under the oversight of the Florida Office of Early
Learning.
School Readiness. This is a funding source. Using federal funds, the State assists with
childcare expenses for eligible families.

DRAFT Lee County Human Services Gap Analysis
Secon Three: Development – The Foundaon
Chapter 13 – Child and Youth Development Page | 187
Gaps in in the Child and Youth Development System
Healthy Start and other Maternal Health Programs
As noted by the Florida Department of Health, the need for services statewide has
continued to outstrip resources.
184
Therefore, some of the State’s efforts have been
limited. The State has prioritized specific target groups or ZIP codes, and it has identified
that across Florida additional program funding is required to cover additional recipients.
A Lee County-focused needs assessment, which was conducted by the local Healthy Start
agency, identified access to prenatal care as the priority local gap.
185
Other gaps this
need assessment identified were (1) a racial disparity in birth outcomes, (2) increased
programming to address the needs of mothers older than 18 without a high school
education and (3) births to mothers who were overweight or obese. Additionally, in Lee
County there was a need to address infant deaths, births to smoking mothers, births with
an inter-pregnancy interval of less than 18 months and births to mothers age 15 to 19.
Consistent with the conclusions of the Florida Department of Health program analyses,
the major gap in Lee County as well as the State, is that there are more people eligible
for the program than the programs have the capacity to serve.
186
184
www.floridahealth.gov
185
www.healthystartbaby.org . Healthy Start Southwest Florida Needs Assessment. October 2019.
186
www.floridahealth.gov

DRAFT Lee County Human Services Gap Analysis
Secon Three: Development – The Foundaon
Chapter 13 – Child and Youth Development Page | 188
Child and Youth Development
There are three gaps in the child and youth development area. One is that the demand
for subsidized child-care exceeds funding capacity by as much as 1,025 children as of the
most recent count. A second is that the incentives to meet quality childcare standards
are inadequate. The third is that the desired level of quality childhood efforts is not
being achieved. Each are discussed below.
Subsidized Child-care
The system serving child and youth development has a similar gap between the
demand for subsidized childcare in Lee County and the available service. As of
November 2019, there is a waitlist for of 1,025 individuals.
187
This is a single
waitlist managed by the Early Learning Coalition for licensed child-care. Again,
note that any gaps in the public-school system are not addressed.
Potential contributors to this gap include:
Since 2011, the reimbursement rates for VPK have not been adjusted.
188
For this coming year, state funding will be limited to ages 0 to 5. After-
school programs will no longer receive state support.
189
Quality incentives
A second gap in the child and youth development system is that incentives to
meet quality standards are inadequate for the effort required.
190
The costs
associated with meeting the various programmatic and staffing requirements are
not commensurate with the incentives.
Desired quality
The desired quality level of early childhood efforts is not being achieved. The
following data supports this conclusion. Table 54 shows that VPK students in Lee
187
communication, Early Learning Coalition
188
ibid.
189
ibid.
190
ibid.
DRAFT Lee County Human Services Gap Analysis
Secon Three: Development – The Foundaon
Chapter 13 – Child and Youth Development Page | 189
County fall below the state average on a readiness for kindergarten measure.
Table 55 reports data on educational variables. Fifty-eight percent of children age
3 or 4 in the county are not enrolled in a preschool program. If the thesis that
quality early childhood education leads to later success exists, then three of the
other variables in Table 55 are indicative of low-quality levels. Seventy-three
percent of fourth-grade students are not proficient (the top-level rating; others
are basic and below basic) in English language arts. Sixty-six percent of eighth-
grade students are not proficient in math. Seventeen percent of the students do
not graduate on time.
Another indicator of the effectiveness of quality early childhood education is a
lesser probability of involvement with the justice system. Table 56 shows Lee
County variables on this behavior. As the table shows, youth in Lee County have
higher-than-average rates. One must not draw evidence of direct causality from
this data, but it does raise the question as to whether higher quality early
childhood education efforts could have impacted these numbers.
Table 54. Kindergarten Readiness Scores
191
District
Number
District Name
Number of
Test Takers
Number "Ready for
Kindergarten"
(Scoring 500+ on
Star Early Literacy
Assessment) *
Percentage "Ready
for Kindergarten"
(Scoring 500+ on Star
Early Literacy
Assessment) *
00
FLORIDA
185,252
97,652
53%
36
LEE
6,408
2,539
40%
191
Fall 2018 FLKRS results by school district. Florida Kindergarten Readiness Screener.
http://www.fldoe.org/accountability/assessments/k-12-student-assessment/flkrs/
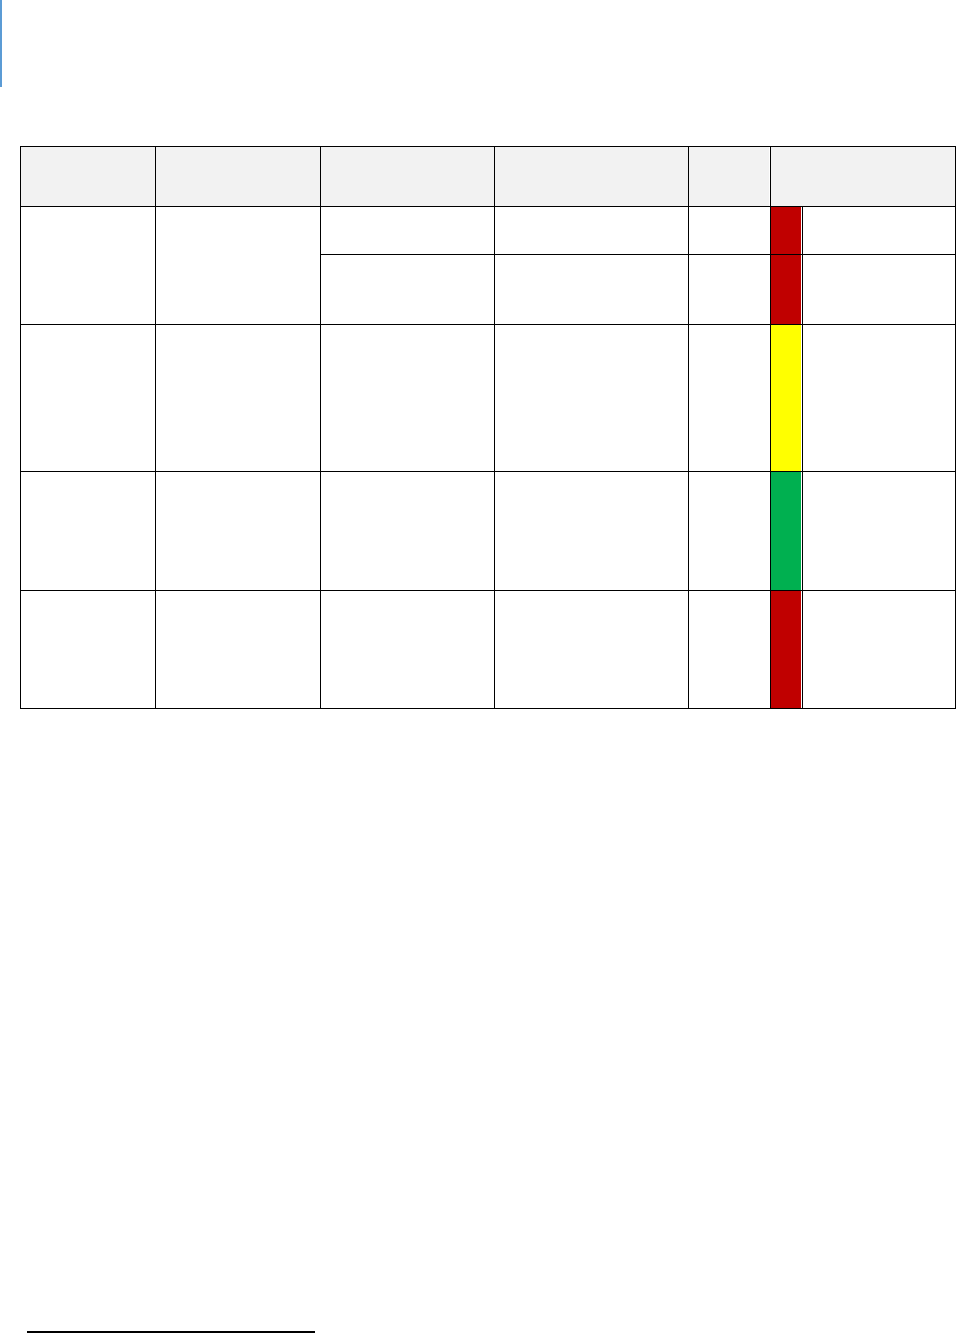
DRAFT Lee County Human Services Gap Analysis
Secon Three: Development – The Foundaon
Chapter 13 – Child and Youth Development Page | 190
Table 55. Education
Sources
Data Title
Year
Lee County
State
Comparison to
State
Kids
Count
192
3&4-year-old
children not
enrolled in
school
2012-2016
58.6%
49.5%
Worse
2013-2017
57.8%
49.5%
Worse
Kids Count
4th grade
students not
proficient in
English
Language Arts
2019 (Spring)
73%
70%
Within 10%
Kids Count
8th grade
students not
proficient in
math
2019 (Spring)
66%
79%
Better
Kids Count
High school
students not
graduating on
time
2019
17.20%
13.9%
Worse
192
http://www.floridakidscount.org/
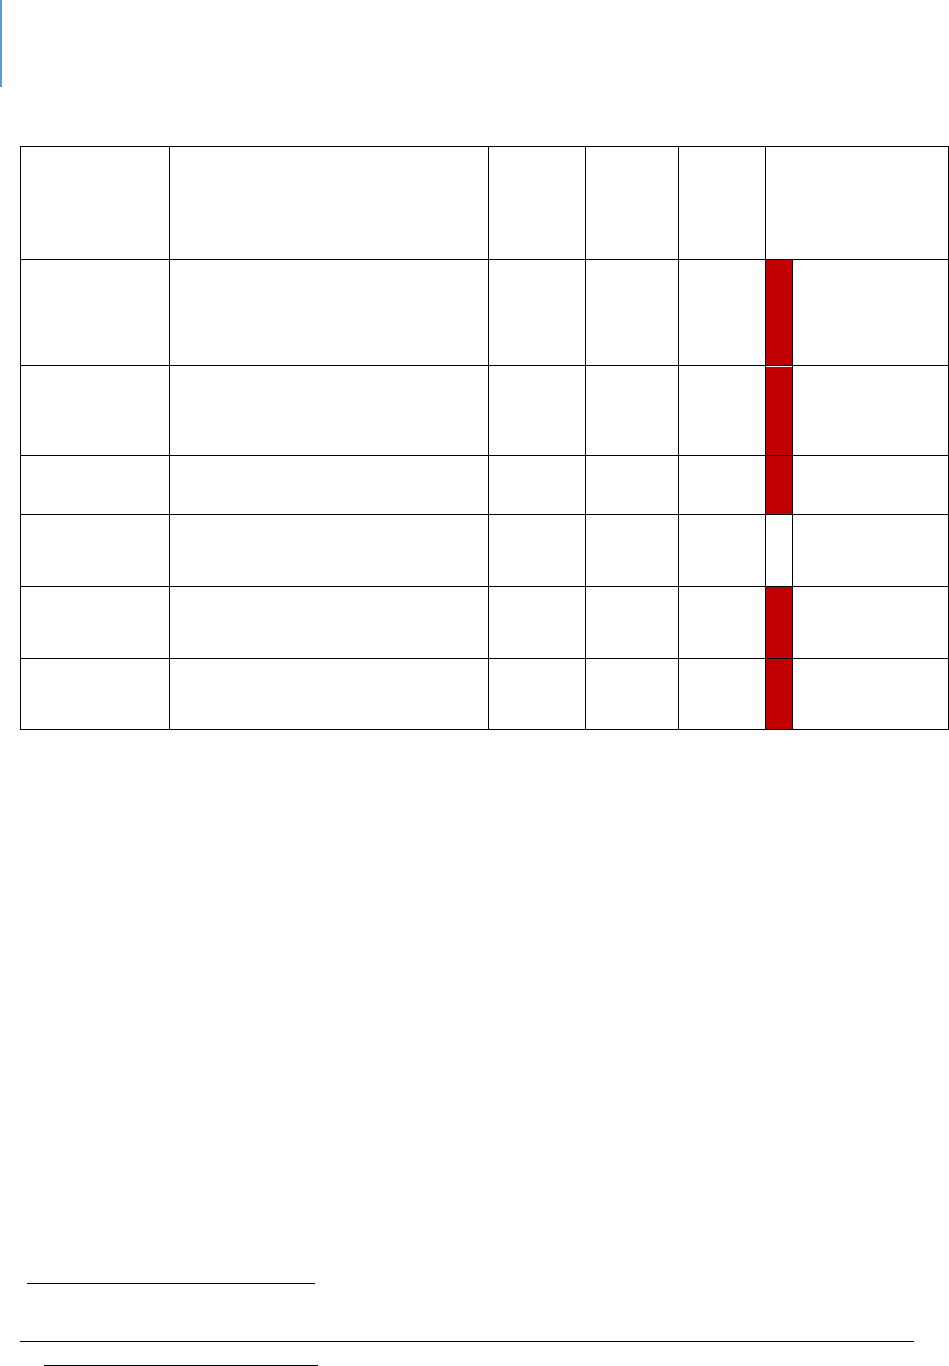
DRAFT Lee County Human Services Gap Analysis
Secon Three: Development – The Foundaon
Chapter 13 – Child and Youth Development Page | 191
Table 56. Violence Outcomes Regarding Children and Youth
Sources
Data Title
Year
Lee
County
State
Comparison to
State
Child Health
Status
193
Arrests, All Offenses by
County, Youth Ages 10-17 Per
100,000 population
2014-
16
4,473
4,028
Worse
Child Health
Status
Referrals to Department of
Juvenile Justice Per 100,000
population
2018
3,784
3,121
Worse
Kids
Count
194
Youth contacts with the
juvenile justice system
2017-
18
18.2%
16.4%
Worse
Child Health
Status
Homicide deaths 5-11 Per
100,000 population
2016-
18
0
.7
N/A
Child Health
Status
Homicide deaths 12-18 Per
100,000 population
2016-
18
7.2
5.3
Worse
Child Health
Status
Homicide deaths 19-21 Per
100,000 population
2016-
18
19.1
14.9
Worse
Interview and focus groups conducted for this analysis indicated a factor contributing
to the quality outcome gap is that prevailing local wage levels make it difficult to
attract or retain persons with certificates in Child Development (Child Development
Associates), a non-BA credential.
193
FL Health Charts. Child Health Status Profile,
http://www.flhealthcharts.com/ChartsReports/rdPage.aspx?rdReport=ChartsProfiles.ChildHealthStatusProfile
194
http://www.floridakidscount.org/
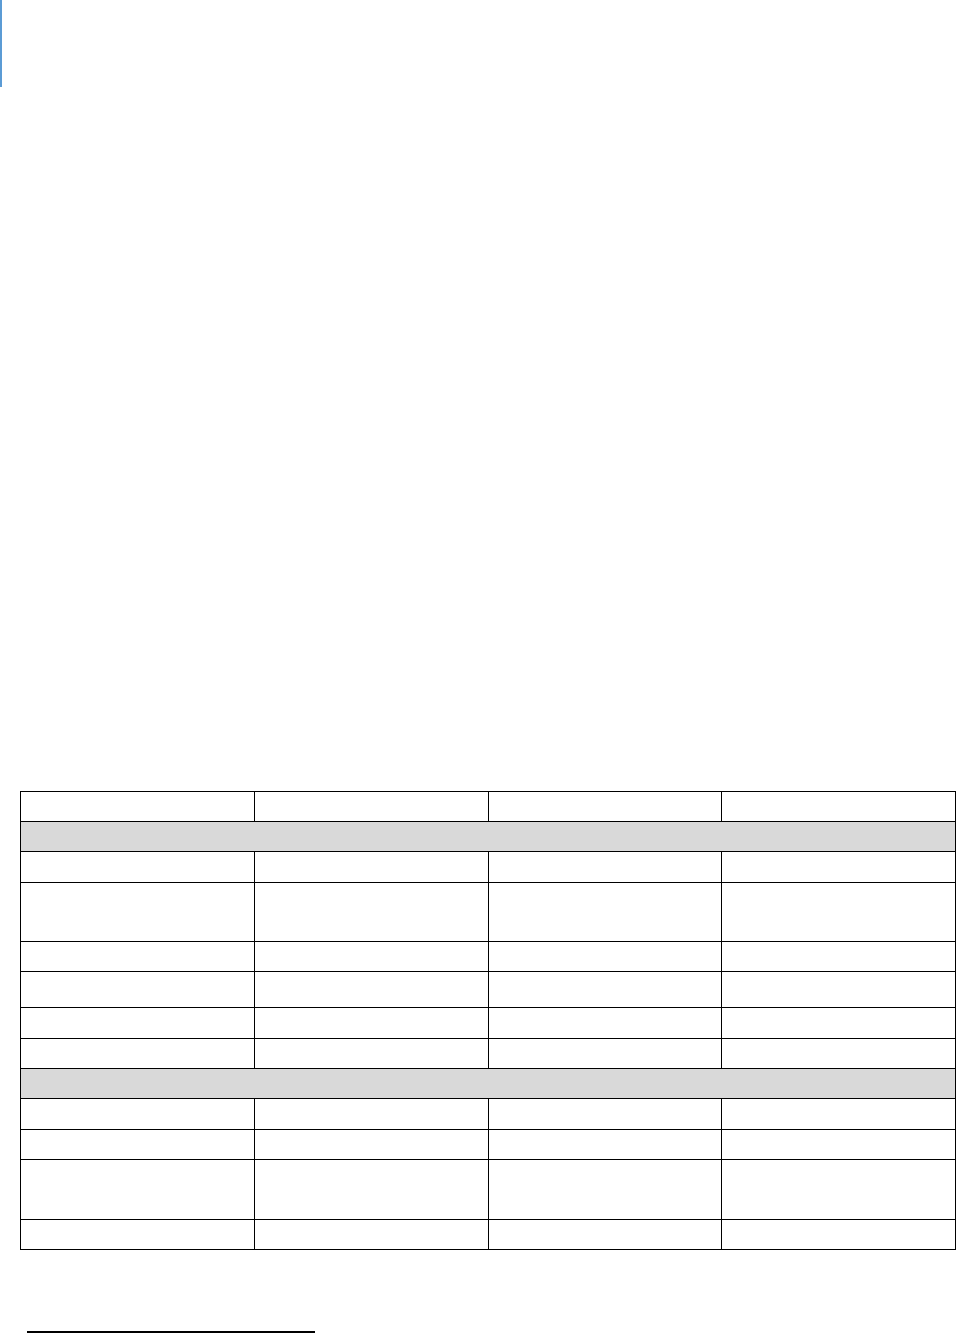
DRAFT Lee County Human Services Gap Analysis
Secon Three: Development – The Foundaon
Chapter 13 – Child and Youth Development Page | 192
Table 57 shows State-level data on the mean wages of various occupations comparable
in education and work experience to child-care workers. Two categories of jobs are
compared. One group is classified as “relationship jobs” in which the relationship
between the job and the customer is highly personal. The other category is transactional
in which the relationship is primarily impersonal and time limited.
As the table indicates, child-care workers have a lower median hourly wage than other
jobs which are also primarily relationship in nature. There are several implications of this
fact.
One is turnover. The interviews/focus groups raised this as an issue. If the child-care
worker and caretaker jobs are compared, there is a 50-cents-an-hour difference that
translates to a 5% raise if one goes from child-care worker to caretaker. At this level of
wage, a 5% raise is significant. The interviews/focus groups reported that people would
leave existing positions for relatively small hourly increases.
The second is quality. Stability is an important variable in almost all jobs, but it is
particularly important in relationship-based jobs, even more so for jobs involving
children. A different person behind the rental counter is not a significant event. A
change in a person with whom you interact daily and have learned to trust is more
significant.
Table 57. Median and Mean Hourly Wages for Selected Jobs in Florida
195
Code
Title
Median Hourly Wage
Average Hourly Wage
Relationship Jobs
39-9011
Child-Care Worker
10.51
11.34
39-9021
Personal Care
Assistant
10.68
11.24
39-2021
Caretaker
11.05
11.91
31-1011
Home Health Aide
11.11
11.67
39-9032
Recreation Worker
11.69
13.23
31-1013
Psychiatric Aide
11.89
12.45
Transactional Jobs
33-9091
Crossing Guard
11.46
12.13
31.1015
Orderly
11.83
12.76
41-2021
Counter and Rental
Clerk
12.54
14.14
43-5021
Courier
13.80
14.58
195
www.bls.gov. May 2018 Occupational and Wage Estimates, Florida

DRAFT Lee County Human Services Gap Analysis
Secon Three: Development – The Foundaon
Chapter 13 – Child and Youth Development Page | 193
Poverty as a Risk-Factor for Children and Youth
Researchers agree that there is a clear and established relationship between poverty,
socio-economic status and health outcomes—including increased risk for disease and
premature death.
196
Residents of impoverished neighborhoods or communities are at
increased risk for mental illness,
197
chronic disease,
198
higher mortality and lower life
expectancy.
199
They are also at risk for negative academic outcomes and violence
200
Poverty can negatively affect how the body and mind of the child develop.
201
Children in
poverty fall behind their more economically secure peers starting in infancy and widening
in toddlerhood.
202
Children in poverty are likely to have poor physical
203
and behavioral
health.
204
Children from families that receive welfare assistance are three times more
likely to use welfare benefits when they become adults than children from families who
do not receive welfare.
205
196
Singh GK, Siahpush M. Widening socioeconomic inequalies in US life expectancy, 1980–2000. Internaonal
Journal of Epidemiology. 2006;35(4):969-979
197
Caughy MO, O’Campo PJ, Muntaner C. When being alone might be beer: Neighborhood poverty, social
capital, and child mental health. Social Science & Medicine. 2003; 57(2):227-237.
198
Braveman PA, Cubbin C, Egerter S, Williams DR, Pamuk E. Socioeconomic disparies in health in the United
States: What the paerns tell us. Am J Public Health. 2010; 100(S1): S188-S196.
199
Mode NA, Evans MK, Zonderman AB. Race, neighborhood economic status, income inequality and mortality.
PLoS ONE. 2016; 12; 11(5):1-14. doi: 10.1371/journal.pone.0154535
200
Sharkey, P. et.al. 2012. The eect of local violence on children’s aenon and impulse control.
Am J Public Health. 2012 Dec; 102(12):2287-93. doi: 10.2105/AJPH.2012.300789. Epub 2012 Oct 18
201
Early experiences can alter gene expression and affect long-term development. 2010. The National Scientific
Council on the Developing Child. Working paper #10. Retrieved from www.developingthechild.harvard.edu.
202
Halle, T. et.al. 2009. Disparities in early learning and development: Lessons from the Early Childhood Longitudinal
Study. Child Trends. www.childtrends.org
203
MLaughlin, K. et.al. 2012. Food insecurity and mental disorders in a naonal sample of U.S. Adolescents.
J Am Acad Child Adolesc Psychiatry. 2012 Dec; 51(12):1293-303. doi: 10.1016/j.jaac.2012.09.009. Epub 2012 Nov
6.
204
Jordan, R. et.al. 2013. HOST Youth: The challenges of growing up on low-income housing. Urban Institute.
www.urban.org
205
Personal Responsibility and Work Opportunity Reconciliaon Act of 1996, Title I, 104th Cong., 2nd Sess. (1997).
Available from: hps://www.gpo.gov/fdsys/pkg/BILLS-104hr3734enr/pdf/BILLS-104hr3734enr.pdf

DRAFT Lee County Human Services Gap Analysis
Secon Three: Development – The Foundaon
Chapter 13 – Child and Youth Development Page | 194
Definition of Poverty
The official measure of poverty was established by the Office of Management and
Budget (OMB) in Statistical Policy Directive 14 and is designed to be used by federal
agencies in their statistical work.
Official poverty data comes from the Current Population Survey (CPS) Annual Social and
Economic Supplement (ASEC), formerly called the Annual Demographic Supplement or
simply the "March Supplement.”
Government-aid programs are not required to use the official poverty measure as
eligibility criteria. Each aid program may define eligibility differently. Many government-
aid programs use either a different poverty measure, the Department of Health and
Human Services (HHS) poverty guidelines, or variants thereof.
How the Census Bureau Measures Poverty
Following the Office of Management and Budget's (OMB) Statistical Policy Directive 14,
the Census Bureau uses a set of money income thresholds that vary by family size and
composition to determine who is in poverty. If a family's total income is less than the
family's threshold, then that family and every individual in it is considered in poverty. The
official poverty thresholds do not vary geographically, but they are updated for inflation
using the Consumer Price Index (CPI-U). The official poverty definition uses money
income before taxes and does not include capital gains or noncash benefits including
public housing, Medicaid and food stamps.
U.S. Department of Health and Human Services poverty guidelines
The poverty guidelines are the other version of the federal poverty measure. They are
issued each year in the Federal Register by the Department of Health and Human
Services (HHS). The guidelines are a simplification of the poverty thresholds for use
for administrative purposes — for instance, to determine financial eligibility for certain
federal programs. The Federal Register notice of the 2015 poverty guidelines is available.
The poverty guidelines are sometimes loosely referred to as the “federal poverty level”
(FPL), however, that phrase is ambiguous and should be avoided, especially in situations
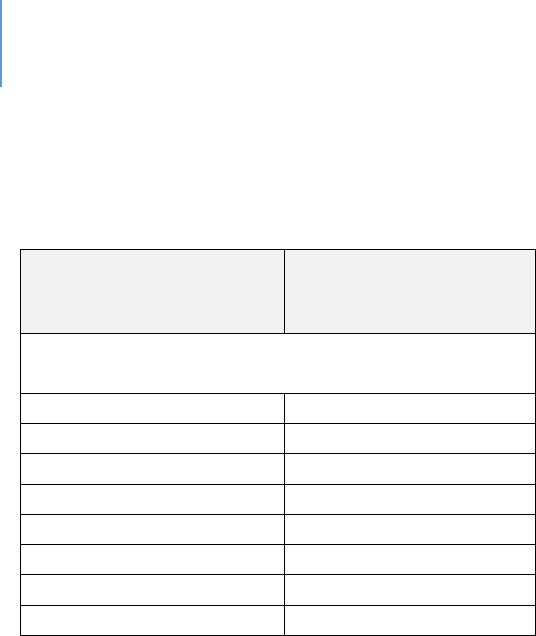
DRAFT Lee County Human Services Gap Analysis
Secon Three: Development – The Foundaon
Chapter 13 – Child and Youth Development Page | 195
(e.g., legislative or administrative) in which precision is important. Table 58 shows the
guidelines.
Table 58. 2015 Poverty Guidelines for the 48 Contiguous States and the District of Columbia
PERSONS IN
FAMILY/HOUSEHOLD
POVERTY
GUIDELINE
For families/households with more than 8
persons, add $4,160 for each additional person.
1
$11,770
2
$15,930
3
$20,090
4
$24,250
5
$28,410
6
$32,570
7
$36,730
8
$40,890
Children in Poverty is Created Using Statistical Modeling
Data comes from the Small Area Income and Poverty Estimates program, which uses data
from the American Community Survey. Estimates are produced using complex statistical
modeling. Model usage allows for the generation of more stable estimates for places
with small populations or survey counts.
Child Poverty in Lee County
Table 59 reports on child poverty in Lee County. The most recent data, 2017, indicates
that child poverty (defined as 200% of FPL) is slightly worse than the State average once
the 10% range is calculated.
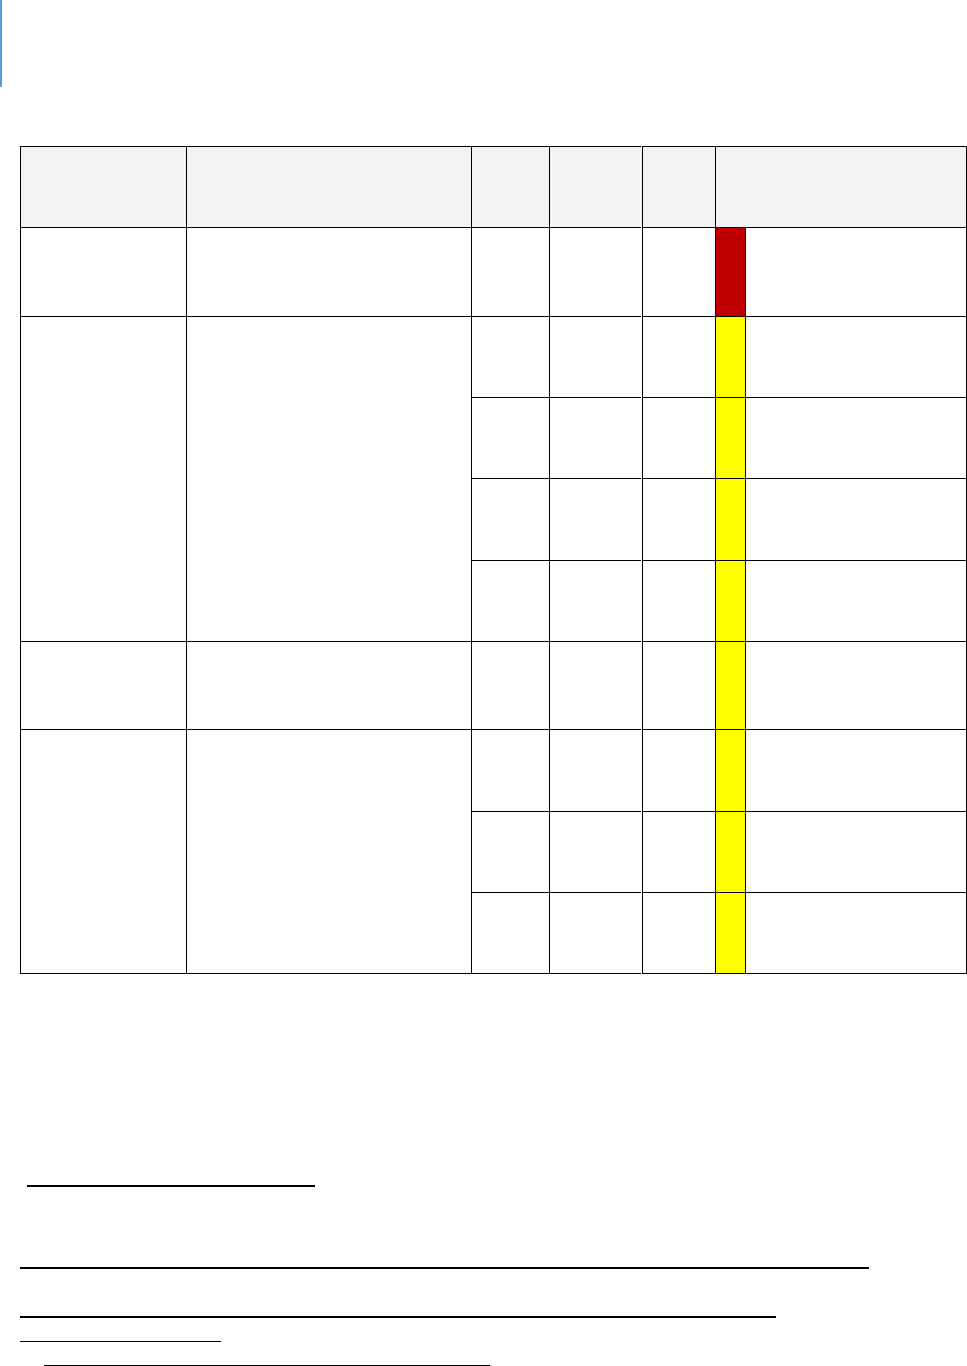
DRAFT Lee County Human Services Gap Analysis
Secon Three: Development – The Foundaon
Chapter 13 – Child and Youth Development Page | 196
Table 59. Child Poverty in Lee County
Sources
Data Title
Year
Lee
County
State
Comparison to State
Community
Health Needs
Assessment
206
Children Below 200% FPL
2017
55.9
49.5
Worse
FL Health
Charts
207
Individuals Under 18
Below Poverty Level
2011
21.6
20.9
Within 10% average
2013
25.4
23.6
Within 10% average
2015
26.9
24.1
Within 10% average
2017
24.9
22.3
Within 10% average
FL Health
Charts
208
Families under 100% of
poverty with children
under age 18
2013-
17
19.8
18.2
Within 10% average
Kids Count
209
Children in Poverty
(Census Small Area Income
and Poverty Estimates
2017
20.4
20.6
Within 10% average
2016
22.0
21.3
Within 10% average
2014
26.1
24.2
Within 10% average
206
2017 Community Health Needs Assessment Report; Lee Health and FL Dept. of Health in Lee County
207
FL Health Charts. Individuals Under 18 Below Poverty Level,
http://www.flhealthcharts.com/charts/OtherIndicators/NonVitalIndRateOnlyDataViewer.aspx?cid=0295
208
FL Health Charts. School-aged Child and Adolescent Profile – 2018
http://www.flhealthcharts.com/ChartsReports/rdPage.aspx?rdReport=ChartsProfiles.School-
agedChildandAdolProfile
209
https://www.census.gov/programs-surveys/saipe.html

DRAFT Lee County Human Services Gap Analysis
Secon Four: Systems of Care
Section Four – Systems of Care Page | 197
Secon Four: Systems of Care

DRAFT Lee County Human Services Gap Analysis
Secon Four: Systems of Care
Section Four – Systems of Care Page | 198
Intenonally le blank.

DRAFT Lee County Human Services Gap Analysis
Secon Four: Systems of Care
Chapter 14 | Behavioral Health Page | 199
CHAPTER 14
Behavioral Health
Introducon
Interviews and focus groups, frequently and consistently, idened the general area of
behavioral health (mental health/substance abuse/co-occurring disorders) as a service
need for both adults and children/youth. This chapter seeks to beer dene the nature
of this gap and the specic gaps that exist within the general eld of behavioral health.
The analysis begins with an examinaon of the behavioral health status of residents of
the State. It then turns to a more specic examinaon of behavioral health status of
residents of Lee County. From those analyses, an examinaon of funding is developed
because many service gaps can be traced to funding gaps. This informaon is then used
to idenfy specic service gaps.
Context and Background
Naonal Trends
This analysis is focused on behavioral health in Lee County. There are naonal trends,
however, which should be noted as they may appear in Lee County. In fact, focus
groups have idened some of these trends as present in the County. These naonal
trends include:
Youth mental health is worsening:
“From 2012 to 2017, the prevalence of past-year Major Depressive Episode
(MDE) increased from 8.66% to 13.01% of youth ages 12-17”.
210
Between 2008 and 2017, the proportion of adolescents who experienced serious
psychological distress in the last 30 days increased by 71% and the proportion
that seriously considered attempting suicide increased by 47%.
211
210
The state of mental health in America, 2020. Pg. 8. Mental Health America
211
Twenge, J. et.al. 2019. Age, period, and cohort trends in mood disorder indicators and suicide-related
outcomes in a nationally representative dataset, 2005-2017. Journal of Abnormal Psychology, 128(3): 185-199.

DRAFT Lee County Human Services Gap Analysis
Secon Four: Systems of Care
Chapter 14 | Behavioral Health Page | 200
Suicidal ideaon is increasing in young adults:
There was a statistically significant increase in suicide ideation from 3.77% in
2012 to 4.19% in 2017 for all adults. The highest increase in rates was found in
young adults 18-25.
212
The prevalence of substance abuse, in general, is decreasing:
Except for marijuana and alcohol use, abuse of other substances has declined or
remained flat from 2012 to 2017.
213
There is an extensive unmet need for treatment:
70% of youth with severe MDE (Major Depressive Episode) do not receive
treatment.
214
57% of adults with AMI (Any Mental Illness) did not receive any mental health
treatment in 2016-17.
215
The most commonly reported reason for not receiving treatment was the cost of
care.
216
Accessing care can be dicult because of stang and insurance issues:
There is a shortage of behavioral health professionals. The behavioral health
workforce shortage is expected to continue with significant shortages of
psychiatrists, psychologists, family and marriage counselors, and social workers
by 2025.
217
212
Piscopo, K. et.al. 2016. Suicidal thoughts and behavior among adults: Results from the 2015 National Survey on
Drug Use and Health. NSDUH Data Review.
213
National Institute on Drug Abuse. 2018. Monitoring the Future Survey: High School and youth trends.
DrugFacts.
214
The state of mental health in America, 2020. Pg. 11, Mental Health America
215
op. cit. pg. 8
216
Collins, S. et.al. 2019. Health insurance coverage eight years after the ACA. The Commonwealth Fund.
217
Health Resources and Services Administration. 2015. National projections of supply and demand for behavioral
health practitioners, 2013-2025.

DRAFT Lee County Human Services Gap Analysis
Secon Four: Systems of Care
Chapter 14 | Behavioral Health Page | 201
Two-thirds of primary care physicians cannot obtain mental health services for
patients who need them.
218
In an experimental test, it was found that only 17% of child psychiatrists would
accept a new patient and the wait time was 42.9 days.
219
Private insurance companies reimburse at lower rates for behavioral health
services.
220
Psychiatrists receive lower insurance reimbursements when compared to non-
psychiatrist medical doctors providing the same service. For this reason, many
will not take insurance, requiring cash payments instead.
221
Commercial and Medicare Advantage plans pay mental health providers, in their
networks significantly lower rates than what traditional Medicare pays.
222
Prior authorization requirements act as a barrier to services by creating an
administrative hassle.
223
Florida Residents: A Behavioral Health Perspecve
Whether it is aributed to the generally moderate climate, the ability to be acve year-
round or some other variable, Florida ranks 12
th
in the naon on lower prevalence rates
of mental health and substance abuse (1 = lowest prevalence rates, 51 = highest
prevalence rates).
224
The six indicators comprising this ranking were:
Adults with Any Mental Illness (AMI)
Adults with Substance Use Disorder in the Past Year
Adults with Serious Thoughts of Suicide
Youth with At Least One Major Depressive Episode (MDE) in the Past Year
Youth with Substance Abuse Disorder in the Past Year
Youth with Severe MDE
218
Cunningham, P. Beyond parity: primary care physicians’ perspective on access to mental health care. Health Aff
(Millwood) 2009. 28(3), 490-501.
219
Cama, S. et.al. 2017. Availability of outpatient mental health care by pediatricians and child psychiatrists in five
U.S. cities. International Journal of Health Services. 47(4): 621-635.
220
Millman, 2017
221
Mark, T., et.al. 2017. Differential reimbursement of psychiatric services by psychiatrists and other medical
providers. Psychiatric Services. http://doi.org/10.1176/appi.ps.201700271.
222
Mayer. H. 2019. Commercial plans’ lower rates for mental healthcare may reduce patient access. Modern
Healthcare. February 5
th
, 2019.
223
Funkenstein, A. et.al. 2013. Insurance prior authorization approval does not substantially lengthen the
emergency department length of stay for patients with psychiatric conditions. 61(5): 596-597
224
The state of mental health in America, 2020. Mental Health America.

DRAFT Lee County Human Services Gap Analysis
Secon Four: Systems of Care
Chapter 14 | Behavioral Health Page | 202
These analyses used the US Department of Health and Human Services, Substance
Abuse and Mental Health Services Administraon’s (SAMSHA) Naonal Survey of Drug
Use and Health (NSDUH) and the CDC’s Behavioral Risk Factor Surveillance System
(BRFSS). As with any survey, limitaons exist. These are noted in the Mental Health
America report from which this data is selected.
From other perspecves, Florida resembles the naon. For example:
61.7% of adults with AMI (Any Mental Illness) did not receive treatment.
225
65.8% of adolescents ages 12 to 17 with a Major Depressive Episode (MDE) did
not receive treatment.
226
Major Depressive Episodes (MDE) among 12- to 17-year-olds increased from
8.1% in 2011 to 11.9% in 2014.
227
According to 2016 data on deaths, suicide counts are higher than homicides in
62 of Florida’s 67 counties.
228
In Lee County, there were 113 suicides and 46
homicides.
Lee County Residents: A Behavioral Health Perspecve.
For the most part, as Table 60 shows, the rates of various behavioral health indicators
for Lee County mirror Florida. However, there are some excepons worth nong.
On an overall health behaviors index, Lee County is ranked ninth in the State
(one being best).
229
Alcohol use by minors is above the State average on several indicators.
230
The number of unhealthy mental health days within the past 30 days is below
the State average.
231
Suicide among the 19- to 21-age group is higher than the State average.
232
225
Facts about Mental Health in Florida. 2018. Florida Behavioral Health Association.
226
Behavioral Health Barometer, Florida, V4. SAMSHA
227
ibid.
228
Facts, Op cit.
229
County Health Rankings
230
Lee County Drug Free Coalition Needs Assessment, 2019
231
Healthiest weight profile
232
Child Health Status

DRAFT Lee County Human Services Gap Analysis
Secon Four: Systems of Care
Chapter 14 | Behavioral Health Page | 203
Table 60. Behavioral Health Indicators - Lee County
Total Number of indicators
41
Percentage
Number in which Lee County
is above average by 10% or
more
10
31.25%
Number in which Lee County
is within a 10% average range
9
28.125%
Number in which Lee County
is below average by 10% or
more
13
40.625%
Number of below average
indicators involving alcohol
9
28.125%
In summary, the residents of Lee County face the same behavioral health issues as their
fellow Floridians. While there is local variaon among counes, the overall issues they
face are the same. The residents of Lee County do not dier in any signicant way with
respect to mental illness or substance abuse than Floridians overall.
There are two implicaons of this data. One is that naonal and state issues in
behavioral health are very likely to be relevant to Lee County in some manner. The
second is that federal and State funding policy and pracce can signicantly impact Lee
County as it faces many of the same issues that other counes in the state and naon
face.
Medicaid
Through SAMSHA and the Naonal Instute on Drug Abuse (NIDA), federal funds are
provided for a variety of services, oen experimental programs. These are best
considered supplemental funding and only marginally aect operaonal behavioral
health delivery.

DRAFT Lee County Human Services Gap Analysis
Secon Four: Systems of Care
Chapter 14 | Behavioral Health Page | 204
What is of more signicance at the treatment delivery level is Medicaid. Medicaid is
the single largest payer for mental health services in the United States. It has been
esmated that 48% of Medicaid spending is now spent on behavioral health issues.
233
Medicaid is a partnership between the federal and state governments in which there is
shared responsibility for program design, operaons and costs. Each state administers
its own Medicaid program according to federal guidelines. The federal government
matches state funds, usually ranging from 50% to 76%, with specic excepons. The
public mental health system of Florida is highly dependent upon State and Medicaid
funds for it operaons. State funding is discussed in the following secon.
The problem with Medicaid Funding is that many providers consider the reimbursement
rates, oen expressed as a percentage of the Medicare rate, inadequate. For example,
in Florida the rate for physicians for behavioral health care is 58% of the Medicare rate
for that same care.
234
Only three states in the naon provide a lower rate than
Florida.
235
Recent analyses show that primary care providers and psychiatrists are
among the least likely professionals to accept Medicaid. Only 35% of psychiatrists will
accept new paents with Medicaid.
236
The State of Florida
Given the funding formulas for funding behavioral health services in Florida, the status
of behavioral health services in Lee County is determined in large part by the State. For
this reason, the status of behavioral health services in the State will be examined from
four perspecves: per capita funding, absolute funding, behavioral health funding as a
percentage of state expenditures, and a prevalence/access formula.
233
Mandros, A. 2017. Medicaid behavioral carve-outs. www.open-minds.com/market-briefings
234
Medicaid-to-Medicare fee index. The Henry J. Kaiser Family Foundation. State Health Facts. www.kff.org.
235
Ibid.
236
www.macpac.gov/publication/physician-acceptance-of-new-medicaid-patients-new-findings/
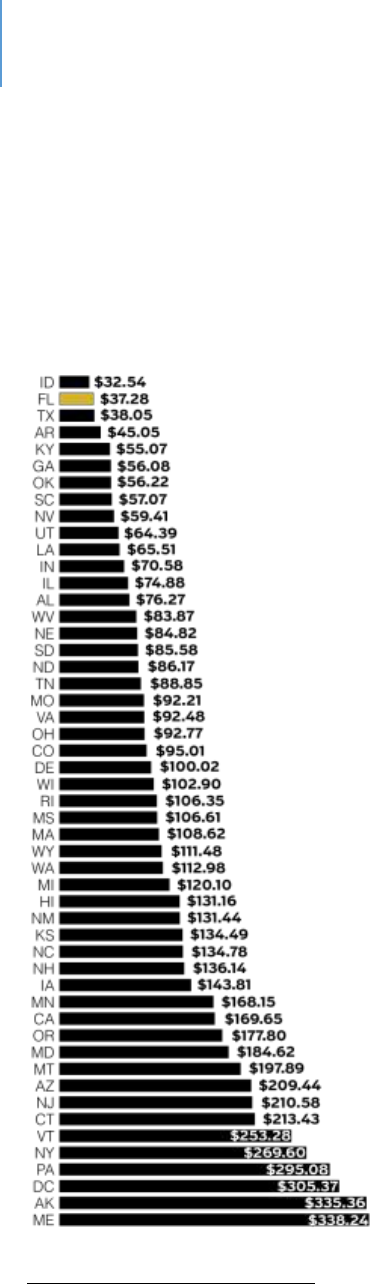
DRAFT Lee County Human Services Gap Analysis
Secon Four: Systems of Care
Chapter 14 | Behavioral Health Page | 205
The Per Capita Perspecve
Using per capita expenditures as the metric, depending upon the source, Florida is
oen ranked somewhere between 48th and 50th in per-capita funding for mental
health services.
237
Figure 11 is an example of one calculaon reaching this
conclusion.
238
Figure 12 shows the trend in per capita funding in Florida.
239
Figure 11. Florida Per Capita Funding for Mental Health Services Compared to Other States
237
National Association of State Mental Health Program Directors. www.nasmhpd.org
238
ibid.
239
Heeken, K. 2016. Mental health trends in Florida. FSU: Claude Pepper Center.
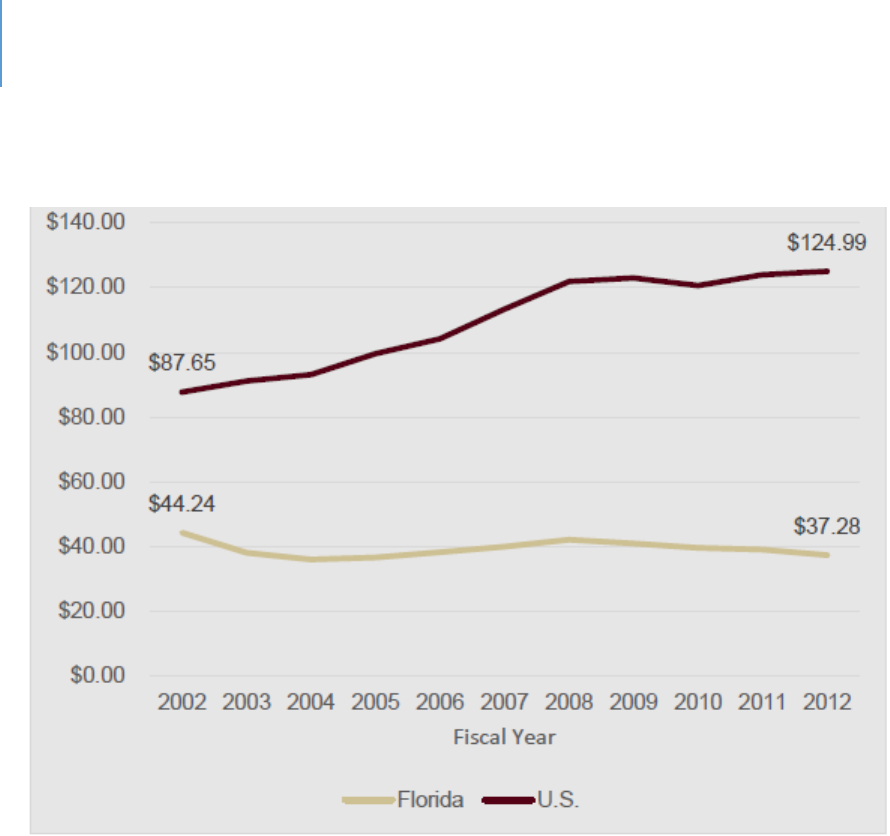
DRAFT Lee County Human Services Gap Analysis
Secon Four: Systems of Care
Chapter 14 | Behavioral Health Page | 206
Figure 12. State Mental Health Agencies per Capital Expenditure
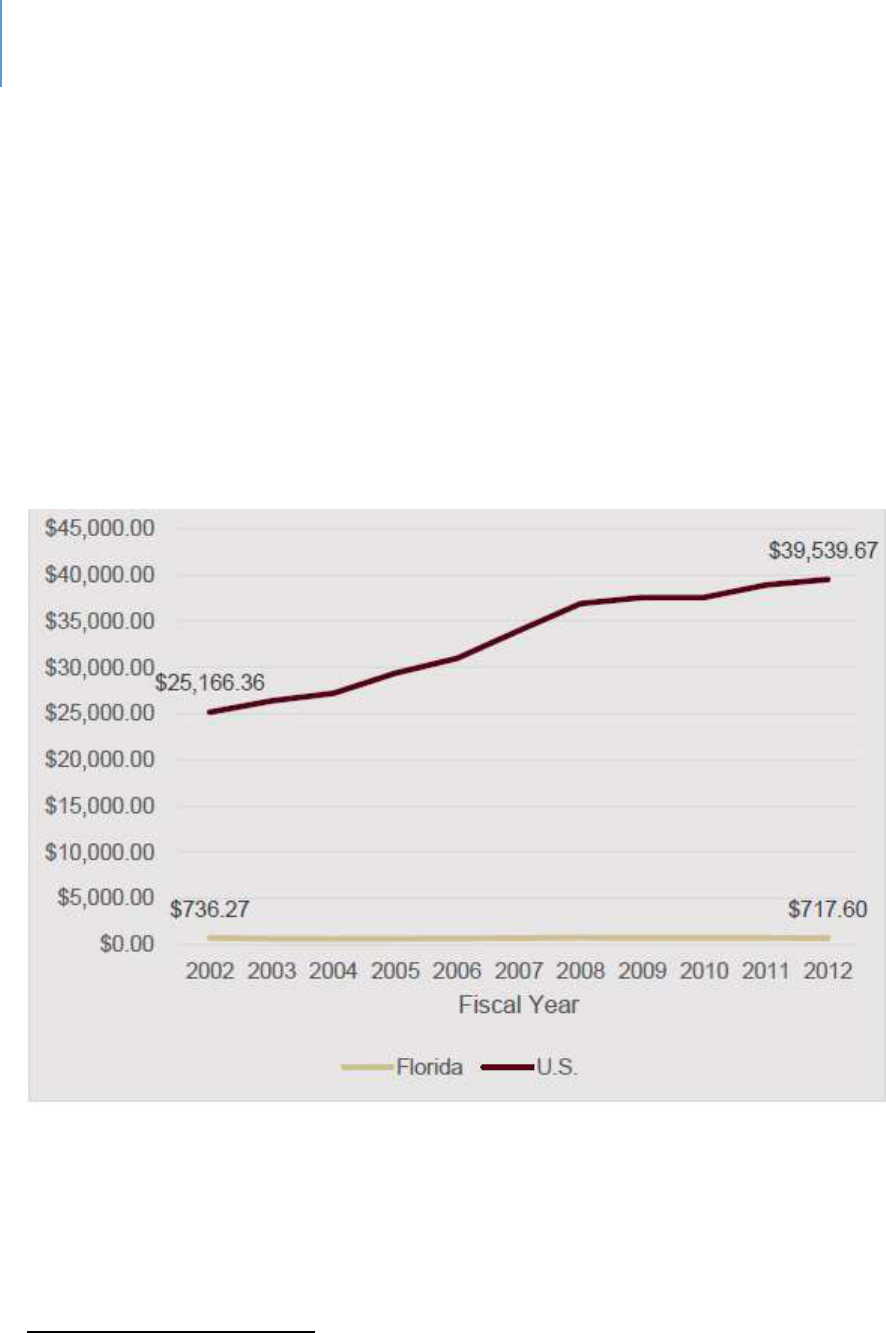
DRAFT Lee County Human Services Gap Analysis
Secon Four: Systems of Care
Chapter 14 | Behavioral Health Page | 207
Absolute Annual Funding
Another perspecve on State funding is to view trends over me. Figure 13 shows
funding trends in the State compared to naonal trends.
240
As the gure shows,
Florida’s funding is basically stac compared to an increase in funding naonally. This
table shows an ongoing trend of reducons in State funding for behavioral health
services in the context of a rapidly growing populaon.
Figure 13. Comparison of State of Florida Funding Trends for Behavioral Health Compared to
Naonal Trends
State Mental Health Agencies Total Expenditure (in millions)
240
Keeken, ibid.

DRAFT Lee County Human Services Gap Analysis
Secon Four: Systems of Care
Chapter 14 | Behavioral Health Page | 208
Proporon of State Total Funds Expended upon Behavioral Health Services
Another way to compare state expenditures for mental health services is to determine
the percentage of the State’s budget spent on mental health programs. Using this
metric, Florida ranks 41
st
out of 50 states.
241
Table 61 below shows these rankings.
Table 61. State Rankings: Mental Health Expenditures as a Percentage of Total State
Expenditures, Average of FY 2012 and 2013
1
Main 5.6
18
North Carolina 2.4
35
Alabama 1.5
2
Pennsylvania 5.6
19
Iowa 2.3
36
Illinois 1.5
3
Arizona 4.8
20
Washington 2.3
37
Rhode Island 1.4
4
New York 3.9
21
Alaska 2.1
38
South Carolina 1.3
5
New Jersey 3.8
22
New Mexico * 1.9
39
Massachuses 1.2
6
New Hampshire 3.7
23
Ohio 1.9
40
Texas 1.2
7
Montana 3.5
24
South Dakota 1.9
41
Florida * 1.1
8
Vermont 3.4
25
Tennessee 1.9
42
Wyoming 1.1
9
California 3.2
26
Georgia 1.9
43
North Dakota 1.1
10
Maryland 3.1
27
Indiana 1.8
44
Delaware 1.0
11
Minnesota 3.0
28
Colorado 1.8
45
Louisiana 1.0
12
Conneccut 2.8
29
Virginia 1.7
46
Oklahoma 1.0
13
Nevada 2.7
30
Mississippi 1.7
47
Kentucky 0.9
14
Oregon 2.7
31
Nebraska 1.7
48
Idaho 0.8
15
Kansas 2.6
32
Utah 1.7
49
West Virginia 0.8
16
Michigan 2.6
33
Hawaii 1.6
50
Arkansas 0.7
17
Missouri 2.5
34
Wisconsin 1.5
*Data available for only one year.
241
Jaffe, D. & Torrey E. 2017. Funds for treating individuals with mental illness. www.mentalillnesspolicy.org

DRAFT Lee County Human Services Gap Analysis
Secon Four: Systems of Care
Chapter 14 | Behavioral Health Page | 209
A Prevalence/Access Formula
Using a more complex ranking tool that combines prevalence and access, Mental Health
America (a nonprot advocacy group) found that Florida is 32
nd
overall in the naon
when prevalence and access factors are combined. Florida is ranked 24
th
in the naon
for adults and 36
th
for youth in this ranking system.
242
While these are certainly beer
numbers than the per capita funding rates, Florida sll ranks in the lower half of the
naon.
Lee County
These numbers set the context for behavioral health services in Lee County and help
explain why it is so widely viewed as a serious gap between need and capacity. In
seeking to beer understand this gap at the level of Lee County, the following points are
relevant:
Lee County has fewer behavioral health providers than many other areas of the
State. There is obviously a relationship between available providers (or the lack
thereof) and available services (or the lack thereof). Figure 14 illustrates this
gap.
243
This is in a context of a national shortage of mental health professionals.
One analysis concluded that in 2017 the United States fulfilled an estimated 33%
of its needs for mental health professionals
244
. The behavioral health workforce
shortage is expected to continue with significant shortages of psychiatrists,
psychologists, family and marriage counselors and social workers by 2025.
245
242
The State of Mental Health in America 2020. Mental Health America. www.mhanational.org
243
County Health Rankings – Mental Health Providers.
244
Kaiser Family Foundation. 2017. State health data –mental health care health professional shortage areas.
245
Health Resources and Services Administration. 2015. National projections of supply and demand for behavioral
health practitioners, 2013-2025.
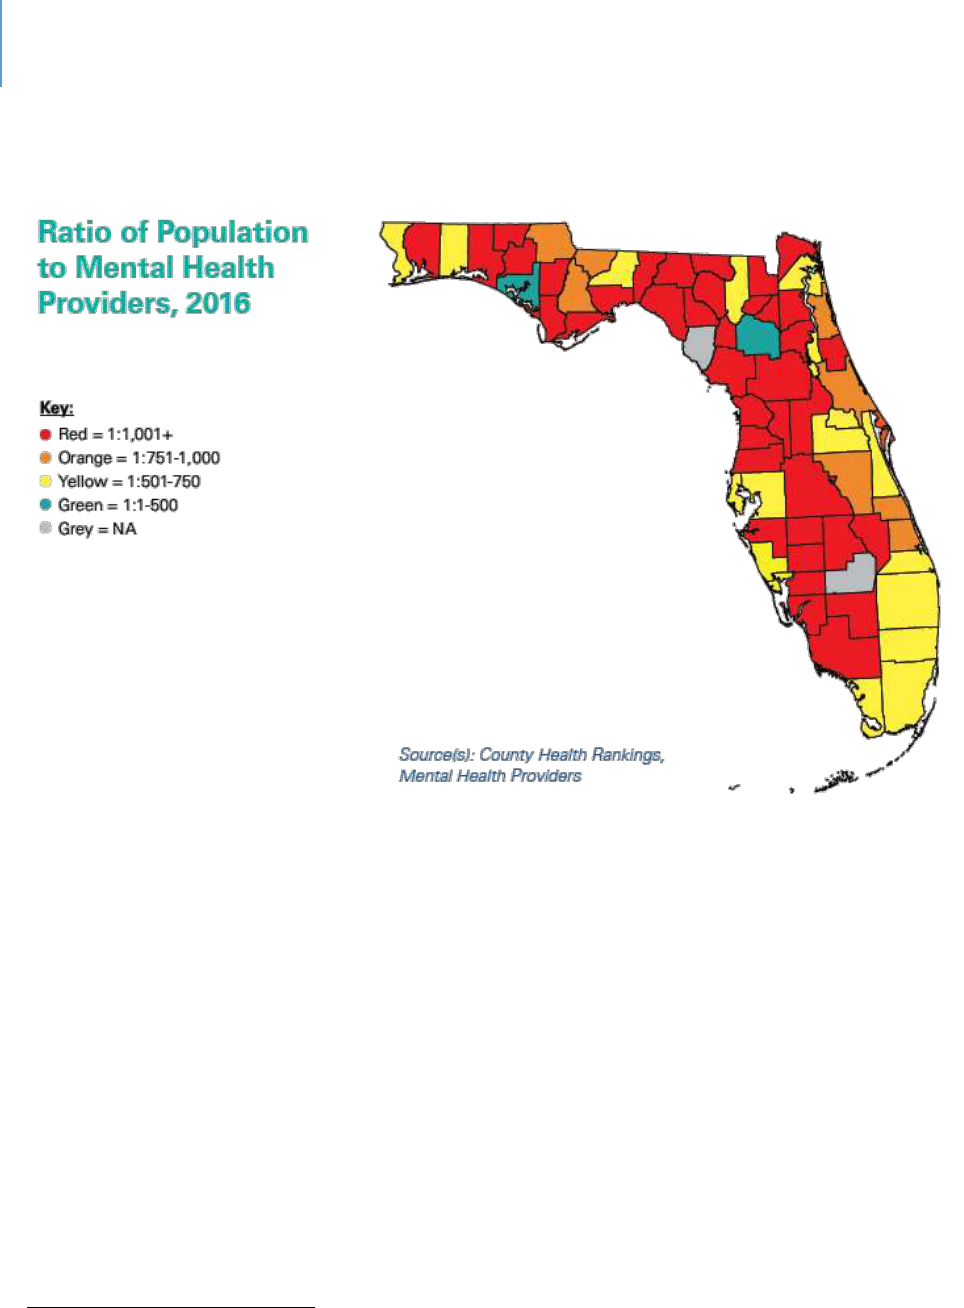
DRAFT Lee County Human Services Gap Analysis
Secon Four: Systems of Care
Chapter 14 | Behavioral Health Page | 210
Figure 14. Ratio of Population to Mental Health Providers, 2016
There is high staff turnover at the direct-service work level. This high level of
turnover is due to low compensation, challenging work environments and the cost
of housing and commuting in Lee County. High staff turnover creates challenges in
service delivery and could limit access at times.
There are inequities in State funding to the detriment of Lee County. These
inequities are widely and publically acknowledged.
246
As new or additional State
funds are committed to the mental health system, there is an ongoing effort to
address these inequities. This effort, however, will take years. Table 62 documents
this inequity by judicial circuit. Lee County is the largest county by population in
Circuit 20.
246
Zeitlen, J and Gluck, F. Unequal treatment: Children’s mental health dollars vary across state. New-Press, July
24, 2019.
DRAFT Lee County Human Services Gap Analysis
Secon Four: Systems of Care
Chapter 14 | Behavioral Health Page | 211
Table 62. Funding Equity
Non-Acute Care
Per person funding
Circuit 6 (Pasco)
$87.45
Circuit 6 (Pinellas)
$93.59
Circuit 10 (Hardee, Highlands and Polk)
$95.35
Circuit 12 (DeSoto, Manatee and Sarasota)
$80.50
Circuit 13 (Hillsborough)
$93.70
Circuit 20 (Charloe, Collier, Glades, Hendry
and Lee)
$65.11
There is significant seasonality in Lee County’s population. Trying to staff for this
variation in demand can be operationally challenging. Depending upon the base
number selected for use in any per-capita analysis, it can skew the data and mis-
represent the resources and needs of the County.
Compared to other states, Florida spends a greater proportion of its mental
health funds on state hospitals and less on community-based care. The
implication for Lee County, as it also is for most other counties, is inadequate
State funding for community-based services. Figures 15 illustrates this.
247
247
Heekin, op.cit.
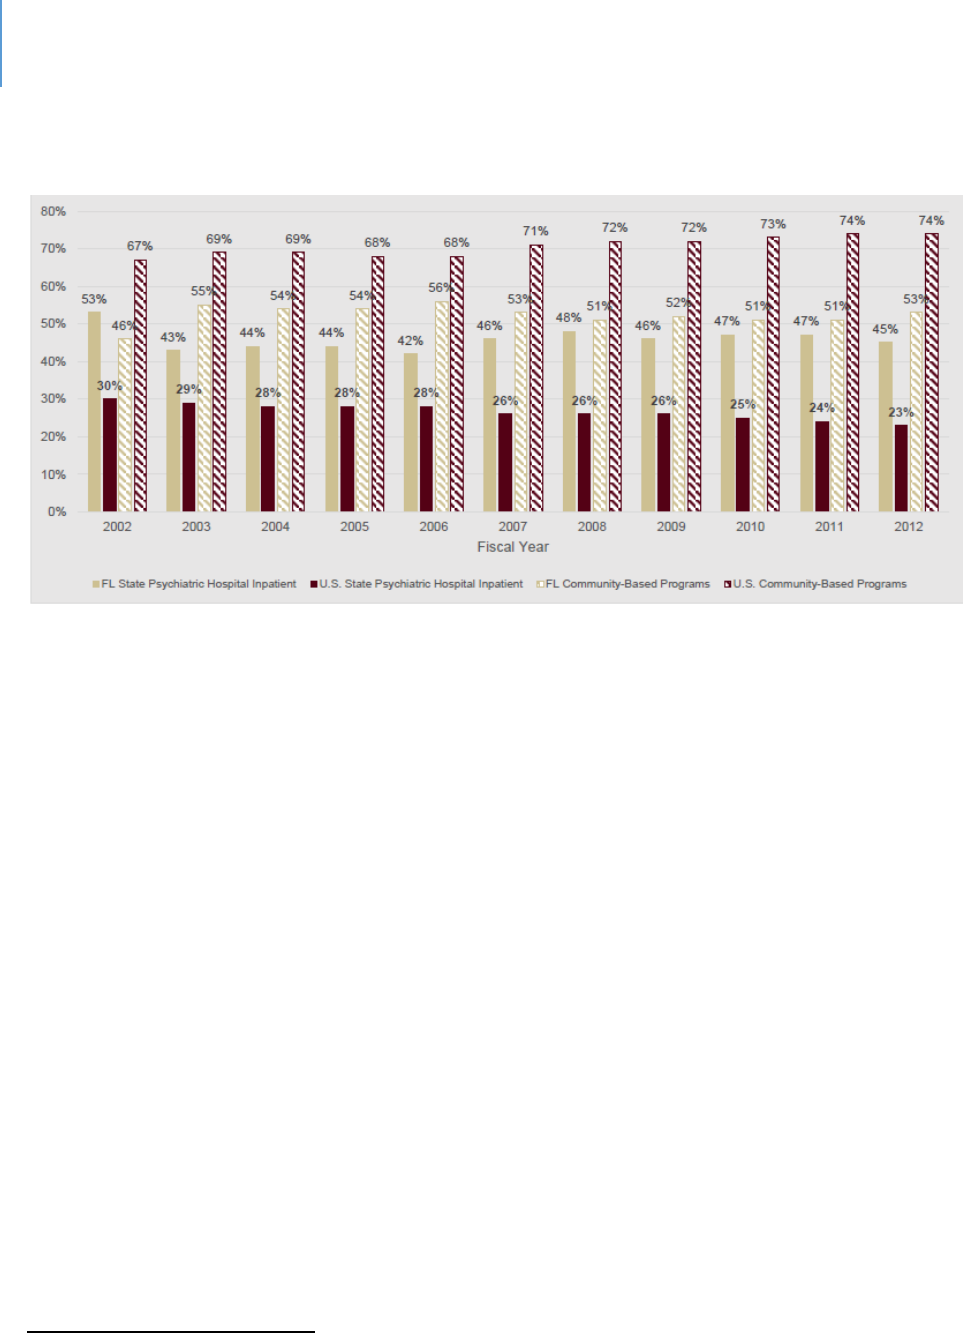
DRAFT Lee County Human Services Gap Analysis
Secon Four: Systems of Care
Chapter 14 | Behavioral Health Page | 212
Figure 15. State Mental Health Agency Expenditures by Type of Program as a Percent of Total
Expenditures
This gap creates two specific costs for communities and their local governments.
One is the cost of chronic homelessness in which a substantive proportion of the
chronically homeless have behavioral health issues. The second is the cost of local
jail services where there are many inmates with behavioral health issues. One
recent internal analysis found that 905 of the approximately 1,800 inmates were
receiving psychotropic medications. This does not include those who refuse
medication.
248
System-of-Care
The behavioral health system of consists of public and private (for and nonprot)
enes. Private behavioral health services are paid through various forms of insurance
or private payments. Public services are funded primarily by the State of Florida with
county governments paying a proporonate share of costs and Medicaid also
reimbursing eligible expenses.
The system consists of the following components:
248
Communication from k. Brown, Public Defender, 2019
DRAFT Lee County Human Services Gap Analysis
Secon Four: Systems of Care
Chapter 14 | Behavioral Health Page | 213
The state mental hospitals. These provide clinical services to those individuals for whom
community treatment is inappropriate and provide competency restoration services.
The Central Florida Behavioral Health Network. This is a private entity that manages
state mental health funding for a region of the state that includes Lee County. It
primarily manages contracts with private entities for various services.
Community mental health centers. These centers provide in-patient, out-patient and
consultative/educational services, including services for indigent people.
Florida Assertive Community Treatment (FACT) and Community Action (CAT) teams.
These outreach teams carry a caseload of individuals who otherwise have a high
likelihood of being in residential treatment or jail.
The Lee County Jail and jail re-entry. Conservatively, 25% of jail inmates are mentally ill
to some degree. Another significant percentage of them abuse substances. The jail
provides medications and limited interventions.
Mobile Mental Health Services. These services are intended to assist law enforcement
officers when they are dealing with a mentally ill person.
Various other in-patient or out-patient providers. These private and nonprofit groups
provide a variety of services.
Gaps
Given the above points, one would expect various gaps in the provision of behavioral
health services. There are a variety of behavioral health intervenons that all show
some gap between need and capacity. The queson, therefore, is one of priority.
Priority Gaps based on the Central Florida Behavioral Health Network Data
In 2019, the managing enty for Lee County, The Central Florida Behavioral Health
Network, developed an Enhancement Plan for Fiscal Year 2019/2020 that idenes the
priories for developing addional capacity. These priories were:
Short-term Residential Beds

DRAFT Lee County Human Services Gap Analysis
Secon Four: Systems of Care
Chapter 14 | Behavioral Health Page | 214
Expansion of the number of FACT Teams (Florida Assertive Community
Treatment)
Expansion of the funds available to each FACT Team
Expansion of CAT Teams (Community Action Teams)
Forensic residential and jail re-entry
In-home / on-site services and case management services for high need / high
utilizing persons
School-based prevention
Supportive housing
Priority Gaps – Lee County Drug-Free Coalion Needs Assessment Survey
Mental health funding
Additional beds for detox and recovery
Expansion of evidence-based programs
Gaps Based on Survey
Based on survey feedback conducted specically for this project, and consistent
with the Central Florida Behavioral Network priories, prevenon is another
priority.

DRAFT Lee County Human Services Gap Analysis
Secon Four: Systems of Care
Chapter 14 | Behavioral Health Page | 215
The Relaonship of Housing and Transportaon Gaps to Behavioral Health
The cost of housing in the county presents challenges to many people with behavioral
health issues. A number are unemployed, while others have sporadic employment. In
addion to the challenge of aording housing, the sgma of mental illness, or drug
abuse, could bias landlords. Housing can create stress for people that are already
challenged. From this perspecve, the housing situaon may contribute to problemac
behavior.
The limitaons of the public transportaon system mean that it may be dicult to keep
appointments, get to work (when employed) in a mely manner, or access other
services that are needed. Missed appointments may result in medicaon gaps and
problemac behavior.

DRAFT Lee County Human Services Gap Analysis
Secon Four: Systems of Care
Chapter 14 | Behavioral Health Page | 216
Intenonally le blank.

DRAFT Lee County Human Services Gap Analysis
Secon Four: Systems of Care
Chapter 15 | Behavioral Health and Criminal Justice Page | 217
CHAPTER 15
Criminal Jusce and Behavioral Health:
Sequenal Intercepts and System-of-Care Approaches to Analysis
Introducon
Given the signicant impact of behavioral health issues on the criminal jusce system
and the subsequent impact of criminal jusce on behavioral health, an analysis of gaps
in this system is an important component of a broader Human Services Gap Analysis.
The sequenal intercept model was used to conduct this gap analysis. An expert
panel
249
was convened to comment on each intercept, idenfying true gaps (non-
existent programs or services) as well as needs / capacity gaps (the needs exceed
capacity).
The Intercepts are:
Intercept 0: Community Services. These are services intended to address the individual
in the community before arrest.
Intercept 1: Diversion. This intercept is designed to take arrested individuals to an
appropriate facility rather than booking them into jail.
Intercept 2: Screening and Mental Health Classicaon and Pre-trial Diversion /
Intervenon. This intercept seeks to ensure an appropriate designaon is made and to
oer an alternave to further engagement with the criminal jusce system.
Intercept 3: Specialty Courts. These are a variety of courts designed to address specic
types of problemac behaviors in a non-criminal framework.
Intercept 4: Treatment. These addresses treatment services provided by the jail.
249
This panel consisted of representatives of Court Administration, Public Defender, Sheriff and State Attorney

DRAFT Lee County Human Services Gap Analysis
Secon Four: Systems of Care
Chapter 15 | Behavioral Health and Criminal Justice Page | 218
Intercept 5: Release, Re-entry, Reintegraon, Community Correcons. These are the
services designed to help the inmate successfully re-enter the community and avoid
recidivism.
Aer this sequenal intercept examinaon, a system-of-care model will be used to
idenfy any gaps.
The following document is designed to inform the panel as to the scope of the issue,
the various pracces that are associated with each intercept point, and the elements of
a system-of-care approach. Where available, data are provided on the eecveness of
these pracces.
Context and Background
Studies esmate that between 7% and 10% of police-cizen encounters involve a
mentally ill individuals.
250
Mentally ill individuals not receiving treatment are more
likely to have police contact.
251
Ocers have been found to be 1.4 to 4.5 mes more
likely to use force with people with mental health issues than with those without such
issues.
252
“Suicide by Cop” is now a recognized term in common use. One study found
it accounted for 11% of police shoongs.
253
Addionally, there is higher risk of injury to
all pares involved.
Naonally, there are more mentally ill people in jails than in hospitals. This is also an
accurate statement for Florida as the odds of a mentally ill person being in jail or prison
compared to a hospital is 4.9 to 1.
254
In ve other states, the odds are higher. Stated
another way, Florida has the sixth highest rank naonally when looking at the
proporon of mentally ill people being in jail or prison when compared to a mental
hospital.
250
Franz, D. et.al. 2011. Crisis intervention teams may prevent arrests of people with mental illness. Police practice
and research. 12(3), 265-272. Deane, M. et.al. 1999. Emerging partnerships between mental health and law
enforcement. Psychiatric Services, 50(1), 99-101
251
Munetz, M. et.al. 2006. Use of the sequential intercept model as an approach to decriminalization of people
with serious mental illness. Psychiatric Services, 57(4), 544-549.
252
Engel, R. et.al. 2001. Policing mentally disordered suspects. Criminology, 39(2), 225-252.
253
Huston, H., et.al. 1998. Suicide by cop. Annals of Emergency Medicine, 32(6).
254
More mentally ill persons are in jails and prisons than hospitals. Treatment Advocacy Center Report.
http://mentalillnesspolicy.org/ngri/jails-vs-hospitals.html

DRAFT Lee County Human Services Gap Analysis
Secon Four: Systems of Care
Chapter 15 | Behavioral Health and Criminal Justice Page | 219
While dramac, the above data are from the early 2000s. At that me, Florida was
ranked 45
th
in the naon for mental health spending per capita. Currently, it is ranked
between 48
th
and 50
th
. Stascally, a strong correlaon has been established between
the percentages of mentally ill people in jails or prisons and the amount of mental
health funding. The lower the funding, the higher the rate of mentally ill people in jail
or prison. The probability that jails and prisons in Florida are populated with mental ill
people remains high.
Esmates of inmates with serious mental health problems range from 15% for men and
30% for women
255
to 50%
256
to 64%
257
, respecvely. Counts tend to be based on either
use of psychotropic medicaons or assessment of severe mental illness. These diering
approaches to counng lead to wide variaons in esmates. Individuals with serious
mental illness also are likely to have substance abuse issues. One study found that 72%
of seriously mentally ill inmates had a drug or substance abuse problem.
258
Inmates
are more likely to have co-occurring mental health and substance abuse issues due to a
variety of factors: exposure to violence, various stressors, genec predisposions and
the presence of criminogenic risk factors.
259
Figure 16 provides a graphical display of
this data.
255
Jailing people with mental illness. National Alliance on Mental Health. https://www.nami.org/learn-
more/pullic-policy/jailing-people-with-mental-illness.
256
Most prisoners are mentally ill. The Atlantic, April 7, 2015
257
Mental health problems of prison and jail inmates. 2006. BJS Special Report.
https://www.bjs.gov/content/pub/pdf/mhppji.pdf
258
Adults with behavioral health needs under correctional supervision. National Institute of Corrections.
https://www.bja.gov/Publications/CSG-Behavioral Framework. pdf
259
Montoya, E., 2018. Accurately identify people in your jail with behavioral health treatment needs. NACO
Conference.

DRAFT Lee County Human Services Gap Analysis
Secon Four: Systems of Care
Chapter 15 | Behavioral Health and Criminal Justice Page | 220
Figure 16. Jails and Mental Disorders
The follow-up queson is: “What proporon of inmates with a behavioral health issue
receive treatment?” Esmates vary from 15%
260
to 17.5%
.
261
One study concluded that the consequence of these factors is that “county jails have
become the de facto mental health care system.”
262
In 2014, there were 744,600
inmates in county and city jails. If 20% of them had a serious mental illness, jail inmates
with severe psychiatric disease in U.S. jails numbered approximately 149,000 that year.
The number has grown since then.
263
As Kaeble notes, “If the estimated populations of
jail and state prison inmates with serious mental illness are combined, there is an
estimated population of 383,200 inmates with mental illness. Since there are only
approximately 38,000 individuals with serious mental illness remaining in state mental
hospitals, this means 10 times more individuals with serious mental illness are in jails
260
Fries, B. 2010. Independent study of mental health and substance abuse. Lansing, MI: State of Michigan
Department of Corrections. https://www.michigan.gov/documents/corrections/2010
261
James. D. & Glaze, L. 2006. Mental health problems of prison and jail inmates. Special Report. Bureau of Justice
Statistics. https://www.bjs.gov/content/pub/pdf/mhppji.pdf.
262
As the nation’s mental health care system has splintered, county jails are facing unprecedented challenges.
Managing Mental Illness in Jails. Police Executive Research Forum. 2018.
263
Torrey, E.F., Zdanowicz, M.T., Kennard, A.D., Lamb, H.R., Eslinger, D.F., Biasotti, M.I., Fuller, D.A. (2014). The
treatment of persons with mental illness in prisons and jails: A state survey. Arlington, VA: Treatment Advocacy
Center.

DRAFT Lee County Human Services Gap Analysis
Secon Four: Systems of Care
Chapter 15 | Behavioral Health and Criminal Justice Page | 221
and state prisons than in the remaining state mental hospitals.”
264
Another factor that contributes to the complexity of this issue is that research studies
indicate an association between being exposed to trauma and the perpetration of
crime, especially chronic victimization.
265
It has been found that rates of childhood and
adult trauma are high among jail inmates and prisoners.
266
Adverse childhood
experiences have been found related to child abuse, domestic violence, sexual offenders
and stalkers.
267
The rate of posttraumatic stress disorder is higher among the
incarcerated population than people living in everyday communities.
268
Managing Behavioral Health Issues in Jail: The challenges
There are several problems with jails having to manage a high proporon of mentally ill,
substance abusers or individuals with co-occurring disorders. These include:
269
Jails were not designed as hospitals. Adaptations such as the behavioral-health wing
in the Lee County Jail have been made. However, at a purpose level, a jail cannot be
a hospital nor can a hospital be a jail.
It costs more to manage mentally ill people. They are a greater management
problem and the risk of violence is increased.
270
They also receive more disciplinary
infractions.
271
264
Kaeble, D., Glaze, L., Tsoutis, A., Minton, T. (2016). Correctional populations in the United States, 2014. Bureau
of Justice Statistics.
265
Jaggi, L. et.al. 2016. The relationship between trauma, arrest and incarceration history among Black Americans.
Soc Mental Health 6(3): 187-206
266
Wolff, N. & Shi, J. 2012. Childhood and adult trauma experiences of incarcerated persons and their relationship
to adult behavioral health problems and treatment. Int J Environ Res Public Health. 9(5): 1908-1926.
267
Reavis, J. et.al. 2013. Adverse childhood experiences and adult criminality. Perm J. 17(2): 44-48.
268
Campbell, C. A., Albert, I., Jarre, M., Byrne, M., Roberts, A., Phillip, P., … Valmaggia, L. (2016). Treang
mulple incident post-traumac stress disorder (PTSD) in an inner-city London prison: The need for an evidence
base. Behavioral and Cognive Psychotherapy, 44,112-117. doi:/10.1017/S135246581500003X.
269
More mentally ill, op.cit.
270
As the nation’s, op.cit.
271
Gibbons, j. et.al. 2006. Confronting confinement. New York: Versa Institute of Justice.
https://www.vera.org/publications/confronting-confinement.

DRAFT Lee County Human Services Gap Analysis
Secon Four: Systems of Care
Chapter 15 | Behavioral Health and Criminal Justice Page | 222
Mentally ill inmates stay longer and are less likely to be released on parole or other
forms of discretionary release.
272
A study of the Orange County (Florida) Jail found
the average stay for all inmates was 26 days; for mentally ill inmates, it was 51
days.
273
The main reason mentally ill inmates are incarcerated longer than other
prisoners is that many find it difficult to understand and follow jail and prison rules.
In one study, jail inmates were twice as likely (19% versus 9%) to be charged with
facility rule violations.
274
In another study, in Washington State prisons, mentally ill
inmates accounted for 41% of infractions even though they constituted only 19% of
the prison population.
275
The cost of health care is increased.
276
One analysis found that the cost of an inmate
with mental health issues was nearly four times the cost of an inmate without
mental health needs.
277
A 2007 study of Broward County
278
found that it costs $80
a day to house a regular inmate but $130 a day for an inmate with mental illness.
While overall costs have risen since 2007, the ratio remains, due primarily to the
costs of psychotropic medications or lawsuits.
279
Mentally ill inmates are more likely to commit suicide. It is estimated that as many
as half of all suicides are committed by the estimated 15% to 20% of inmates with
serious mental illness.
280
This creates demands on staff for suicide watch.
The re-offending rate for individuals with serious mental illness is higher than the
rate among all individuals with criminal histories.
281
272
Porporinao, F. et.al. 1992. The prison careers of offenders with mental disorders. Ottawa: Correctional Service
of Canada.
273
Council of State Governments (2002). Criminal Justice/Mental Health Consensus Project.
274
Butterfield, F. (2003, October 22). Study finds hundreds of thousands of inmates mentally ill. New
York Times.
275
Fuller, D.A., Sinclair, E., Geller, J., Quanbeck, C., Snook, J. (2016). Going, going, gone: Trends and consequences
of eliminating state psychiatric beds, 2016. Arlington, VA: Treatment Advocacy Center.
276
As the nation’s op.cit.
277
Sheriffs addressing the mental health crisis. 2019. Community Oriented Policing Services, U.S. Department of
Justice.
278
Miller, C.M., Fantz, A. (2007, November 15). Special “psych” jails planned, Miami Herald.
279
Bender, E. (2003). Community treatment more humane, reduces criminal-justice costs, Psychiatric News, 38, 28.
280
Goss, J.R., Peterson, K., Smith, L.W., Kalb, K., Brodey, B.B. (2002). Characteristics of suicide attempts in a large
urban jail system with an established suicide prevention program. Psychiatric Services, 53, 574–579.
281
Treat or Repeat: A state survey of serious mental illness. Treatment Advocacy Center. 2017.
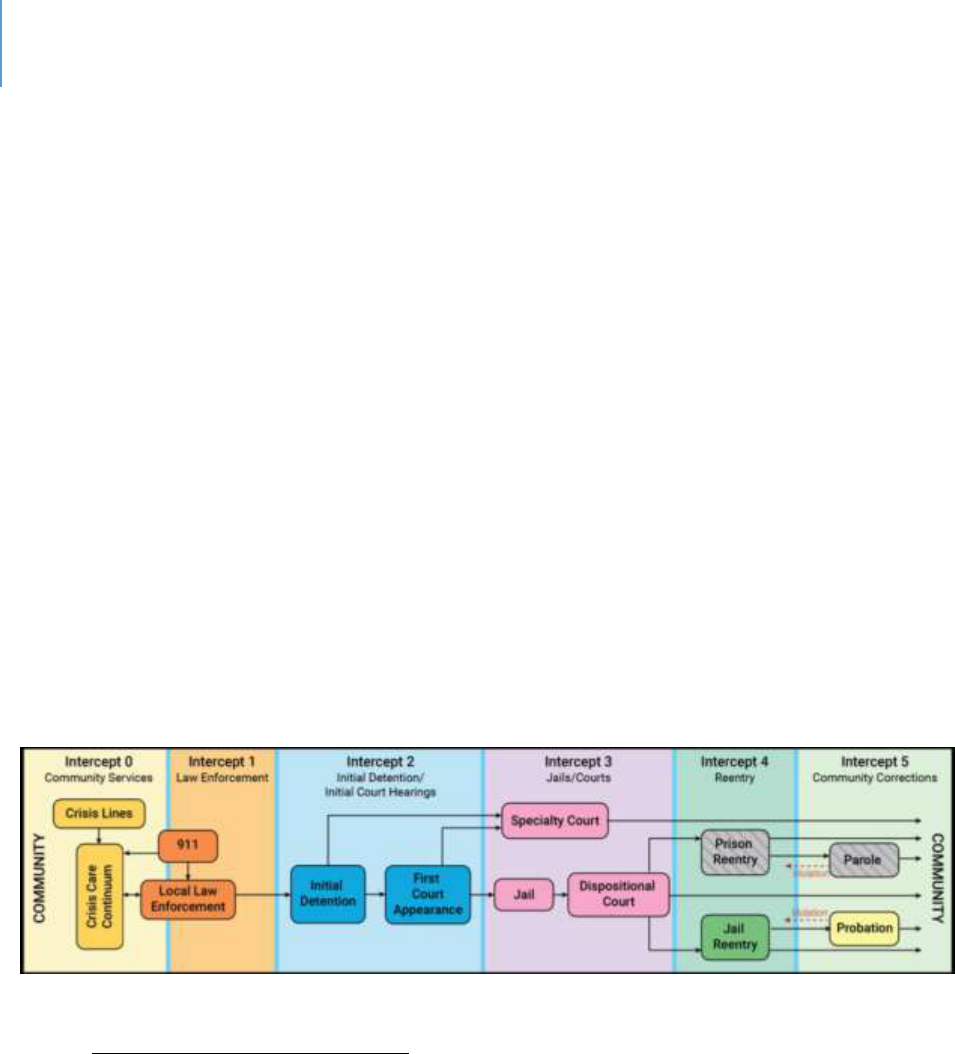
DRAFT Lee County Human Services Gap Analysis
Secon Four: Systems of Care
Chapter 15 | Behavioral Health and Criminal Justice Page | 223
Best Pracces – Sequenal Intercept Model
Given the individual costs of managing mentally ill people in jail, the inability of a
county government to control state funding levels, and the scal costs to counes, what
is an alternave? The sequenal intercept model, described below, oers a framework
of best pracces. These best pracces represent the opmal approaches a local
government has available to manage a challenging situaon it did not create.
The Sequenal Intercept Model
The sequenal intercept model consists of six intervenon (or intercept) points. Each of
them seeks to either divert a mentally ill person from an inappropriate jail admission to
some other seng beer designed to address their issues, place them in a more
appropriate restricted seng, or support them post-release to avoid recidivism. It is
shown in Figure 17 below.
Figure 17. The Sequential Intercept Model
Intercept 0: Community Services
These are services intended to address the person in the community prior to arrest.
This may take several forms or components. They include:
Crisis Intervention Teams (CIT). This involves training of police officers in various
mental health issues so that they are better prepared to handle situations involving
the mentally ill and are better able to distinguish criminal behavior from mental
illness. Jurisdictions adopting this approach have seen significant drops in use of

DRAFT Lee County Human Services Gap Analysis
Secon Four: Systems of Care
Chapter 15 | Behavioral Health and Criminal Justice Page | 224
force incidences with people with mental illness.
282
CIT is not considered a proven
best practice due to a lack of rigorous evaluation studies.
283
It has been shown to
improve officer understanding
284
and competencies and attitudes
285
regarding
dealing with mentally ill people. Data shows that CIT training results in reduced
arrests in the ranges of 15%
286
to 19%.
287
Mental Evaluation Teams (MET), Mental Health Evaluation Teams (MHET) or
Psychiatric Emergency Response Teams (PERT). These teams take a variety of forms.
Some are teams in which a mental health professional is episodically paired with a
deputy for calls when a mentally ill person may be involved. In other cases, the
mental health professional rides on patrol. In larger jurisdictions, these may be
stand-alone teams that are called in by deputies. The Los Angeles County Sheriff’s
Department documented several benefits to such teams.
288
These were:
On average, 2.7 deputies were relieved at the site, freeing them up to respond to
other calls.
On average, one patrol sergeant was relieved.
There was a significant reduction in use of force. This was estimated to save the
county $4.8 million.
In addition to this cost savings, there are likely undocumented savings in avoided
staff injuries, patient injuries, added hospital costs and civic claims and lawsuits.
Nine “Suicide by Cop” situations were avoided.
The need to call in off-duty Crisis Negotiation Team personnel was reduced from
100 incidents in 2016 to 27 incidents in 2018, eliminating considerable overtime
expenditures.
The County’s MET team also helped address issues with inmates who had
barricaded themselves in cells.
282
Sherriff’s addressing, op.cit
283
Gatens, A. 2018. Responding to individuals experiencing mental health crisis. www.icjia.state.fl.us
284
Ellis, H. 2014. Effects of a Crisis Intervention Team (CIT) training program upon police officers before and after
CIT training. Archives of Psychiatric Nursing, 28, 10-16.
285
Compton, M. et.al. 2014. The police-based crisis intervention team (CIT) model: Effect on officers’ knowledge,
attitudes and skills. Psychiatric Services, 65(4), 517.522.
286
Vickers, B. 2000. Memphis Tennessee police department’s crisis intervention team. Rockville, MD. Bureau of
Justice Assistance.
287
Franz, S. et.al. 2011. Crisis intervention teams may prevent arrests of people with mental illness. Police Practice
and Research, 12(3), 265-272.
288
Los Angeles County Sheriff Department, Annual Report, Mental Evaluation Teams, 2019.

DRAFT Lee County Human Services Gap Analysis
Secon Four: Systems of Care
Chapter 15 | Behavioral Health and Criminal Justice Page | 225
Developmentally Disabled for Patrol Class. Persons with developmental disabilities,
including Autism, also require some specialized knowledge. The Los Angeles County
Sheriff’s Department developed a special training program as a component of its
mental health training to address this need.
289
Broad, specialized mental health training (CIT, Mental Health First Aide) for police
officers, Fire/EMS first responders, dispatchers, state attorneys, public defenders
and others.
Intercept 1: Diversion
This intercept is designed to take arrested individuals to an appropriate facility rather
than booking them into jail.
Drop-off Centers, Mobile Crisis Units, Walk-in Centers. These are voluntary units in
which mental health staff can assess and assist people whom law enforcement
personnel do not determine to be risks to themselves or others. A major advantage
of these centers for law enforcement personnel is that they can quickly return to
their duties as the time involved is minimal.
290
Crisis Stabilization Units (CSUs). These are restricted units for people who are a risk
to self or others.
Forensic Alternative Center. Section 916.185, F.S. established the Forensic Hospital
Diversion Pilot, modeled after the Miami-Dade Forensic Alternative Center (MDFAC).
The MDFAC provides competency restoration services and a continuum of care
during commitment and after re-entry. The MDFAC has led to the following
results:
291
Individuals are ready for discharge from forensic commitment an average of
64 days (43%) sooner than individuals who complete competency restoration
services in forensic treatment facilities and spend an average of 32 fewer
days (19%) under forensic commitment.
Some individuals can receive competency restoration services in the
community.
289
Los Angeles, op.cit.
290
Sheriff’s addressing, op.cit.
291
wwwfloridasupremecourt.org/pub_info/documents/11-14-2007_Mental_Health_Report.pdf

DRAFT Lee County Human Services Gap Analysis
Secon Four: Systems of Care
Chapter 15 | Behavioral Health and Criminal Justice Page | 226
The clear majority who remain linked to services through MDFAC
demonstrate no additional involvement in the criminal justice system.
People who remain linked to MDFAC spent a total of 85 days in jail during a
follow-up period. In that same period, people who did not remain linked
spent 1,435 days in jail.
Intercept 2: Screening and Mental Health Classicaon and Pre-trial Diversion /
Intervenon
Screening. This intercept tool is designed to idenfy individuals with mental health
issues upon their entry into jail. The Naonal Commission on Correconal Health Care
(NCCHC) Standards for Health Services in Jail require all people being booked get a
screening of their mental health history and needs.
292
The challenge has been the
quality of the screenings in terms of accuracy. Early screening eorts were found to
miss up to 63% of inmates who had acute mental symptoms.
293
Another problem has
been many false posives (i.e. idenfy persons as having mental health issues who
don’t).
294
In response to these problems, standardized screening instruments were
developed.
295
There are now validated mental health and substance abuse screening
tools.
296
However, given the prevalence of co-occurring mental health substance abuse
disorders, a mental health screen is complicated. Currently there is no validated “co-
occurring screening tool.
297
Pre-trial Diversion / Intervenon. Pre-trial diversion is run by the State Aorney’s Oce
and allows for the dropping of charges in exchange for an agreed upon set of acons by
the person facing charges. For this tool to be eecvely used with mentally ill people,
some factors to consider include:
292
Sheriff’s addressing, op.cit.
293
Teplin, l. 1990. Detecting disorder: the treatment of mental illness among jail detainees. Journal of Consulting
and Clinical Psychology. 58(2), 233-236.
294
Brooker, C. 2009. Review of service delivery and organizational research focused on prisoners with mental
disorders. Journal of Forensic Psychiatry and Psychology. 20, 102-123.
295
Ford, 2005. Evidence-based enhancement of detection, prevention, and treatment of mental illness in the
correctional systems. www.ncjrs.org/pdffiles1/nij/grants/210829.pdf
296
Montoya, 2018. Op. cit.
297
Montoya, 2018. Op.cit.

DRAFT Lee County Human Services Gap Analysis
Secon Four: Systems of Care
Chapter 15 | Behavioral Health and Criminal Justice Page | 227
The use of data-driven risk assessments. Studies have found that less than 10% of
jurisdictions use these tools.
298
The use of social workers in Public Defender Offices to assist with screening.
299
A quick connection to behavioral health services and case management.
300
The presence of legal aid attorneys and others to assist with housing, financial
assistance, etc.
301
Systems in place so that the behavioral health providers can communicate with pre-
trial release staff.
302
The status of the jail as a “covered entity” under HIPAA or a “federally assisted”
program under 42 CFR Part 2.
303
Intercept 3: Specialty Courts
These are a variety of courts designed to address specic types of problemac
behaviors in a non-criminal framework. Among these are drug courts, mental health
courts, veteran’s courts, dual diagnosis courts and behavioral health courts. They may
serve adults, juveniles or both. In some cases, these are called problem-solving courts
or therapeuc courts, as they seek to nd soluons beyond incarceraon.
Adult Mental Health Courts
From four in 1997, the number of mental health courts has grown to more than 300.
These courts combine court supervision with community-based treatment in lieu of a
jail sentence.
Research studies on Mental Health Courts have various ndings. An Urban Instute
study found they are modestly eecve at reducing recidivism, but it was unclear on
whether they had a posive eect on parcipants’ mental health.
304
Others have
298
Laura and John Arnold Foundation, 2013. Developing a national model for pre-trial risk assessment.
www.arnoldfoundation.org/wp-content/uploads,2014/02/LJAF-research-summary_PSA_Court_4_1.pdf
299
Fader-Towe, H. 2015. Improving responses to people with mental illness at the pretrial stage. The Council of
State Governments: Justice Center
300
ibid.
301
ibid.
302
ibid.
303
ibid.
304
Kim, K. et.al. 2015. The processing and treatment of mentally ill persons in the criminal justice system. Urban
Institute: Research Report

DRAFT Lee County Human Services Gap Analysis
Secon Four: Systems of Care
Chapter 15 | Behavioral Health and Criminal Justice Page | 228
reported larger impacts on recidivism.
305
306
It has been found that Mental Health
Courts are more eecve than the tradional court system and jails at connecng
parcipants with treatment.
307
There are potenal cost savings due to reduced
recidivism and avoided jail and court costs.
308
One conclusion is that Mental Health
Courts need to target those with serious mental illness and those who are at the
highest risk of further crime.
309
An alternave conclusion is the need to produce more
performance data.
310
Dual Diagnosis Court
Dual diagnosis is a signicant issue, as approximately 75% of mentally ill people
involved in the criminal jusce system also have substance abuse issues.
311
The limited
research on the topic of dual diagnosis in drug court found that dual diagnosis
signicantly increased the odds of serious program failure.
312
A study focusing on the
impact of a court diversion eort for dually diagnosed individuals found it to be
eecve in both reducing recidivism and reducing the number of days incarcerated.
313
Orange County (California) established a dual diagnosis court to address people with
both drug addicon and some form of serious mental illness.
314
305
Andrews, M. 2015. Mental health courts are popular, but are they effective. NPR, December 16, 2015.
306
Rossman, S. et.al. 2012. Criminal justice interventions for offenders with mental illness. Urban Institute
Research Report.
307
Almquist, L. et.al. 2009. Mental health courts: A guide to research-informed policy and practice. New York:
Council of State Governments Justice Center.
308
Almquist, op.cit.
309
Andrews, op.cit.
310
Waters, N. 2011. Responding to the need for accountability in Mental Health Courts. Future Trends in State
Courts. National Center for State Courts.
311
Peters, R. et.al. 2004. Co-occurring disorders and specialty courts. National Gains Center.
www.csgjusticecenter.org
312
Zettler, H. 2018. The impact of dual diagnosis on Drug Court Failure. International Journal of Offender Therapy
and Comparative Criminology. 63 (3), 357-382
313
Frisman, l. et.al. 2008. Outcomes of court-based jail diversion for people with co-occurring disorders. Journal of
Dual Diagnosis, 2(2).
314
Levitzky, C. 2004. The County’s new dual diagnosis court program to celebrate its first graduation. Superior
Court of California, County of Orange.

DRAFT Lee County Human Services Gap Analysis
Secon Four: Systems of Care
Chapter 15 | Behavioral Health and Criminal Justice Page | 229
Drug Courts
Drug courts focus on individuals with substance abuse issues, oering them the
opportunity to enter drug treatment under court supervision rather than jail. There are
more than 4,000 drug courts operang naonwide, including 91 in Florida.
315
Fiy-four
of these are adult, 20 are juvenile, 13 are family dependency and four are DUI courts.
316
Studies of drug courts have found that recidivism can be reduced by 35% to 40%.
317
A
Florida analysis found drug court parcipants were 80% less likely to go to prison.
318
The Naonal Instute of Jusce found an average savings of $6,744 per parcipant.
319
Juvenile Mental Health Court
These are similar in purpose and design to adult mental health courts with an emphasis
on the disnguishing issues of the juvenile populaon.
320
Veterans Courts
Veterans courts are designed to assist jusce-involved defendants with the complex
treatment needs associated with substance abuse, mental health and other issues
unique to the traumac experience of war, including post-traumac stress disorder
(PTSD) and traumac brain injury (TBI). The rst veterans’ court was established in
Bualo, NY, in 2008.
321
As of March 2019, there were 31 veterans’ courts in Florida
322
and more than 400 naonally.
323
315
National Drug Court Database & Map. 2019. National Drug Court Resource Center. www.ndcrc.org.
316
Drug Courts, 2019. Florida Courts. www.flcourts.org
317
What are drug courts. 2019. National Drug Court Resource Center. www.ndcrc.org
318
Drug Courts, 2019. Op.cit.
319
op.cit.
320
Cocozza, J. 2006. Juvenile Mental Health Courts: An emerging strategy. National Center for Mental Health and
Juvenile Justice.
321
Veterans Courts. 2018. National Center for State Courts. www.themarshallproject.org.
322
Veterans Courts, 2019. Florida Courts. www.flcourts.org
323
Tsai, j. 2018. A national study of veterans’ treatment court participants. Administrative policy and Mental
Health. 45(2), 236-244.

DRAFT Lee County Human Services Gap Analysis
Secon Four: Systems of Care
Chapter 15 | Behavioral Health and Criminal Justice Page | 230
Studies of veterans’ courts have found mixed results. One study found parcipants who
completed the program had lower recidivism rates.
324
Another found improvements in
mental health, overall funconing and social connectedness.
325
However, another study
found higher rates of new incarceraons, which might have been due to stricter
monitoring.
326
Out-paent Competency Restoraon
Research studies have found that out-paent competency restoraon produces similar
outcomes to inpaent programs at a fracon of the cost and without compromising
public safety.
327
Intercept 4: Treatment
The esmated scope of mental illness in jails ranges greatly. On the low end, about 20%
of inmates in jails are esmated to have serious mental illness.
328
Esmates project
14.5% of men and 31% of women in jail have a serious mental illness.
329
On the higher
end, it is esmated that 64% of people booked into local jails are diagnosed with, or
have a diagnosable mental illness.
330
Seventy-two percent of people in jail with a
serious mental illness also have a substance-use disorder.
331
The percentage of jail
inmates who are seriously mentally ill are ve mes higher than the proporon of the
general populaon.
332
There are seven recommended services in jails. They include:
333
324
Hartley, R. et.al. 2016. Waging war on recidivism among justice-involved veterans. Criminal Justice Policy
Review. Doi: 10.1177/08874034144562602.
325
Knudsen, K. 2016. A specialized treatment court for veterans with trauma exposure. Community Mental Health
Journal, 52(2), 127-135.
326
Tsai, J et.al. 2016. Diversion of veterans with criminal justice involvement to treatment courts. Psychiatric
Services 68(4), 375-383.
327
Gowensmith, W. et.al. 2016. Outpatient competency restoration as a promising approach to modern
challenges. Psychology, Public Policy and Law, 22 (3)
328
Serious mental illness prevalence in jails and prisons. 2016. Treatment Advocacy Center
329
Vera institute of justice. 2016. The burden of mental illness behind bars. www.vera.org.
330
Jail mental health initiatives. 2019. Harris County Sheriff’s Office. www.harriscountycit.org.
331
Vera op.cit.
332
Bronson, J. 2017. Indicators of mental health problems reported by prisoners and jail inmates, 2011-12. Bureau
of Justice Statistics: Special Report. NCJ250612.
333
NCCHC Standards for Mental Health Services in Correctional Facilities. 2015

DRAFT Lee County Human Services Gap Analysis
Secon Four: Systems of Care
Chapter 15 | Behavioral Health and Criminal Justice Page | 231
Intake services – suicide risk, mental health screening, mental health assessment
and evaluation
Treatment – medication, crisis intervention, counseling and psychosocial
education
Discharge planning
The most common form of treatment is prescripon medicaon.
334
While jails are now the de facto mental hospitals, they are not equipped to provide the
services of mental hospitals. A 2011 survey found that half of the surveyed jails had
provided lile training, and less than half oered treatment.
335
A detailed audit of
mental health services in Kansas found that its jails were providing from two to six of
the naonally recommended services listed above.
336
Virginia, in a study of its jails,
found that 13% of inmates refused psychotropic medicaons.
337
The jail systems of the naon are creang responses to this situaon. Some of these
are listed below as examples of emerging pracces.
Community Forensic Residenal Facilies
In response to a 2006 forensic bed crisis, the Supreme Court of Florida convened a set
of stakeholders to address the issue. The group’s report, Transforming Florida’s Mental
Health System,
338
issued several recommendaons. One recommendaon was to
provide community-based residenal treatment alternaves to serve individuals that
have less serious oenses, do not pose signicant safety risks and otherwise would be
admied to State treatment facilies.
334
Bronson, J. 2017. Indicators of mental health problems reported by prisoners and jail inmates, 2011-12. Bureau
of Justice Statistics: Special Report. NCJ250612.
335
Best practices in Mental Health at corrections facilities. 2011. Partnership for the Common Good.
336
Community mental health: Evaluating mental health services in local jails. 2018. Performance Audit Report,
Legislative Division of Post Audit, State of Kansas. www.kslpa.org.
337
Mental illness in jails report. 2018. Virginia Compensation Board. www.rga.lis.virginia.gov.
338
Available at htpp://www.floridasupremecourt.org/pub_info/documents/11-14-
2007_Mental_Health_Report.pdf

DRAFT Lee County Human Services Gap Analysis
Secon Four: Systems of Care
Chapter 15 | Behavioral Health and Criminal Justice Page | 232
In response to this recommendaon, the Florida Department of Children and Families
and the 11
th
Judicial Circuit implemented a pilot program of this type, operated by a
community-based treatment provider.
339
The treatment regime begins in a crisis
stabilizaon unit, followed by residenal treatment and competency restoraon. Once
completed, community placement can be authorized. The program encompasses both
competency restoraon and community re-entry.
An analysis of the program found:
Individuals participating in the program are ready for discharge from forensic
commitment an average of 64 days sooner than those assigned to State forensic
facilities.
When structured at the optimal 20 beds, the program costs about one-third less
than the State forensic facilities.
In terms of program impact, individuals who remain linked to the program had
68% fewer jail bookings and 94% fewer jail days.
Suicide Prevenon
Since mentally ill inmates are at higher risk of suicide, a variety of strategies to address
this issue are developing. In Jeerson, CO, one strategy being evaluated is for those at
risk of suicide to be placed in a more open seng to enable beer observaon and
monitoring.
340
Los Angeles is placing two per cell aer having found that inmates will
bring aenon to their cell if a suicide aempt is made.
341
Palm Beach County found
that sexual deviants and inmates with longer sentences were at higher suicidal risk.
342
These inmates are immediately referred to the County’s mental health unit for
evaluaon.
339
Miami-Dade Forensic Alternative Center Pilot Program Status Report
340
Managing mental illness in jails. 2018. Police Executive Research Forum
341
Managing mental illness, op.cit.
342
Managing mental illness, op.cit.

DRAFT Lee County Human Services Gap Analysis
Secon Four: Systems of Care
Chapter 15 | Behavioral Health and Criminal Justice Page | 233
Co-occurring Disorders Treatments
As noted already, a high proporon of mentally ill inmates also have substance abuse
issues. In response to this situaon, Essex County, MA, established a 28-day inpaent
detox program and a 42-bed addicon treatment facility.
Medical Psychologist
Lafayee Parish, LA, hired a medical psychologist; this gave the parish more accurate
and prompt diagnoses of mental illnesses and more comprehensive treatment. The
results included less disrupve behavior, fewer assaults and a 67% reducon in
pharmaceucal costs due to more accurate diagnoses and more comprehensive
treatment plans.
343
Tele-Psychiatry
Tele-psychiatry is a tool that enables a police ocer, a correcons ocer or other sta,
to interact with a mental health professional remotely. It can also be used for direct
paent interacon. Harris County, TX, can connect via iPads to mental health
professionals when dealing with a person with mental health, substance abuse or
developmental disabilies. Los Angeles County is tesng a telepresence program in its
jail.
Cognive-Behavior Therapies
These programs seek to address an-social thinking and behavior paerns combined
with mental health care, with the intent of prevenng re-incarceraon.
344
343
Managing mental illness, op.cit.
344
Stringer, H. 2019. Improving mental health for inmates. Monitor on psychology, 50(30, 46.

DRAFT Lee County Human Services Gap Analysis
Secon Four: Systems of Care
Chapter 15 | Behavioral Health and Criminal Justice Page | 234
Trauma-Informed Care
These are sta training programs to help sta understand the nature of trauma and
how to interact with people who likely have experienced some form of trauma.
345
Therapeuc Communies
A program that can be oered during incarceraon that has proven to reduce future
incarceraons is the Amity in-prison therapeuc community.
346
While this research
occurred on prisoners, the key design element was a dedicated housing unit. In this
research, substance abuse was the focus.
Specialized Facilies and Programs
It is commonly accepted that jails now house more mentally ill individuals than mental
hospitals.
347
In response to this fact, a variety of specialized facilies are being
developed by sheri and / or jail administrators. Some examples include:
Pinellas County has developed a homeless shelter at one of the Sheriff’s facilities.
348
Harris County, TX, has developed a Mental Health and Medical Security Unit.
349
In
addition, it has a 108-bed unit for the most serious mentally ill. It also has a Crisis
Intervention Response Team for incidents in the jail.
Intercept 5: Release, Re-entry, Reintegraon, Community Correcons
To lower the rates of recidivism, there have been several eorts to develop programs
that help released inmates successfully return to their communies. The value of this is
self-evident from a cost-of-inmate factor along with the various human and community
benets. There are studies of best pracce re-entry programs that have shown
345
Stringer, op.cit.
346
Amity in-prison therapeutic community. 2011. Crimesolutions.gov
347
Jail mental health initiatives. 2019. Harris County, TX Sheriff’s Office. www.harriscountycit.org.
348
Managing mental illness in jail. 2018. Police Executive Research Forum
349
Jail mental health initiatives, 2019. Op cit.

DRAFT Lee County Human Services Gap Analysis
Secon Four: Systems of Care
Chapter 15 | Behavioral Health and Criminal Justice Page | 235
signicant reducons in recidivism.
350
The Minnesota Comprehensive Oender Re-
Entry Plan showed reduced recidivism
351
as did the High-Risk Revocaon Reducon
Program.
352
Other studies show mixed results at best.
353
Employment focused re-entry programs
have had lile success in reducing recidivism.
354
A job by itself is no guarantee. Federal
Second Chance Act re-entry programs that oer case management, employment
assistance and cognive-behavioral therapy showed no impact on arrests, convicons,
or incarceraons at the 30-month follow-up.
355
There are two key components of re-entry from a mental health perspecve. One is
linking the person to a mental health provider. The second is addressing all the other
life issues and barriers that persons with criminal records face.
Some examples of re-entry programs include:
356
Critical time intervention (CTI). This is a time-limited, evidence-backed program that
provides support for times of transition.
357
The Helping HANDS (Health, Access, Navigation, Deliver, Services) program of Palm
Beach County. This program involves the mental health provider prior to release.
Sheriff’s Integrated Access Team. This Hennepin County, MN, team conducts
interviews both at entry to the jail and prior to release to determine the needs of
the individual.
Arapahoe County, CO, has a partnership with a mental health provider. This puts
staff in the jail to help with addiction education and re-entry planning.
Sarasota County SHIFTS (Sheriff’s Housing Facilitating Initiative Transient Services).
This focuses on transients who must be relocated and 24/7 housing is provided with
intake, triage and assessment services.
358
350
Corrections and Reentry. Crimesolutions.gov
351
Minnesota Comprehensive Offender Reentry Program. 2016. Crimesolutions.gov
352
High-Risk Revocation Reduction Program, 2018. Crimesolutions.gov
353
Muhlausen, D. 2018. Research on returning offenders programs and promising practices. National Institute of
Justice.
354
Muhlausen, op.cit.
355
Muhlausen, op.cit.
356
Managing mental illness in jail. Op.cit.
357
www.criticaltime.org
358
www.caslinc.org

DRAFT Lee County Human Services Gap Analysis
Secon Four: Systems of Care
Chapter 15 | Behavioral Health and Criminal Justice Page | 236
Some best pracces are:
Start early and create a plan for release on the first day of incarceration.
359
This is a
two-phased approach in which there is work prior to release and then a year-long
follow up is conducted. This has proved to be effective.
360
Address underlying attitudes about crime and work.
361
Adopt a framework such as Risk-Needs-Responsivity.
362
Responsivity means
intervening in a manner that is appropriate and matches the abilities of the person.
Utilize evidence-based interventions such as Family Functional Therapy for
dysfunctional youth
363
, Enhanced Thinking Skills
364
or others.
Use cognitive-behavioral approaches.
365
Target criminogenic needs.
366
Address housing, employment, transportation and other basic needs.
367
Ensure continuity of medications so that the released inmate has an adequate
supply of medications as well as access to pharmacies.
Provide a linkage with a mental health provider prior to release.
Proactively re-instate public benefits.
Address opioid issues through naloxone programs.
System-of-Care Model
The value of the sequenal intercept model is that it idenes how potenal inmates
can be diverted to a more appropriate seng and can be beer served if jail is the most
appropriate placement. It also addressed how recidivism can be prevented.
Another way to examine the Criminal Jusce / Behavioral Health interface is to take the
viewpoint of a system-of-care. Of relevance to this discussion is the Recovery-Oriented
system-of-care model developed for addressing substance abuse issues as well as
mental health issues. Beacuse a high proporon of inmates and mentally ill have even
359
Johnson, S. Four elements of successful reentry programs. Social solutions.
360
Allegany County PA jail-based reentry specialist program. Crimesolutions.gov
361
Johnson, Op.cit.
362
op.cit
363
Functional Family Therapy, 2011. Crimesolutions.gov
364
Enhanced Thinking Skills. Crimesolutions.gov
365
Listwan, S. et.al. 2006. How to prevent prisoner reentry programs from failing. Federal Probation, 70(3), 19-25
366
Listwan op.cit
367
Listwan, op.cit.

DRAFT Lee County Human Services Gap Analysis
Secon Four: Systems of Care
Chapter 15 | Behavioral Health and Criminal Justice Page | 237
higher rates of substance abuse issues, the Recovery-Oriented system-of-care is the
most appropriate model for this analysis.
A recovery-oriented system-of-care model has the following elements:
Person-centered and choices.
368
Inclusive of family and other allies.
369
Individualized, integrated and comprehensive services adapted across the
lifespan.
370
Systems anchored in community with a system-wide framework.
371
Continuity and continuum of care, ongoing monitoring and outreach, and chronic
care strategies.
372
Strength-based.
373
Culturally responsive.
374
Commitment to peer recovery supports.
375
Flexible financing and pooled funding.
376
From a system-of-care perspecve, each of the intervenons described in the
discussion on sequenal intercepts are more likely to be eecve if organized, delivered
and managed using the above elements. Such an approach avoids intervenon “silos”
and provides consistent support for each intervenon.
368
Laughame, R. et.al. 2006. Trust, choice and power in mental health. Social Psychiatry and Psychiatric
Epidemiology, 41(11), 843-852.
369
Noel, N. et.al. 1987. Predictors of attrition from an outpatient alcoholism treatment program for couples.
Journal of Studies on Alcohol, 48(3), 229-235.
370
Babor, T. et.al. 2008. Alcohol and drug treatment systems in public health perspective. International journal of
Methods in Psychiatric Research, 17(51), 550-559.
371
Broome, K. et.al. 2002. The role of social support following short-term inpatient treatment. American Journal of
Addictions, 11, 57-65.
372
Haggerty, J. et.al. 2003. Continuity of care: A multi-disciplinary review. British Medical Journal. 327, 1219-1221.
373
Rapp, R. et.al. 1998. Predicting post primary treatment services and drug use outcome: A multivariate analysis.
American Journal of Drug and Alcohol Abuse, 24, 603-615.
374
Longshore, Dr. et.al. 1999. Effects of a culturally congruent intervention on cognitive factors related to drug-use
recovery. Substance Use and Misuse, 34(9), 1223-1241.
375
Galanter, M. et.al. 1998. Homelessness and mental illness in a professional and peer-led cocaine treatment
clinic. Psychiatric Services, 49(4), 533-535.
376
Reynolds, K. et.al. 2005. Innovative ways to finance mental health services in a primary care setting.
Washtenaw, MI: Washtenaw Community Health Association.

DRAFT Lee County Human Services Gap Analysis
Secon Four: Systems of Care
Chapter 15 | Behavioral Health and Criminal Justice Page | 238
As noted in the sequenal intercept analysis, several of the specic services resulted in
mixed outcomes. Operated and evaluated in isolaon, this would be expected. What
has not occurred is an evaluaon of a comprehensive system-of-care in which all the
specic services operate under a common framework and are funconally linked.
Gaps & Priories: Criminal Jusce and Behavioral Health Priority Components
Intercepts 0 & 1: Community Response and Diversion.
Establishment of a Mental Health Evaluaon Team (i.e. interceptor). This team would
be immediately available to Law Enforcement Ocers to determine an appropriate
response based on an assessment of the individual. This assessment could be done
remotely by phone, by video link or in-person.
Addional Training of Law Enforcement Personnel with respect to available resources,
contact procedures and addional CIT or advanced CIT (where needed).
Increase in the Number of FACT Teams. FACT teams provide an asserve community
treatment response that acvely monitors serious mentally ill individuals and keeps
them in the community through medicaons intervenon and other mechanisms.
Increase in the Resources available to FACT teams, parcularly housing funds.
Mul-capability Facility to support diversion. Discussed in Intercepts 2, 3 and 4 below.
Intercepts 2, 3 & 4: Screening / Pre-trial Diversion, Specialty Courts, Treatment.
Establishment of a Mul-Capability Forensic Alternave Facility (in part modeled aer
Secon 916.185, F.S.). This facility would be designed to provide several key services
with appropriate levels of control:
Immediate drop-off site for law enforcement for people who need to be
removed from the community temporarily, but who are not a threat to
themselves or others. This could include detox capacity.
Baker Act CSU for people who are a threat to themselves or others.

DRAFT Lee County Human Services Gap Analysis
Secon Four: Systems of Care
Chapter 15 | Behavioral Health and Criminal Justice Page | 239
Residential facilities for pre-trial release under conditions.
Residential facilities for jail inmates with Serious Mental Illness diagnoses
(modeled after the jail’s current behavioral unit).
Step-down capacity to enable more coordinated re-entry efforts, involuntary
outpatient services, movement from more restricted to less restricted units and
community competency restoration.
Establishment of a Rapid Response Team
The rapid response team targets clients in jail who are quickly idened as having a
severe mental illness. There is no structure, signed releases or consent to trigger the
team’s involvement. For example, the jail would contact the defense aorney and say
this person appears to be in crisis. The defense aorney would call a meeng with the
team to decide the best approach in assisng the client’s crisis issue. The rapid
response team is not a court, but more of an idencaon process to divert individuals
out of the jail to more appropriate sengs – Baker Act, mental health court, outpaent
services etc. This rapid response team may not have any bearing on the overall
ligaon of the criminal case.
If there were a team consisng of a judge, an assistant state aorney, an assistant
public defender, LCSO ocer or correcon sta, and a community provider such as
FACT, or a behavioral health service provider then clients could be idened in crisis at
rst appearance (the day aer their arrest) and appropriate acon can be taken to help
move them into a more appropriate seng within 24 to 48 hours of arrest. The idea
would be that the judge in this team would follow their case. Currently, clients oen sit
in jail 30 to 60 days and somemes in isolaon before they are released. They may be
released with no condions or support. The idea would be to get the client
psychiatrically stabilized as quickly as possible, so that they can be in the right frame of
mind to agree to programs such as mental health court, etc.
Establishment of Addional Specialty Courts
916 Court. This court would focus on competency restoraon. A mul-disciplinary
team approach typical of other specialty courts would be established. Processes and
procedures would need to be developed with all involved pares prior to
establishment.

DRAFT Lee County Human Services Gap Analysis
Secon Four: Systems of Care
Chapter 15 | Behavioral Health and Criminal Justice Page | 240
Intercept 5: Re-entry.
Establishment of Addional Correconal Full-me Equivalents (FTEs)
Addional FTEs would enable the Sheri to establish case-load management systems so
that planning for re-entry can begin upon admiance to the jail or forensic facility. This
would include coordinaon with various post-release wrap-around services, Intercept 0
and 1 points and specialty courts.
System-of-Care
Overall coordinaon. There is a need for an overall perspecve on the system. All
approaches should be considered, whether it is the Public Safety Coordinang Council,
an oce dedicated to this, or a mul-agency / disciplinary team.

DRAFT Lee County Human Services Gap Analysis
Secon Four: Systems of Care
Chapter 16 | Child Abuse and Neglect, Foster Care, Adoptions Page | 241
CHAPTER 16
Child Abuse and Neglect, Foster Care, Adopons
Introducon
This chapter addresses the topic of children who suer from abuse and neglect. Some
of these children are placed in the foster care system either temporarily or unl the
me their parents can resume parental dues.
This chapter has four secons. They are:
Section One: Context and Background. This section provides national, state and
local Lee County data about the scope and status of sexual abuse.
Section Two: The System-of-Care. This section describes the various services and
responsible entities whose mission it is to address this issue.
Section Three: System Gaps. These are gaps in services, current unmet needs and
any potential emerging issues.
Section Four: Definitions. This section provides formal and legal definitions of the
various terms used in the system. It is provided in case the reader desires
clarification on any of these terms, or it may assist in data interpretation.
Context and Background
9% of all Medicaid expenses are related to child maltreatment. This equates to
$5.9B;
377
Seven children per 1,000 are victims of neglect. 1.7 per 1,000 are victims of physical
abuse, 0.8 per 1,000 are victims of sexual abuse and 0.5 are victims of emotional
abuse;
378
Approximately 3 million cases of child abuse, involving 5.5 million children, are
reported each year;
379
Approximately one in 20 children have been physically abused in their lifetime;
380
377
Economic impact of child abuse. www.fncac.org.
378
U.S. Department of Health and Human Services: Administration for Children and Families and Office of Child
Abuse and Neglect
379
Child abuse and neglect. www.healthychildren.org
380
ibid.

DRAFT Lee County Human Services Gap Analysis
Secon Four: Systems of Care
Chapter 16 | Child Abuse and Neglect, Foster Care, Adoptions Page | 242
Almost one in four girls and one in eight boys will be sexually abused before they are
18 years old;
381
For women, after the ages of 18 to 24, the next most common age for sexual
violence in a home or family setting is 11- to 17-years-old;
382
Most child abuse occurs within the family. The leading factor in Florida is parental
substance abuse. Other risk factors include parental depression or other mental
health issues, a parental history of childhood abuse and domestic violence;
383
Child neglect and other forms of maltreatment are more common in families living in
poverty or among parents who are teenagers or who abuse drugs or alcohol;
384
More children are abused by a caregiver or someone they know than by
strangers;
385
Physical abuse in children can lead to brain dysfunction;
386
Physically abused children showed central nervous system damage,
387
physical
defects,
388
mental retardation
389
and serious speech problems;
390
Severe childhood maltreatment is later related to self-destructive behavior,
391
suicide,
392
depression
393
and substance abuse.
394
381
ibid
382
National Intimate Partner and Sexual Violence Survey, 2010 Summary Report. National Center for Injury
Prevention and Control, Division of Violence Prevention, Atlanta, GA, and Control of the Centers for Disease Control
and Prevention.
383
Child abuse and neglect, www.healthychildren.org
384
ibid
385
ibid.
386
Dykes, L. 1986. The whiplash shaken infant syndrome: what has been learned. Child Abuse and Neglect, 10:211-
221.
387
Elmer, E. & Gregg, G. 1967. Developmental characteristics of abused children. Pediatrics, 40(4): 596-602
388
Green, A. 1978. Psychopathology of abused children. Journal of the American Academy of Child Psychiatry.
17:92-103.
389
Martin, H. et.al. 1974. The development of abused children. Advances in Pediatrics, 21:25-73.
390
Morse, C. et.al. 1970. A 3-year follow-up study of abused and neglected children. American Journal of Diseases
of Children. 120:439-446.
391
Gutierres, S. & Reaich, J. 1981. A developmental perspective on runaway behavior: Its relationship to child
abuse. Child Welfare 60-89-94
392
DeWilde, E. et.al. 1992. The relationship between adolescent suicidal behavior and life events in childhood and
adolescence. American Journal of Psychiatry, 149(1): 45-51
393
Stein, J. et.al. 1988. Long-term psychological sequelae of child sexual abuse. In G. Wyatt and G. Powell (eds)
Lasting effects of child sexual abuse. Newbury Park, CA: Sage
394
Ludwig, G & Anderson, M. 1989. Substance abuse in women: Relationship between chemical dependency of
women and past reports of physical and/or sexual abuse. International Journal of Addictions 248): 739-754.
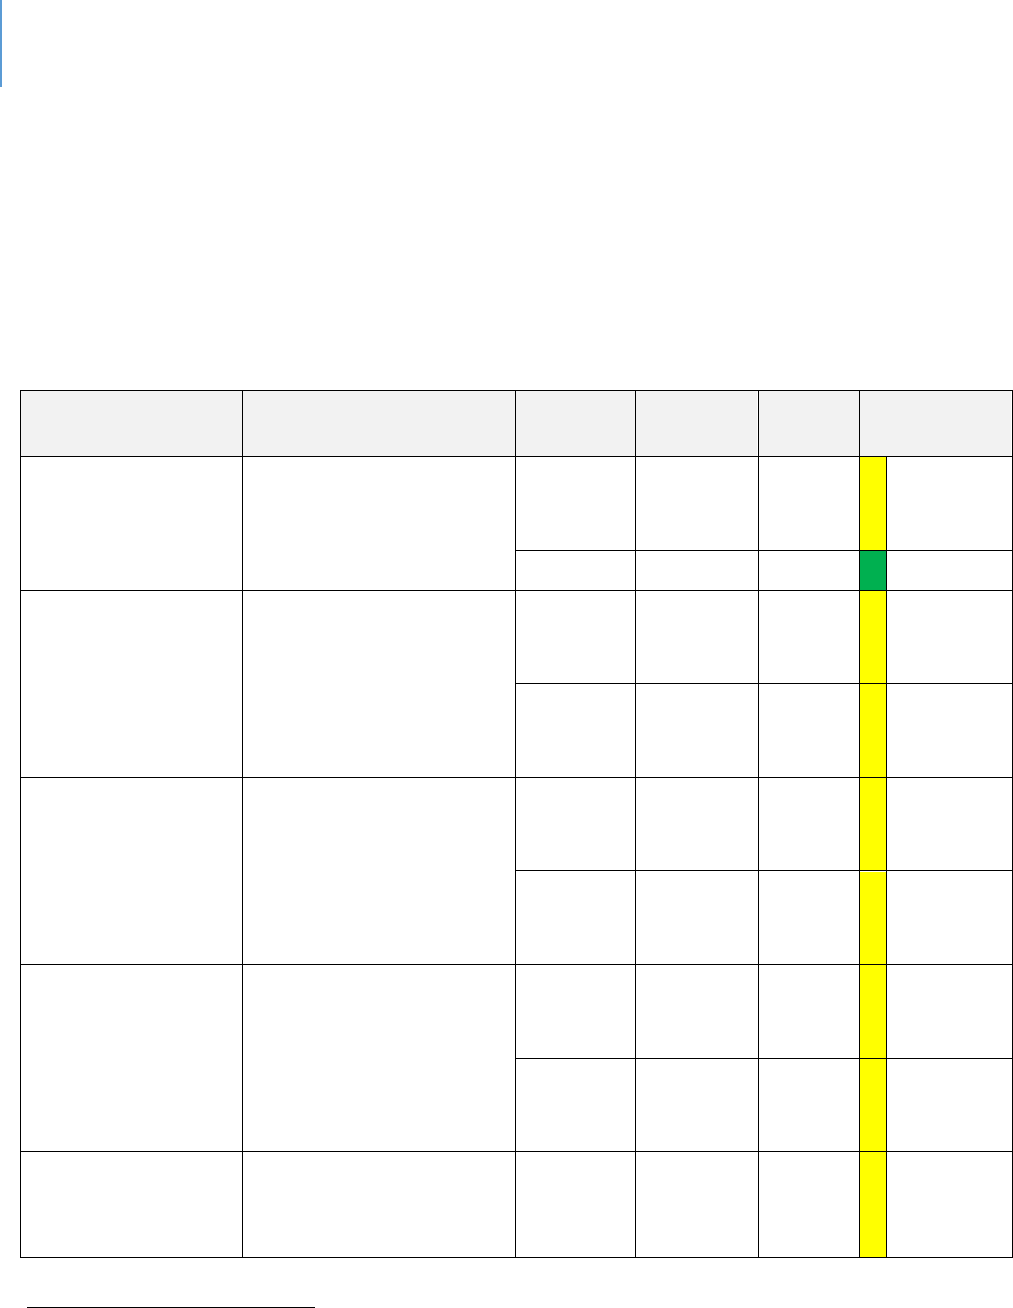
DRAFT Lee County Human Services Gap Analysis
Secon Four: Systems of Care
Chapter 16 | Child Abuse and Neglect, Foster Care, Adoptions Page | 243
Lee County Data
Table 63 presents various data points relevant to child abuse and neglect in Lee County.
Lee County mirrors the State average in most cases. However, there are a
comparavely higher poron of children in foster care than the State average. Given
the variety of factors that lead to foster care, this is not a pure indicator of child abuse
or neglect.
Table 63. Child Abuse and Neglect Indicators in Lee County
Sources
Data Title
Year
Lee
County
State
Comparison
to State
MyFLFamilies.com
395
Children Entering Care
Who Achieve Permanency
within 12 Months
2018
43.2%
41.4%
Within
10%
average
2019
44.7%
40.2%
Beer
MyFLFamilies.com
Chart - Abuse during In-
Home Services (% of
Children Not Abused)
(Average State Fiscal
Year)
2018
94.4%
94%
Within
10%
average
2019
94.2%
94.7%
Within
10%
average
MyFLFamilies.com
Chart - Children with No
Recurrence of Veried
Maltreatment w/in 12
Months (Average State
Fiscal Year)
2018
91.3%
91.9%
Within
10%
average
2019
92.9%
92.4%
Within
10%
average
MyFLFamilies.com
Chart - Young Adults Aging
out who did not
Perpetrate Abuse by their
25th Birthday
2019 Q1
84.21%
87.35%
Within
10%
average
2018 Q1
82.35%
88.34%
Within
10%
average
MyFLFamilies.com
Chart - Removal Rate per
100 Alleged Vicms
2018
5.2
5.2
Same
395
Florida Department of Children and Families, Child Welfare Statistics Dashboard
https://myflfamilies.com/programs/childwelfare/dashboard/
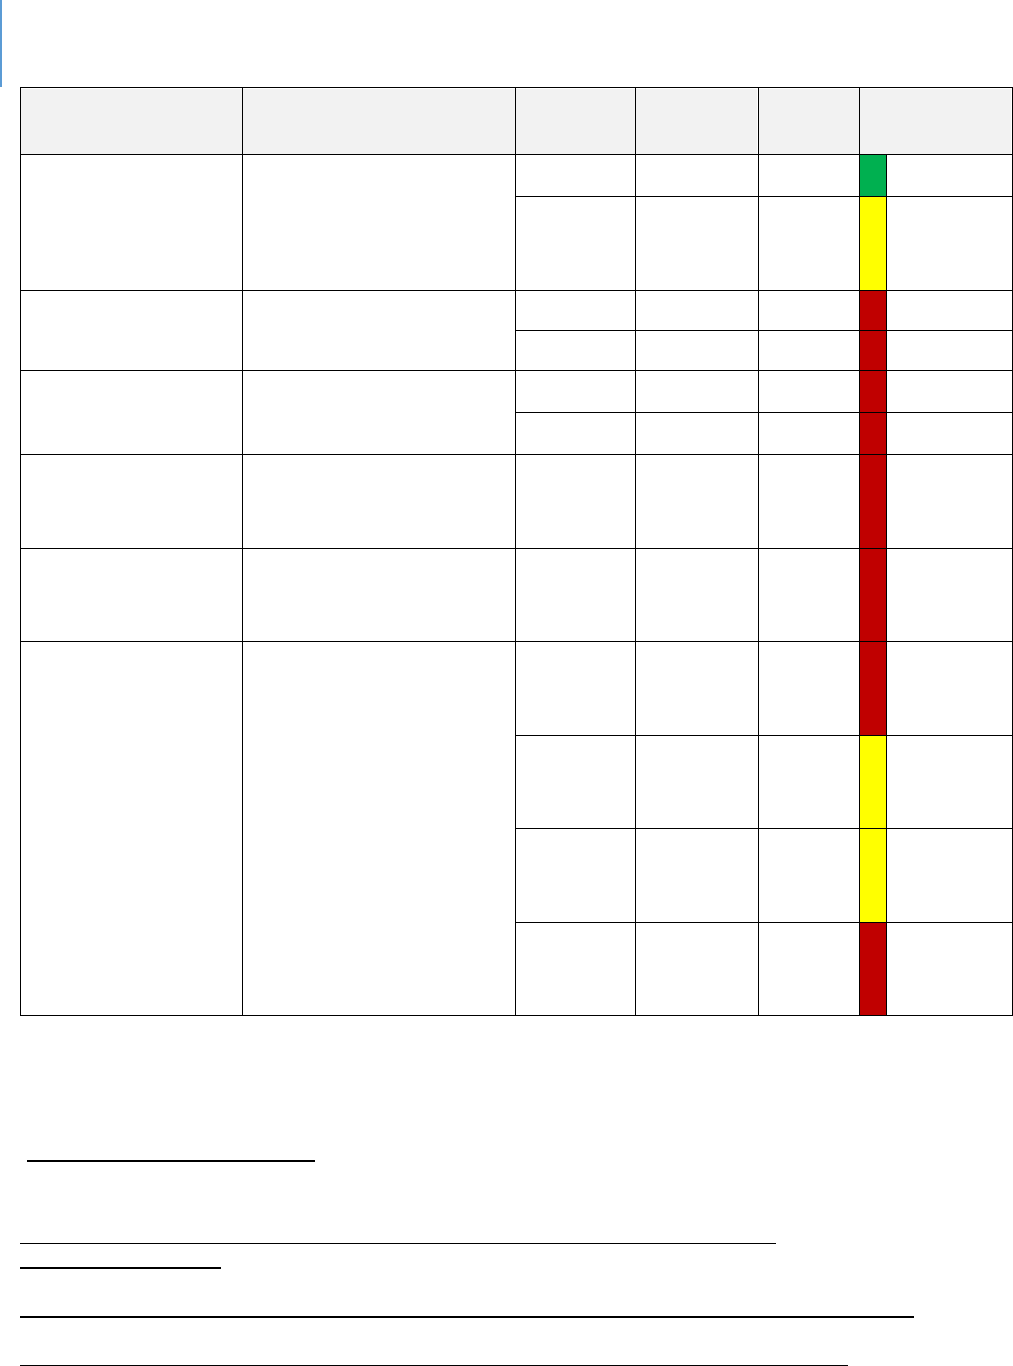
DRAFT Lee County Human Services Gap Analysis
Secon Four: Systems of Care
Chapter 16 | Child Abuse and Neglect, Foster Care, Adoptions Page | 244
Sources
Data Title
Year
Lee
County
State
Comparison
to State
School Age Child
Adolescent Prole
396
Children Experiencing
Child Abuse Ages 5-11 per
100,000
2015-17
850.4
932.8
Beer
2016-18
863.2
855.3
Within
10%
average
School Age Child
Adolescent Prole
Children in foster care
ages 5-11 Per 100,000
2017
563.4
413.7
Worse
2018
571.3
455.7
Worse
School Age Child
Adolescent Prole
Children in foster care
ages 12-17 Per 100,000
2017
481.8
410.6
Worse
2018
511.8
362.4
Worse
Child Health
Status
397
Children under 18 in
Foster Care Per 100,000
populaon
2017
708.3
537.7
Worse
Child Health
Status
398
Children Experiencing
Sexual Violence Ages 5-11
per 100,000 populaon
2015-17
73.5
59.8
Worse
MyFLFamilies.com
Removal Rate per 100
Alleged Vicms for
Invesgaon Closed By
Quarter
(County group is a region
that includes – Lee, Collier,
Charloe, Hendry and
Glades counes)
Oct –
Dec 2018
(Quarter)
5.6
4.8
Worse
Jan –
Mar
2019
5.03
5.17
Within
10%
average
April –
June
2019
5.23
4.8
Within
10%
average
July –
Sept
2019
7.27
5.78
Worse
With respect to exing foster care in 2018, 30 18- to 21-year-olds were in extended
foster care and 39 18- to 22-year-olds were enrolled in post-secondary educaon
396
Florida Health Charts,
School-aged Child and Adolescent Profile
http://www.flhealthcharts.com/ChartsReports/rdPage.aspx?rdReport=ChartsProfiles.School-
agedChildandAdolProfile
397
Child Health Status
http://www.flhealthcharts.com/ChartsReports/rdPage.aspx?rdReport=ChartsProfiles.ChildHealthStatusProfile
398
Florida Health Charts, Children Experiencing Sexual Violence ages 5-11
http://www.flhealthcharts.com/charts/OtherIndicators/NonVitalIndNoGrpDataViewer.aspx?cid=0561
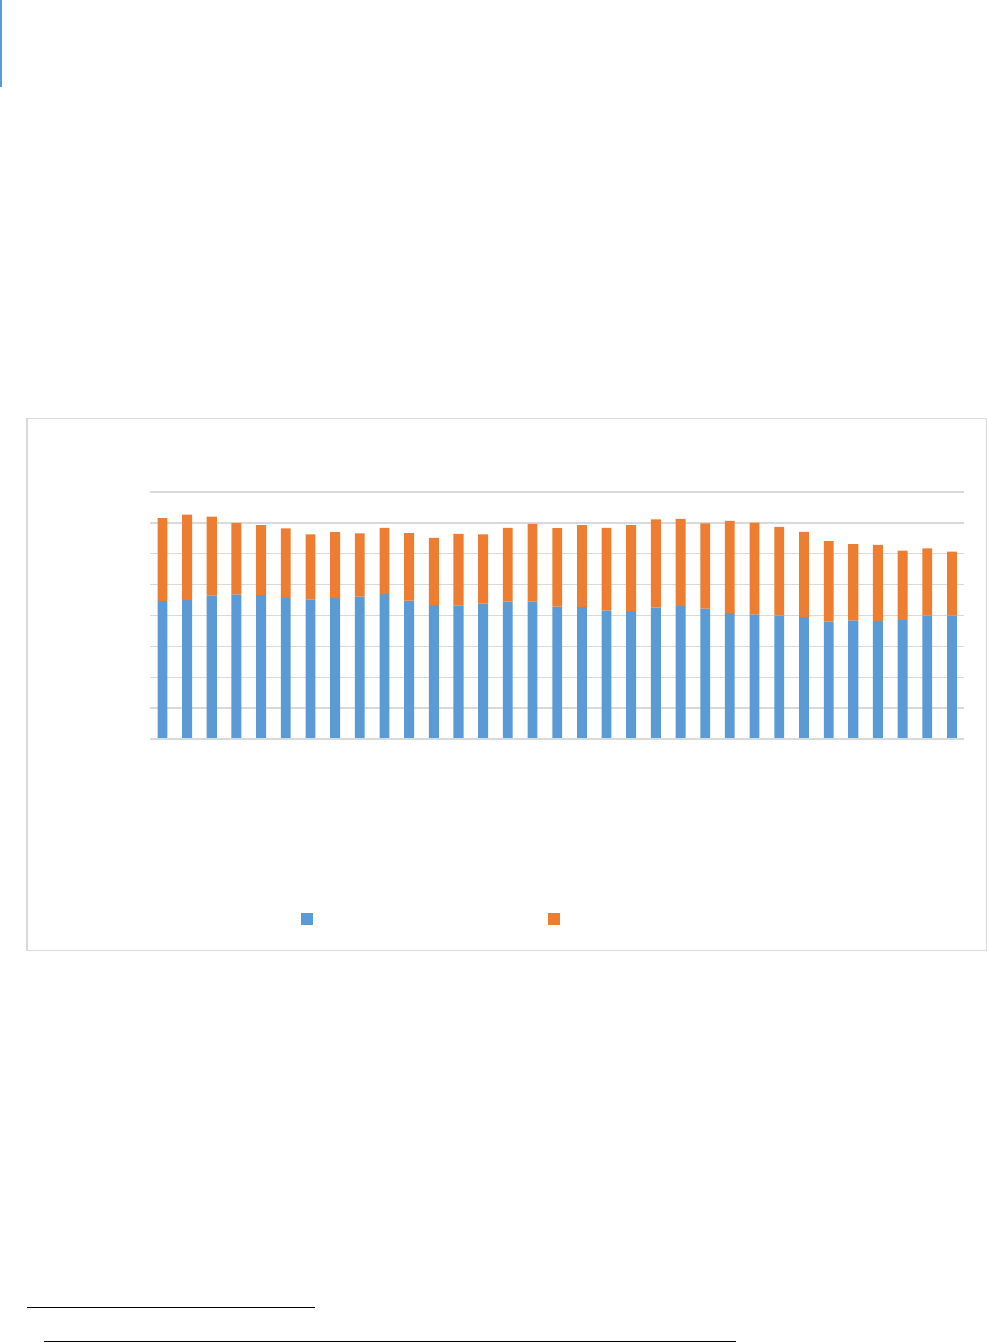
DRAFT Lee County Human Services Gap Analysis
Secon Four: Systems of Care
Chapter 16 | Child Abuse and Neglect, Foster Care, Adoptions Page | 245
services and support services. Fiy-six youths aged out and 17 were terminated for
non-compliance.
Figure 18 shows out-of-home services in Lee County on a downward trend. In 2017, the
average was 913 per month, while in 2019 the average was 784 per month. In-home
services have increased since 2017, when the average monthly count was 460 children
and young adults. In 2018, the average was 525, and in 2019 the average was at 503 as
of September.
Figure 18. Children and Young Adults Receiving DCF Services in Lee County
399
399
https://www.myflfamilies.com/programs/childwelfare/dashboard/cya-inhome.shtml
https://www.myflfamilies.com/programs/childwelfare/dashboard/c-in-ooh.shtml
0
200
400
600
800
1000
1200
1400
1600
Jan 2017
Mar 2017
May 2017
Jul 2017
Sep 2017
Nov 2017
Jan 2018
Mar 2018
May 2018
Jul 2018
Sep 2018
Nov 2018
Jan 2019
Mar 2019
May 2019
Jul 2019
Sep 2019
Count
Month
Children and Young Adults Receiving DCF Services in Lee County
Out-of-Home Services In-Home Services
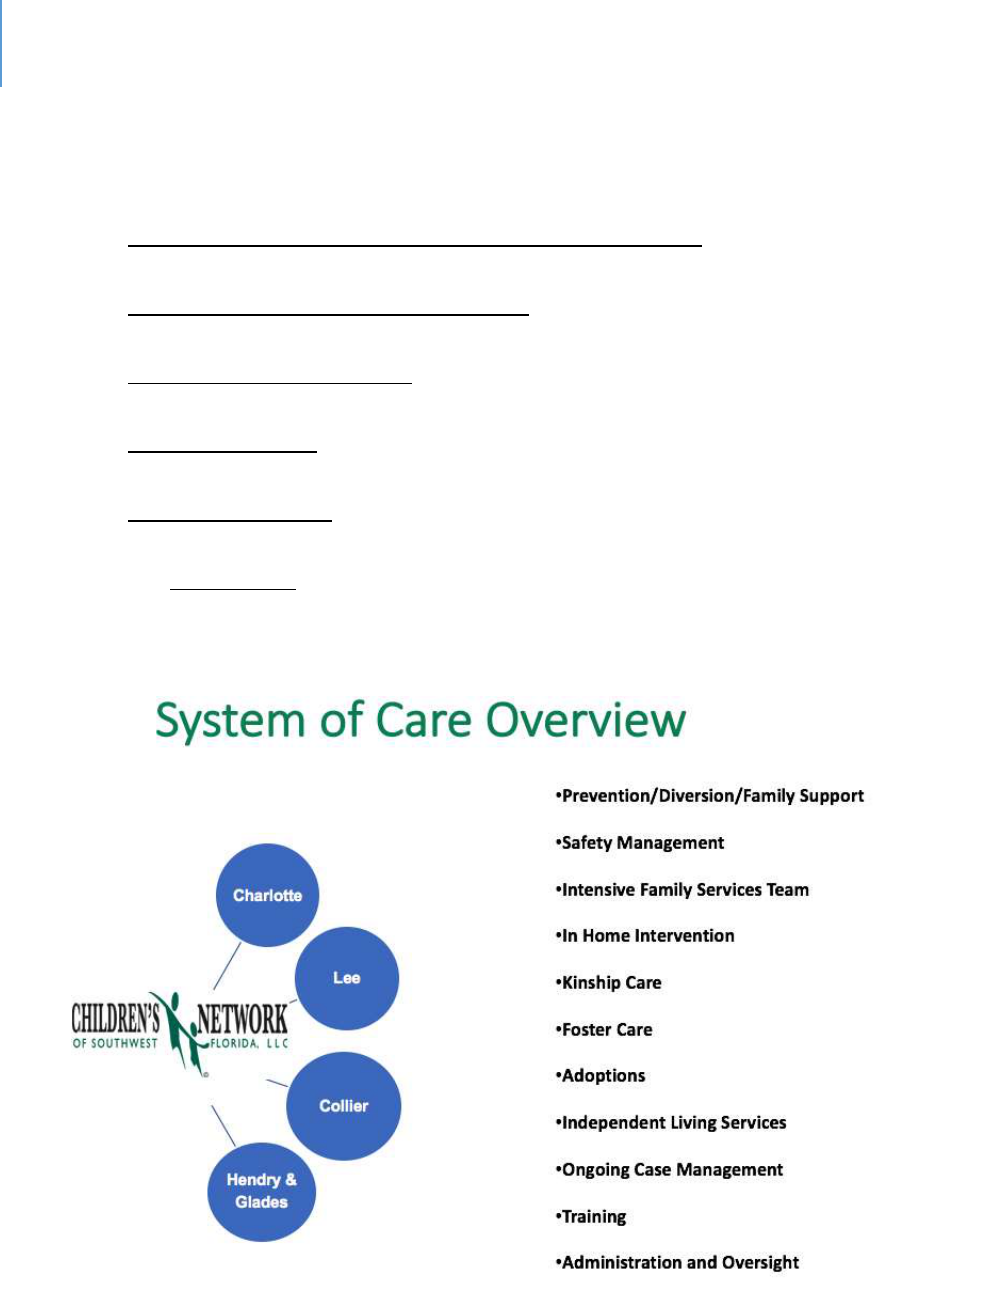
DRAFT Lee County Human Services Gap Analysis
Secon Four: Systems of Care
Chapter 16 | Child Abuse and Neglect, Foster Care, Adoptions Page | 246
System-of-Care
The system-of-care consists of the following major enes (as shown in Figures 19 and
20):
The Florida Department of Child and Family Services (DCF). DCF is the state agency
with funding, administrative and regulatory authority;
Children’s Network of Southwest Florida. This agency is contracted by DCF to
provide local services. It manages sub-contracts with specific service providers;
Child Advocacy Center (CAC). This local nonprofit provides assessment and
intervention services;
Adoption Agencies. These are agencies that provide adoption services that may
include foster care children;
Foster Care Agencies. These local nonprofits manage foster care services either by
providing a home setting themselves or by working with foster parents;
The Legal System will be involved as specific actions are needed.
Figure 19. Children’s Network of SWFL System-of-Care Overview
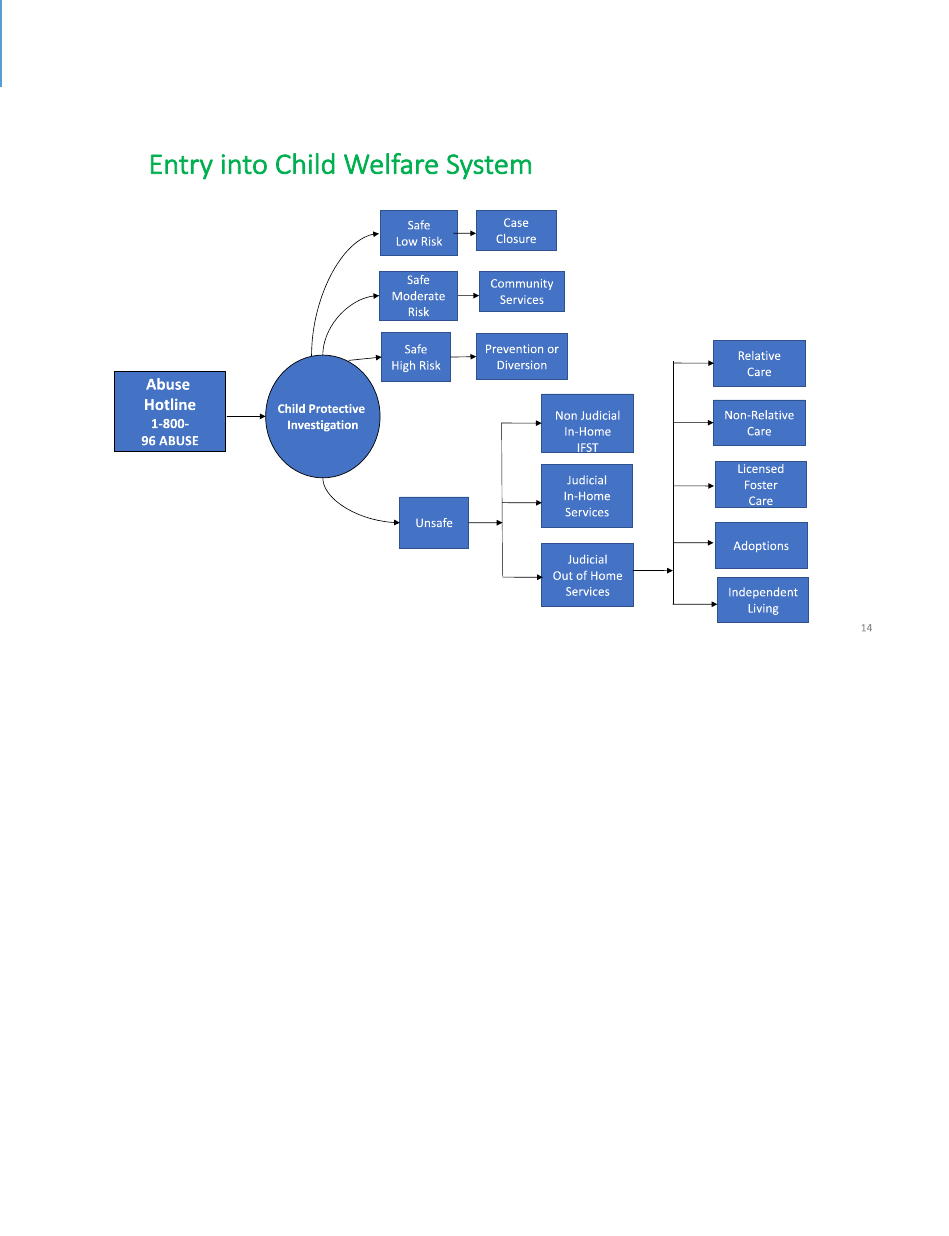
DRAFT Lee County Human Services Gap Analysis
Secon Four: Systems of Care
Chapter 16 | Child Abuse and Neglect, Foster Care, Adoptions Page | 247
Figure 20. Illustrates the Process Stages of the System-of-Care
Child Sexual Abuse
Child sexual abuse cases are generally handled by the Department of Health’s Child
Protecon Teams (CPTs), whose role is to supplement the assessment and protecve
supervision acvies of DCF. Services provided by CPTs include diagnosc medical
evaluaons, medical consultaons, family psychosocial interviews and forensic
interviews.
In Florida, CPTs work closely with Children’s Advocacy Centers (CACs), most of which are
unaliated with FCASV’s cered sexual assault programs. A CAC is a community-
based, child-focused facility where children who are vicms of abuse or neglect are
interviewed and receive medical exams. If necessary, therapy and other crical services
are provided in a non-threatening and child friendly environment. A CAC brings
together an array of professionals to work together on the invesgaon, treatment and
prosecuon of child abuse cases. The primary goal of a CAC is to minimize the level of
trauma experienced by child vicms, improve prosecuons and provide ecient and
thorough provision of necessary services to the child vicm and the child's family.

DRAFT Lee County Human Services Gap Analysis
Secon Four: Systems of Care
Chapter 16 | Child Abuse and Neglect, Foster Care, Adoptions Page | 248
CACs provide services such as:
Forensic interviews conducted by specially trained professionals in a non-
threatening, child-friendly environment.
Crisis intervenon and emoonal support for vicms and non-oending family
members.
Counseling for vicms and non-oending family members so that they may begin
to heal from emoonal wounds associated with child abuse.
Specialized forensic medical evaluaons.
Muldisciplinary review of cases by a team of professionals, such as law
enforcement ocials, child protecon teams, prosecutors, medical professionals,
mental health professionals, vicm assistance sta and child advocates.
Evidence-based prevenon and intervenon programs to reduce the likelihood of
child maltreatment and to provide safe and caring homes for children. Two
examples are:
Trauma-Focused Cognive Behavioral Therapy (TF-CBT).
400
TF-CBT is an
evidence-based treatment for children and adolescents impacted by
trauma and their parents or caregivers. Research shows that TF-CBT
successfully resolves an array of emoonal and behavioral dicules
associated with single, mulple and complex trauma experiences.
EMDR (Eye Movement Desensizaon and Reprocessing).
401
Professional training and community educaon to eecvely respond to child
abuse.
Gaps in Child Abuse and Neglect & Foster Care
The following gaps are noted:
The major gaps for children aging out of foster care are affordable housing and
transportation;
The primary reasons for removal of a child from a home are parental figure
substance abuse, domestic violence and inadequate supervision. The gaps noted in
the behavioral health and domestic violence chapters apply here;
400
www.TF-CBT.org
401
SAMHSA's National Registry of Evidence-based Programs and Practices
(2011). http://legacy.nreppadmin.net/ViewIntervention.aspx?id=199.

DRAFT Lee County Human Services Gap Analysis
Secon Four: Systems of Care
Chapter 16 | Child Abuse and Neglect, Foster Care, Adoptions Page | 249
Transportation for parents to access services, attend court and visit with their child if
in out-of-home care;
There is a greater need for substance abuse services for dependency youth than
there are resources;
A longer term of treatment for serious substance abuse is needed;
Child-care resources are very limited for children with behavioral issues;
More foster parents are needed than are available. This gap is even higher when the
child has special medical or behavioral needs;
Every effort is made to keep siblings together in foster care. If the family is very
large this is very difficult to achieve;
There is a lack of preventive services to intervene for parents who are having
difficulty with children who are exhibiting behavioral issues. This may result in the
child entering the foster care system;
For children involved in the Juvenile Justice System, it can take a long time to reach
adjudication. These children are hard to maintain in a traditional foster care setting;
There is an unmet need for immediate access to child-care services for families with
a Safety Plan. As noted in the staffing chapter, many child-care jobs are minimum
wage or slightly above. This results in high rates of turnover. While no business
wants high turnover rates, it is problematic in child-care because children benefit
from the stability of the adults in their lives, including child-care providers;
Three evidence-based programs (Safe at Home, Parent-Child Psychotherapy and
Cognitive-Behavioral Therapy) need to be more widely available;
More crisis management and same-day counseling services are needed;
A variety of in-home services are needed, such as crisis intervention and behavior
management;
Greater capacity to provide a variety of assessments is needed – substance abuse,
domestic violence, child sexual abuse, mental health.
Denions
Physical abuse is an injury to a child’s body due to hitting, kicking, shaking, burning
or other show of force.
Sexual abuse is any sexual activity that a child cannot understand or consent to.
Child neglect can include physical neglect (food, shelter, etc.), emotional neglect
(failing to provide comfort, love), or medical neglect. Verbal abuse is a form of
emotional neglect.

DRAFT Lee County Human Services Gap Analysis
Secon Four: Systems of Care
Chapter 16 | Child Abuse and Neglect, Foster Care, Adoptions Page | 250
The Federal Child Abuse Prevention and Treatment Act (CAPTA), (42 U.S.C.A.
§5106g), as amended by P.L. 111-320, the CAPTA Reauthorization Act of 2010
defines child abuse and neglect as, at minimum:
“Any recent act or failure to act on the part of a parent or caretaker, which results in
death, serious physical or emotional harm, sexual abuse or exploitation, or an act or
failure to act which presents an imminent risk of serious harm.”
The State of Florida definitions are more detailed. They include:
Physical Abuse
Citation: Ann. Stat. § 39.01
“Abuse” means any willful act or threatened act that results in any physical, mental, or
sexual abuse, injury, or harm that causes or is likely to cause a child's physical, mental,
or emotional health to be significantly impaired. Abuse of a child includes the birth of a
new child into a family during an open dependency case when the parent or caregiver
has been determined to lack the protective capacity to safely care for the children in the
home and has not substantially complied with the case plan toward successful
reunification or met the conditions for return of the children into the home. Abuse of a
child includes acts or omissions.
“Harm” to a child's health or welfare can occur when a person inflicts or allows to be
inflicted upon the child physical, mental, or emotional injury. Such injury includes, but is
not limited to, any of the following:
Willful acts that produce specic serious injuries
Purposely gives a child poison, alcohol, drugs, or other substances that
substanally aect the child's behavior, motor coordinaon, or judgment or that
result in sickness or internal injury
Leaves a child without adult supervision or arrangement appropriate for the
child's age or mental or physical condion
Uses inappropriate or excessively harsh discipline that is likely to result in
physical injury, mental injury as dened in this secon, or emoonal injury
Commits, or allows to be commied, sexual baery against the child
Allows, encourages, or forces the sexual exploitaon of a child
Abandons the child
Exploits a child or allows a child to be exploited
Neglects the child
Exposes a child to a controlled substance or alcohol

DRAFT Lee County Human Services Gap Analysis
Secon Four: Systems of Care
Chapter 16 | Child Abuse and Neglect, Foster Care, Adoptions Page | 251
Uses mechanical devices, unreasonable restraints, or extended periods of
isolaon to control a child
Engages in violent behavior that demonstrates a wanton disregard for the
presence of a child and could reasonably result in serious injury to the child
Negligently fails to protect a child in his or her care from inicted physical,
mental, or sexual injury caused by the acts of another
Has allowed a child's sibling to die because of abuse, abandonment, or neglect
Makes the child unavailable for impeding or avoiding a protecve invesgaon
unless the court determines that the parent, legal custodian, or caregiver was
eeing from a situaon involving domesc violence
Neglect
Citaon: Ann. Stat. § 39.01
“Neglect” occurs when a child is deprived of, or can be deprived of, necessary food,
clothing, shelter, or medical treatment or a child is permitted to live in an environment
when such deprivation or environment causes the child's physical, mental, or emotional
health to be significantly impaired or to be in danger of being significantly impaired.
Neglect of a child includes acts or omissions.
Within the context of the definition of 'harm,' the term 'neglects the child' means that
the parent or other person responsible for the child's welfare fails to supply the child
with adequate food, clothing, shelter, or health care, although financially able to do so
or although offered financial or other means to do so.
“Medical neglect” means the failure to provide or allow needed care as recommended
by a health-care practitioner for a physical injury, illness, medical condition, or
impairment or the failure to seek timely and appropriate medical care for a serious
health problem that a reasonable person would have recognized as requiring
professional medical attention. Medical neglect does not occur if the parent or legal
guardian of the child has made reasonable attempts to obtain necessary health-care
services or the immediate health condition giving rise to the allegation of neglect is a
known and expected complication of the child's diagnosis or treatment and either of the
following is true:
The recommended care oers limited net benet to the child, and the morbidity
or other side eects of the treatment may be greater than the ancipated
benet.

DRAFT Lee County Human Services Gap Analysis
Secon Four: Systems of Care
Chapter 16 | Child Abuse and Neglect, Foster Care, Adoptions Page | 252
The parent or legal guardian received conicng medical recommendaons for
treatment from mulple praconers and did not follow all recommendaons.
Sexual Abuse/Exploitation
Citation: Ann. Stat. § 39.01
“Sexual abuse of a child” means one or more of the following acts:
Any penetraon, however slight, of the vagina or anal opening of one person by
the penis of another person, whether there is the emission of semen.
Any sexual contact between the genitals or anal opening of one person and the
mouth or tongue of another person.
Any intrusion by one person into the genitals or anal opening of another person,
including the use of any object for this purpose, not including any act intended
for a valid medical purpose.
The intenonal touching of the genitals or inmate parts, including the breasts,
genital area, groin, inner thighs and buocks, or the clothing covering them, of
either the child or the perpetrator, not including the following:
An act that may reasonably be construed to be a normal caregiver
responsibility or any interacon with or aecon for a child
An act intended for a valid medical purpose
The intenonal masturbaon of the perpetrator's genitals in the presence of a
child.
The intenonal exposure of the perpetrator's genitals in the presence of a child,
or any other sexual act intenonally perpetrated in the presence of a child, if
such exposure or sexual act is for sexual arousal or gracaon, aggression,
degradaon, or other similar purpose.
The sexual exploitaon of a child, including the following:
A child oering to engage in or engaging in prostuon
Allowing, encouraging, or forcing a child to solicit for or engage in
prostuon, engage in a sexual performance, or parcipate in the trade
of human tracking, as provided in § 787.06(3)(g)
“Harm” to a child can occur when any person:
Commits or allows to be commied sexual baery or lewd or lascivious acts
against the child.
Allows, encourages, or forces the sexual exploitaon of a child, including
engaging in prostuon or a sexual performance.

DRAFT Lee County Human Services Gap Analysis
Secon Four: Systems of Care
Chapter 16 | Child Abuse and Neglect, Foster Care, Adoptions Page | 253
Emotional Abuse
Citaon: Ann. Stat. § 39.01
“Mental injury” means an injury to the intellectual or psychological capacity of a child as
evidenced by a discernible and substantial impairment in the ability to function within
the normal range of performance and behavior.
Abandonment
Citaon: Ann. Stat. § 39.01
“Abandoned” or “abandonment” occurs when the parent or legal custodian of a child
or, in the absence of a parent or legal custodian, the caregiver, while being able, has
made no significant contribution to the child's care and maintenance or has failed to
establish or maintain a substantial and positive relationship with the child.
For purposes of this subsection, 'establish or maintain a substantial and positive
relationship' includes, but is not limited to, frequent and regular contact with the child
through frequent and regular visitation or frequent and regular communication to or
with the child and the exercise of parental rights and responsibilities. Marginal efforts
and incidental or token visits or communications are not sufficient to establish or
maintain a substantial and positive relationship with a child. A man's acknowledgement
of paternity of the child does not limit the period considered in determining whether
the child was abandoned.
The term does not include a surrendered newborn infant, as described in § 383.50; a
“child in need of services”; or a “family in need of services,” as defined in chapter 984.
The incarceration of a parent, legal custodian, or caregiver responsible for a child's
welfare may support a finding of abandonment.

DRAFT Lee County Human Services Gap Analysis
Secon Four: Systems of Care
Chapter 16 | Child Abuse and Neglect, Foster Care, Adoptions Page | 254
Intenonally le blank.

DRAFT Lee County Human Services Gap Analysis
Secon Four: Systems of Care
Chapter 17 | Domestic Violence Page | 255
CHAPTER 17
Domesc Violence/Inmate Partner Violence
Introducon
Violence in the form of physical, emoonal or psychological abuse can occur between
spouses, domesc partners and people in inmate relaonships. In the case of a family
unit, children can be exposed to violence between the parental gures and may also be
abused themselves.
This chapter’s format, like other system-of-care chapters, includes background
informaon, Lee County data, a summary of the system-of-care, gaps and denions.
Context and Background
The following facts reect the magnitude of the problem from a naonal perspecve:
The most common age in which intimate partner violence first occurs is 18- to
24-years-old for both women and men;
More than one in three women (35.6%) and more than one in four men (28.5%)
in the United States have experienced rape, physical violence and/or stalking by
an intimate partner in their lifetime
402
;
An estimated 1.3 million women are victims of physical assault by an intimate
partner each year
403
;
16% of homeless people are victims of domestic violence
404
;
Approximately 50% of all women who are homeless report that domestic
violence was the immediate cause of their homelessness
405
;
85% of domestic violence victims are women
406
;
402
National Intimate Partner and Sexual Violence Survey, 2010 Summary Report. National Center for Injury
Prevention and Control, Division of Violence Prevention, Atlanta, GA, and Control of the Centers for Disease Control
and Prevention.
403
Costs of Intimate Partner Violence Against Women in the United States. 2003. Centers for Disease Control and
Prevention, National Centers for Injury Prevention and Control, Atlanta, GA
404
The U.S. Conference of Mayors 2013 Status Report on Hunger & Homelessness, A 25-City Survey (2013).
405
“Pressing Issues Facing Families Who Are Homeless.” The Naonal Center on Family Homelessness. (2013).
406
Bureau of Justice Statistics Crime Data Brief, Intimate Partner Violence, 1993-2001, February 2003.

DRAFT Lee County Human Services Gap Analysis
Secon Four: Systems of Care
Chapter 17 | Domestic Violence Page | 256
Historically, females have been victimized most often by someone they knew
407
;
Among mothers (with children) who are homelessness, more than 80% had
previously experienced domestic violence
408
;
63% of homeless women have been victims of intimate partner violence as
adults
409
;
33% of homeless women have been victims of severe assault by their current or
most recent intimate partner
410
.
Experts in the field of domestic violence or intimate partner violence argue that
actual rates of abuse are more prevalent than most people realize. There are many
factors contributing to this reality. Some of these factors are related to the
embarrassment victims feel, fear of retribution or additional abuser violence
resulting from disclosure, lack of resources and societal beliefs.
Lee County Data
As shown in Tables 64 and 65, domestic violence rates in Lee County are significantly
lower than the State average. This does not infer that it is not a concern; it is simply
to state a fact.
There are 97 domestic violence shelter beds in Lee County. Between Oct. 1, 2017
and Sept. 30 , 2018, 3,111 domestic violence survivors were served by bed provision,
counseling or crisis response. 2,793 of these were adults and 318 were minors. The
shelter itself served 541 people, of which 274 were adults and 267 were minors.
407
U.S. Department of Justice, Bureau of Justice Statistics, “Criminal Victimization, 2005,” September 2006.
408
Aratani, Y. (2009). “Homeless Children and Youth, Causes and Consequences. Naonal Center for Children in
Poverty.”
409
Browne, A. 1998. "Responding to the Needs of Low Income and Homeless Women Who are Survivors of Family
Violence." Journal of American Medical Women's Associaon. 53(2): 57-64.
410
Browne, A. 1998. "Responding to the Needs of Low Income and Homeless Women Who are Survivors of Family
Violence." Journal of American Medical Women's Associaon. 53(2): 57-64

DRAFT Lee County Human Services Gap Analysis
Secon Four: Systems of Care
Chapter 17 | Domestic Violence Page | 257
Table 64. Domestic Violence in Lee County
Sources
Data Title
Year
Lee
County
State
Comparison to
State
Social and
Mental
Health
Domesc Violence
Oenses 3-Yr Rate
Per 100,000
2015-17
414.8
527.8
Beer
Table 65. Rates of Domestic Violence – Lee County, FDLE Data
Lee County
State
Indicators
Data Year
Number of
Cases
3-Yr Rate
Per 100,000
3-Yr Rate
Per 100,000
Crime and Domesc
Violence
Domesc Violence Oenses
2016-18
8932
424.1
514.3
Domesc Violence Oenses
2013-15
7884
400
548.7
The System-of-Care
The system consists of three service points – a crisis line, counseling services and
shelters. All are provided by Abuse Counseling and Treatment (ACT). More in-depth
services can be provided via behavioral health providers if needed, including
homeless services and child-care.
Gaps
Some of the gaps include:
Public and professional awareness of the signs of domestic violence;
Public understanding about the nature of domestic violence;
Services for children exposed to violence;
Housing, mental health and financial assistance services for women and
children who are homeless due to domestic violence;
Enhanced protection for women at work or in the community.

DRAFT Lee County Human Services Gap Analysis
Secon Four: Systems of Care
Chapter 17 | Domestic Violence Page | 258
Denions
The State of Florida’s definition of domestic violence is:
Citaon: Ann. Stat. § 741.28
“Domestic violence” means any assault, aggravated assault, battery, aggravated
battery, sexual assault, sexual battery, stalking, aggravated stalking, kidnapping,
false imprisonment, or any criminal offense resulting in physical injury or death
of one family or household member by another family or household member.

DRAFT Lee County Human Services Gap Analysis
Secon Four: Systems of Care
Chapter 18 | Elder Abuse, Neglect and Exploitation Page | 259
CHAPTER 18
Elder Abuse, Neglect and Exploitaon
Introducon
This chapter addresses a topic that is likely to grow in signicance as the proporon of
the populaon that is elderly connues to grow naonally and in Lee County. Elder
abuse, neglect or exploitaon is a growing issue because of physical or mental decline,
social isolaon and an increasing diversity of means to defraud. This chapter follows the
format of other chapters with a context secon that provides background, available
data specic to Lee County, a descripon of the available services and a list of exisng
gaps.
Context and Background
This secon provides naonal, state and local informaon and data to help dene the
nature and scope of the issue.
Approximately one in 10 Americans age 60 or older have experienced some form of
elder abuse
411
. It is estimated that only one in 14 cases of abuse are reported
412
;
Elders who have been abused have a 300% higher risk of death
413
;
Nearly 90% of substantiated abuse cases occur at home
414
;
One-third of elder abusers are children of the victim
415
;
Most abusers are either addicted or mentally ill
416
;
Nearly 18,570 seniors in Lee County participated in SNAP (food stamps). 27,375
were eligible for a participation rate of 68%
417
;
411
www.ncoa.org
412
Bonnie. R. et.al. (Eds). 2003. Abuse, Neglect and Exploitation in an Aging America. Washington, DC: National
Academies Press.
413
Dong, X. et.al. 2009. Elder self-neglect and abuse and mortality risk in a community-dwelling population.
Journal of the American Medical Association, 302(5): 517-526.
414
University of Kentucky survey. 2004. National Center on Elder Abuse
415
ibid.
416
Markarian, A. 2014. Brooklyn District Attorney
417
2018 Profile of Older Floridians, FL Department of Elder Affairs
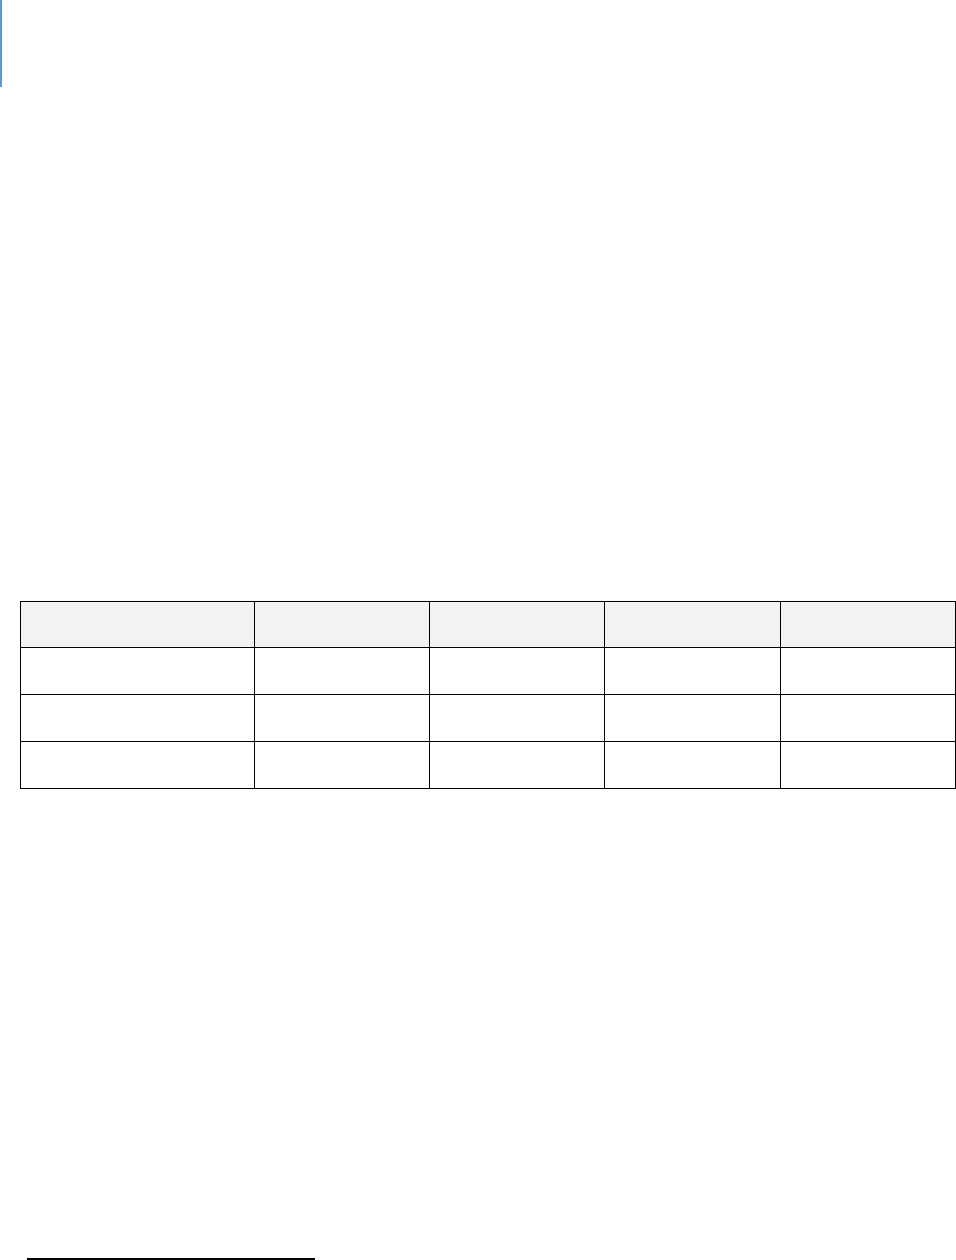
DRAFT Lee County Human Services Gap Analysis
Secon Four: Systems of Care
Chapter 18 | Elder Abuse, Neglect and Exploitation Page | 260
The median income for all county residents was $52,052. For those age 65 and
older, it was $47,128
418
;
12% of seniors (27,375) in Lee County were at or below the 125% of Federal Poverty
Level
419
;
3.7% of Lee County residents are age 85 or older
420
.
Lee County Data
Table 66 shows the changing dependency rao in Lee County over me
421
. The higher
the rao, the greater the proporon of seniors compared to the working age
populaon.
Table 66. Dependency Ratio Over Time
Year
2018
2020
2030
2040
Rao
.43
.44
.52
.53
65+ populaon
182,275
193,556
258,500
292,890
15-64 populaon
420,257
437,873
495,615
553,155
418
2018 profile, op.cit.
419
2018 profile, op.cit.
420
2018 profile, op.cit.
421
2018 profile, op.cit.
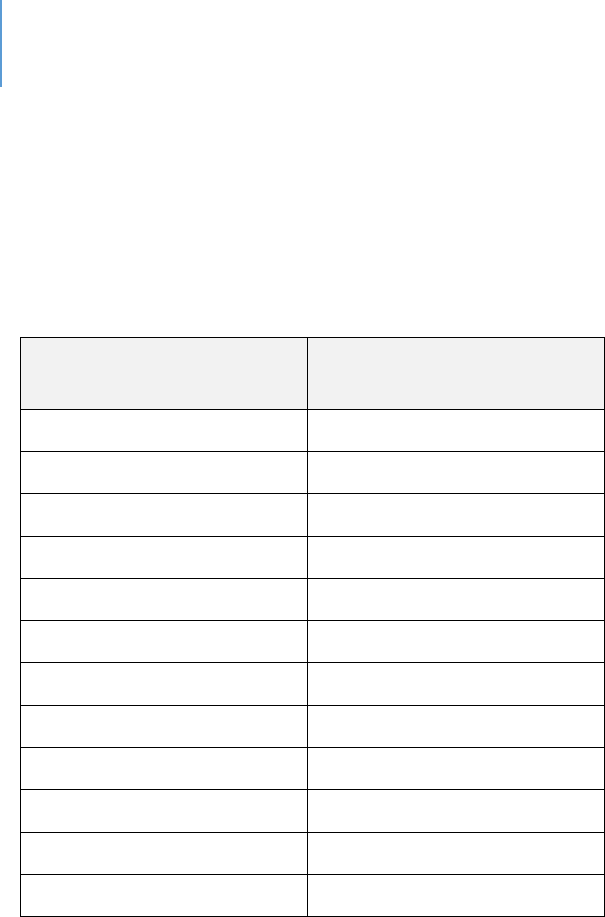
DRAFT Lee County Human Services Gap Analysis
Secon Four: Systems of Care
Chapter 18 | Elder Abuse, Neglect and Exploitation Page | 261
Table 67 shows Elder Abuse Cases per 1,000 in Florida as reported through Adult
Protecve Services, DCF.
Table 67. Elderly Abuse Cases in Florida per 1,000 Persons
Month
Abuse Rate Among Elderly
Persons, per 1,000
Jan 2018
0.10
Feb 2018
0.11
Mar 2018
0.11
Apr 2018
0.12
May 2018
0.13
Jun 2018
0.14
Jul 2018
0.12
Aug 2018
0.14
Sept 2018
0.13
Oct 2018
0.13
Nov 2018
0.11
Dec 2018
0.12
DRAFT Lee County Human Services Gap Analysis
Secon Four: Systems of Care
Chapter 18 | Elder Abuse, Neglect and Exploitation Page | 262
Table 68 reports the number of adult protecon reports for the 20
th
Circuit.
Table 68. Adult Protection Scorecard
422
Department of Children and Families Suncoast Region: 20th Circuit (Lee, Collier, Charlotte,
Hendry, Glades)
Month
Adult Protecon Reports
Received
Jan 2018
246
Feb 2018
217
Mar 2018
255
Apr 2018
221
May 2018
244
Jun 2018
211
Jul 2018
200
Aug 2018
231
Sept 2018
195
Oct 2018
201
Nov 2018
189
Dec 2018
202
2018 TOTAL
2,612
422
https://www.myflfamilies.com/general-information/planning-performance-measures/aps-scorecard.shtml
DRAFT Lee County Human Services Gap Analysis
Secon Four: Systems of Care
Chapter 18 | Elder Abuse, Neglect and Exploitation Page | 263
According to the October 2019 Program Scorecard from the Adult Protective Services
Program Office, the Suncoast Region, which includes Lee County, had 7.5 active
cases per investigator. This was the lowest rate of the six regions. The percent of
total workforce capacity for the Suncoast region was reported at 84.93%. Table 69
reports this data.
Table 69. Adult Protective Investigators Workload
423
Region Indicators
NW
NE
Central
SC
SE
Southern
Average Active Investigations
per API
10.7
13.7
13.8
7.5
14.2
15.5
Percent Total Workforce
Capacity
89.66%
88.37%
100%
84.93%
77.55%
85.19%
Table 70 notes the suicide rate for adults over 60.
Table 70. Suicide Rates Adults 60+
424
Sources
Data Title
Year
Lee
County
State
Comparison to State
Suicide
Deaths
60+
Suicides in
Adults over 60,
per 100,000
2018
19.3
23.7
Lower
2017
19.8
20.9
Within 10% average
2016
17.5
20.8
Lower
423
https://www.myflfamilies.com/general-information/planning-performance-measures/aps/APS%20-
%20October%202019%20Performance.pdf
424
http://www.flhealthcharts.com/charts/DataViewer/DeathViewer/DeathViewer.aspx?indNumber=0116

DRAFT Lee County Human Services Gap Analysis
Secon Four: Systems of Care
Chapter 18 | Elder Abuse, Neglect and Exploitation Page | 264
The System-of-Care in Addressing Elder Abuse, Neglect and Exploitaon in Lee
County
The Florida Department of Elder Aairs is purposed to address the needs and issues of
Florida’s elderly populaon (60 or older). The Department works in conjuncon with
the Department of Children and Families (DCF) Adult Protecve Services and the Aging
Network to protect disabled adults or elderly people from further occurrences of abuse,
neglect or exploitaon. Services provided may include protecve supervision,
placement and in-home and community-based services. There is an abuse hotline (800-
96-ABUSE) for reporng any type of abuse.
In Southwest Florida, the Area Agency on Aging has an Elder Abuse Prevenon Program
that is intended to increase the awareness of elder abuse, neglect and exploitaon.
They provide training classes to seniors and caregivers. The AAASWFL is also the state’s
designated Aging and Disability Resource Center for Southwest Florida providing
informaon and resources for seniors (60 or older) and adults with disabilies. As such,
it also operates the Elder Helpline (866-41-ELDER) and serves as the State’s entry point
for long-term care programs. It also serves as the managing enty for government
funded elder and disability programs. The Lee County lead agency is Friendship
Centers. They provide an adult day program, operate 10 dining sites, provide case
management, health and wellness and in-home care among other services.
The Long-Term Care Ombudsman Program (LTCOP)
425
is a statewide, volunteer-based
system of local units that act as advocates for residents of long-term care
facilies. Through 13 district oces that together cover the enre state, volunteers
work with sta to idenfy, invesgate, and resolve complaints made by, or on behalf of,
residents of nursing homes, assisted living facilies, adult family-care homes, and
connuing care rerement communies. The Southwest Oce serves Sarasota,
DeSoto, Charloe, Glades, Lee, Hendry and Collier Counes. Figure 21 shows acvity
data.
425
hp://elderaairs.state..us/doea/ombudsman_program.php
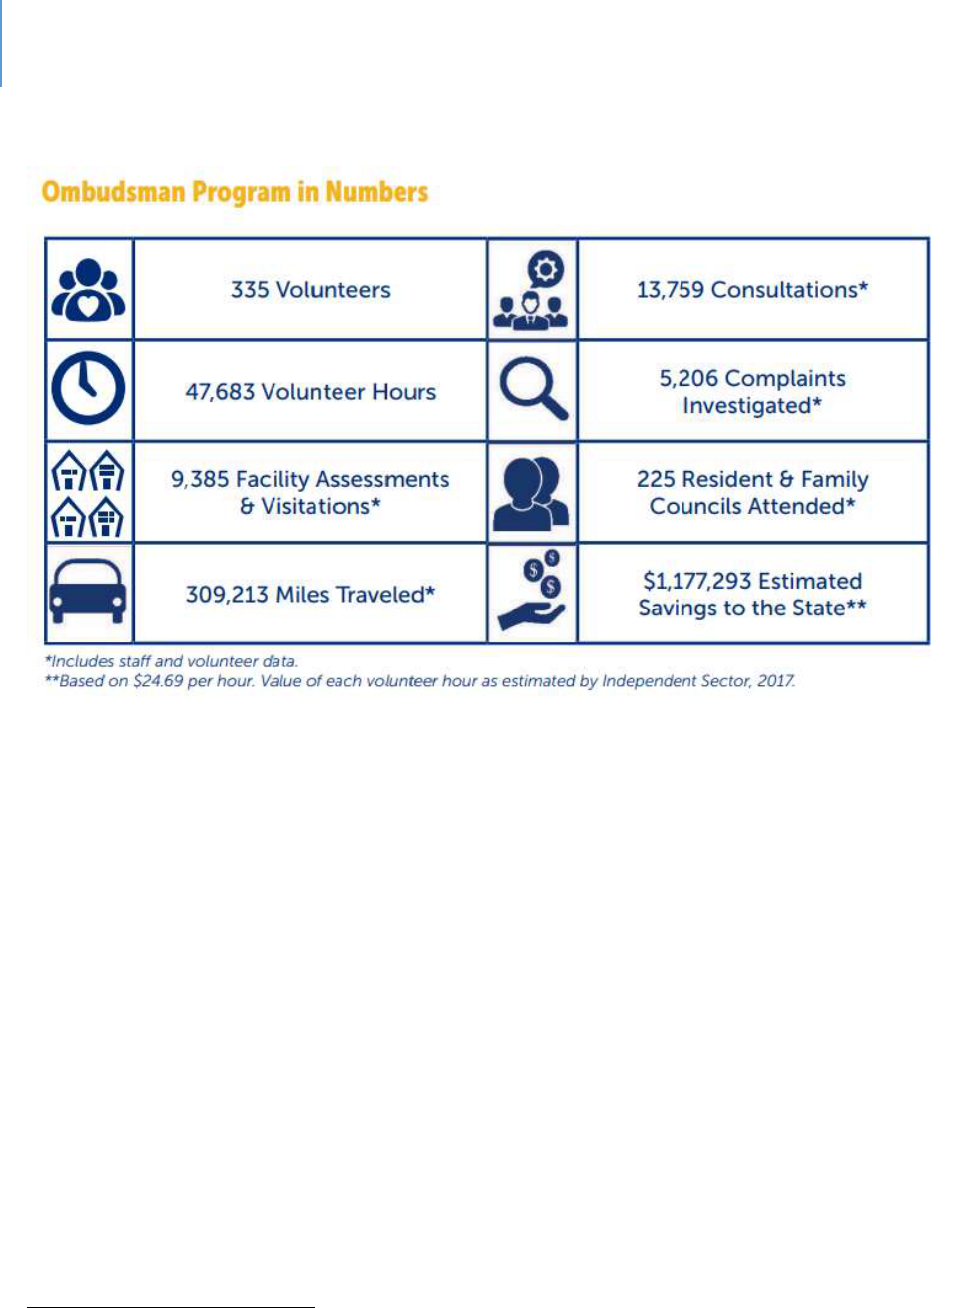
DRAFT Lee County Human Services Gap Analysis
Secon Four: Systems of Care
Chapter 18 | Elder Abuse, Neglect and Exploitation Page | 265
Figure 21. State of Florida Ombudsman 2017-2018 Annual Report
426
In addion to the governmental agencies, there is an acve aorney presence in
lawsuits against nursing homes for neglect or abuse.
Gaps
Experts in the eld of elder abuse note that it is about 20 years behind child abuse and
domesc violence in knowledge and research
427
. For example, data detailing the factors
leading to elder suicide is not as fully available as would be preferred.
Financial exploitaon is a growing issue with the increase in the number of internet or
phone scams targeted at elderly persons. Cognive impairment oen makes those
seniors more vulnerable.
In addion to the internet or phone scams, some seniors also are exploited by family or
426
http://ombudsman.myflorida.com/publications/ar/LTCOP_2017_2018_Annual_Report.pdf
427
Deane, ibid.

DRAFT Lee County Human Services Gap Analysis
Secon Four: Systems of Care
Chapter 18 | Elder Abuse, Neglect and Exploitation Page | 266
caregivers. This in some cases is called nancial abuse.
There are signicant research and data gaps on how to best prevent or intervene in
cases of elder abuse.
428
Denions
Elder abuse may take several forms, which include:
Physical abuse, neglect or mistreatment (i.e. bruises, abrasions, burns);
Emotional/Psychological abuse, frequent arguments between the caregiver and
older adult, unexplained withdrawal from activities. This includes verbal abuse,
belittling and threats;
Sexual abuse;
Financial abuse/Exploitation, misuse of funds, thefts, scams;
Neglect, bedsores, poor hygiene, unusual weight loss.
The Florida legal denion of elder abuse in found in F.S. 825.102 Abuse, aggravated
abuse and neglect of an elderly person or disabled adult; penales. —
(1) “Abuse of an elderly person or disabled adult” means:
(a) Intenonal inicon of physical or psychological injury upon an elderly
person or disabled adult;
(b) An intenonal act that could reasonably be expected to result in physical or
psychological injury to an elderly person or disabled adult; or
(c) Acve encouragement of any person to commit an act that results or could
reasonably be expected to result in physical or psychological injury to an elderly
person or disabled adult.
428
Deane, ibid

DRAFT Lee County Human Services Gap Analysis
Secon Four: Systems of Care
Chapter 18 | Elder Abuse, Neglect and Exploitation Page | 267
What is Adult Abuse?
429
"Abuse" means any willful act or threatened act by a relave, caregiver, or household
member which causes or is likely to cause signicant impairment to a vulnerable adult's
physical, mental or emoonal health. Abuse includes acts and omissions.
Signs of Abuse of the Elderly or People with Disabilies
Abuse may cause various injuries such as scratches, cuts, bruises, burns, broken bones,
or bedsores. It can also result in connement, rape or sexual misconduct and verbal or
psychological abuse.
Neglect may cause starvaon, dehydraon, over- or under-medicaon, unsanitary living
condions, lack of personal hygiene. Neglected adults may also not have heat, running
water, electricity or medical care.
Exploitaon may result in loss of property, money or income. Exploitaon means
misusing the resources of an elderly or disabled person for personal or monetary
benet. This includes taking Social Security or SSI (Supplemental Security Income)
checks, misusing a joint checking account or taking property and other resources.
Somemes the elderly or disabled become isolated or ill and do not have someone who
is willing and able to help meet their basic needs.
What is Adult Neglect?
Neglect means the failure or omission on the part of the caregiver to provide the care,
supervision and services necessary to maintain the physical and mental health of a
429
hps://www.myfamilies.com/service-programs/adult-protecve-services/what-is-adult-abuse.shtml

DRAFT Lee County Human Services Gap Analysis
Secon Four: Systems of Care
Chapter 18 | Elder Abuse, Neglect and Exploitation Page | 268
vulnerable adult, including but not limited to food, clothing, medicine, shelter,
supervision and medical services, which a prudent person would consider essenal for
the wellbeing of a vulnerable adult. The term “neglect” also means the failure of a
caregiver or adult to make a reasonable eort to protect a vulnerable adult from abuse,
neglect or exploitaon by others. “Neglect” is repeated conduct or a single incident of
carelessness, which produces or could reasonably be expected to result in serious
physical or psychological injury, or a substanal risk of death.
What is Adult Exploitaon?
Adult exploitaon means a person who stands in a posion of trust and condence with
a vulnerable adult knowingly, by decepon or inmidaon, obtains or uses, or
endeavors to obtain or use, a vulnerable adult’s funds, assets or property with the
intent to temporarily or permanently deprive a vulnerable adult of the use, benet or
possession of the funds, assets or property for the benet of someone other than the
vulnerable adult.
Or
That a person who knows or should know that the vulnerable adult lacks the capacity to
consent, obtains or uses, or endeavors to obtain or use, the vulnerable adult’s funds,
assets or property with the intent to temporarily or permanently deprive the vulnerable
adult of the use, benet or possession of the funds, assets or property for the benet of
someone other than the vulnerable adult.

DRAFT Lee County Human Services Gap Analysis
Secon Four: Systems of Care
Chapter 19 | Sexual Violence and Stalking Page | 269
CHAPTER 19
Sexual Violence and Stalking (non-partner)
Introducon
This chapter addresses the topic of sexual violence. This can include physical assault
and rape, stalking or other forms of inmidaon or threat. This chapter covers non-
partner violence. Inmate partner violence is addressed in the chapter on domesc
violence.
This chapter has four secons. They are:
Section One: Context and Background. This section provides national, state and
local Lee County data about the scope and status of sexual abuse.
Section Two: The System-of-Care. This section describes the various services and
responsible entities whose mission it is to address this issue.
Section Three: System Gaps. These are gaps in services, current unmet needs and
any potential emerging issues.
Section Four: Definitions. This section provides formal and legal definitions of the
various terms used in the system. It is provided in case the reader desires
clarification on any of these terms, or it may assist in data interpretation.
Context and Background
Over 1 million (1,266,000) women in Florida have been raped at some point in their
lives. That’s 17% or one in six women in Florida
430
;
41.8% of women, or 3,111,000, in Florida have been vicmized by sexual violence
other than rape
431
;
(79.6% of female vicms who have experienced one or more completed rapes,
experienced the rst rape before the age of 25; 42.2% were under 18 at the me of
the rst completed rape
432
;
430
Black, M. et.al. 2011. The National Intimate Partner and Sexual Violence Survey: 2010 Summary Report.
Atlanta, GA: Centers for Disease Control and Prevention.
431
Ibid.
432
ibid

DRAFT Lee County Human Services Gap Analysis
Secon Four: Systems of Care
Chapter 19 | Sexual Violence and Stalking Page | 270
20.4% of men, or 1,437,000, in Florida have been vicmized by sexual violence other
than rape
433
;
27.8% of male vicms who experienced at least one completed rape, experienced
the rst rape when they were 10 years of age or younger
434
;
43% of college women report experiencing abusive dang behaviors including
physical, sexual, via technology, verbal or controlling abuse. The most common
abusive behavior experience is controlling behavior (32%), physical (22%) and sexual
(22%)
435
;
Teens report an even higher occurrence of abusive dang behaviors including
physical, sexual, via technology, verbal or controlling abuse; the most common
abusive behavior experience is controlling behavior (47%), physical/sexual (29%) and
via technology (24%)
436
;
84% of homeless women have experienced severe physical or sexual abuse at some
point in their lives
437
.
Lee County Data
As Tables 71, 72 and 73 show, the rate of rape or forcible sexual offenses in Lee County
is overall lower than the State average. This does not infer that it is not a concern; it is
simply to state a fact.
433
ibid.
434
ibid
435
Fifth & Pacific Companies, Inc. Conducted by Knowledge Networks, (December 2010), “College Dating Violence
and Abuse Poll”.
436
Fifth & Pacific Companies, Inc. and Family Violence Prevention Fund. Conducted by Tru Insight, (June 2009),
“Teen Dating Abuse Report”.
437
Browne, A. 1998. "Responding to the Needs of Low Income and Homeless Women Who are Survivors of
Family Violence." Journal of American Medical Women's Association. 53(2): 57-64.

DRAFT Lee County Human Services Gap Analysis
Secon Four: Systems of Care
Chapter 19 | Sexual Violence and Stalking Page | 271
Table 71. Comparison Data
Sources
Data
Title
Year
Lee
County
State
Comparison to
State
Social and
Mental
Health
438
Rape 3-
Yr Rate
Per
100,000
2015-17
34.3
38.0
Beer
Community
Health Needs
Assessment
439
Violent
Crime
per
100,000
2017
359.2
514.6
Beer
Table 72. Rates of Forcible Sexual Offences in Lee County Compared to the State of Florida
Average, 2018
440
County
Populaon
Rape
by
Force
Aempted
Rape
Forcible
Fondling
Total
Forcible
Sex
Oenses
Oence to
County
Populaon
Rao
Percentage
Lee
713,903
267
9
137
413
1729
0.00057851
Florida
20,840,986
8,105
331
3,471
11,907
1750
0.000571326
Table 73. Rates of Rape and Forcible Sex Offences, FDLE data
Lee County
State
Indicators
Data Year
Number of
Cases
3-Yr Rate
Per 100,000
3-Yr Rate
Per 100,000
Crime and Domesc
Violence
Rape
2016-18
774
36.7
38.8
Rape
2013-15
524
26.6
36.4
Forcible Sex Oenses
2016-18
1173
55.7
54.4
Forcible Sex Oenses
2013-15
817
41.5
52.4
438
Florida Health Charts, Domestic Violence Offenses
http://www.flhealthcharts.com/Charts/OtherIndicators/NonVitalIndNoGrpDataViewer.aspx?cid=0312
439
2017 Community Health Needs Assessment Report; Lee Health and FL Dept of Health in Lee County
440
Florida Department of Law Enforcement. www.fdlw.state.fl.us

DRAFT Lee County Human Services Gap Analysis
Secon Four: Systems of Care
Chapter 19 | Sexual Violence and Stalking Page | 272
The System-of-Care
In addion to Law Enforcement and Judicial System involvement, the System-of-Care in
Lee County for addressing sexual violence consists of two primary service providers, the
Abuse Counseling and Treatment (ACT) Center and the Child Advocacy Center (CAC) in
conjuncon with the Child Protecon Team of the Florida Department of Health. Their
roles are:
ACT does forensic examinations for people over 18, sexual violence forensics for
persons over 18 and domestic violence for under 18;
CAC provides forensic examinations for under 18 and sexual assault assistance
for under 18.
Abuse Counseling and Treatment (ACT).
When a vicm reports a sexual assault to law enforcement, law enforcement will
contact the ACT hotline for a forensic examinaon. The hotline will then call a Cered
SANE (Sexual Assault Nurse Examiner) to respond to the rape crisis center. The Center
will then contact an on-call crisis response counselor. The State of Florida requires
Cered Rape Crisis Centers to respond and provide a forensic examinaon within 1.5
hours of the call.
Everyone will respond to the rape crisis center, which is owned and operated by
ACT. The on-call counselor will rst meet with the vicm to validate feelings, discuss
the examinaon, review the role of law enforcement and detail the services to be
provided. The SANE will then collect medical history and assault informaon. This will
determine what evidence needs to be collected. Pictures are taken of any bruising or
wounds. The on-call counselor will accompany the vicm throughout this process.
Once the exam is completed and all evidence is documented, a chain of custody is
established and evidence collecon is turned over to a law enforcement detecve. All
of this is done only with consent from the vicm.
If a vicm does not want to report or is uncertain whether he/she wants to report to
law enforcement, the same processes are completed and the evidence is stored in a

DRAFT Lee County Human Services Gap Analysis
Secon Four: Systems of Care
Chapter 19 | Sexual Violence and Stalking Page | 273
locked refrigerator for up to one year, per to State Cercaon Guidelines. Clothing
collected that may have DNA on it is stored in a locked cabinet.
If a vicm presents at one of the area hospitals because they have injuries so bad they
cannot come to the center, the hospital will contact the hotline and the on-call SANE
and counselor will respond to the hospital to perform the forensic examinaon and to
oer support.
Evidence is only handled by the SANE. What happens during the exam is always driven
by permission from the vicm and the informaon they have provided. When (if)
evidence is turned over to law enforcement, there is a chain of custody that needs to be
followed. The SANE collecng the evidence would be the one turning over the
evidence and it is only turned over to a detecve, not an ocer.
Evidence can consist of the following:
Blood draw
Urine collection
Swabs for collection of sperm and perpetrator DNA
Swab for victim DNA
Collection of clothing
Photographs of any Injuries
Once the forensic collecon is complete, the vicm has the opportunity to shower and
is given other clothing to wear if her/his clothing has been collected as evidence. The
counselor will set up an appointment for the vicm to come to counseling and they will
also do a follow up phone call to check on her/him before the counseling.
The enre process, from the me the vicm gets to the rape crisis center unl the me
everything is complete, takes about three hours per vicm.
CAC - Child Sexual Abuse
Child sexual abuse cases are generally handled by the Department of Health’s Child
Protecon Teams (CPTs), whose role is to supplement the assessment and protecve
supervision acvies of the Department of Children and Families. Services provided by

DRAFT Lee County Human Services Gap Analysis
Secon Four: Systems of Care
Chapter 19 | Sexual Violence and Stalking Page | 274
CPTs include diagnosc medical evaluaons, medical consultaons, family psychosocial
interviews and forensic interviews.
In Florida, CPTs work closely with Children’s Advocacy Centers (CACs), most of which are
unaliated with FCASV’s cered sexual assault programs. A CAC is a community-
based, child-focused facility in which children who are vicms of abuse or neglect are
interviewed and receive medical exams. If necessary, therapy and other crical services
are provided in a non-threatening and child-friendly environment. A CAC brings
together an array of professionals to work together on the invesgaon, treatment and
prosecuon of child abuse cases. The primary goal of a CAC is to minimize the level of
trauma experienced by child vicms, improve prosecuons and provide ecient and
thorough provision of necessary services to the child vicm and the child's family.
Children's Advocacy Centers provide services such as:
Forensic interviews conducted in a non-threatening, child-friendly environment;
Crisis intervenon and emoonal support for vicms and non-oending family
members;
Counseling for vicms and non-oending family members so that they may begin
to heal from emoonal wounds associated with child abuse;
Medical evaluaons and services;
Muldisciplinary review of cases by a team of professionals, such as law
enforcement ocials, child protecon teams, prosecutors, medical professionals,
mental health professionals, vicm assistance sta and child advocates;
Evidence-based prevenon and intervenon programs to reduce the likelihood of
child maltreatment and to provide safe and caring homes for children;
Professional training and community educaon to eecvely respond to child
abuse;
Sexual assault assistance for people under 18.
Gaps
For adults, there are no signicant gaps in the service system.
For children, the following are the most signicant gaps:

DRAFT Lee County Human Services Gap Analysis
Secon Four: Systems of Care
Chapter 19 | Sexual Violence and Stalking Page | 275
Provision of evidence-based therapies. These therapeutic options are not
available in the County.
In-home and after-care services. There is a need for increased in-home services.
External to the systems themselves, the most signicant gaps are:
Public perception, personal shame and a lack of willingness to report;
Public education pertaining to a lack of understanding of what constitutes sexual
assault.
Denions
The Florida Uniform Crime Reports program denes “Rape” as the penetraon, no
maer how slight, of the vagina or anus with any body part or object, or oral
penetraon by a sex organ of another person or object, without the consent of the
vicm. This denion includes either gender of vicm or oender, and instances where
the vicm is incapable of giving consent because of temporary or permanent mental or
physical incapacity (including due to the inuence of drugs or alcohol) or because of
age. Physical resistance is not required on the part of the vicm to demonstrate lack of
consent. Aempts to commit rape are also included.
The Florida Uniform Crime Reports program denes “Forcible Sex Oenses” as any
sexual act directed against another person, forcibly and/or against that person's will, or
not forcibly or against the person's will, where the vicm is incapable of giving
consent. The element of force or threat of force is necessary (unless the vicm is
unable or too young to give consent) before a sexual oense is reported in this
category. Any sexual act or aempt involving force is classied as a forcible sex oense
regardless of the age of the vicm or the relaonship of the vicm to the oender. The
“Forcible Sex Oense” category includes oenses classied as “Rape” and “Fondling”.

DRAFT Lee County Human Services Gap Analysis
Secon Four: Systems of Care
Chapter 19 | Sexual Violence and Stalking Page | 276
Intenonally le blank.

DRAFT Lee County Human Services Gap Analysis
Secon Four: Systems of Care
Chapter 20 | Trauma and Effects of Violence Exposure Page | 277
CHAPTER 20
Trauma and Effects of Violence Exposure
Introduction
In recent years, the effects of exposure to violence have become better understood. No
matter the age of the person, violence exposure can lead to varying levels of trauma.
Trauma can have both physiological and psychological impacts, both short- and long-
term.
The more formal Systems of Care all face trauma in some way, whether it is domestic
violence, child abuse, people with PTSD, elder abuse, sexual abuse, etc. There is no
separate system addressing exposure to violence, and there shouldn’t be, as the
dynamics underlying violence exposure can be diverse. The purpose of this chapter is to
emphasize the seriousness and scope of the issue so that it can be considered in the
overall human services system.
In addition to people who are victims of violence, there is a better understanding of who
are exposed to violence. In combat, this is called post-traumatic stress disorder.
However, there are other people who are also exposed to violence. This includes first
responders, the professionals and para-professionals who work with victims of child
abuse, domestic violence, elder abuse, rape, etc.
This chapter follows the format of other Systems of Care chapters with a Context
Section, Lee County Data Section, System-of-Care Description and Gap Analysis.

DRAFT Lee County Human Services Gap Analysis
Secon Four: Systems of Care
Chapter 20 | Trauma and Effects of Violence Exposure Page | 278
Context and Background
Victims
The following facts illustrate the scope and impacts of trauma:
Children exposed to various forms of trauma have more attachment and behavior
disorders
441
and are at greater risk for alcohol and substance abuse disorders;
442
Trauma exposure is related to anti-social behavior;
443
Post-Traumatic Stress Disorder is related to exposure to violence and
maltreatment;
444
Depression is related to violence exposure;
445
Anxiety is related to violence exposure;
446
Suicidal ideation is higher for people exposed to various forms of violence or
trauma;
447
Exposure to trauma and self-injurious behaviors are related;
448
One study found that 73.9% of females in jail or prison and 86.1% of males in jail or
prison had experienced physical or sexual abuse.
449
Another study found 56% of
male inmates had experienced childhood physical trauma and 25% had experienced
emotional abuse, particularly abandonment.
450
441
Grayson, J. 2006. Maltreatment and its effects on early brain development. Virginia Child Protection Newsletter,
77:1-16
442
Bellis, M. et.al. 2014. The biological effects of childhood trauma. Child Adolesc Psychiatr Clin N Am. 23(2): 185-
222.
443
Lansford, J. et.al. 2002. A 12-year prospective study of the long-term effects of early child physical
maltreatment on psychological, behavioral, and academic problems in adolescence. Archives of Pediatrics &
Adolescent Medicine., 156(8)), 824-830.
444
Ibid.
445
Trickett, P. et.al. 2011. The impact of sexual abuse on female development: Lessons from a multigenerational,
longitudinal research study. Development and Psychopathology, 23(2) 453-476.
446
Ibid.
447
Duke, N. et.al. 2010. Adolescent violence perpetration: Association with multiple types of adverse childhood
experiences. Pediatrics, 125(4), 778-786.
448
Ibid.
449
Pinas, D. The sequential intercept model as a framework. SAMSHA Center for Behavioral Health and Justice
Transformation.
450
Wolf, N. & Shi, J. 2012. Childhood and adult trauma experiences of incarcerated persons and their relationship
to adult behavioral health problems and treatment. Int. J Environ Res Public Health. 9(5): 1908-1926.

DRAFT Lee County Human Services Gap Analysis
Secon Four: Systems of Care
Chapter 20 | Trauma and Effects of Violence Exposure Page | 279
Many researchers have concluded that some children who witness or are victims of
domestic violence experience a profound and lasting impact on their lives and hopes
for the future. “A child’s developing brain can mistakenly encode the violence,” says
Children of Domestic Violence
451
, adding that kids can grow up believing that
violence is normal and that they are to blame for it. Studies that support this
conclusion provide the following information:
By age 12, 83% of homeless children have been exposed to at least one serious
violent event and nearly 25% have witnessed acts of violence within their families;
452
30% to 60% of perpetrators of intimate partner violence also abuse children in the
household;
453
The single best predictor of children becoming either perpetrators or victims of
domestic violence later in life is whether they grow up in a home where there is
domestic violence. Studies from various countries support the findings that rates of
abuse are higher among women whose husbands were abused as children or who
saw their mothers being abused;
454
Boys who witness domestic violence are twice as likely to abuse their own partners
and children when they become adults;
455
Teens that have witnessed violence within their own family are 50% more likely to
be involved in an abusive relationship themselves;
456
Violent relationships in formative years can have serious ramifications by putting the
victims at higher risk for substance abuse, eating disorders, risky sexual behaviors
and further domestic violence;
457
Per person costs from the ages of 20 to 64 because of being exposed to domestic
violence as a child is $50,000. These costs include healthcare spending ($11,000),
451
https://www.domesticshelters.org/articles/statistics/children-and-domestic-violence
452
Bassuk, E.L., Weinreb, L.F., Buckner, J.C., Browne, A., Salomon, A., & Bassuk, S.S. (1996). “The
characteristics and needs of sheltered homeless and low-income housed mothers.” Journal of the American
Medical Association, 276, 640-646.
453
Edelson, J.L. (1999). “The Overlap Between Child Maltreatment and Woman Battering.” Violence Against
Women. 5:134-154
454
“Behind Closed Doors: The Impact of Domestic Violence on Children.” UNICEF, Child Protection Section and
The Body Shop International (2006).
455
Strauss, Gelles, and Smith, “Physical Violence in American Families: Risk Factors and Adaptations to
Violence” in 8,145 Families
456
Fih & Pacic Companies, Inc. and Family Violence Prevenon Fund
456
. Conducted by Tru Insight, (June 2009),
“Teen Dang Abuse Report”.
457
Decker M, Silverman J, Raj A, 2005. Dang Violence and Sexually Transmied Disease/HIV Tesng and
Diagnosis Among Adolescent Females. Pediatrics. 116: 272-276.

DRAFT Lee County Human Services Gap Analysis
Secon Four: Systems of Care
Chapter 20 | Trauma and Effects of Violence Exposure Page | 280
criminal behavior ($14,000), and loss of labor market productivity ($26,000).
Applied to the entire nation, the economic burden is more than $55 billion.
458
Persons Working with Victims
The effects of exposure to violence or traumatic events not only affects those generally
considered to be victims, it also affects others. First responders, police officers, or
firefighters/EMS professionals may be regularly exposed to violence, physical harm,
natural disasters, or other types of traumatic events. It is estimated that 30% of first
responders develop behavioral health conditions as compared to 20% in the general
population.
459
69% of EMS professionals have never had enough time to recover
between traumatic events.
460
professionals or paraprofessionals who provide counseling or other clinical services to
persons experiencing trauma can experience what is termed “secondary exposure” or
“vicarious trauma.”
461
These people may manifest symptoms such as those associated
with Post-Traumatic Stress Disorder (PTSD). These experiences also lead to “burn-
out.”
462
It should be noted that the interaction does not have to be face-to-face.
Telephone interactions can lead to vicarious trauma.
463
A study of 911 operators, for
example, found a link to PTSD based on their indirect exposure to trauma.
464
458
Holmes, M.R., Richter, F.G.C., Votruba, M.E. et al (2018). "Economic Burden of Child Exposure to Intimate
Partner Violence in the U.S." Journal of Family Violence.
459
Abbot, C. et.al. 2015. What’s killing our medics? Ambulance Service Manager Program, Conifer, CO: Reviving
Responders. Retrieved from www.revivingresponders.com/orginalpaper.
460
Bentley, M. A., Crawford, J. M., Wilkins, J. R., Fernandez, A. R., & Studnek, J. R. (2013). An assessment of
depression, anxiety, and stress among nationally certified EMS professionals. Prehospital Emergency Care, 17(3),
330–338. https://doi.org/10.3109/10903127.2012.761307
461
Diehm, R., et.al. 2015. The impact of secondary exposure to trauma on mental health professionals. InPscyh.
37(1). www.psychology.org.au.
462
Craig, C., & Sprang, G. (2010). Compassion sasfacon, compassion fague, and burnout in a naonal sample
of trauma treatment therapists. Anxiety, Stress, and Coping, 23(3), 319-339.
463
Dunkley, J., & Whelan, T. (2006). Vicarious traumasaon in telephone counsellors: internal and external
inuences. Brish Journal of Guidance and Counselling, 4, 451- 469.
464
Muller, R. 2017. Trauma exposure linked to PTSD in 911 Dispatchers. www.psychologytoday.com.
DRAFT Lee County Human Services Gap Analysis
Secon Four: Systems of Care
Chapter 20 | Trauma and Effects of Violence Exposure Page | 281
Lee County Data
Trauma is associated with various forms of violence and abusive behavior. As noted,
childhood abuse and trauma are associated with various problems in adulthood. Table
74 summarizes available data on Child Abuse and Neglect Indicators in Lee County.
Table 74. Child Abuse and Neglect Indicators in Lee County
Sources
Data Title
Year
Lee County
State
Comparison
to State
MyFLFamilies.com
465
Children Entering Care Who
Achieve Permanency within
12 Months
2018
43.2%
41.4%
Within 10%
average
2019
44.7%
40.2%
Better
MyFLFamilies.com
Chart - Abuse during In-Home
Services (% of Children Not
Abused) (Average State Fiscal
Year)
2018
94.4%
94%
Within 10%
average
2019
94.2%
94.7%
Within 10%
average
MyFLFamilies.com
Chart - Children with No
Recurrence of Verified
Maltreatment w/in 12
Months (Average State Fiscal
Year)
2018
91.3%
91.9%
Within 10%
average
2019
92.9%
92.4%
Within 10%
average
MyFLFamilies.com
Chart - Young Adults Aging
out who did not Perpetrate
Abuse by their 25th Birthday
2019 Q1
84.21%
87.35%
Within 10%
average
2018 Q1
82.35%
88.34%
Within 10%
average
MyFLFamilies.com
Chart - Removal Rate per 100
Alleged Victims
2018
5.2
5.2
Same
School Age Child
Adolescent Profile
466
Children Experiencing Child
Abuse Ages 5-11 per 100,000
2015-17
850.4
932.8
Better
2016-18
863.2
855.3
Within 10%
average
School Age Child
Adolescent Profile
Children in foster care ages 5-
11 Per 100,000
2017
563.4
413.7
Worse
2018
571.3
455.7
Worse
2017
481.8
410.6
Worse
465
Florida Department of Children and Families, Child Welfare Statistics Dashboard
https://myflfamilies.com/programs/childwelfare/dashboard/
466
Florida Health Charts,
School-aged Child and Adolescent Profile
http://www.flhealthcharts.com/ChartsReports/rdPage.aspx?rdReport=ChartsProfiles.School-
agedChildandAdolProfile
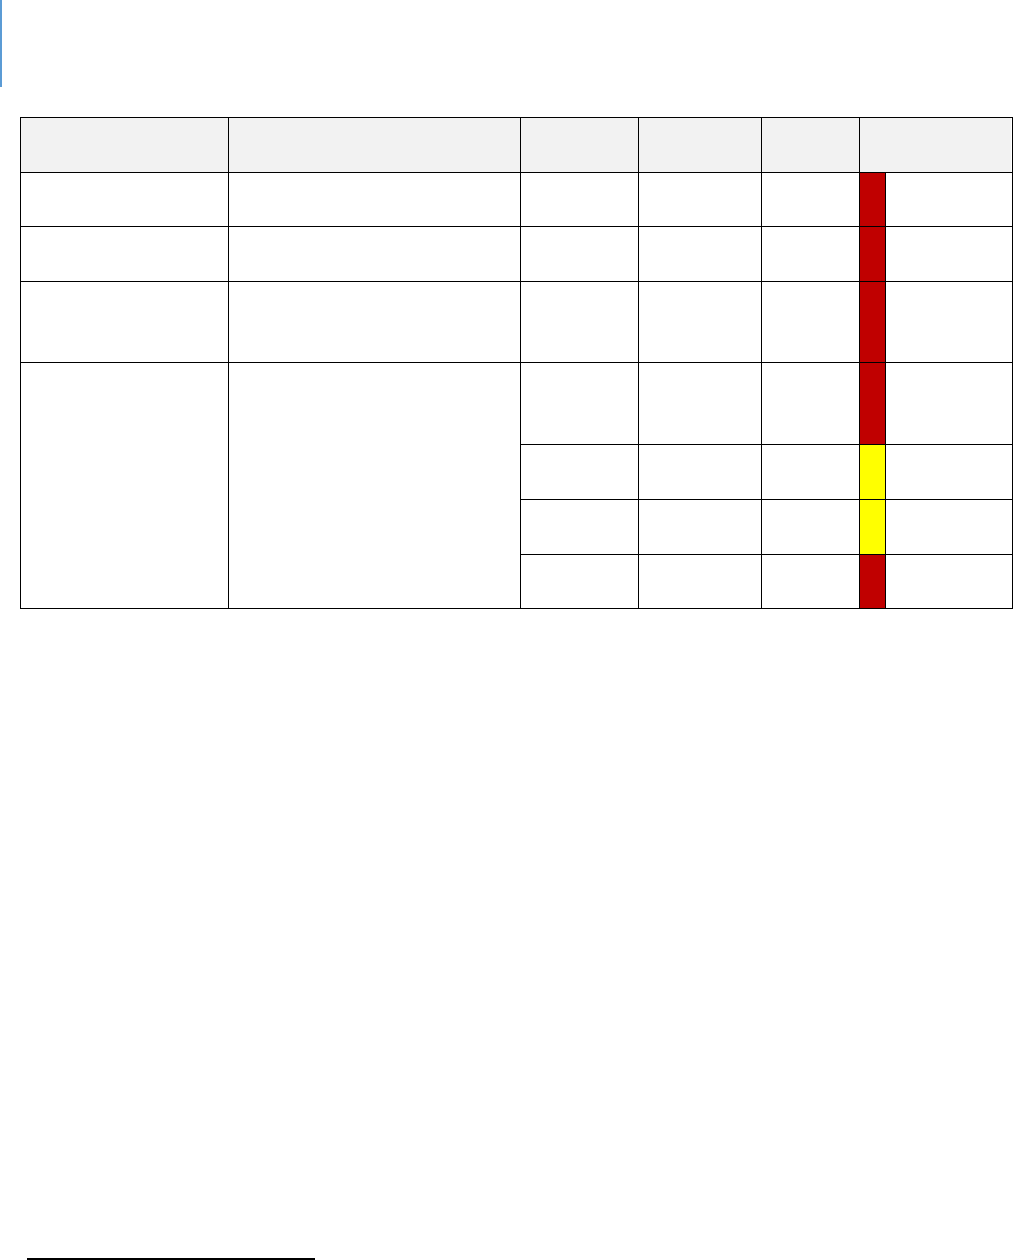
DRAFT Lee County Human Services Gap Analysis
Secon Four: Systems of Care
Chapter 20 | Trauma and Effects of Violence Exposure Page | 282
Sources
Data Title
Year
Lee County
State
Comparison
to State
School Age Child
Adolescent Profile
Children in foster care ages
12-17 Per 100,000
2018
511.8
362.4
Worse
Child Health
Status
467
Children under 18 in Foster
Care Per 100,000 population
2017
708.3
537.7
Worse
Child Health
Status
468
Children Experiencing Sexual
Violence Ages 5-11 per
100,000 population
2015-17
73.5
59.8
Worse
MyFLFamilies.com
Removal Rate per 100 Alleged
Victims for Investigation
Closed by Quarter
(County group is a region that
includes – Lee, Collier,
Charlotte, Hendry and Glades
counties)
Oct – Dec
2018
(Quarter)
5.6
4.8
Worse
Jan – Mar
2019
5.03
5.17
Within 10%
average
April –
June 2019
5.23
4.8
Within 10%
average
July – Sept
2019
7.27
5.78
Worse
467
Child Health Status
http://www.flhealthcharts.com/ChartsReports/rdPage.aspx?rdReport=ChartsProfiles.ChildHealthStatusProfile
468
Florida Health Charts, Children Experiencing Sexual Violence ages 5-11
http://www.flhealthcharts.com/charts/OtherIndicators/NonVitalIndNoGrpDataViewer.aspx?cid=0561
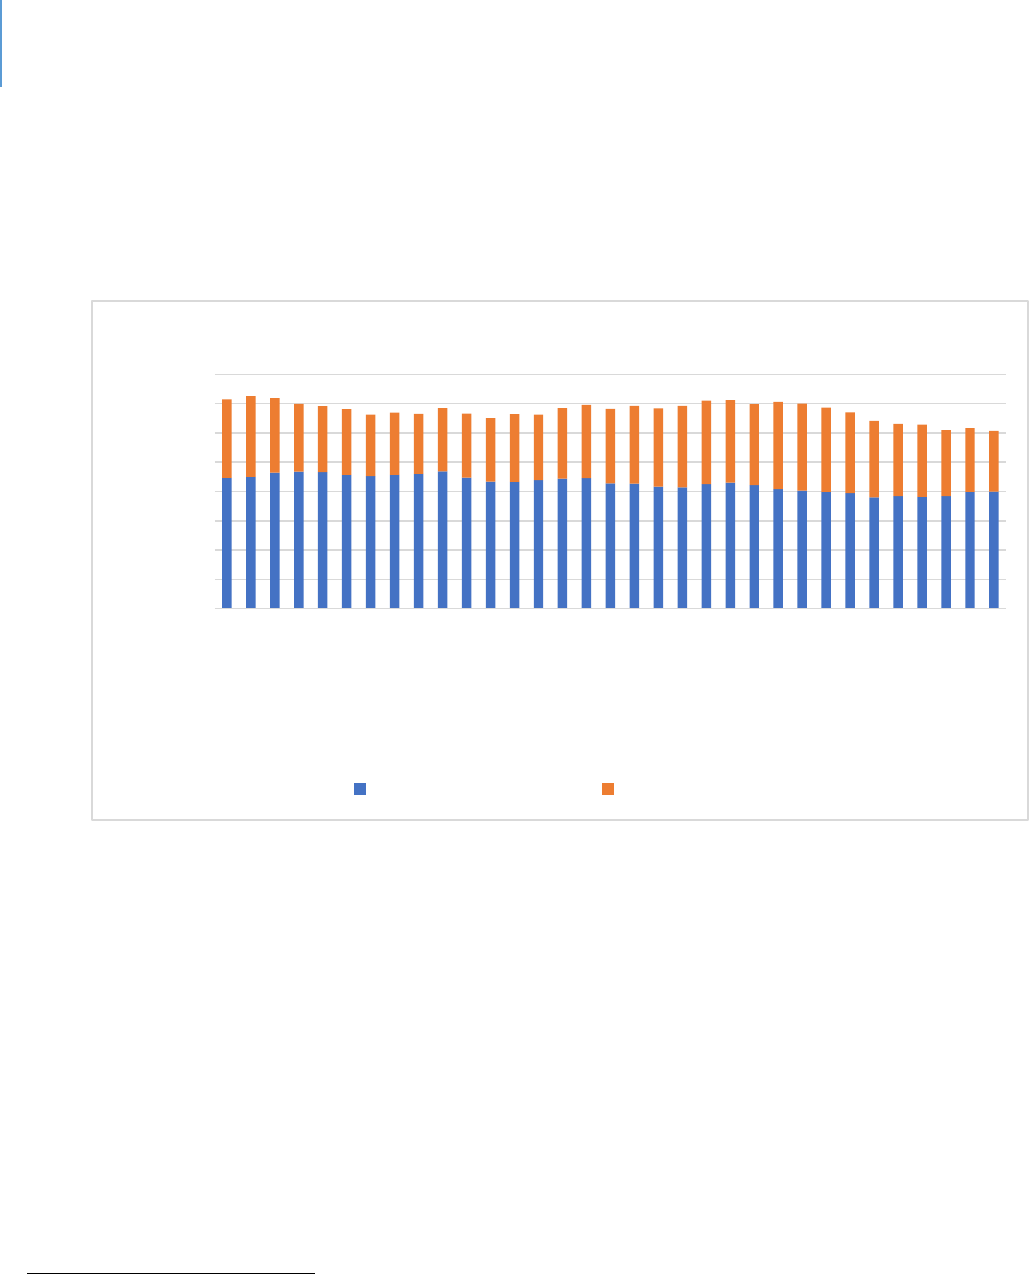
DRAFT Lee County Human Services Gap Analysis
Secon Four: Systems of Care
Chapter 20 | Trauma and Effects of Violence Exposure Page | 283
Figure 22 shows the number of children receiving some form of DCF services in Lee
County. While this does not mean each child has experienced severe trauma, there has
been at least some disruption in their life.
Figure 22. Children and Young Adults Receiving DCF Services in Lee County
469
469
469
https://www.myflfamilies.com/programs/childwelfare/dashboard/cya-inhome.shtml
https://www.myflfamilies.com/programs/childwelfare/dashboard/c-in-ooh.shtml
0
200
400
600
800
1000
1200
1400
1600
Jan 2017
Mar 2017
May 2017
Jul 2017
Sep 2017
Nov 2017
Jan 2018
Mar 2018
May 2018
Jul 2018
Sep 2018
Nov 2018
Jan 2019
Mar 2019
May 2019
Jul 2019
Sep 2019
Count
Month
Children and Young Adults Receiving DCF Services in Lee County
Out-of-Home Services In-Home Services
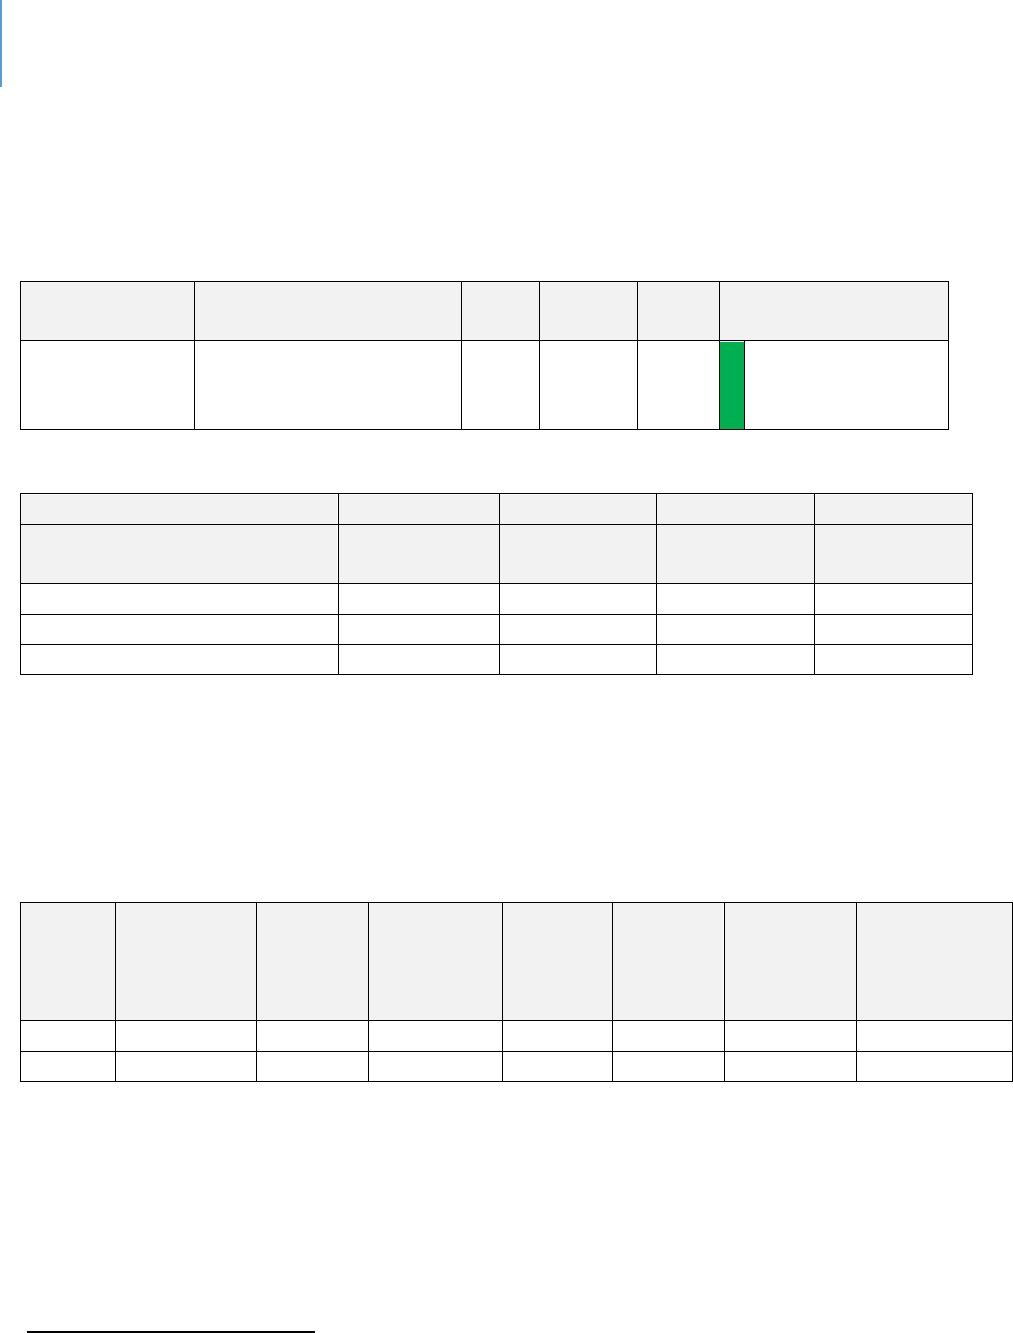
DRAFT Lee County Human Services Gap Analysis
Secon Four: Systems of Care
Chapter 20 | Trauma and Effects of Violence Exposure Page | 284
Tables 75 and 76 report on domestic violence in Lee County. The experience of
domestic violence is a traumatic one for the victim and for children, if involved.
Table 75. Domestic Violence in Lee County
Sources
Data Title
Year
Lee
County
State
Comparison to State
Social and
Mental Health
Domestic Violence
Offenses 3-Yr Rate Per
100,000
2015-
17
414.8
527.8
Better
Table 76. Rates of Domestic Violence – Lee County, FDLE Data
Lee County
State
Indicators
Data Year
Number of
Cases
3-Yr Rate Per
100,000
3-Yr Rate Per
100,000
Crime and Domestic Violence
Domestic Violence Offenses
2016-18
8932
424.1
514.3
Domestic Violence Offenses
2013-15
7884
400
548.7
Tables 77, 78 and 79 present data on other forms of trauma: Rape, Forcible Sexual
Offences and Violent Crime.
Table 77. Rates of Forcible Sexual Offences in Lee County Compared to the State of Florida
Average, 2018
470
County
Population
Rape by
Force
Attempted
Rape
Forcible
Fondling
Total
Forcible
Sex
Offenses
Offence to
County
Population
Ratio
Percentage
Lee
713,903
267
9
137
413
1729
0.00057851
Florida
20,840,986
8,105
331
3,471
11,907
1750
0.000571326
470
Florida Department of Law Enforcement. www.fdlw.state.fl.us

DRAFT Lee County Human Services Gap Analysis
Secon Four: Systems of Care
Chapter 20 | Trauma and Effects of Violence Exposure Page | 285
Table 78. Rates of Rape and Forcible Sex Offences, FDLE Data
Lee County
State
Indicators
Data Year
Number of
Cases
3-Yr Rate Per
100,000
3-Yr Rate Per
100,000
Crime and Domestic Violence
Rape
2016-18
774
36.7
38.8
Rape
2013-15
524
26.6
36.4
Forcible Sex Offenses
2016-18
1173
55.7
54.4
Forcible Sex Offenses
2013-15
817
41.5
52.4
Table 79. Comparative Data on Rape and Violent Crime
Sources
Data Title
Year
Lee
County
State
Comparison to
State
Social and
Mental
Health
471
Rape 3-Yr
Rate Per
100,000
2015-17
34.3
38.0
Better
Community
Health Needs
Assessment
472
Violent
Crime per
100,000
2017
359.2
514.6
Better
471
Florida Health Charts, Domestic Violence Offenses
http://www.flhealthcharts.com/Charts/OtherIndicators/NonVitalIndNoGrpDataViewer.aspx?cid=0312
472
2017 Community Health Needs Assessment Report; Lee Health and FL Dept. of Health in Lee County
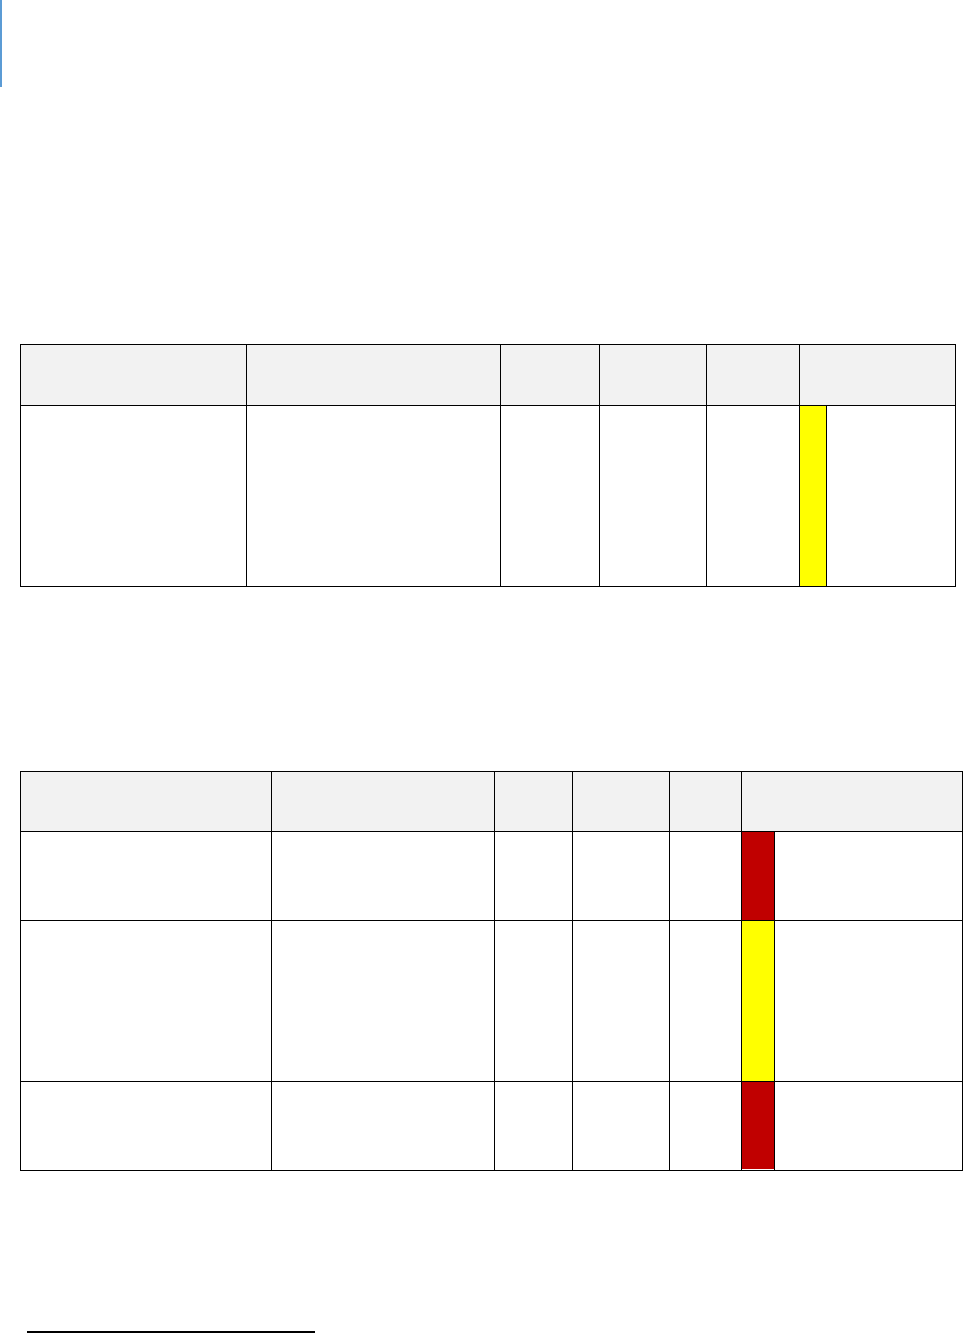
DRAFT Lee County Human Services Gap Analysis
Secon Four: Systems of Care
Chapter 20 | Trauma and Effects of Violence Exposure Page | 286
As the context discussion indicated, abused children are at greater risk of becoming an
adult abuser. Table 80 reports the one data source that indicates these behaviors are as
likely to occur in Lee County as they are elsewhere in the State.
Table 80. Young Adults Aging Out of Out-of-Home Care who did not Perpetrate Abuse by their
25th Birthday by County
Sources
Data Title
Year
Lee
County
State
Comparison
to State
MyFLFamilies.com
473
Young Adults Aging out
who did not Perpetrate
Abuse by their 25th
Birthday
2014-
19
84.21%
86.85%
Within
10%
average
As the context discussion indicated, people experiencing severe trauma are at greater risk of
suicide. Table 81 presents data on suicide in Lee County.
Table 81. Suicide Rates in Lee County, FL
Sources
Data Title
Year
Lee
County
State
Comparison to State
Community Health
Needs Assessment
Suicide (age
adjusted death rate)
per 100,000
2017
16.9
14
Worse
County Death Data
Comparison
Suicide Age
Adjusted Death Rate
Per 100,000 Total
Population
2107
14.3
14.1
Within 10%
average
Child Health Status
Suicide death rate,
ages 19-21 Per
100,000 population
2015-
17
16.1
12.6
Worse
473
https://myflfamilies.com/programs/childwelfare/dashboard/aging-out-abuse.shtml

DRAFT Lee County Human Services Gap Analysis
Secon Four: Systems of Care
Chapter 20 | Trauma and Effects of Violence Exposure Page | 287
System-of-Care
The following entities form the system-of-care for addressing exposure to violence in
Lee County.
Children’s Advocacy Center (CAC). A CAC is a community-based, child-focused facility in
which children who are victims of abuse or neglect are interviewed and receive medical
exams. If necessary, therapy and other critical services are provided in a non-
threatening and child friendly environment. A CAC brings together an array of
professionals to work together on the investigation, treatment and prosecution of child
abuse cases. The primary goal of a CAC is to minimize the level of trauma experienced
by child victims, improve prosecutions and provide efficient and thorough provision of
necessary services to the child victim and the child's family.
The Behavioral Health Providers. Each behavioral health provider offers therapies that
can address trauma issues.
Veterans Administration. The VA offers a variety of counseling and assistance services
for Veterans with PTSD and other forms of trauma.
Abuse and Counseling Treatment (ACT). ACT offers counseling and therapeutic services
for people experiencing domestic violence, intimate partner violence, or sexual or
physical assault.
Best Practices. The following are considered best practices and are being used in Lee
County:
Child-Parent Psychotherapy (ages 0 to 5)
474
Parent-Child Interaction Therapy (2 to 7)
475
Eye Movement and Desensitization and Reprocessing (2 to 17)
476
Trauma-Focused Cognitive Behavioral Therapy (3 to 18)
477
Problematic Sexual Behavior – Cognitive Behavior Therapy (3 to 14)
478
474
www.childparentpsychotherapy.com
475
www.pcit.org
476
www.emdr.com
477
www.tfcbt.org
478
www.psbcbt_ouhsc.edu

DRAFT Lee County Human Services Gap Analysis
Secon Four: Systems of Care
Chapter 20 | Trauma and Effects of Violence Exposure Page | 288
Alternative for Families: A Cognitive Behavioral Therapy (5 to 17)
479
Child and Family Trauma Stress Intervention (7 to 18)
480
Gaps
The following are the most significant gaps.
Gaps identified in the chapters on domestic violence, child abuse, elder abuse
and sexual violence apply here but will not be repeated.
In-home services need to be increased.
A better understanding of trauma is needed by related professionals who
periodically interact with people experiencing trauma. This includes an
understanding of trauma, the indicators of trauma and the effective
interventions to working with trauma victims.
A better understanding of trauma experienced by professionals and technicians
who work with victims, whose work exposes them to either violent acts, severe
bodily injuries, non-natural deaths, natural disasters, or other forms of extreme
negative events and behaviors is needed.
479
www.afcbt.org
480
www.medicineyale.edu/childstudy/communitypartnerships/cvtc/cftsi

DRAFT Lee County Human Services Gap Analysis
Secon Four: Systems of Care
Chapter 21 | Suicide and Self-harm Page | 289
CHAPTER 21
Suicide and Self-harm
Introduction
Rates of suicide have increased to a point at which there is increased policy attention.
The Florida Association of Counties (FAC) is currently conducting a survey to determine
what efforts are underway to prevent suicide. FAC is asking for information in three
areas specifically:
Funded mental health services that are aimed at preventing suicide;
Local ordinances aimed at reducing access to lethal means, such as storage of
medicines or firearms;
Infrastructure improvements aimed at reducing the use of common suicide locations
such as places with heights or railroad tracks. These improvements may limit access,
erect barriers or add signage encouraging help.
Context and Background
Nationally, the suicide rate increased 25.4% from 1999 to 2016, with increases occurring
in every state, save for Nevada. Between 2001 through 2017, the rate increased 31%.
481
In 2017, there were an estimated 1.4 million suicide attempts and more than 47,000
deaths by suicide, making it the 10
th
leading cause of death in the United States.
Firearms were involved in half of all suicides, and there were more than twice as many
deaths by suicide than by homicide.
482
Between 2000 and 2007, the suicide rate among youth ages 10 to 24 hovered around
6.8 deaths per 100,000 people. Then, the rate curved upward, reaching a rate of 10.6
deaths per 100,000 by 2017 — a 56% increase in less than two decades.
483
Based on
the 2017 Youth Risk Behaviors Survey, 7.4% of youth in grades 9 to 12 reported that
they had made at least one suicide attempt in the past 12 months. Female students
481
Suicide rates. National Institute of Mental Health
482
Suicide. 2019. Annual Report. www.americashealthrankings.org
483
Santhanam, L. 2019. Youth suicide rates are on the rise in the U.S. October 18. www.pbr.org
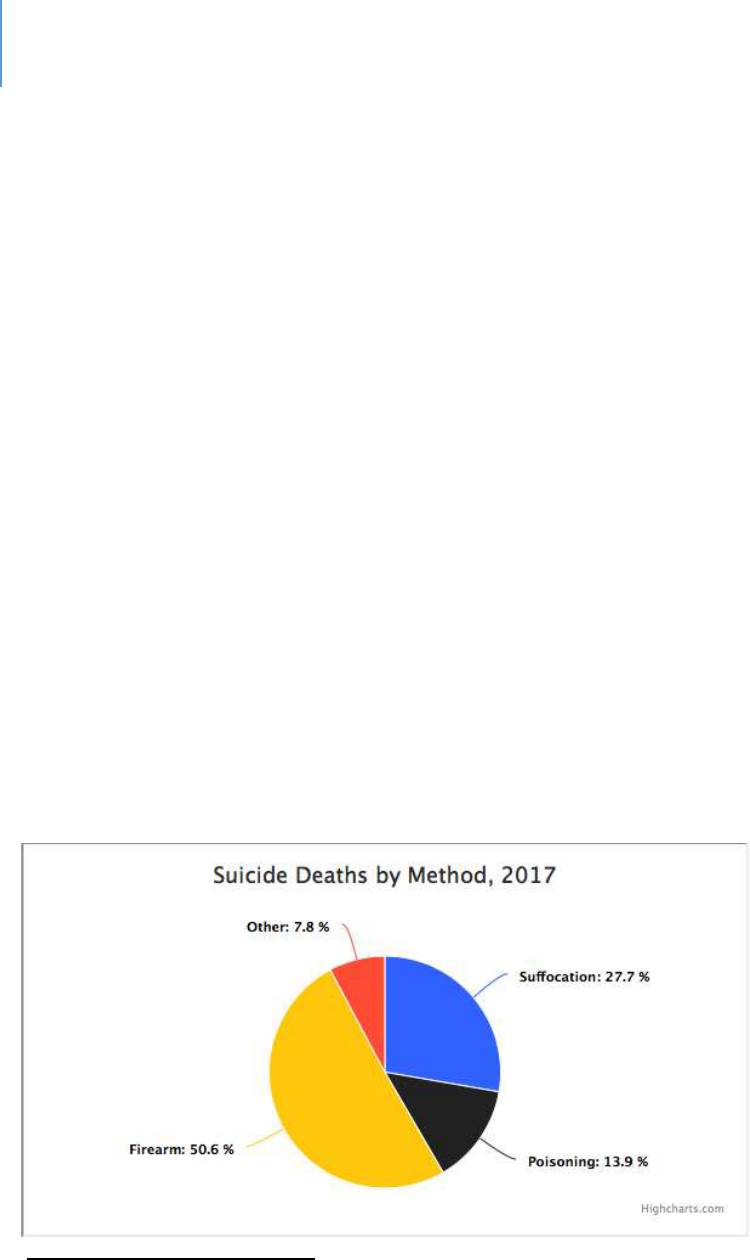
DRAFT Lee County Human Services Gap Analysis
Secon Four: Systems of Care
Chapter 21 | Suicide and Self-harm Page | 290
attempted almost twice as often as male students (9.3% vs. 5.1%). Black students
reported the highest rate of attempt at 9.8% with white students at 6.1%.
Approximately 2.4% of all students reported making a suicide attempt that required
treatment by a doctor or nurse.
484
Societal costs associated with suicide were estimated at $70 billion. These costs include
lifetime medical fees and lost work costs
485
.
Populations with disproportionately high suicide rates include:
486
Males compared with females.
American Indian/Alaska Native and white adults. Suicide rates among Hispanic,
black and Asian/Pacific Islander adults are at least two times lower than rates
among American Indian/Alaska Native and white adults among both genders.
Older adults: By age and gender, the highest suicide rate is among males ages 65
and older, followed by males ages 45 to 54. Among females, those ages 45 to 54
had the highest rate, followed by those ages 55 to 64.
Veterans: Suicide rates among veterans were 1.5 times greater than non-veterans,
after adjusting for age and gender in 2016.
Those living in rural areas compared with those living in urban areas.
LGBTQ+ adults and youth compared with heterosexual adults and youth.
Figure 23. Suicide Deaths by Method
487
484
Suicide attempts. American Foundation for Suicide Prevention. www.afsp.org
485
op.cit.
486
op.cit.
487
Suicide statistics. American Foundation for Suicide Prevention. www.afsp.orgh

DRAFT Lee County Human Services Gap Analysis
Secon Four: Systems of Care
Chapter 21 | Suicide and Self-harm Page | 291
Risk Factors. Mental health disorders and/or substance use disorders are the
most significant risk factors for suicidal behaviors. In addition, environmental
factors such as stressful life events and access to lethal means such as firearms or drugs
may increase the risk of suicide. Previous suicide attempts and a family history of suicide
are also risk factors.
488
People most at risk tend to share specific characteristics. The main risk factors for
suicide are:
Depression, other mental disorders or substance abuse disorder
Certain medical conditions
Chronic pain
A prior suicide attempt
Family history of a mental disorder or substance abuse
Family history of suicide
Family violence, including physical or sexual abuse
Having guns or other firearms in the home
Having recently been released from prison or jail
Being exposed to others' suicidal behavior, such as that of family members, peers
or celebrities
Suicide and Other Problems
Suicide threats or self-harm can be related to other issues. For example, threats of
suicide or self-harm is the leading reason why a college student who is an abused
partner stays in the relationship (24%)
489
:
488
op.cit.
489
Fih & Pacic Companies, Inc. Conducted by Knowledge Networks, (December 2010), “College Dang
Violence and Abuse Poll”.
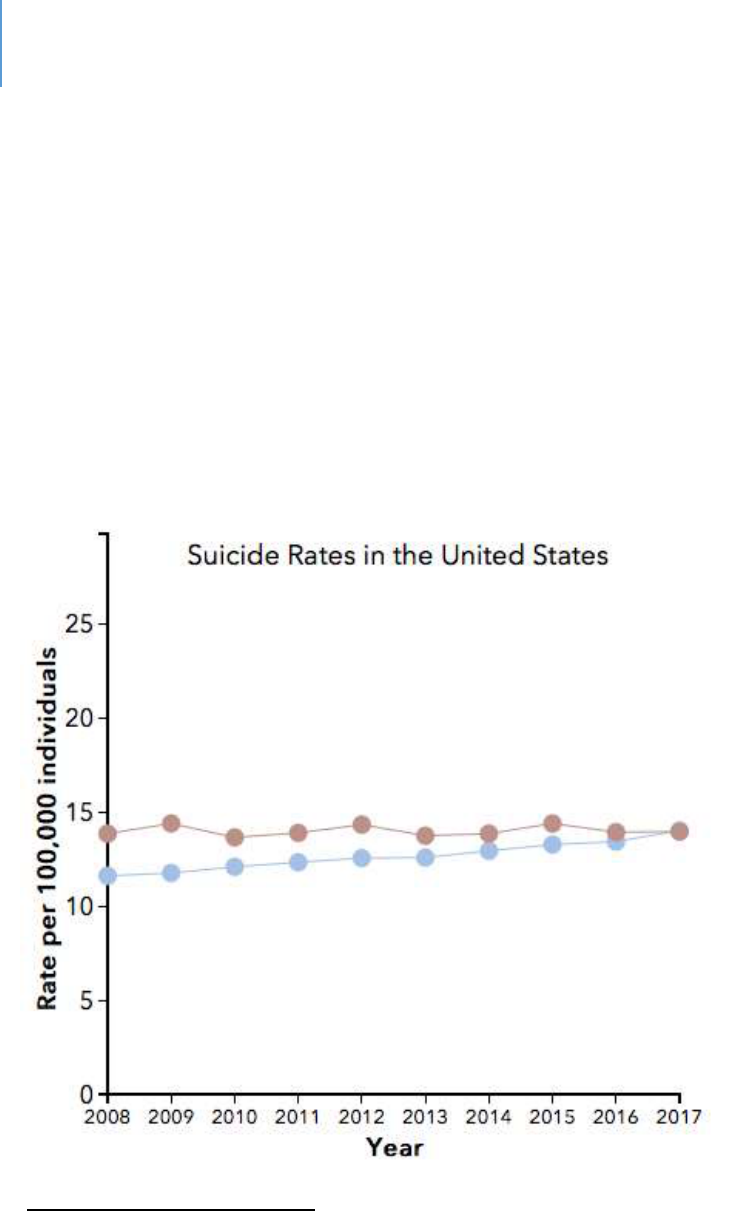
DRAFT Lee County Human Services Gap Analysis
Secon Four: Systems of Care
Chapter 21 | Suicide and Self-harm Page | 292
Suicide in Florida
Florida has a suicide age-adjusted rate of 14 people per 100,000
490
. In 2017, there were
3,227 suicides in the State
491
. Suicide is the eight-leading cause of death in the State.
492
Compared to the rates of other states, Florida is ranked 37
th
493
in one survey and 32
nd
in
another.
494
Figure 24 compares suicide rates in Florida to the United States.
Figure 24. Suicide Rates in the United States
490
Stats of the State of Florida. 2017. National Center for Health Statistics. Centers for Disease Control and
Prevention.
491
Op.cit.
492
op.cit
493
op.cit
494
Knowles, M. 2018. U.S. States ranked by suicide rate. www.beckershospitalreview.com
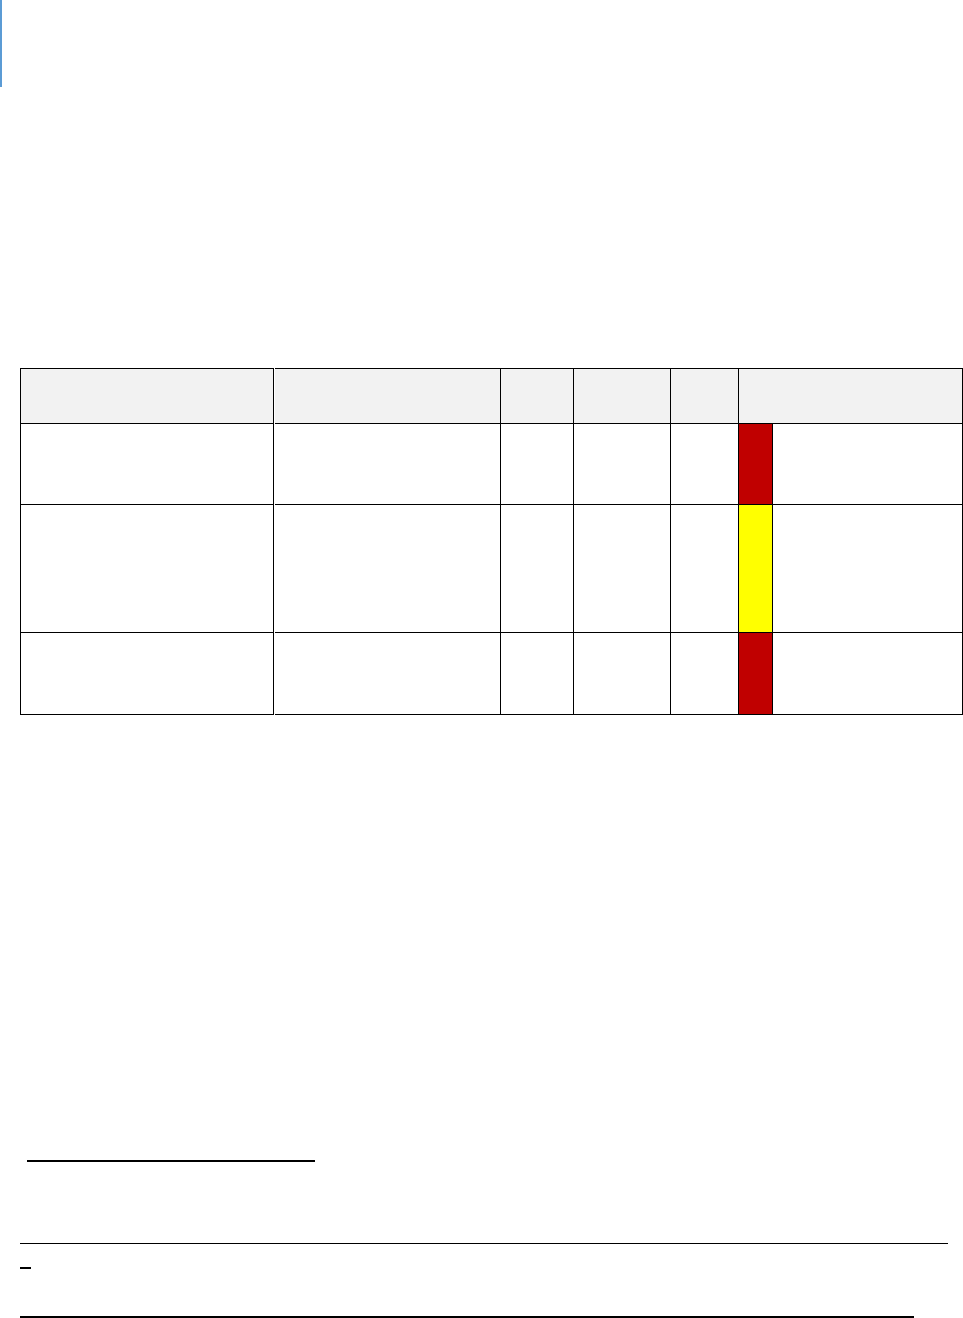
DRAFT Lee County Human Services Gap Analysis
Secon Four: Systems of Care
Chapter 21 | Suicide and Self-harm Page | 293
Lee County Data
Suicide rates for Lee County are shown in Table 82 below. As the table indicates, they
are somewhat worse than State averages.
Table 82. Suicide rates in Lee County
Sources
Data Title
Year
Lee
County
State
Comparison to State
Community Health Needs
Assessment
495
Suicide (age adjusted
death rate) per
100,000
2017
16.9
14
Worse
County Death Data
Comparison
496
Suicide Age Adjusted
Death Rate Per
100,000 Total
Population
2107
14.3
14.1
Within 10%
average
Child Health Status
497
Suicide death rate,
ages 19-21 Per
100,000 population
2015-
17
16.1
12.6
Worse
Higher rates of suicide are reported nationally for LGBTQ+ persons. There is no local
data available to determine the scope of the issue, if any, in Lee County.
The System-of-Care: Best Practices
Proven and promising practices include:
Universal suicide screening at hospital emergency departments
498
Coordination of suicide-prevention efforts across health-care, social, education
and employment services
499
495
2017 Community Health Needs Assessment Report; Lee Health and FL Dept. of Health in Lee County
496
Florida Health Charts; County Death Data Comparison:
http://www.flhealthcharts.com/ChartsReports/rdPage.aspx?rdReport=ChartsProfiles.CountyDeathDataCompariso
n
497
Florida Health Charts: Child Health Status Profile:
http://www.flhealthcharts.com/ChartsReports/rdPage.aspx?rdReport=ChartsProfiles.ChildHealthStatusProfile
498
Weir, K. 2019. Worrying trends in U.S. Suicide rates. Monitor on Psychology. 50(3), 24. www.apa.org
499
op.cit.

DRAFT Lee County Human Services Gap Analysis
Secon Four: Systems of Care
Chapter 21 | Suicide and Self-harm Page | 294
Workplace suicide prevention programs
500
Monthly reporting of suicides by local jurisdictions
501
Development of safety plans for at-risk people
502
Reduction of access to lethal means
503
Training of General Practitioners to recognize and treat depression and
suicidality
504
The prediction of suicide risk using electronic health records
505
The use of cognitive behavioral therapy and dialectical behavior therapy
506
Collaborative care. This is a team-based approach that adds behavioral health
care management and a mental health specialist to primary care
507
The System-of-Care in Lee County
There is no funding specifically dedicated to suicide prevention in Lee County. SalusCare
is funded for mental health/substance abuse in the following programs that could
address suicidal issues:
Crisis stabilization units for both children and adults
Children’s therapeutic behavioral onsite services
Children’s crisis support/emergency services
Access and counseling, case management, outpatient therapy
There is also a mobile crisis unit funded through the Central Florida Behavioral Health
Network, which is administered by the Center for Progress and Excellence.
In addition, there are various hotlines that could be used. The National Suicide
Prevention Lifeline is 800 273 TALK (8255).
500
op.cit
501
op.cit.
502
op.cit
503
op. cit.
504
Feltz-Cornelis, C. et.al. 2011. Best practice elements of multilevel suicide prevention strategies. Crisis. 31:319-
333.
505
Suicide prevention. National Institute of Mental Health. www.nimh.nih.gov
506
op.cit.
507
op.cit

DRAFT Lee County Human Services Gap Analysis
Secon Four: Systems of Care
Chapter 21 | Suicide and Self-harm Page | 295
Gaps
The gaps that are present elsewhere in local jurisdictions exist in Lee County. These
include:
Data gaps as to the local scope and details
Limited mental health services
Limited training for all professions on suicide and suicide prevention
Gaps in inter-disciplinary teams
Lack of some of the best practices identified above
Public perception and shame

DRAFT Lee County Human Services Gap Analysis
Secon Four: Systems of Care
Chapter 21 | Suicide and Self-harm Page | 296
Intenonally le blank.
DRAFT Lee County Human Services Gap Analysis
Secon Four: Systems of Care
Chapter 23 | Homelessness Page | 297
CHAPTER 22
Juveniles
Introduction
The system for addressing problematic issues by juveniles in Florida is called the Juvenile
Justice System. Its purpose is to intervene as early as possible to prevent further
problematic behavior, while at the same time giving equal consideration to public
safety.
Context and Background
The development of delinquent behavior is a result of a complex interaction of
individual, social and community conditions.
508
For individuals, there are both genetic
and environmental factors that start at fetal development and continue throughout life.
Table 83
509
shows the risk and protective factors associated with the development of
juvenile delinquency.
Table 83. Risk and Protective Factors by Domain
Risk Factor
Domain
Early Onset (ages 6-11)
Late Onset (ages 12-14)
Protective Factor*
Individual
General offenses
Substance use
Being male
Aggression **
Hyperactivity
Problem (antisocial)
behavior
Exposure to television
violence
Medical, physical
problems
Low IQ
Antisocial attitudes,
beliefs
Dishonesty**
General offenses
Restlessness
Difficulty
concentrating**
Risk taking
Aggression**
Being male
Physical violence
Antisocial attitudes,
beliefs
Crimes against persons
Problem (antisocial)
behavior
Low IQ
Substance use
Intolerant attitude
toward deviance
High IQ
Being female
Positive social orientation
Perceived sanctions for
transgressions
508
The development of delinquency. The National Academies of Sciences, Engineering Medicine. www.nap.edu
509
Office of the Surgeon General, 2001

DRAFT Lee County Human Services Gap Analysis
Secon Four: Systems of Care
Chapter 23 | Homelessness Page | 298
Risk Factor
Domain
Early Onset (ages 6-11)
Late Onset (ages 12-14)
Protective Factor*
Family
Low socioeconomic
status/poverty
Antisocial parents
Poor parents-child
relationship
Harsh, lax, or
inconsistent discipline
Broken home
Separation from parents
Other conditions
Abusive parents
Neglect
Poor parents-child
relationship
Harsh, lax, or
inconsistent discipline
Poor monitoring,
supervision
Low parental
involvement
Antisocial parents
Broken home
Low socioeconomic
status/poverty
Abusive parents
Family conflict**
Warm, supportive
relationships with
parents or other adults
Parents' positive
evaluation of peers
Parental monitoring
School
Poor attitude,
performance
Poor attitude,
performance
Academic failure
Commitment to school
Recognition for
involvement in
conventional activities
Peer group
Weak social ties
Antisocial peers
Weak social ties
Antisocial, delinquent
peers
Gang membership
Friends who engage in
conventional behavior
Community
Neighborhood crime,
drugs
Neighborhood
disorganization
The following figures and tables describe the status of juveniles engaged with the Justice
System in Lee County. All data in the figures and tables comes from the Department of
Juvenile Justice website so individual citations will not be made. A review of these
tables will confirm that many of the risk factors identified in Table 83 are operational for
Lee County juveniles involved in the justice system.
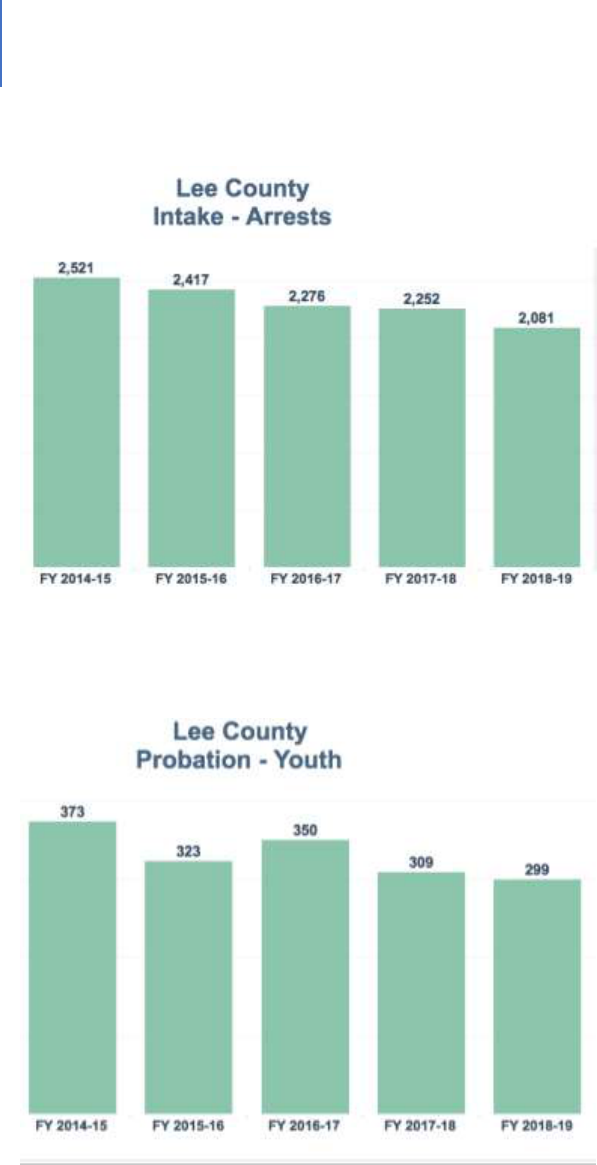
DRAFT Lee County Human Services Gap Analysis
Secon Four: Systems of Care
Chapter 23 | Homelessness Page | 299
Figure 25. Declining Rate of Arrests for Juvenile Offenses
Figure 26. Decline in the Number of Juveniles on Probation
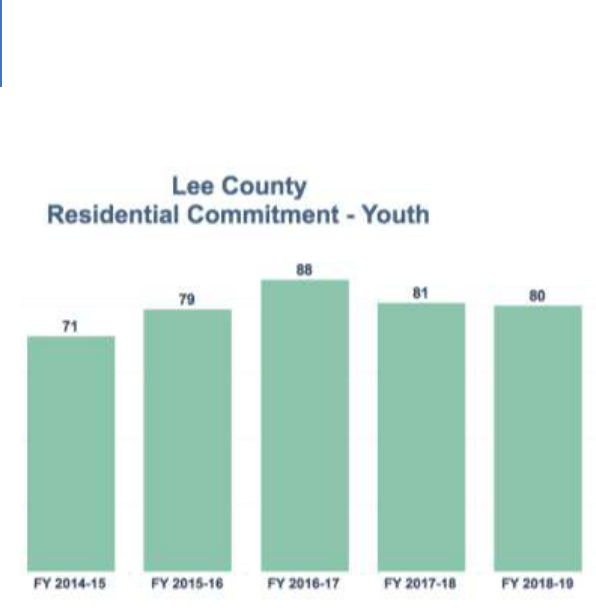
DRAFT Lee County Human Services Gap Analysis
Secon Four: Systems of Care
Chapter 23 | Homelessness Page | 300
Figure 27. The Number of Lee County Children in Some Form of Residential Restriction
The following tables provide informative data as to the characteristics of juveniles
involved in the justice system. Table 84 indicates that nearly 85% are still engaged in
school, while nearly 10% have dropped out of school. Table 85 shows that 44% have a
family member who has spent time in jail or prison. Table 86 describes the nature of
their peer associations; Table 87 describes mental health history; Table 88 shows
alcohol use; and Table 89 shows drug use. Tables 90 and 91 report data on physical and
sexual abuse.
Some of the significant data points include:
44% of juveniles have had a family member in jail or prison
45% of juveniles engage in the use of illegal or prescription drugs
22% either lack friendships or have friendships with anti-social individuals
Family history, drug abuse and friendship patterns are the highest correlates of
problematic juvenile behavior.
DRAFT Lee County Human Services Gap Analysis
Secon Four: Systems of Care
Chapter 23 | Homelessness Page | 301
Table 84. School Data
School Data
Number
Percentage
Drop-out
103
9.91%
Full-time
883
84.99%
Graduated
25
2.41%
Other
28
2.69%
1039
1
Table 85. Family History with Criminal Justice System
Family History with Criminal Justice
System
Number
Percentage
Family with a history of jail/prison
465
44.33%
Family with no history of jail/prison
584
55.67%
1049
Table 86. Peer Associations
Peer Associations
Number
Percentage
All anti-social friends
77
7.48%
All pro-social friends
470
45.68%
Gang member
6
0.58%
No consistent friends
149
14.48%
Pro and anti-social friends
327
31.78%
1029
Table 87. Mental Health History
Mental Health History
Number
Percentage
History of mental health issues
177
16.87%
No history of mental health issues
872
83.13%
1049
Table 88. Alcohol Usage
Alcohol Usage
Number
Percentage
Current usage
198
18.88%
Current usage with life problems
34
3.24%
No current usage
817
77.88%
1049
DRAFT Lee County Human Services Gap Analysis
Secon Four: Systems of Care
Chapter 23 | Homelessness Page | 302
Table 89. Drug Usage
Drug Use
Number
Percentage
Current drug use
343
32.70%
current use with life problems
138
13.16%
No current drug use
568
54.15%
1049
Table 90. History of Physical Abuse
History of Physical Abuse
Number
Percentage
History
134
12.77%
No history
915
87.23%
1049
Table 91. History of Sexual Abuse
History of Sexual Abuse
Number
Percentage
History
79
7.53%
No history
970
92.47%
1049

DRAFT Lee County Human Services Gap Analysis
Secon Four: Systems of Care
Chapter 23 | Homelessness Page | 303
The System-of-Care: The Juvenile Justice System
The Juvenile Justice System is operated primarily as a state function (Department of
Juvenile Justice or DJJ) in coordination with the judicial system of the State and law
enforcement.
The system consists of the following components:
Civil Citation
A law enforcement officer has the discretion to issue a civil citation to a youth involved
in some illegal criminal misdemeanor action. This requires parental engagement and
requires an appearance the same as any other “ticket” does. If parents refuse
involvement, the youth is arrested and taken to the Juvenile Assessment Center (JAC).
Truancy Intervention Program (TIP)
This board seeks to address very early indicators of habitual truancy so that the child is
not deemed truant. Elementary and middle school students are identified by their
school social worker as being chronically truant with more than 19 unexcused absences
in a school year. Students are in violation of Florida Statute 984.12.
Truancy, Ungovernable, Run-Away (TURN Board)
This board seeks to address truant, ungovernable, run-away behaviors by a youth to
avoid further involvement with the Juvenile Justice System. Students are in violation of
Florida Statute 984.12. Students are referred by their school social worker or a parent.
Children in Need of Services/Families in Need of Services (CINS/FINS)
The DJJ contracts with a nonprofit to address run-away, habitually truant, ungovernable
or homeless children through the CINS/FINS services. These youths and their families
can be provided with non-residential counseling or can be housed up to 30 days in a
CINS/FINS shelter while family counseling occurs and arrangements are made to either
return home or go to a state placement. Lutheran Services operates the CINS/FINS
program in Lee County. Formal action would be referred to as a CINS Petition. At that

DRAFT Lee County Human Services Gap Analysis
Secon Four: Systems of Care
Chapter 23 | Homelessness Page | 304
point, a judge would have jurisdiction over the child. The relevant Florida Statute is
984.15.
Juvenile Assessment Center (JAC)
If a juvenile is arrested, he/she will go to the Juvenile Assessment Center (JAC). This is
an intake and booking facility for defendants under the age of 18.
Several agencies work at the JAC to facilitate collaboration between the State Attorney’s
Office (SAO), Department of Juvenile Justice (DJJ), the school system and social services
focused on Delinquency Diversion and Family Support Services. The agencies work
together to recommend and provide services and sanctions for the juveniles. In Lee
County, the JAC is operated by the Lee County Sheriff’s Office (LCSO).
JACs provide law enforcement with a central receiving facility at which youth can be
screened and booked without further involvement of law enforcement.
The DJJ determines which of the following initial intake status actions is most
appropriate:
Direct release to parents or other home setting
Intensive home detention
Intensive home detention with an electronic monitoring device
A diversion program and referral on-site, if the juvenile has a drug, alcohol or
mental health problem
Secure detention
Other than diversion, these alternatives are time-limited for 21 days. If the youth is re-
arrested, the 21-day clock begins again. Otherwise, he/she remains in intake status
until a disposition of the case is made, usually within 60 to 120 days.
Diversion and Probation
For youth who are first-time offenders, alternative programs are available. Diversion
programs in Lee County are Neighborhood Accountability Boards, Juvenile Arbitration
and the Juvenile Diversion Alternative Program. Each youth is assigned a Juvenile
Probation Officer. At the completion of the diversion program, the DJJ will close the

DRAFT Lee County Human Services Gap Analysis
Secon Four: Systems of Care
Chapter 23 | Homelessness Page | 305
case and the State Attorney will nolle pros it.
Juvenile Detention Center
If the juvenile remains in custody, he or she will be transferred to a juvenile detention
facility. These centers hold youth that are awaiting court dates or placement in a
residential facility. The Southwest Florida Juvenile Detention Center serves Lee, Hendry,
Glades and Charlotte counties.
Detention is the custody status for youth who are held pursuant to a court order or after
being taken into custody for a violation of the law. In Florida, a youth may be detained
only when specific statutory criteria, outlined in section 985.215 Florida Statute, are
met. Criteria for detention include current offenses, prior history, legal status and any
aggravating or mitigating factors.
Youth under age 18 taken into custody by law enforcement are screened by the Florida
Department of Juvenile Justice to determine if they should be detained in a secure
detention facility. Detention screening is performed by juvenile probation staff using a
standardized Detention Risk Assessment Instrument (DRAI).
The Florida Department of Juvenile Justice operates 21 secure detention centers in 21
counties with a total of 1,243 beds. Pre-disposition detention costs are shared by State
and County government. Post-disposition costs are primarily funded by State general
revenue dollars. All detention centers receive additional federal funding in the form of
the National School Lunch and Breakfast funds. County governments have a funding
responsibility for Detention Centers based on State formulas.
Youth placed in secure detention have been assessed as risks to public safety, per the
DRAI, and must remain in a physically secure detention center while awaiting court
proceedings. Youth in custody for minor crimes that are not considered a risk to public
safety may be released into the custody of their parents or guardian.
Courts
Youth will be given a Notice to Appear within 30 days of the day they were arrested.
The hearing process is as follows:
Arraignment. At arraignment, the youth will enter a plea;

DRAFT Lee County Human Services Gap Analysis
Secon Four: Systems of Care
Chapter 23 | Homelessness Page | 306
Docket Sounding. At docket sounding, the youth will either continue with the plea
originally entered or they will change it;
Adjudicatory. Adjudicatory is the trial phase;
Disposition. Disposition is the sentencing phase.
Residential
Residential facilities are for youth who are required by a judge to stay in the care of the
department for an extended time. There are varying levels of security. Commitments
are for indeterminate periods of time and may include conditional release.
Gaps
The major gap in the system occurs between the expiration of the initial JAC assignment
after 21 days and the disposition by DJJ and the court. During this period, there is no
support for the youth or family.
The DJJ faces many of the same challenges encountered by other organizations in the
State and County. Challenges include:
Staffing, recruitment and turnover;
Having to deal with more complex behaviors at earlier ages;
Managing probation with dysfunctional families for whom services may be
limited;
Family instability due to income, risk of homelessness, domestic violence, child
abuse, transportation challenges or other factors;
Securing mental health or substance abuse services in a timely manner.

DRAFT Lee County Human Services Gap Analysis
Secon Four: Systems of Care
Chapter 23 | Homelessness Page | 307
Chapter 23
Homelessness
Introduction
This chapter will consist of the following sections:
Context and Background
Current Thinking on Addressing Homelessness
The Homeless Service System in Lee County
Gaps
Definitions
Homelessness is a complex issue that has multiple dimensions, including:
Lack of available and appropriate housing
Limited access to transportation
Mental health and substance abuse issues
Poverty
Low income that leads to temporary financial instability
Lifestyle choices
Physical health issues
Frequent interactions with law enforcement
Food security / insecurity and malnutrition
Threats to physical safety
Several of these issues are addressed in other chapters and will not be repeated here.
These include:
Housing. The basic issue for homelessness. However, it underlies so many
other service needs that it is addressed in the Infrastructure Chapter.
Transportation. This is a core issue for homeless people. As with housing, it
is an issue that cuts across populations and services. As such, it is addressed
in the Infrastructure Chapter.
Mental Health and Substance Abuse and Law Enforcement Interaction.
Behavioral health issues and subsequent involvement with law enforcement,
affect a part of the homeless population. This is also true for other human

DRAFT Lee County Human Services Gap Analysis
Secon Four: Systems of Care
Chapter 23 | Homelessness Page | 308
service areas. For this reason, two separate chapters, Behavioral Health and
Criminal Justice, were developed. The needs of the homeless are addressed
in these chapters.
Food Security and Nutrition. This topic is certainly a concern for homeless
people, but it is also a concern for many others. Therefore, there is a
separate chapter on Food Security and Nutrition.
Information about gaps for homeless people will be found in those chapters. This
chapter will address the remaining issues.
Context and Background
Homelessness is a national issue
510
and neither Florida nor Lee County are exempt. It is
estimated that on any given night 0.2% of Americans, or 17 people per 10,000, are
homeless.
511
In Florida, it is estimated there are 31,000 homeless individuals, or 15 per
10,000 people.
512
However, data related to homelessness should be used with caution.
In Lee County, the National Alliance to End Homelessness estimates that 728 people are
homeless for a 9.8 per 10,000 per-capita rate.
513
As noted by the National Law Center
on Homelessness and Poverty:
514
There are differing definitions of homelessness with HUD using a narrow definition
and the US Department of Education using a broader definition.
The “point-in-time” counting method used by HUD has limitations.
Nationally, homelessness is driven by four factors:
515
A lack of affordable housing
Unemployment or extremely low income
516
Poverty
Behavioral health needs and gaps in services
510
The State of Homelessness in America. www.whitehouse.gov/wp-content/uploads/2019/09.
511
Ibid.
512
National Alliance to End Homelessness. www.endhomelessness.org
513
ibid.
514
Homelessness in America. 2018. National Law Center on Homelessness. https://inchp.org/uploads/2018/10
515
Homelessness in America. 2018. National Law Center on Homelessness. https://inchp.org/uploads/2018/10
516
National Low Income Housing Coalition, HOUSING SPOTLIGHT: THE AFFORDABLE RENTAL HOUSING GAP
PERSIST 2 (Aug. 2014), http://nlihc.org/sites/default/files/HS_4-1.pdf

DRAFT Lee County Human Services Gap Analysis
Secon Four: Systems of Care
Chapter 23 | Homelessness Page | 309
Another factor, for women specifically, is domestic violence.
517
It is important to note that there are different types of homeless. One categorization
schema identifies three types:
The Chronic / Long-term Homeless. This is the common, public image of the
homeless often seen on the streets, under bridge, or in parks. These people are
homeless for long periods of time and often have behavioral health issues. Their
appearance is often bedraggled and they are often of concern to the public.
The Episodic or Cyclical Homeless. These are people who fall in and out of
homelessness, often associated with their mental illness.
Situational or Transitional Homeless. These are people forced into homelessness
because of a life event (loss of a job, disaster, domestic violence, loss of a
breadwinner). This is often short-term. Many of these are the hidden homeless
who sleep in their car or at a friend’s house.
Some prefer to break out the hidden homeless as a fourth type. These people often
do not access homeless services and are less likely to be counted.
Veterans have also been identified as a special group that may fall into any of the
above categories.
Data about the homeless also can be organized into the following categories:
518
Sheltered individuals
Unsheltered individuals
Sheltered people in families
Unsheltered people in families
Chronically homeless
Veterans
517
Tischler, et al., Mothers experiencing homelessness: mental health, support and social care needs, 15 Health
Soc. Care Cmty. 3, 246-253 (May 2007); see also Ellen Shelton, et al., Homeless Study Fact Sheet: Long-Term
Homelessness, Wilder Res. Ctr. (Apr. 2013) (finding that at least 32% of homeless Minnesota women reported
becoming homeless due to domestic violence).
518
National Alliance, op.cit.

DRAFT Lee County Human Services Gap Analysis
Secon Four: Systems of Care
Chapter 23 | Homelessness Page | 310
Unaccompanied children and youth
Addressing Homelessness: The Current State of Thinking and Best Practices
As with all attempts to address complex social issues, the thinking about effective
intervention evolves. The current state of thinking regarding homeless prevention and
services includes:
The Continuum of Care (CoC) Concept. The concept of a continuum of care is that
individuals are best served in an integrated system-of-care that tracks them over time
through a comprehensive array of services spanning all levels of intensity of services.
519
The Continuum of Care (CoC) Structure. This is a regional or local planning body that
coordinates housing-services funding for homeless families and individuals.
Housing First.
520
The concept of Housing First is simple. Provide housing first, then
combine that housing with supportive services. This approach is a shift from the
traditional approach of getting someone ready for housing. It has proved to be effective
with the chronic homeless.
521
This approach has the following elements:
There is a focus on helping individuals and families access and sustain rental housing
as quickly as possible and the housing is not time-limited;
A variety of services are delivered primarily following a housing placement to
promote housing stability and individual wellbeing;
Such services are time-limited or long-term depending upon individual need; and
Housing is not contingent on compliance with services – instead, participants must
comply with a standard lease agreement and are provided with the services and
supports that are necessary to help them do so successfully.
522
Rapid Rehousing.
523
Rapid rehousing is just that. The goal is to help individuals and
families quickly exit homelessness and return to permanent housing. Housing First is a
key part of this approach with its emphasis on housing without pre-conditions. Rapid
re-housing consists of the following services:
519
www.ncbi.nim.nih.gov
520
National Alliance, op.cit.
521
U.S. Interagency Council on Homelessness
522
Tampa Hillsborough Homeless Initiative. www.thhi.org
523
National Allliance, op.cit.

DRAFT Lee County Human Services Gap Analysis
Secon Four: Systems of Care
Chapter 23 | Homelessness Page | 311
Housing search and landlord negotiation
Short-term financial assistance
Home-based stabilization services
Coordinated Intake and Assessment.
524
HUD describes coordinated intake and
assessment as a “powerful tool designed to ensure that homeless persons / families are
matched with the right intervention, among all of the interventions available in the
community’s continuum of care (CoC), as quickly as possible. It standardizes the access
and assessment process for all clients and coordinates referrals across all providers in
the CoC. When providers intake and assess clients using the same process, and when
referrals are conducted with an understanding of all programs including their offered
services and bed availability, participants can be served with the most appropriate
intervention and not with a ‘first come, first served’ approach.”
This approach is a step beyond “No Wrong Door” and is closer to “One Way In.”
Prevention and Diversion.
525
Prevention is aimed at keeping people in their current
housing situation. Diversion is a strategy that prevents homelessness for people seeking
shelter by helping them identify immediate alternate housing arrangements and, if
necessary, connecting them with services and financial assistance to help them return to
permanent housing.
526
Trauma Informed Care.
527
Trauma informed care is an evidence-based practice that
helps providers address the triggers and vulnerabilities of people experiencing trauma.
Since homelessness is a traumatic experience, it is an appropriate form of intervention.
Motivational Interview.
528
This is an approach utilizing interaction with people that
focuses on strengthening the motivation to change. It uses an understanding of how
hard it is to change learned behaviors.
524
National Alliance, op.cit.
525
National Alliance, op.cit.
526
Source: http://endhomelessness.org/wp-content/uploads/2011/08/creating-a-successul-diversion-program.pdf
527
SAMSHA best practices. www.samsha.gov
528
trauma informed care. www.familyhomelessness.org

DRAFT Lee County Human Services Gap Analysis
Secon Four: Systems of Care
Chapter 23 | Homelessness Page | 312
The Homeless Service System in Lee County
It should be noted that the Lee County homeless services system is engaged in the best
practices identified above.
As the Lead Agency for the Continuum of Care, the Lee County Department of Human
and Veteran Services (HVS) is responsible for making funding applications, contracting
with sub-recipients and monitoring performance. In addition, HVS serves as the lead
agency for the CoC’s Homeless Management Information System (HMIS) and as the staff
for the Continuum of Care Governing Board. In these roles, HVS staff compose and
maintain required policies and procedures, coordinate strategic planning and reporting,
facilitate Board meetings and membership and coordinate the implementation of the
Coordinated Entry system.
The CoC Governing Board has been established to act on behalf of the CoC membership
to oversee the responsibilities of the CoC, the operation of the Homeless Management
Information System (HMIS), the implementation of the Coordinated Entry System and
long-term strategic planning. In Lee County, the Continuum of Care is a broad group of
individual stakeholders and organizations that are engaged to ensure that homelessness
is rare, brief and one-time. Collaboration among CoC members occurs through regular
meetings of the Governing Board, the Lee County Homeless Coalition and various
subcommittees.
The CoC is responsible to:
Hold at least semi-annual meetings
Invite new members
Adopt and update a governance charter
Appoint committees / subcommittees / workgroups
Establish performance targets
Monitor project and system performance
Make recommendations for resource allocation
Develop system-wide policies and procedures
Complete the annual application for HUD CoC funding
Plan and conduct an annual Point in Time (PIT) and Housing Inventory Count (HIC)
Establish and operate a CoC-wide HMIS
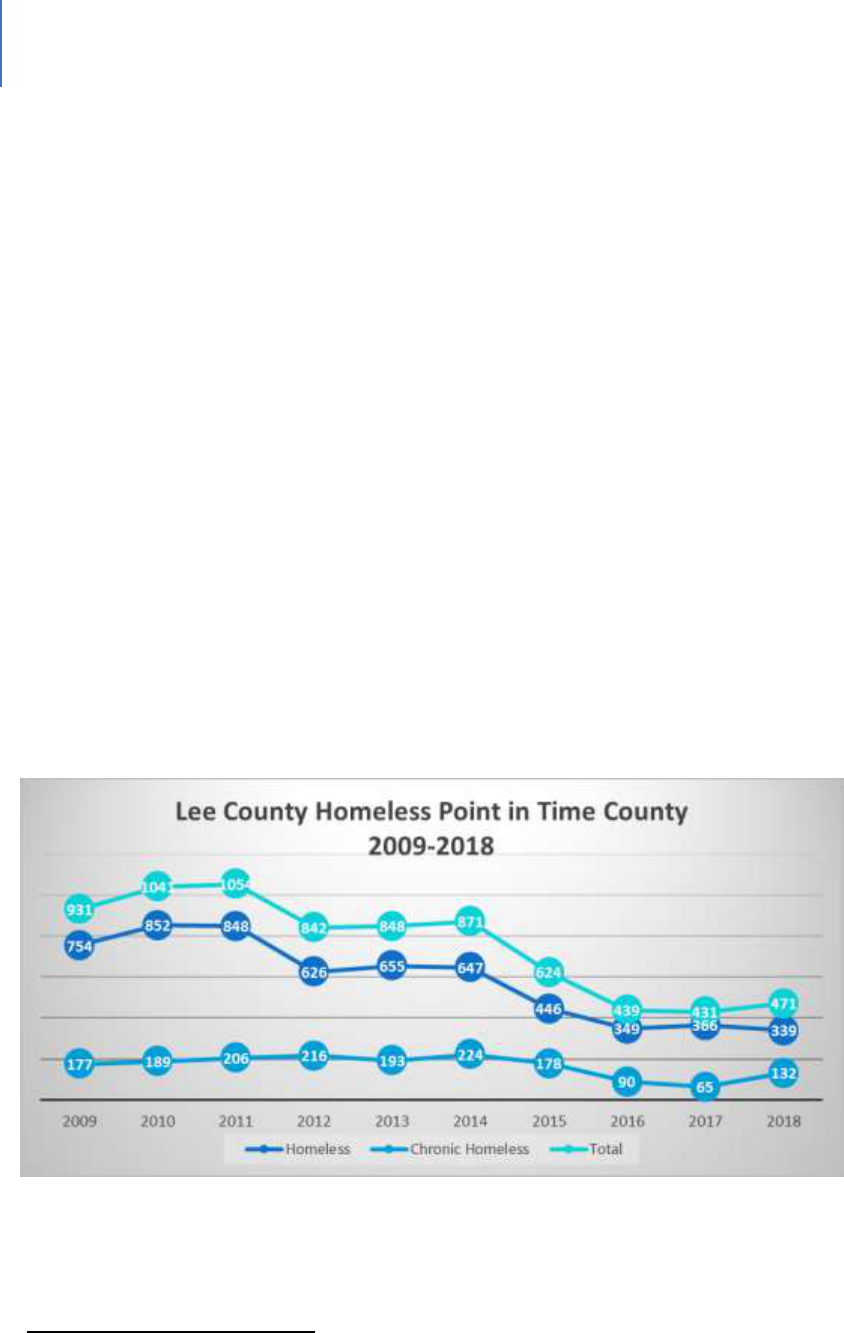
DRAFT Lee County Human Services Gap Analysis
Secon Four: Systems of Care
Chapter 23 | Homelessness Page | 313
Coordinate the implementation of a service system that meets the needs of
homeless people. At a minimum, the system must include: outreach, engagement,
assessment, shelter, housing, supportive services and prevention services.
Conduct an annual gaps analysis of homeless needs and services
Consult with Emergency Solutions Grants recipients and Consolidated Planning
jurisdictions
Apply for and administer State homeless funding
Coordinate the delivery of services by establishing and operating a coordinated
entry system
There are currently:
27 service providers participating in HMIS
52 service providers in the CoC (excluding victims’ service providers);
13 providers with executed member agency MOUs
This system has been effective in reducing homelessness in Lee County by 58% since
2009.
529
Figure 28 shows this decrease using point in time data.
Figure 28. Lee County Homeless Point in Time 2009-2018
529
2019-2028 Strategic Plan, Lee County Continuum of Care
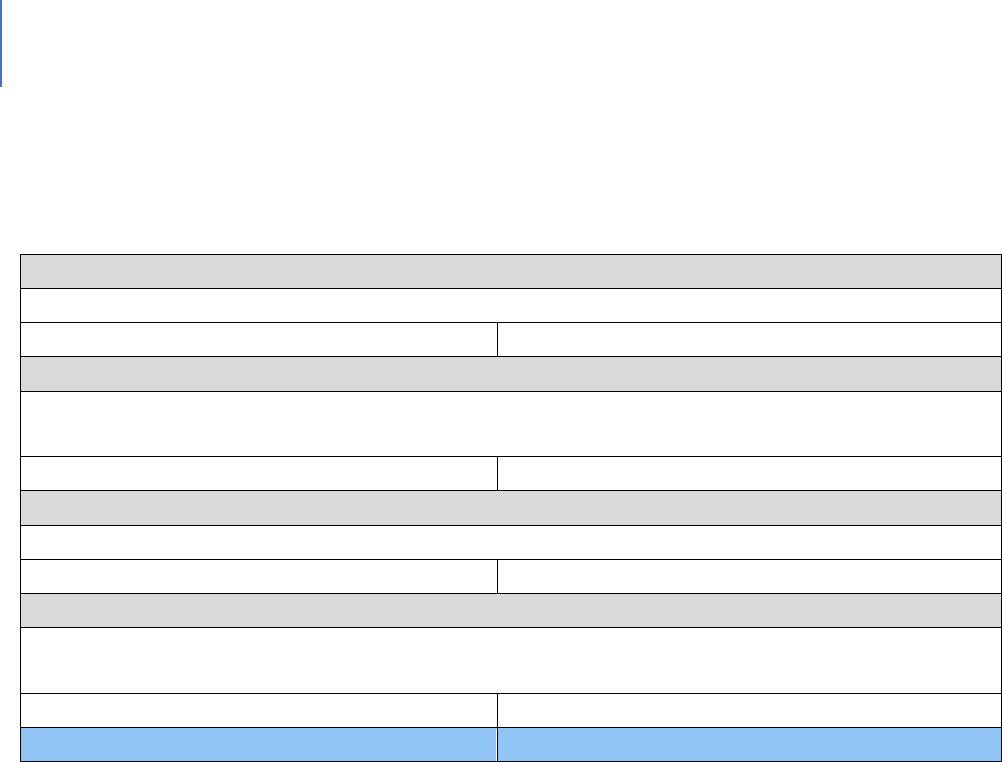
DRAFT Lee County Human Services Gap Analysis
Secon Four: Systems of Care
Chapter 23 | Homelessness Page | 314
In fiscal year 2018, the CoC was awarded more than $10.4 million. Table 92 shows the
breakdown of funding sources.
Table 92. Continuum of Care, Lee County 2018 Funding
Federal Grant Funds
Grant funds from U.S. Housing and Urban Development and Veterans Affairs
Total Federal Grant Awards
$5,482,775
State Grant Funds
Grant funds from the Florida Department of Children and Families and the Florida Department of
Economic Opportunity
Total State Grant Awards
$2,153,570
Private Funds
Includes various private foundation grants and donations provided to nonprofits
Total Private Funds
$1,496,758
Local Government Funds
Includes Community Development Block Grant (CDBG) from Cape Coral, local funds from
City of Fort Myers, County Homeless, Partnering for Results (PFR) and 10 Year Plan funds
Total Local Government Funds
$1,273,638
Total Homelessness Assistance Funds
$10,406,741
The current focus of the CoC is to provide:
Quick identification of people experiencing homelessness and those at-risk
Prevention of the loss of housing and diversion
Rapid re-housing
Quick connection to services
Total Number of clients served in the CoC during FY17-18 (July 1, 2017 – June 30, 2018):
7,954
Table 93 shows the ages of people receiving prevention services through Lee County
Human and Veteran Services between 2013 and 2018. It is of note that more than 250
of these are 60 or older.
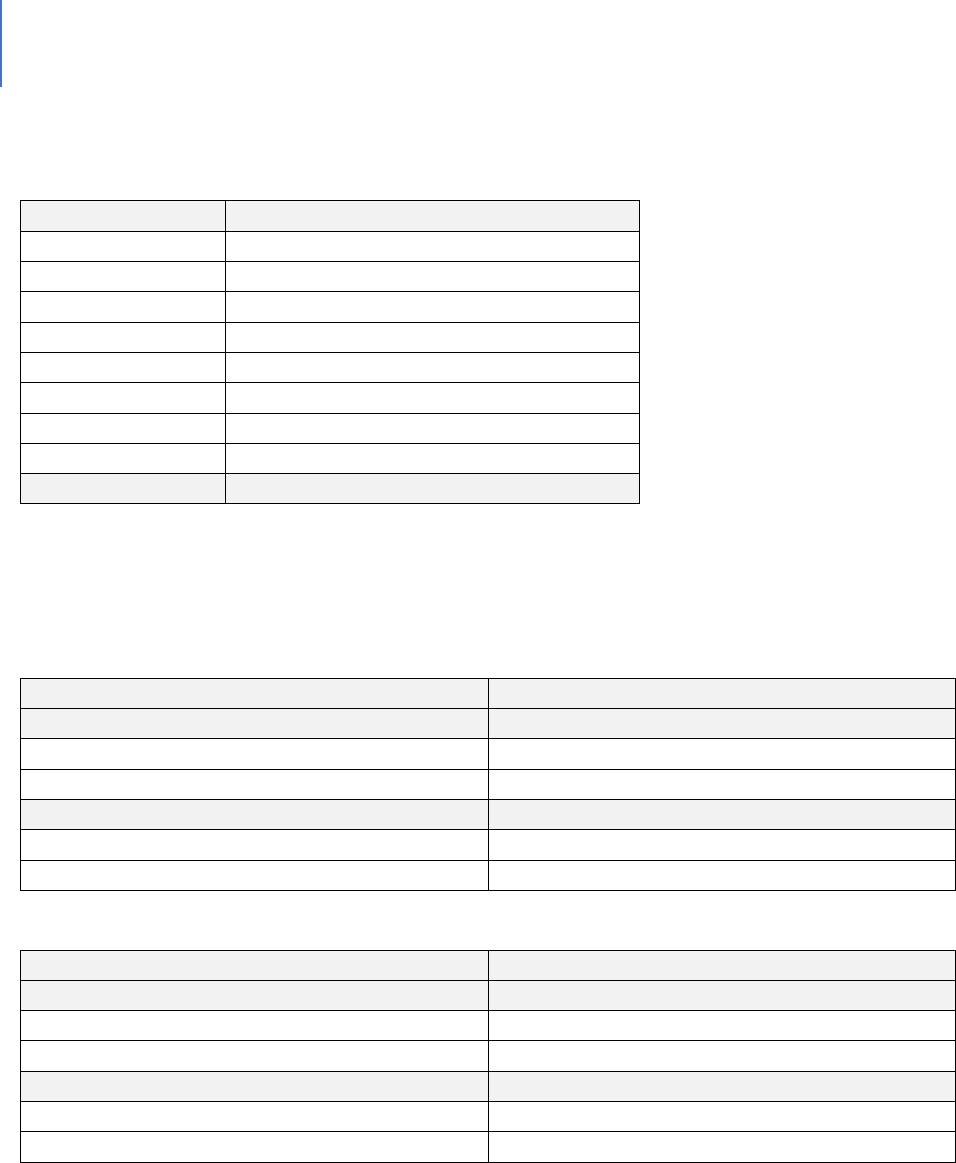
DRAFT Lee County Human Services Gap Analysis
Secon Four: Systems of Care
Chapter 23 | Homelessness Page | 315
Table 93. Client Age Ranges Receiving Homelessness Prevention Services (2013 – 2018)
Age Range
Count of Household Members
Under 18
2485
18-24
399
25-29
391
30-39
786
40-49
664
50-59
583
60-69
197
70+
60
Total
5565
Table 94 provides a multi-year perspective on older clients served by HVS.
Table 94. Elderly Clients Served by HVS
HVS Programs (Programs provided at HVS)
FY17 (10/1/16 - 9/30/17)
FY18 (10/1/17 - 9/30/18)
All Clients
All Clients
Age 60-64 - 474
Age 60-64 - 433
Age 65+ - 1403
Age 65+ - 1318
Homeless
Homeless
Age 60-64 - 21
Age 60-64 - 25
Age 65+ - 37
Age 65+ - 35
All HMIS PROGRAMS (Programs at 27 Agencies participating in the HMIS)
FY17(10/1/16-9/30/17)
FY18 (10/1/17-9/30/18)
All Clients
All Clients
Age 60-64 - 902
Age 60-64 - 785
Age 65+ - 2222
Age 65+ - 1895
Homeless
Homeless
Age 60-64 - 132
Age 60-64 - 144
Age 65+ - 138
Age 65+ - 125
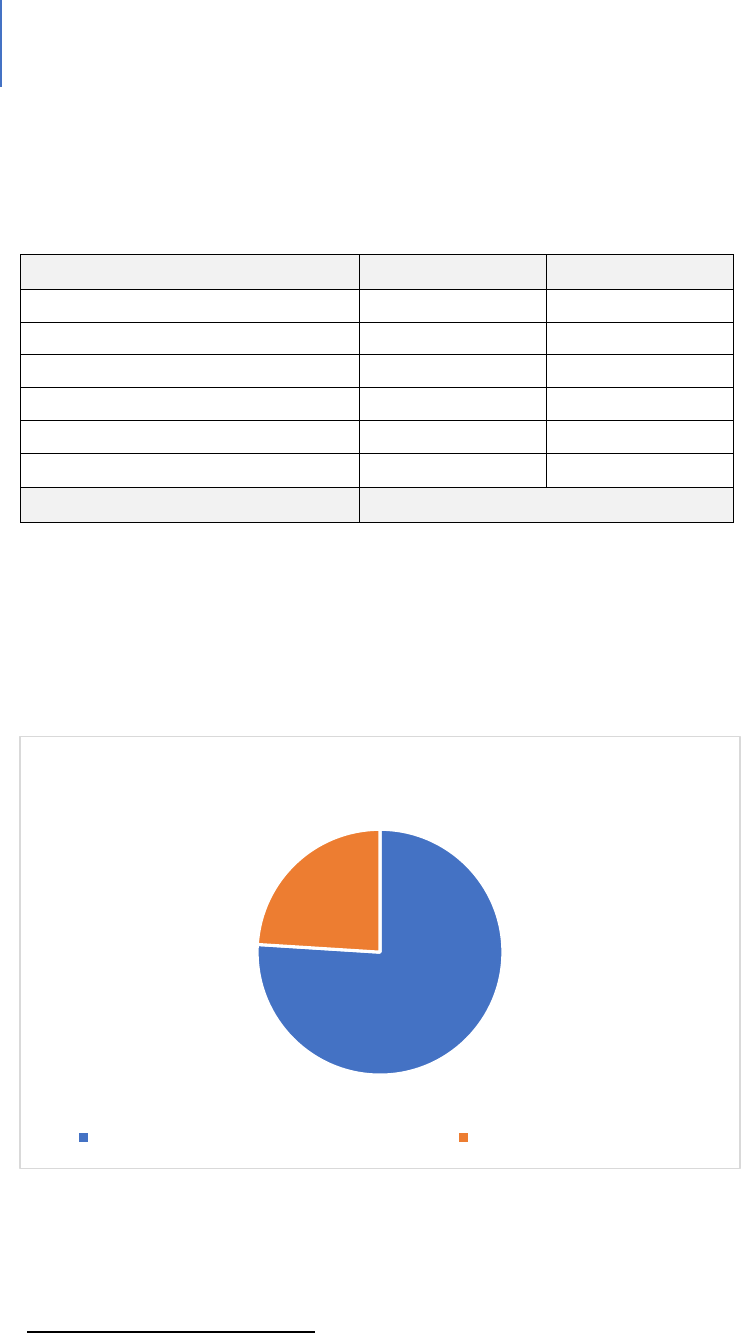
DRAFT Lee County Human Services Gap Analysis
Secon Four: Systems of Care
Chapter 23 | Homelessness Page | 316
Table 95 shows the income level of individuals receiving homelessness prevention
assistance.
Table 95. Income Level of Persons Receiving Homelessness Prevention Assistance
Federal Poverty Level Range
Count
%
0-24%
75
4.3%
25-49%
169
9.7%
50-74%
271
15.5%
75-99%
309
17.7%
100-124%
277
15.8%
125% +
649
37.1%
Total
1750
As shown in Figure 29, based on coordinated entry tracking, 76% of households have
some cash or non-cash income. The average for this group was $991 a month.
Figure 29. Coordinated Entry Homeless Households and Income Reporting
530
530
Provided by Lee County Human and Veteran Services
76%
24%
Homessless Households and Income
Self reported cash or non cash income Self reported no income

DRAFT Lee County Human Services Gap Analysis
Secon Four: Systems of Care
Chapter 23 | Homelessness Page | 317
Recent data. The following Individuals or families have contacted the United Way 211
service between Sept. 30, 2019, and Nov. 22, 2019 indicating that they are homeless
and have children in the household:
Number of children who are homeless: 329
Number of households with children who are homeless: 148
County staff reports that many of these households are first-time homeless and are able
to get back on their feet with a small amount of rental assistance and connections to
employment and childcare. These households often do not score high in prioritization
for permanent housing resources and end up waiting longer than more vulnerable
households. While this is not true in all cases, these households also tend to have some
sort of local support network and may be able to be diverted from the homeless system
with just a small amount of financial assistance or a homelessness prevention program.
System Gaps
In addition to the gaps noted in the introduction: supportive and affordable housing,
transportation, behavioral health services, jail diversion or re-entry, and food (which are
discussed again below), the following are other significant gaps:
Emergency Response Funding. This funding helps people to remain in their current
housing situation. There is a system in place not only to provide financial assistance, but
also to provide financial planning and other supports so that the need for repeated
assistance is limited. Individuals are limited to three requests for assistance in a
lifetime. As noted earlier in this chapter, there are substantive numbers of households
that one-time assistance with rent or other expenses enables them to remain in their
homes and avoid a homelessness situation.
Table 96 shows the number of people who have used this service.

DRAFT Lee County Human Services Gap Analysis
Secon Four: Systems of Care
Chapter 23 | Homelessness Page | 318
Table 96. Emergency Response Funding by Households
Times in Intake*
Heads of Household
1
1925
2
146
3
9
4
1
Total
2081
*5 year period, 2013 – 2018.
Housing. Homelessness, for most of the homeless, is a housing-cost problem. Lee
County has a challenge with housing affordability as the chapter on housing discusses in
detail. Creating more affordable housing would certainly reduce the number of
homeless. However, as fundamental as it is, it is not the sole solution.
Acknowledging that affordable and appropriate housing comprises the most significant
gap, there are other gaps to be addressed if homelessness is to be reduced and
alleviated. These include:
Public Perception. As noted earlier, the most common public perception of
homelessness is that of the chronic homeless person. However, what is unrecognized
are employed people who are homeless because they cannot afford housing, or people
such as victims of domestic violence who are now homeless. Between Sept. 4, 2019,
and Nov. 25, 2019, 76% of clients who contacted the CoC’s Coordinated Entry System
self-reported as having cash or non-cash income. The average monthly income reported
by those clients was $991 per month. A broader and more accurate understanding will
help shape public and private response to this issue.
Behavioral Health. Most chronic homeless are faced with mental illness issues,
substance abuse issues or both. Given the limited behavioral health services in the
county, these people often reside in jail or are on wait-lists for services.
Physical Health. The CoC has established a strong network to address physical health
issues. It is an ongoing issue, however, and there is always the need for additional
specialty services such as dentistry, optimality and chronic-disease management.
Staffing. There is a significant volunteer effort in the community as noted in Table 97.
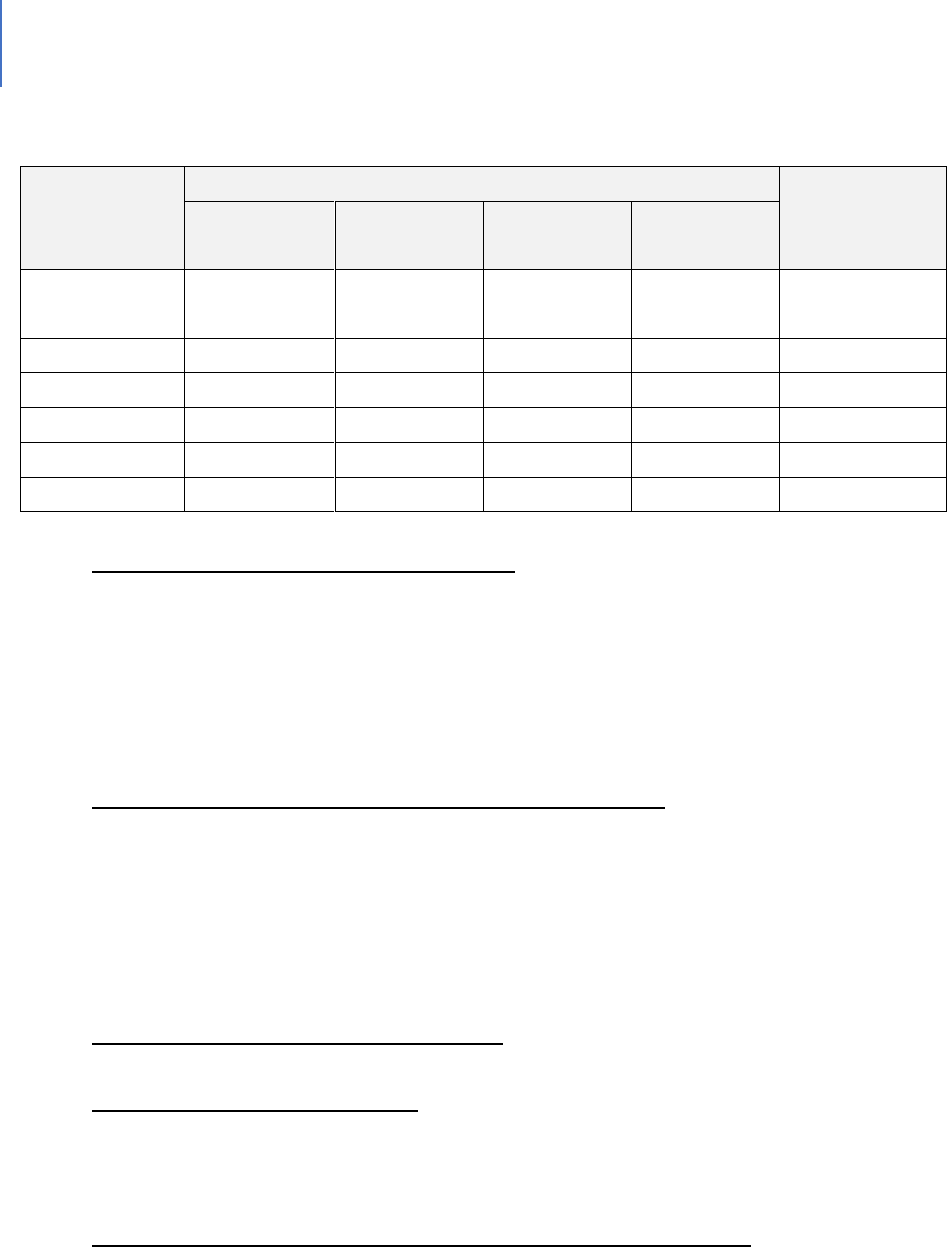
DRAFT Lee County Human Services Gap Analysis
Secon Four: Systems of Care
Chapter 23 | Homelessness Page | 319
Table 97. Volunteer Summary
End Date
Number of Volunteers
Total # of
Volunteers
Lee Health
United Way
Lee County
Habitat for
Humanity
12/31/2012
882
2,223
1,125
3,052
7,282
12/31/2013
759
2,350
1,564
5,319
9,992
12/31/2014
801
1,898
1,222
6,420
10,341
12/31/2015
999
2,543
1,298
7,096
11,936
12/31/2016
1,185
2,773
985
7,948
12,891
12/31/2017
1,161
2,874
1,001
5,554
10,590
Long Waiting Lists for Affordable Child-care. Once we acknowledge that a percentage of
homeless people have jobs with inadequate compensation to cover all expenses, the
child-care cost issue becomes clear. Only with rare exceptions can children be taken to
a job. To keep the job, child-care must be paid for. This can mean something else isn’t
getting paid for and that is most likely housing. The waiting list for child-care services
for low-income working families in Lee County was 961 as of Sept. 30, 2019.
Increased Coordination of all Community Service Providers. Many service providers do
not participate in the Homeless Management Information System, resulting in either
duplication of services, inefficient use of resources or a lack of knowledge about
resources. While not a negative in and of itself, it does mean the resources of the
community are not as fully coordinated and optimized as they could be. The
participation rate of HMIS is 51.9%.
Literacy and English as a Second Language. Programs are limited in their availability.
Support or Wrap-around Services. In obtaining job training or employment, these
support or wrap-around services are needed to help ensure people complete training
programs or are dependable employees. Child-care is one example of such a service.
Collaboration between Private Employers and the Service Providers. For those service
providers seeking to help the homeless find employment, a strong set of relationships
with employers is needed. Unfortunately, it is not currently at that level.

DRAFT Lee County Human Services Gap Analysis
Secon Four: Systems of Care
Chapter 23 | Homelessness Page | 320
Jail Diversion. There is a need for more extensive jail diversion options. This gap is
addressed in the chapter on Behavioral Health and Criminal Justice.
Jail Re-entry. There is a need for programs and services to help released inmates
successfully re-enter the community. This gap is addressed in the chapter on Behavioral
Health and Criminal Justice.
Transportation. Some homeless people do not own vehicles. For those who do, this
represents another cost that must be met to keep a job or to have a place to sleep at
night. The gaps related to transportation are discussed in the chapter on Infrastructure.
Definitions
As with other human services programs, it is important to understand how the issue is
defined. These definitions result in data and statistics that convey the scope of the
issue. Homelessness is defined in various ways. Below are federal definitions and key
terms that are used when talking about youth who have run away and / or are
experiencing homelessness. These are direct quotes from federal websites.
U.S. Department of Education (ED)
Subtitle VII-B of the McKinney-Vento Homeless Assistance Act defines homeless children
and youths as follows: The term "homeless children and youths"—
A. means individuals who lack a fixed, regular and adequate nighttime residence (within
the meaning of section 11302(a)(1) of this title); and
B. includes—
i. children and youths who are sharing the housing of other persons due to loss of
housing, economic hardship, or a similar reason; are living in motels, hotels, trailer
parks, or camping grounds due to the lack of alternative adequate accommodations;
are living in emergency or transitional shelters; are abandoned in hospitals; or are
awaiting foster care placement;
ii. children and youths who have a primary nighttime residence that is a public or
private place not designed for or ordinarily used as a regular sleeping

DRAFT Lee County Human Services Gap Analysis
Secon Four: Systems of Care
Chapter 23 | Homelessness Page | 321
accommodation for human beings (within the meaning of section 11302(a)(2)(C) of
this title);
iii. children and youths who are living in cars, parks, public spaces, abandoned
buildings, substandard housing, bus or train stations, or similar settings; and
iv. migratory children (as such term is defined in section 6399 of title 20) who qualify as
homeless for the purposes of this subtitle because the children are living in
circumstances described in clauses (i) through (iii).
42 U.S.C. § 11434a(2)
Subtitle VII-B of the McKinney-Vento Homeless Assistance Act defines unaccompanied
youth as follows:
The term “unaccompanied youth” includes a youth not in the physical custody of a
parent or guardian.42 U.S.C. § 11434a(6)
U.S. Department of Housing and Urban Development (HUD)
HUD defines homelessness for their program into four categories. The categories are:
Category 1: Literally Homeless
Individual or family who lacks a fixed, regular and adequate nighttime residence,
meaning:
1. (i) Has a primary nighttime residence that is a public or private place not meant
for human habitation;
2. (ii) Is living in a publicly or privately operated shelter designated to provide
temporary living arrangements (including congregate shelters, transitional
housing and hotels and motels paid for by charitable organizations or by federal,
State and local government programs); or
3. (iii) Is exiting an institution where (s)he has resided for 90 days or less and who
resided in an emergency shelter or place not meant for human habitation
immediately before entering that institution

DRAFT Lee County Human Services Gap Analysis
Secon Four: Systems of Care
Chapter 23 | Homelessness Page | 322
Category 2: Imminent Risk of Homelessness
Individual or family who will imminently lose their primary nighttime residence,
provided that:
1. (i) Residence will be lost within 14 days of the date of application for homeless
assistance;
2. (ii) No subsequent residence has been identified; and (iii) the individual or family
lacks the resources or support networks needed to obtain other permanent
housing
Category 3: Homeless under other Federal statutes
Unaccompanied youth under 25 years of age, or families with children and youth, who
do not otherwise qualify as homeless under this definition, but who:
1. (i) Are defined as homeless under the other listed federal statutes;
2. (ii) Have not had a lease, ownership interest, or occupancy agreement in
permanent housing during the 60 days prior to the homeless assistance
application;
3. (iii) Have experienced persistent instability as measured by two moves or more
during in the preceding 60 days; and
4. (iv) Can be expected to continue in such status for an extended period of time
due to special needs or barriers
Category 4: Fleeing/Attempting to Flee Domestic Violence
Any individual or family who:
1. (i) Is fleeing or attempting to flee their housing or the place they are staying
because of domestic violence, dating violence, sexual assault, stalking, or other
dangerous or life-threatening conditions related to violence that has taken place
in the house or has made them afraid to return to the house, including:
• Trading sex for housing
• Trafficking
• Physical abuse

DRAFT Lee County Human Services Gap Analysis
Secon Four: Systems of Care
Chapter 23 | Homelessness Page | 323
• Violence (or perceived threat of violence) because of the youth’s sexual
orientation;
2. (ii) Has no other residence; and
3. (iii) Lacks the resources or support networks to obtain other permanent
housing.
U.S. Department of Health and Human Services (HHS) Definitions
The Runaway and Homeless Youth Act (RHYA)
RHYA (42 U.S.C. §5732a) defines HOMELESS YOUTH as individuals who are “less than 21
years of age...for whom it is not possible to live in a safe environment with a relative
and who have no other safe alternative living arrangement.” This definition includes
only those youth who are unaccompanied by families or caregivers. This definition is
used in connection with the Basic Center Program and the Transitional Living Program.
For the Basic Center Program, the homeless youth is an individual who is less than 18
years of age or is less than a higher maximum age if the state where the center is
located has an applicable state or local law (including a regulation) that permits such
higher maximum age in compliance with licensure requirements for child- and youth-
serving facilities.
For the Transitional Living Program, the age is defined as 16- to 21-years-old, or 22 years
of age if previously in care, under certain circumstances.
In addition, the Basic Center Program serves:
Runaway Youth —The term “runaway”, used with respect to a youth, means an
individual who is less than 18 years old and who absents himself or herself from home
or a place of legal residence without the permission of a parent or legal guardian.
And
Youth at Risk of Separation from the Family —The term “youth at risk of separation
from the family” means an individual— (A) who is less than 18 years of age; and (B) (i)
who has a history of running away from the family of such individual; (ii) whose parent,

DRAFT Lee County Human Services Gap Analysis
Secon Four: Systems of Care
Chapter 23 | Homelessness Page | 324
guardian, or custodian is not willing to provide for the basic needs of such individual; or
(iii) who is at risk of entering the child welfare system or juvenile justice system as a
result of the lack of services available to the family to meet such needs.
Finally, the Street Outreach Program (which attempts to outreach and refer youth to the
above-mentioned transitional living and runaway youth programs) has this definition of
youth who are the target of outreach:
Street Youth —The term “street youth” means an individual who— (A) is— (i) a runaway
youth; or (ii) indefinitely or intermittently a homeless youth; and (B) spends a significant
amount of time on the street or in other areas that increase the risk to such youth for
sexual abuse, sexual exploitation, prostitution, or drug abuse.

DRAFT Lee County Human Services Gap Analysis
Secon Five: Special Populaons
Section Five: Special Populations Page | 325
Secon Five: Special Populaons

DRAFT Lee County Human Services Gap Analysis
Secon Five: Special Populaons
Section Five: Special Populations Page | 326
Intenonally le blank.

DRAFT Lee County Human Services Gap Analysis
Secon Five: Special Populaons
Chapter 24 | Intellectual and Developmental Disabilities Page | 327
CHAPTER 24
Persons with Intellectual and Developmental Disabilities (IDD)
Introducon
This chapter addresses the characteristics, needs and services for persons with
intellectual and developmental disabilities. It consists of a background and context
section that presents national, State and local information. It then describes the various
services provided and with a summary of gaps. The chapter closes with a set of
definitions of various terms in the field.
Background and Context
In Florida, the agency with prime responsibility for serving persons with developmental
disabilities is the State of Florida Agency for Persons with Disabilities. Other State
agencies have significant roles, such as the Agency for Health Care Administration
(AHCA), which manages Medicaid, Vocational Rehabilitation (VR) and the Bureau of
Exceptional Education and Student Services (BEESS). In addition, other agencies are
involved as part of Employment First. The lead consumer advocate is the Florida
Developmental Disabilities Council. Nonprofits primarily provide local services using a
variety of titles, more frequently chapters of The Arc.
In 2017, there were an estimated 472,000 persons with intellectual and developmental
disabilities (IDD) in the State, 56% of whom live with families. Thirty-one percent of
these family caregivers are older than 60 (110,000)
531
. About 1.5% to 2.5% of Lee
County residents have an IDD diagnosis. Using an estimated county population of
739,000 for 2019, this would mean approximately 11,000 to 18,000 persons in the
County have an IDD. Approximately 56% of persons with IDD live with their families,
15% in their own home and 29% in a licensed residential facility.
532
With respect to financial support for these persons, Florida ranks 49
th
out of the 50
states, and spends less than $2 per $1,000 of aggregate statewide personal income
533
531
State of the States report. 2019. Florida Developmental Disabilities Council
532
2019 IBudget Waiver Redesign. 2019. Tallahassee, FL: Agency for Persons with Disabilities.
533
Lipinski, A. & Breen, V. 2019. Florida’s fiscal effort ranks second to last in total IDD spending. Fact Sheet.
Tallahassee: Florida Developmental Disabilities Council.

DRAFT Lee County Human Services Gap Analysis
Secon Five: Special Populaons
Chapter 24 | Intellectual and Developmental Disabilities Page | 328
per person for IDD services. It ranks 46
th
in paying for group home care and 44
th
for
supported living. Several of the gaps identified in this analysis relate directly to funding.
What are the qualifying factors to be considered as a person with an intellectual and/or
developmental disability? Persons with an affirmative response to any of the following
are considered to have an IDD:
• Deafness or serious difficulty in hearing (all ages)
• Blindness or serious difficulty in seeing (all ages)
• Serious difficulty in concentrating, remembering or making decisions because of a
physical, mental or emotional condition (5 years or older)
• Serious difficulty walking or climbing stairs (5 years or older)
• Difficulty dressing or bathing (5 years or older)
• Difficulty doing errands alone (e.g., visiting a doctor’s office or shopping) because of
a physical, mental, or emotional condition (15 years or older)
Among people who report serious limitations, 46% report mobility disability, 39% report
problem-solving or concentration limitations, 26% report hearing and 21% report vision,
with 43% reporting more than one limitation.
534
534
Centers for Disease Control and Prevention. CDC grand rounds: public health practices to include persons with
disabilities. MMWR Morb Mortal Wkly Rep. 2013;62(34):697---701.

DRAFT Lee County Human Services Gap Analysis
Secon Five: Special Populaons
Chapter 24 | Intellectual and Developmental Disabilities Page | 329
The Challenges underlying the major gaps
The major challenges facing persons with IDDs in Florida and Lee County are listed
below. These challenges provide the context for the specific gaps discussed in this
chapter. These challenges include:
The Wait List
In FY 2017, approximately 6% (19,000) of the 350,000 family caregivers received services
from the Agency for Persons with Disabilities (APD). The June 2019 waitlist was 21,661
persons.
535
In Lee County there are approximately more than 500 persons on the list.
536
Aging Caregivers
Approximately 71% of individuals with IDDs live at home (with their family or on their
own). Data from the State of the States in Developmental Disabilities report finds that in
Florida 31% of individuals living with a family have a caregiver age 60 or older,
approximately 75% higher than the national rate. That translates to more than 75,000
individuals with developmental disabilities with caregivers age 60 or older in Florida, the
third-most populous state.
537
Dual Diagnoses – Lack of a continuum of care
Nationally, it is estimated that 30% to 35% of all people with an IDD also have a mental
health diagnosis. Families find difficulty navigating between different agencies for
treatment and support services. Most of the available mental health services do not
have adaptations required for those who have co-existing IDD diagnoses. Individuals and
families need a continuum of care that specializes in the needs of those with IDDs and a
co-existing mental health diagnosis.
There is no integrated system or continuum of care to meet the needs of dually
diagnosed individuals.
535
Lulinski, op.cit
536
Wait List Data, June 2019. Tallahassee, FL: Agency for Persons with Disabilities.
537
State of the States in Developmental Disabilities. Boulder, CO: University of Colorado, Administration on
Intellectual and Developmental Disabilities, and National Institute on Disability and Rehabilitation Research, as
cited in “Living in the Community: Options for Floridians with Disabilities.” Report by ROOF/FDDC, p. 17.

DRAFT Lee County Human Services Gap Analysis
Secon Five: Special Populaons
Chapter 24 | Intellectual and Developmental Disabilities Page | 330
Staffing
The purpose of the Medicaid iBudget Waiver is to provide home and community-based
supports and services to eligible persons with developmental disabilities living at home
or in a home-like setting, utilize an individual budgeting approach, and provide
enhanced opportunities for self-determination.
538
In the IDD field, staff pay is tied to
rates for services in the iBudget Waiver. In effect, this means most employees are paid
in the $10-per-hour range. It is difficult to retain these persons as the job market is tight
and there are jobs available with starting pay of $12 per hour. In addition to the normal
challenges of providing quality care with regular turnover, some people with an iBudget
Waiver are unable to obtain services due to staffing shortages. The State’s practice of
keeping rates lower exacerbates this staffing challenge.
Underserved Groups
There are six groups that could be considered as underserved. These include:
Persons with IDDs who have co-occurring mental health issues. These persons
are highly likely to be unemployed and represent a group that is hard to
employ from an agency perspective.
People who are a member of a minority group. People who are of minority
status may face several challenges. Some have limited English proficiency and
find it difficult to communicate their needs and concerns. Second, some are
fearful of contact with public agencies for various reasons. Third, there may be
the perception of bias toward them or they may not feel welcomed.
Any person with limited English proficiency. Florida is a highly diverse state
linguistically with more than 200 languages and dialects. People who are not
conversant in English are less likely to be aware of services or feel comfortable
attempting to contact those services.
People with limited computer skills/people without internet access. There are
a plethora of resources on the internet and more and more work is done via
the web. Those who do not have ready access to the internet, or who are
uncomfortable in that environment are likely to be less aware of services and
538
https://ahca.myflorida.com/Medicaid/hcbs_waivers/ibudget.shtml

DRAFT Lee County Human Services Gap Analysis
Secon Five: Special Populaons
Chapter 24 | Intellectual and Developmental Disabilities Page | 331
therefore are likely to be underserved.
The deeply transportation challenged. As noted earlier as well as in the
Transportation Report, many persons with developmental disabilities can
access transportation services either through public programs or family and
friends. A small percentage of people do not have these services available or
don’t have the support systems that help them obtain transportation. Given
this gap, they are likely to be underserved.
Families who are not in crisis. Due to iBudget funding limitations, the only
practical way to access iBudget funding is for the person to be in crisis such as
death or disability of the family that has been supporting them.
The Gaps
Employment
Context and Background
According to the 2013-2017 American Community Survey 5-Year Estimate, there are 2.5
million Floridians age 16 and older who have a disability of some type. Of those, only
18.8%, or 473,979, are employed.
539
The National Core Indicators (NCI) study, focused
on persons with developmental disabilities, found that 10% of respondents from
Florida had a paid job.
540
Yet research indicates that that almost half of individuals
who are not working in the community want a job.
541
Thinking about employment for persons with intellectual and developmental
disabilities has evolved over time as Figure 30 illustrates. The current approach is
labeled “Employment First.” Employment First is the work expression of the
philosophical and conceptual developments that emphasize both the ability and
right of persons with IDDs to live, play and work in everyday communities.
Employment First is self-determination, self-advocacy and community inclusion in
that they are research-based ideas and findings that in turn shape policy and
strategy, which leads to system and practice change.
539
Success stories, Vocational Rehabilitation. http://www.rehabworks.org/docs/success_booklet.pdf
540
NCI State Adult Consumer Survey State Outcomes, 2012-2013
541
Ibid.
DRAFT Lee County Human Services Gap Analysis
Secon Five: Special Populaons
Chapter 24 | Intellectual and Developmental Disabilities Page | 332
Figure 30. Employment First
The Gaps Related to Employment
Obtaining and maintaining employment is an on-going challenge for persons with IDDs.
The most significant barrier – transportation – is examined separately below. In
addition to transportation, other gaps and barriers include:
• The shift to web-based applications. Job searches and applications are
increasingly web-based. This creates barriers for some.
• Employer perceptions and attitudes.
542
Employers underestimate the talent and
skills of people with any disabilities (70.67%). Table 98 below lists those various
perceptions.
• Workplace assistance. A study of barriers to the use of workplace assistance
services found the following barriers:
543
Lack of awareness or knowledge of the services
A fear of employer resistance
A concern about the appropriateness of such services in the workplace
Logistical challenges
542
VR Need Assessment Survey, 2015
543
Neri, M. no date. Barriers to the use of workplace assistance services. University of California.
Perception that
Persons with IDD
aren't capable of
work
Supported
Employment
Customized &
Self Employment
Employement
First

DRAFT Lee County Human Services Gap Analysis
Secon Five: Special Populaons
Chapter 24 | Intellectual and Developmental Disabilities Page | 333
• Assistive technology challenges. User feedback on assistive technology provided
through the Florida Alliance for Assistive Services and Technology (FAAST) or
other venues included the following concerns stated by users:
544
Quality: Quality of wheelchairs poor;
Replacement schedule: Medicaid program is rigid on replacement
Persons can only get wheelchair every five years; low reimbursement for
replacement.;
Technical assistance and maintenance: Maintenance is not funded. i-Pads
and similar electronic tools need technical assistance and support to fix
when broken and there are low reimbursement for repairs.;
Wait times: Long waits for adaptive equipment.; and
Assistance: FAAST is trying to improve access/loan program, basic chair
is covered, but not an adapted chair.
• Work Schedules. Persons with IDDs are frequently prevented from
working nights and on weekends because of the lack of flexibility in the
structure of their service delivery supports, living situation and limited
transportation options.
545
Given that many service jobs require such hours,
this limits their choices.
• Safety. Families often have concerns about the safety of their family
member when in an employment setting – or any other community setting
for that matter.
• Potential loss of benefits. The concern is that if the family member makes
too much money he/she may lose Medicaid coverage or other supports that
are based on income levels.
544
Personal communication. FAAST.
545
Ibid.
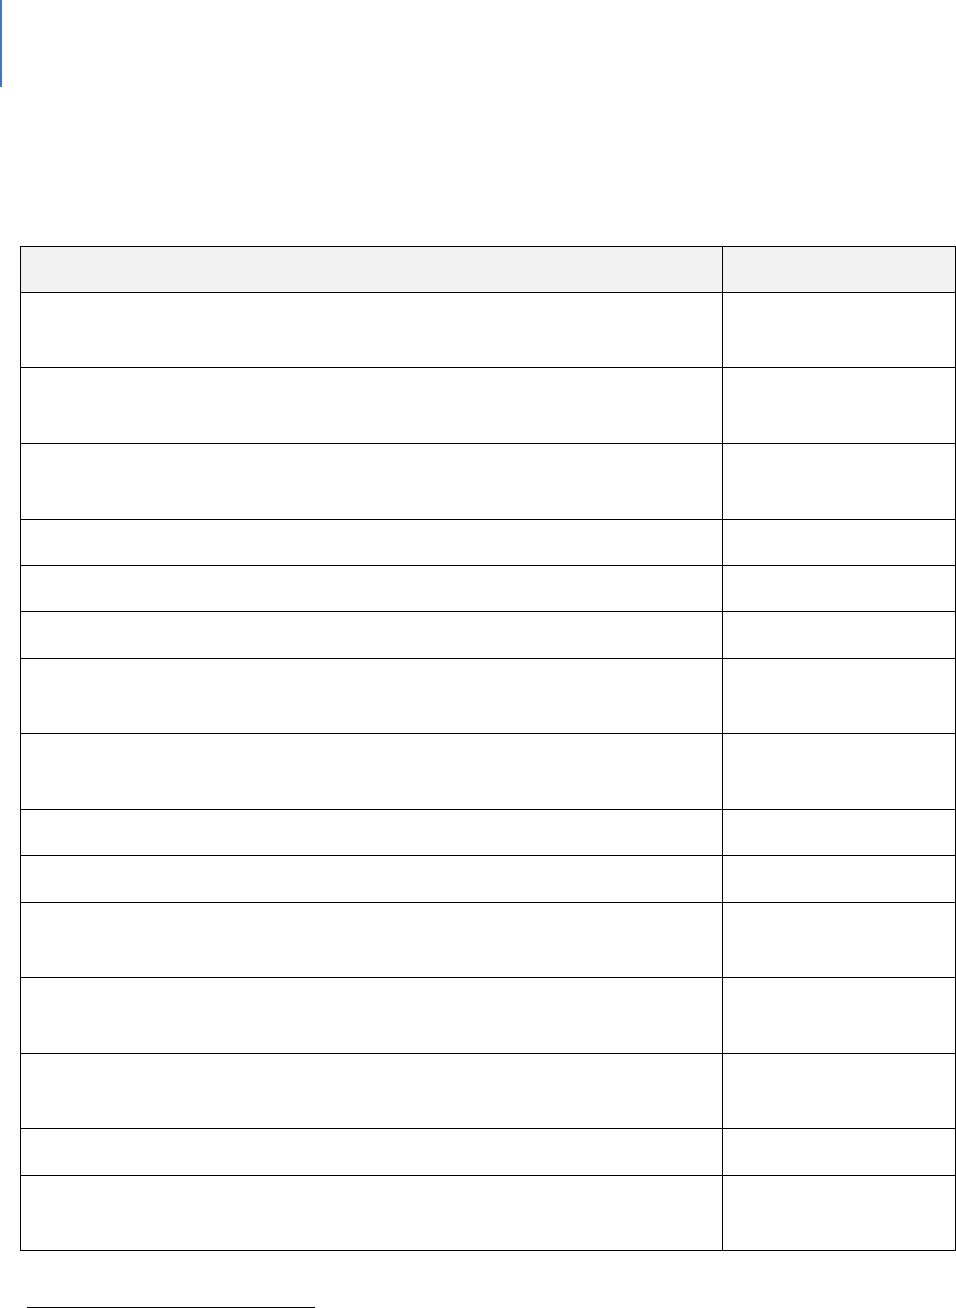
DRAFT Lee County Human Services Gap Analysis
Secon Five: Special Populaons
Chapter 24 | Intellectual and Developmental Disabilities Page | 334
Table 98. Perceptions of Barriers to Hiring Persons with Disabilities (PWD)
Governor’s Commission on Jobs for Floridians with Disabilities
546
Potential Barrier
Mean Score*
Employees with Disabilities have physical and/or stamina restrictions
on their assigned job duties
3.000
There are health and safety concerns with hiring PWDs in this
organization
2.957
Cost increases attributable to extending health, life, and/or disability
coverage are too high
2.936
Type of work in this organization is unsuitable for PWDs
2.894
Organization lacks access/facilities/equipment suitable for PWDs
2.823
Cost of accommodations for PWDs is too high
2.816
PWDs lack the specific job-related experience required of job
applicants for this organization
2.766
Employees with disabilities require additional management and
supervisory time
2.752
Cost of training PWDs is too high
2.738
Employees with disabilities lack the ability to travel for work
2.638
PWDs lack the requisite skills and training of job applicants for this
organization
2.631
Employees with disabilities lack the ability to work under great time
pressure and stress
2.624
Employees with disabilities create additional workload for the HR
staff
2.596
Employees with disabilities tend to be less productive
2.454
Organization is concerned about potential negative reactions from
clients and customers
2.390
546
Source: Born, Patty and Dumm, Randy. “Key Factors that Assist Employers to Recruit, Interview, Hire and Retain
People with Disabilities.” Prepared for The Able Trust through Florida State University, June 2011. p.8
DRAFT Lee County Human Services Gap Analysis
Secon Five: Special Populaons
Chapter 24 | Intellectual and Developmental Disabilities Page | 335
Potential Barrier
Mean Score*
Employees with disabilities tend to have poor attendance and
punctuality records
2.348
Staff may feel uncomfortable if asked to work with a PWD
2.298
*Respondents were asked to indicate on a scale from 1 to 5 (where 1 indicates “strongly
disagree” and 5 indicates “strongly agree”) to rate their perception of each of these barriers.
The results show an average score per barrier sorted from high to low.
• Self-employment barriers. System type barriers identified in the assessment
of Florida’s self-employment pilot included:
Complicated Work Incentives for those seeking self-employment. Federal work-
incentive policies are geared toward wage employment and are very
complicated relative to funding self-employment for persons with
developmental disabilities;
547
Funding Challenges for those seeking self-employment. Policies and funding in
Vocational Rehabilitation, Social Security and Medicaid are geared toward wage
employment and pose barriers to self-employment;
548
Agency and staff attitudes. Agencies and their staff are oriented to
thinking in terms of wage employment and do not view self-employment
as an option;
549
Know-how. Some of the key players involved in service delivery do not
possess either formal training or depth of knowledge in what it takes to start
a small business and what kinds of support persons with disabilities would
need to succeed as entrepreneurs;
550
and
Policies that Lead to Financial Disincentives for Self-Employment. People with
disabilities are concerned about the risk of losing disability benefits because of
earnings from a small business.
551
• Attitudes and Culture about Employment of persons with IDD. Finally, there
547
Self-employment, op.cit. pg. 35.
548
Ibid. pg. 35.
549
Ibid. pg. 34.
550
Ibid. pg. 34.
551
Ibid. pg. 35.

DRAFT Lee County Human Services Gap Analysis
Secon Five: Special Populaons
Chapter 24 | Intellectual and Developmental Disabilities Page | 336
are the barriers of attitude and culture, comfort with existing practices and
existing systems that reinforce those practices as discussed in the summary
section. Some additional barriers not discussed in the summary section
include:
Prioritizing individual jobs over group supported employment. The data
suggest that individual employment yields higher levels of income and
an array of job choices than does group supported employment, even
though people in group-supported employment work more hours on
average. Individuals in group-supported employment were also more
likely to report that they want to work elsewhere. The benefits and
advantages of individual employment should be reflected in policy and
operational practices that prioritize individual employment outcomes.
552
Consistency in service planning and supporting career goals. The Florida
Employment First Findings Report found that “employment is not
perceived as a priority within the service planning process.”
553
Other
data suggest that almost half of individuals who are not working in the
community want a job, but one study found that only 26% of those
who want a job have community employment as a goal in their
service plan. Ensuring that employment is identified as a priority
during everyone’s plan and providing training to staff are priorities.
554
Gaps in know-how. As the job market changes and new expectations
emerge for persons with IDDs, the question will arise as to whether
professional staff have the training or depth of knowledge in what it takes to
succeed as a job coach in newer fields of work. Staff training and cross-
system collaboration and capacity building will be a significant challenge.
Increased technical assistance. There is a need for the Agency for
Persons with Disabilities (APD) to offer greater technical assistance or
consultation resources to provider organizations to assist them in
expanding or improving employment
School focus. There is a need for a more consistent emphasis on
552
Ibid.
553
Ibid., pg. 8.
554
Ibid.

DRAFT Lee County Human Services Gap Analysis
Secon Five: Special Populaons
Chapter 24 | Intellectual and Developmental Disabilities Page | 337
employment in schools and during the transition process.
555
There is
also the need to address the home-schooling area.
Greater consistency in communications to families. The Florida
Employment First Findings Report identified a need to improve the
information flow to families, particularly addressing the gap between
those on a waiver and those not on it.
556
Increased support to employers. The Florida Employment First Findings
Report identified a need to provide increased employer support in the
context of job changes that are reducing employer interest in persons
with disabilities.
557
Inconsistent Performance Expectations of Involved Agencies. Gaining
greater employment opportunities for individuals with developmental
disabilities will require collaboration across multiple entities working at
federal, State and local levels. Yet each entity has its own performance
metrics, which may be inconsistent with the program goal.
A Single Point of Contact is needed.
558
This gap has been identified and
hopefully will be eliminated or ameliorated by a new web portal called
Abilities Work.
Not everyone prefers the Employment First Approach. For people who
have 20 years or more in other employment models, Employment First
is a poor fit from their perspective. They did not receive the public
education supports that current graduates have had. They have been in
more sheltered or structured employment settings that they are
comfortable and satisfied with. There is the need for a dual approach
fitted to the history and expectations of various sub-groups of persons
with IDD.
555
Ibid. pg. 16.
556
Ibid., pg. 16.
557
Ibid. pg. 18.
558
Ibid, pg. 6.

DRAFT Lee County Human Services Gap Analysis
Secon Five: Special Populaons
Chapter 24 | Intellectual and Developmental Disabilities Page | 338
Transportation
Context and Background
This is perhaps the primary barrier to employment; 76% of persons with
developmental disabilities who are seeking a job need transportation (personal or
public) (76.16%).
559
Transportation was also identified as the most significant
barrier in the Governor’s Commission 2014 report.
560
It is also a barrier in other life
tasks.
The Gaps Related to Transportation
There are several dimensions to this barrier. These include:
Many paratransit systems operate with limited hours and relatively long (45-
minutes to an hour) client pick-up windows. These limitations imposed in
many paratransit systems effectively limit employment opportunities.
A significant obstacle to greater utilization of public transportation by
individuals with IDDs is the amount of funding available to provide trips,
particularly paratransit trips, which are more expensive than trips taken on a
fixed-route system.
An additional challenge results from the continued heavy reliance on
informal means of transportation (caregivers, family members and friends).
This poses a unique challenge to the transportation system as it relates to
persons with IDDs because of the large number of caregivers older than 60.
As caregivers age, their own issues can make it more difficult for them to be
a reliable source of transportation for work.
Demand nationally falls far below capacity; 75% of actual demand was not
serviced in FY 2013-2014.
561
There is a variance in County capacity to meet demand. Actual demand met
at the County level ranges from a low of 1.38% in rural Gilchrist County to a
high of 289.94% in Miami-Dade County. In other words, Miami-Dade County
559
VR Need Assessment Survey, 2015
560
2014 Governor’s Commission on Jobs for Floridians with Disabilities Report, pg. 4.
561
Unmet and Latent Demand for Transportation Disadvantaged Services, p. 39. Note: There was no significant
reduction in the numbers of transportation disadvantaged individuals between FY 2012-2013 and FY 2013-2014.

DRAFT Lee County Human Services Gap Analysis
Secon Five: Special Populaons
Chapter 24 | Intellectual and Developmental Disabilities Page | 339
transit providers achieved more overall actual trips than the number needed
to serve the transportation disadvantaged population alone. Lee County had
a 3.32%.
562
Health
Context and Background
People with disabilities consistently report higher rates of obesity, lack of physical
activity and smoking. Some also have higher rates of newly diagnosed cases of diabetes
and their percentages of cardiovascular disease are three to four times higher.
563
Although they have higher rates of chronic diseases than the general population, adults
with disabilities are significantly less likely to receive preventive care. As an illustration,
people with cognitive limitations are up to five times more likely to have diabetes than
the general population
564
People with disabilities are a health disparity population. Health disparities refer to
differences in health outcomes at the population level, differences that are linked to a
history of social, economic or environmental disadvantages, and for which there is
general agreement that these differences are avoidable.
Adults with intellectual or other developmental disabilities (IDD) face a cascade of
health disparities. They often.
565
have complex or difficult-to-treat medical conditions
have difficulty accessing health care
may receive inadequate health care
may have difficulties expressing their symptoms and pain
receive little attention to wellness, preventive care and health promotion
562
CUTR report provided by Robert Codie, Lee Tran
563
Reichard A, Stolzle H, Fox MH. Health disparities among adults with physical disabilities or cognitive limitations
compared to individuals with no disabilities in the United States. Disabil Health J. 2011;4 (2):59---67.
564
Reichard A, Stolzle H. Diabetes among adults with cognitive limitations compared to individuals with no
cognitive disabilities. Intellect Dev Disabil. 2011;49(3):141---154.
565
http://vkc.mc.vanderbilt.edu/etoolkit/resources/

DRAFT Lee County Human Services Gap Analysis
Secon Five: Special Populaons
Chapter 24 | Intellectual and Developmental Disabilities Page | 340
The Gaps Related to Health
There is a critical lack of primary care, dental and specialty medical personnel to treat
the health care needs of individuals with disabilities.
Medicare and Medicaid reimbursement to providers is significantly below the
reimbursement from other health insurance sources, discouraging practitioners from
serving the populations such as individuals with IDDs who depend primarily on these
government insurance programs.
There is fragmented Health Care Financing for Persons with IDDs.
566
The fragmentation
of the health care financing resources for individuals with IDDs aggravates these
disparities. Consumers are not the “customer” of Medicaid; the providers of services
who are paid to provide care are the “customers.” Although surveys are done with
individuals with IDDs who are enrolled in the Medicaid support waiver, there is no
organized quality improvement at the level of the individual related to their basic health
and medical status provided under the Medicaid state plan. More than half of the
individuals with IDDs who are enrolled in the basic state plan are on the waiting list for
the support waiver, and have virtually no interaction with a case manager except to
update their eligibility. The person working with clients on the support waivers is
focused primarily on the services paid by the waiver, not health care received on a fee
for service basis. When wheelchairs or other assistive technology is inadequate for the
individual’s need, those expenditures are driven by the federal Medicaid rules, and
there is no authority by either the Agency for Health Care Administration (ACHA) or the
Agency for People with Disabilities (APD) to challenge those rules.
Persons with IDDs have more complex medical needs than do the general population
and require access to medical care from a network of providers that are knowledgeable
in treating persons with their disabilities. Every major report addressing the poor health
of people with IDDs has called for improvements in training of health care providers
about adults with disabilities. Improved training of health care providers can support
earlier identification and intervention for children with disabilities, improved services for
youths with disabilities transitioning into the adult-care system and improved health
care and health promotion for adults with disabilities including IDDs. During times of
566
Ervin, D. 2014. Healthcare for Persons with Intellectual and Developmental Disabilities.
Nim.ncbi.nih.gov/pmc/articles/PMC409823
DRAFT Lee County Human Services Gap Analysis
Secon Five: Special Populaons
Chapter 24 | Intellectual and Developmental Disabilities Page | 341
emergency or in disaster situations, persons with disabilities an be especially
vulnerable.
567
One gap related to the need for specialized health professionals is that the transition
from pediatric to adult health care can be challenging for individuals with IDD.
Housing
Context and Background
For a multitude of reasons, housing is a critical element in the wellbeing of individuals
with IDD. Housing not only provides physical shelter; it is also a significant factor in
providing a stable and supportive environment for individuals with IDDs. Housing is not
solely an important issue for multiple reasons, it also is a multi-faceted issue. Three key
elements (affordability, location and physical environment and availability of amenities
and services) serve as a framework through which to review housing gaps. Figure 31
illustrates these components.
Figure 31. Housing Components
567
Rubin, L. et.al. 2016. Health care for persons with disabilities. New York: Springer
Location &
Physical
Environment
Access to
Amenities &
Services
Affordability
and
Availability

DRAFT Lee County Human Services Gap Analysis
Secon Five: Special Populaons
Chapter 24 | Intellectual and Developmental Disabilities Page | 342
In Florida 31% of individuals living with a family have a caregiver age 60 or older, which
is approximately 75% higher than the national rate. That translates to more than 75,000
individuals with IDDs with caregivers age 60 or older in Florida, the third most-populous
state.
The Gaps Related to Housing
Connected Housing Post-Family-Care. Assessing these figures, it becomes
apparent that many individuals may need to transition from ad-hoc family-based
housing and transportation systems to available systems when their aging
caregiver dies or becomes incapacitated. Given the numbers of individuals
involved – nationally and in Florida by extension – it is expected that demand for
housing in areas readily connected to services, supports and effective
transportation may increase to a significant degree.
Stereotypes and prejudices. Landlords are sometimes reluctant to rent to
people with IDD, due to various stereotypes and prejudices.
Affordability and residential choice. The issue of housing costs and affordability
is particularly important when placed side-by-side with data from the National
Core Indicators (NCI) Florida results. NCI Florida results show that 50% of
respondents did not choose where they live. Forty percent did not choose with
whom they live.
568
Affordability by its nature impacts residential choice, which in
turn limits residential options. Similarly, location and physical environment
similarly impact residential choice and options.
Cost-burden. With respect to the cost-burden for households in Florida with at
least one person with a disability (including but not limited to IDD households),
the following table (Table 99) illustrates the cost-burden for these households.
For example, for extremely low-income households (30% AMI) with a disabled
individual, 66% of these households (171,083 households) have a housing cost-
burden greater than 50% of their income.
569
(AMI is average monthly income for
all households).
568
“What We Learned from the National Core Indicators (NCI) Adult Consumer Survey: Results from People Across
Florida That Used NCI in 2011-12.” Alexandria, VA: National Association of State Directors of Developmental
Disabilities Services and Human Services Research Institute, 2012: pp. 14-15.
569
State of Florida Consolidated Plan, FFY 2011-2015. Tallahassee: Department of Community Affairs, p. 15.
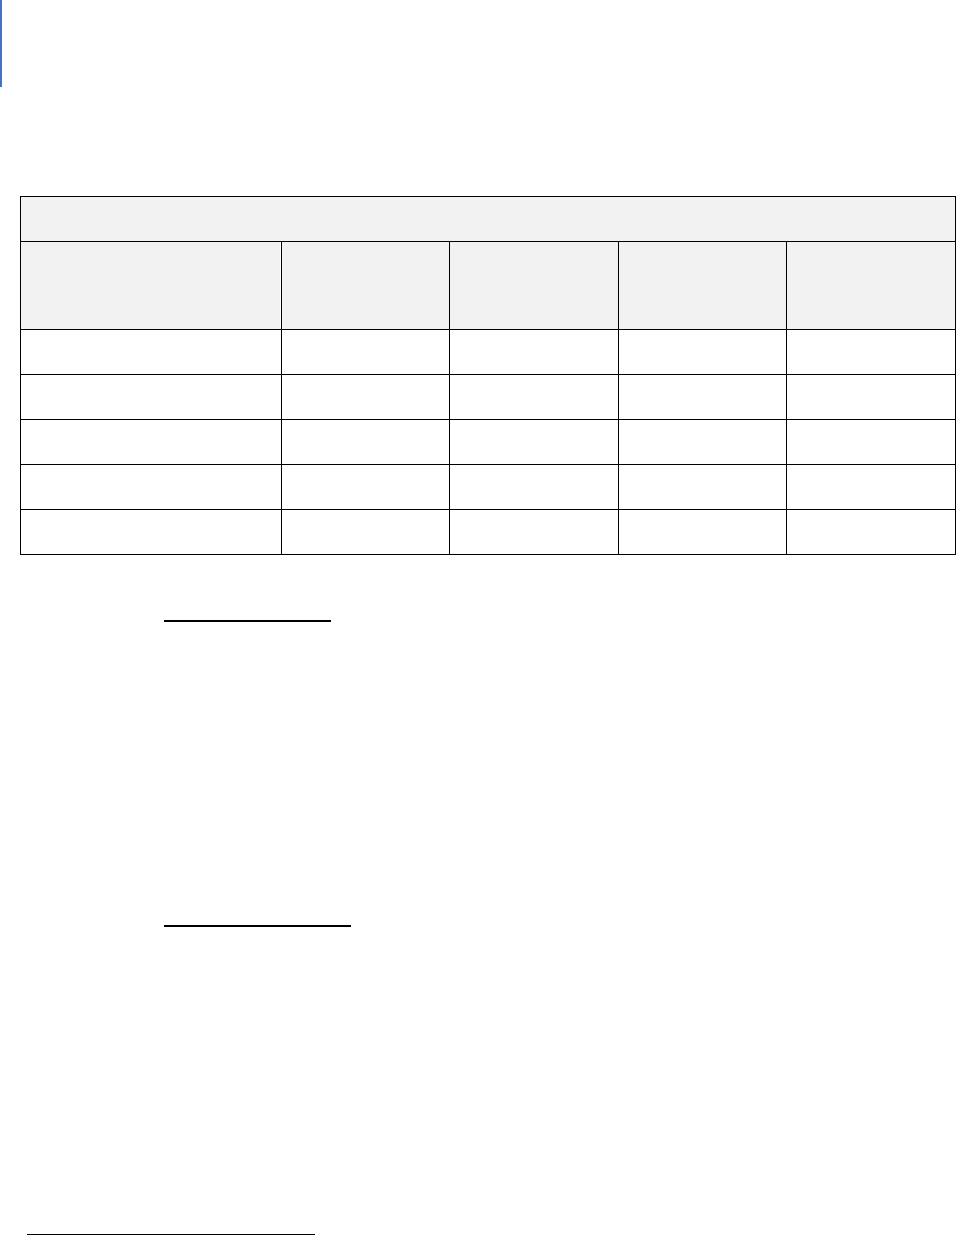
DRAFT Lee County Human Services Gap Analysis
Secon Five: Special Populaons
Chapter 24 | Intellectual and Developmental Disabilities Page | 343
Table 99. Cost Burden for Households in Florida Including At Least One Person with a Disability
(Age 5+)
570
Cost Burden
Household Income
Less Than 30%
30.01% to 50%
Greater Than
50%
Total
Households
30% of AMI or Less
56,629
30,900
171,083
258,612
30.01% to 50% AMI
76,256
72,058
124,361
272,675
50.01% to 80% AMI
163,797
108,360
74,221
346,378
80.01% to 120% AMI
220,205
79,180
29,280
328,665
Grand Total
516,887
290,498
398,945
1,206,330
Spatial mismatch. Spatial mismatch analysis, in the social sciences, has been
traditionally employed to illustrate the disconnect between the location of low-
income neighborhoods and available job opportunities. The absence or relative
weakness of public transportation systems in many areas has traditionally
exacerbated this spatial mismatch.
571
In general terms, spatial mismatch means
that housing and other elements of daily life are spread far apart; it’s hard to get
from housing to these other activities (especially employment) on a regular
basis.
Voucher Programs. Voucher programs provide direct rental assistance to eligible
families, including families with members that possess an IDD. There are two
primary voucher programs that target individuals with disabilities: Non-Elderly
People with Disabilities (NED) vouchers and Mainstream five-year vouchers.
There also is an NED Category 2 voucher program. However, NED Category 2
pertains to a more limited universe of individuals transitioning from nursing
homes to the community. Figure 32 details the location and availability of
570
State of Florida Consolidated Plan, FFY 2011-2015, p. 15. Original data sources for chart: Shimberg Center for
Housing Studies, 2009 American Community Survey.
571
For a primer on the historic use of spatial mismatch theory, please see Kain, John F. "Housing Segregation,
Employment, and Metropolitan Decentralization". Quarterly Journal of Economics 82 (2): 175–197 (1968).; and
Kain, John F. "A pioneer's perspective on the spatial mismatch literature". Urban Studies 41 (1): 7–32 (2004).
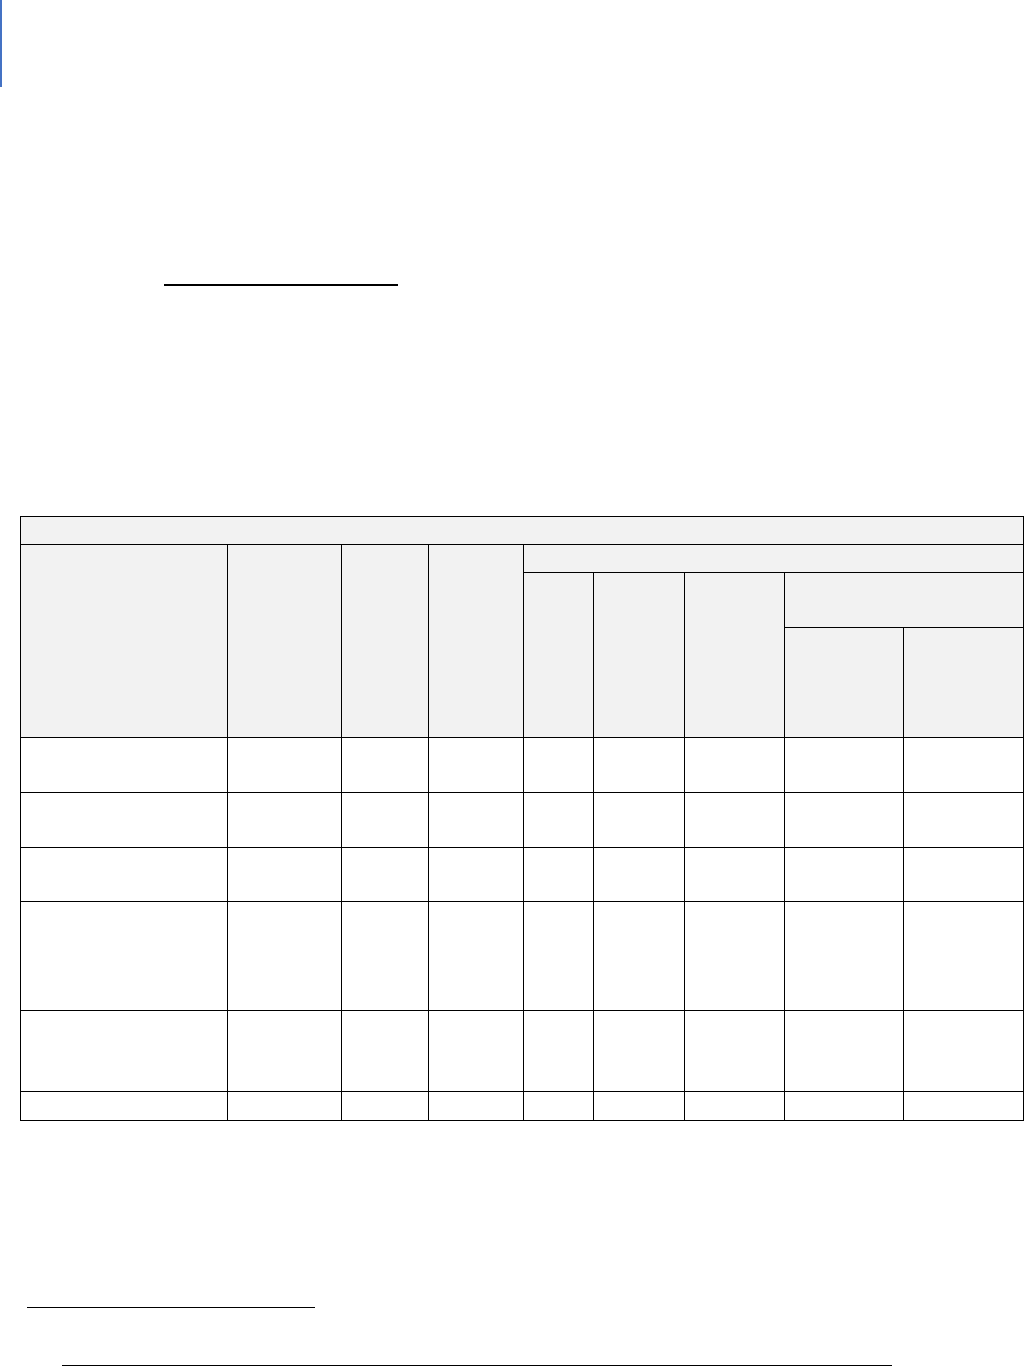
DRAFT Lee County Human Services Gap Analysis
Secon Five: Special Populaons
Chapter 24 | Intellectual and Developmental Disabilities Page | 344
NED/Mainstream Housing Vouchers for Individuals with Disabilities in Florida.
572
The Housing Authority of the City of Fort Myers (HACFM) has 40 Mainstream
Vouchers.
Public Housing Wait List. The waiting list for public housing had 2,784 applicants,
17 of which self-identified as disabled. The Public Housing Agency (PHA)
reported that most applicants do not answer questions regarding accessibility
needs. The most common needs are basic handrails in the bathroom, ramps for
the door and basic items that HACFM can provide quickly.
Table 100. Other HACFM data: Characteristics of Residents
Program Type
Certificate
Mod-
Rehab
Public
Hearing
Vouchers
Total
Project-
based
Tenants-
based
Special Purpose
Voucher
Veteran
Affairs
Supportive
Housing
Family
Unification
Program
# Homeless at
admission
0
0
9
0
0
0
0
0
# of Elderly Program
Participants (>62)
0
0
331
578
22
471
85
0
# of Disabled
Families
0
0
119
627
26
533
68
0
# of Families
requesting
accessibility
features
0
0
786
2073
11
1970
70
22
# of HIV/AIDS
program
participants
0
0
0
0
0
0
0
0
# of DV victims
0
0
0
0
0
0
0
0
Characteristics of Public Housing Residents by Program Type
572
Source for Figure 3: “Database of Vouchers for People with Disabilities.” Technical Assistance Collaborative.
URL: http://www.tacinc.org/knowledge-resources/vouchers-database/?state=FL&submit.x=8&submit.y=14
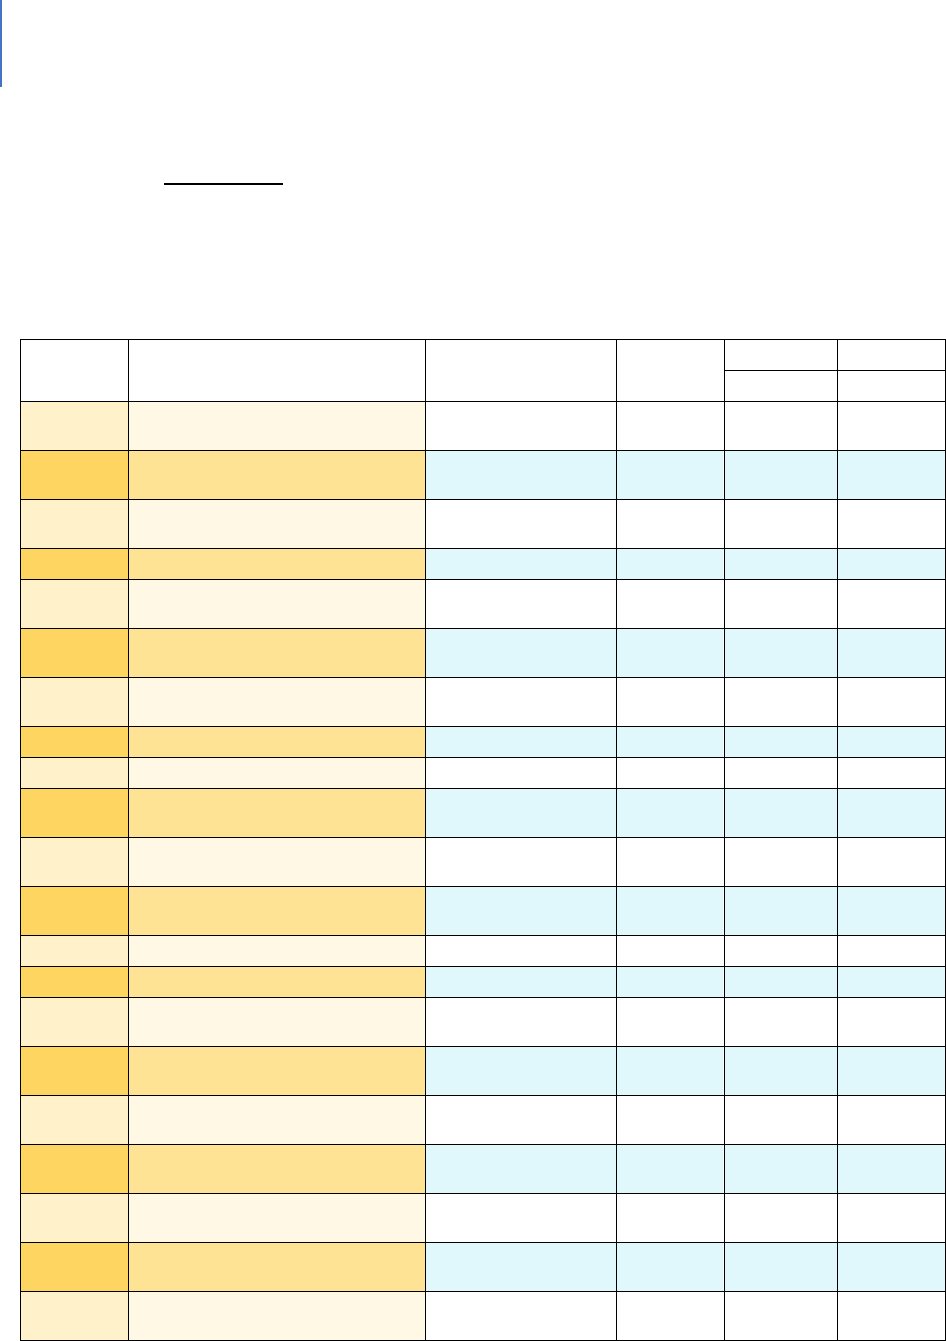
DRAFT Lee County Human Services Gap Analysis
Secon Five: Special Populaons
Chapter 24 | Intellectual and Developmental Disabilities Page | 345
Alternate Data Source Name: 2019 HACFM PHA Data
Accessibility. A portion of individuals with IDD have mobility issues. Finding
homes that have a variety of accessibility features is challenging even setting cost
aside.
Figure 32. NED/Mainstream Housing Vouchers for Individuals with Disabilities in Florida
State
PHA Name
City
NED
Mainstrm
NED
5 Yr
Cat 2
FL
Alachua County Housing
Authority
Gainesville
0
75
0
FL
Boley Centers for Behavioral
Health Care
St. Petersburg
0
181
0
FL
Broward County Housing
Authority
Lauderhill
75
50
0
FL
Carrfour Supportive Housing
Miami
0
50
0
FL
City of Pensacola Housing
Authority
Pensacola
50
0
0
FL
Clearwater Housing Authority
Clearwater
0
75
0
FL
Collier County Housing
Authority
Immokalee
0
0
25
FL
Crestview Housing Authority
Crestview
0
0
0
FL
Deland Housing Authority
Deland
0
0
0
FL
Fort Walton Beach Housing
Authority
Fort Walton Beach
0
0
0
FL
Gainesville Housing Authority
Gainesville
0
0
0
FL
Hernando County Housing
Authority
Brooksville
0
0
0
FL
Hialeah Housing Authority
Hialeah
298
0
0
FL
Hillsborough County-BOCC
Tampa
100
0
0
FL
Housing Authority of Boca
Raton
Boca Raton
75
0
0
FL
Housing Authority of Brevard
County
Merritt Island
200
0
0
FL
Housing Authority of Lee
County
North Fort Myers
0
0
0
FL
Housing Authority of New
Smyrna Beach
New Smyrna
Beach
0
0
0
FL
Housing Authority of the City of
Cocoa
Merritt Island
75
0
0
FL
Housing Authority of the City of
Daytona Beach
Daytona Beach
0
0
0
FL
Housing Authority of the City of
Deerfield Beach
Deerfield Beach
52
0
0
DRAFT Lee County Human Services Gap Analysis
Secon Five: Special Populaons
Chapter 24 | Intellectual and Developmental Disabilities Page | 346
State
PHA Name
City
NED
Mainstrm
NED
5 Yr
Cat 2
FL
Housing Authority of the City of
Fort Lauderdale
Fort Lauderdale
0
0
0
FL
Housing Authority of the City of
Fort Myers
Fort Myers
0
0
0
FL
Housing Authority of the City of
Fort Pierce
Fort Pierce
100
0
0
FL
Housing Authority of the City of
Lakeland
Lakeland
0
20
0
FL
Housing Authority of the City of
Miami Beach
Miami Beach
0
0
0
FL
Housing Authority of the City of
Sarasota
Sarasota
0
0
0
FL
Housing Authority of the City of
St. Petersburg
St. Petersburg
0
0
0
FL
Housing Authority of the City of
Stuart
Stuart
0
0
0
FL
Housing Authority of the County
of Flagler
Bunnell
0
0
0
FL
Housing Partnership
West Palm Beach
0
75
0
FL
Indian River County Board of
County Comm
Vero Beach
0
0
0
FL
Jacksonville Housing Authority
Jacksonville
0
0
0
FL
Miami-Dade Housing Authority
Miami
210
75
0
FL
NW Florida Regional Housing
Authority
Graceville
0
0
0
FL
Ocala Housing Authority
Ocala
0
0
0
FL
Orange County Comm Orange
County
Orlando
0
0
0
FL
Orlando Housing Authority
Orlando
400
0
0
FL
Ormond Beach Housing
Authority
Ormond Beach
0
0
0
FL
Pahokee Housing Authority
Pahokee
0
0
0
FL
Panama City Housing Authority
Panama City
0
0
0
FL
Pasco County Housing
Authority
Dade City
0
0
0
FL
Pinellas County Housing
Authority
Clearwater
0
0
0
FL
Punta Gorda Housing Authority
Punta Gorda
25
0
0
FL
Seminole County Housing
Authority
Oviedo
0
0
0
FL
Tallahassee Housing Authority
Tallahassee
0
75
0
DRAFT Lee County Human Services Gap Analysis
Secon Five: Special Populaons
Chapter 24 | Intellectual and Developmental Disabilities Page | 347
State
PHA Name
City
NED
Mainstrm
NED
5 Yr
Cat 2
FL
Tampa Housing Authority
Tampa
150
0
0
FL
Titusville Housing Authority
Titusville
125
0
0
FL
Walton County Board of County
Comm
De Funiak Springs
0
0
0
FL
West Palm Beach Housing
Authority
West Palm Beach
175
0
0
Educaon System
Context and Background
A range of programs designed to assist persons with IDDs from birth through post-
secondary education exist.
The Gaps Related to Education
Some of the gaps within this program range include:
• There is a need for additional local outreach and early identification to overcome
the barriers that often immobilize families when confronted with a child with
developmental issues. Engaging families who are often overwhelmed by issues
unrelated to the child requires effective and culturally sensitive outreach.
Parents may have little understanding about the value of developmental
screening and services to their children’s long-term success;
• Assessment sites may not be readily accessible due to transportation barriers;
• Accurate identification of children with Intellectual Disabilities and Autism
Spectrum Disorder. Accurate idencaon is challenging because it is a
spectrum and the knowledge base is sll developing;
• Family mobility, in some cases, makes follow-up difficult;
• The level of staff cultural competency needed is not always present.

DRAFT Lee County Human Services Gap Analysis
Secon Five: Special Populaons
Chapter 24 | Intellectual and Developmental Disabilities Page | 348
Service Delivery Systems
Context and Background
Just as the mental health field engaged in the process of de-institutionalization in which
the focus moved from institutional care to community-based care, so has the field of
intellectual and developmental disabilities. However, there is one significant difference.
While being in a mental hospital was not always voluntary, the provision of institutional
care to individuals with IDD was established as a right. They could waive this right and
obtain community-living support in concept.
The thinking behind this shift was that many individuals with IDD could live productive
lives in a community setting and that their quality of life would be better. As a concept,
this is preferable. The issue is that just as mental health community funds did not
adequately flow into the community, neither have IDD funds.
In recent years, this community focused model has also emphasized employment and a
fuller community life for individuals with IDD. No one would argue with this goal.
However, there are generational tensions between the younger generation for whom
the school system was redesigned to foster these capabilities and older people who did
not have these school experiences. These conflicts play out not just in the individuals
with IDD but with their families’ differing expectations.
For service providers, these dual expectations create challenges. On the one hand, they
are willingly attempting to comply with both State and federal policy as well as what are
viewed as current best practices. One the other hand, they have clients and families
with expectations of more traditional services and who believe that service model is
best for their situation.
Gaps Related to Service Delivery
The gap here is primarily one of funding. While funding overall is inadequate, it is
particularly challenging for legacy programs, which are viewed as adhering to past
practices. Funding for these legacy services are now more reliant than ever on private
contribution.

DRAFT Lee County Human Services Gap Analysis
Secon Five: Special Populaons
Chapter 24 | Intellectual and Developmental Disabilities Page | 349
Greater consistency in communications to families is needed. The Florida Employment
First Findings Report identified a need to improve the information flow to families,
particularly addressing the gap between those on the waiver and those not on it.
Policy/Procedure issues
Context and Background
In a system as complex as the intellectual and developmental disabilities field involving
both State and federal funding, there will be a variety of policy or procedure issues that
may have effects that create or minimize gaps.
Gaps Related to Policy/Procedures
Funding challenges. Neither the VR (Vocational Rehabilitation) or APD (Agency for
Persons with Disabilities) systems are funded at an adequate level to respond in a
timely manner to demand. There have been significant funding increases intended
to address this issue, but the fact remains that both systems are inadequately
funded in the context of the needs they are seeking to address.
Billable activities.
573
Employment providers explained that often the activities
that are considered “best practices” are not billable, creating a disincentive.
Examples included developing employer connections, solo transportation time
for the employment specialist to a job site, time spent completing
documentation and required paperwork, and phone-based consultation with
employers and other supports.
Inconsistency of incentives. In the Florida Employment First Findings Report
stakeholders reported that it is more profitable for an agency to provide Adult
Day Training living services compared with individualized integrated
employment.
574
iBudget issues. The Employment First Findings Report stated that “in some
cases, implementation of iBudget includes a reduction in the total resources
available to an individual in exchange for greater control over resources. Findings
revealed concerns among many that after paying for essential services like
573
Employment First, op. cit. pg. 10.
574
Ibid., pg. 10.

DRAFT Lee County Human Services Gap Analysis
Secon Five: Special Populaons
Chapter 24 | Intellectual and Developmental Disabilities Page | 350
supported living, there will not be funding available within individual budgets for
services like employment.”
575
Formal Definitions
Below are two definitions of intellectual and developmental disabilities, one from the
National Institute of Health and the second from Florida’s state agency (Agency for
Persons with Disabilities) which is charged with overseeing services to this population.
National Institute of Health Definition
What are Intellectual and Developmental Disabilities (IDDs)?
576
Intellectual and developmental disabilities (IDDs) are disorders that are usually present
at birth and that negatively affect the trajectory of the individual’s physical, intellectual
and/or emotional development. Many of these conditions affect multiple body parts or
systems.
Intellectual disability starts any time before a child turns 18 and is characterized by
problems with both:
Intellectual functioning or intelligence, which include the ability to learn, reason,
problem solve and other skills; and
Adaptive behavior, which includes everyday social and life skills.
The term "developmental disabilities" is a broader category of often lifelong disability
that can be intellectual, physical or both.
"IDD" is the term often used to describe situations in which intellectual disability and
other disabilities are present.
State of Florida – Agency for Persons with Disabilities definitions
Intellectual Disability: A term used when a person has certain limitations in both mental
functioning and in adaptive skills such as communicating, taking care of him or herself
and social skills. These limitations will cause a person to learn and develop more slowly.
People with intellectual disabilities may take longer to learn to speak, walk, and take
575
Ibid. pg. 11.
576
https://www.nichd.nih.gov/health/topics/idds/conditioninfo/default

DRAFT Lee County Human Services Gap Analysis
Secon Five: Special Populaons
Chapter 24 | Intellectual and Developmental Disabilities Page | 351
care of their personal needs such as dressing or eating. They are likely to have trouble
learning in school. They will learn, but it will take them longer. As defined in Chapter 393
F.S., an intellectual disability means significantly sub-average general intellectual
functioning existing concurrently with deficits in adaptive behavior which manifests
before the age of 18 and can reasonably be expected to continue indefinitely. Adaptive
behavior means the effectiveness or degree with which an individual meets the
standards of personal independence and social responsibility expected of his or her age,
cultural group and community. Significantly sub-average general intellectual functioning
means performance that is two or more standard deviations from the mean score on a
standardized intelligence test specified in the rules of the agency.
DD (Developmental Disability): A disorder or syndrome defined in Florida statute as
autism, cerebral palsy, intellectual disability, spina bifida, Down syndrome, Prader-Willi
syndrome, and Phelan-McDermid syndrome that manifests before the age of 18 and
constitutes a substantial handicap that can be expected to continue indefinitely.

DRAFT Lee County Human Services Gap Analysis
Secon Five: Special Populaons
Chapter 24 | Intellectual and Developmental Disabilities Page | 352
Intenonally le blank.

DRAFT Lee County Human Services Gap Analysis
Secon Five: Special Populaons
Chapter 25 | Deafness and Blindness: Birth or Early Childhood Development Page | 353
CHAPTER 25
Deafness and Blindness: Birth or Early Childhood Development
Introduction
Some children are born with, or develop at an early age, visual and hearing difficulties
of sufficient severity to require various types of supports. This chapter focuses on
those children and their services. As people age, visual and hearing issues increase.
Those difficulties are addressed in the chapters on individuals with other disabilities
and seniors.
The format for this chapter consists of a background section, a description of the
system-of-care, the gaps and a definitions section.
Context and Background
Blindness and Vision Difficulty
According to the 2018 American Community Survey (ACS), there are approximately
559,943 children with vision difficulty in the U.S. The 2016 ACS reported 571,800 with
a visual disability.
577
According to the FY 2017 Annual Report from the American Printing House for the
Blind (APH), based on data from January 2016, there are approximately 63,657 U.S.
children, youth and adult students in educational settings who are legally blind.
578
There are an estimated 2,500 blind/visually impaired children in Florida’s public
schools.
579
Of these, 153 are in the School District of Lee County.
Deafness and Hard of Hearing
About two to three out of every 1,000 children in the U.S. are born deaf or hard of
hearing. Over 90% of these children are born to parents who can hear. Early
577
American Community Survey, S1810. https://www.census.gov/programs-surveys/acs/
578
2017 Annual Report: American Printing House for the Blind, Inc. http://www.aph.org/annual-reports
579
www.lighthouse.org

DRAFT Lee County Human Services Gap Analysis
Secon Five: Special Populaons
Chapter 25 | Deafness and Blindness: Birth or Early Childhood Development Page | 354
identification of children who are born deaf or hard of hearing is critical to ensure that
their families have the resources they need to help their children acquire language,
spoken and/or visual and achieve age-appropriate communicative, cognitive, academic,
social and emotional development. According to American Community Survey 2018
estimates, 408,754 children under 18 in the U.S. had hearing difficulty. In 2016, that
number was 431,255.
580
The following statistics help define the issue:
581
90% of all deaf children are born into hearing families.
Of those families, only 10% ever learn to effectively communicate with their
deaf child. The other 90% do not.
American Sign Language is the third most commonly used language in the United
States.
Deafness is the No. 1 birth defect in the United States.
75% to 85% of deaf high school graduates only read at a third- to fourth-grade
level.
Deafness is the costliest single disability in terms of special education costs,
averaging $25,000 per year per child, compared to $5,100 for a typical hearing
child.
The average lifetime cost to society of a child born deaf in terms of medical,
educational and productivity losses is $1,020,000.
The Prevalence of Hearing Loss in Children
More than 1 million children in the United States have a hearing loss.
Six in every 1,000 infants born in the United States have some degree of hearing
loss.
About three out of every 1,000 infants born in the United States has a severe or
profound hearing loss.
83 out of every 1,000 children in the United States have what is termed an
educationally significant hearing loss.
580
American Community Survey, S1810. https://www.census.gov/programs-surveys/acs/
581
http://www.asha.org/public/hearing/disorders/children.htm (American
Speech-Language-Hearing Association.

DRAFT Lee County Human Services Gap Analysis
Secon Five: Special Populaons
Chapter 25 | Deafness and Blindness: Birth or Early Childhood Development Page | 355
The System-of-Care
Federal Policy
The Early Hearing Detection and Intervention Act (EHDI) in 2000 and subsequent federal
funding established state newborn hearing screening programs in hospitals. At the time
of its passage, the average age of identification of deaf children was about 2½-years-old;
children who were hard of hearing often were identified much later. The goals of the
EHDI program include hearing screening of all newborns by age 1 month, confirmation
of hearing status by 3 months and enrollment in an early intervention program for deaf
and hard of hearing babies and their families by 6 months.
Today, about 95% of newborns have a hearing screening before they leave the hospital.
State Agencies: Florida Division of Vocational Rehabilitation and Division of Blind Services
Vocational Rehabilitation (VR) is a federal-state program that helps people who have
physical or mental disabilities get or keep a job. VR is committed to helping people with
disabilities find meaningful careers.
VR has counselors who are specially trained to understand the needs and abilities of
people who are deaf, hard of hearing, or deaf-blind, including counselors who use
American Sign Language.
VR provides services to address hearing loss issues in the workplace, as well as guidance
and counseling on how to cope with hearing loss. In addition, VR can provide
interpreting services for job interviews and may provide employers and co-workers
training on how to communicate with those who are deaf.
VR and the Florida Division of Blind Services (DBS) have a cooperative agreement to help
serve individuals with both hearing and vision loss. At the time of referral, counselors
from the two agencies will meet with the client who is deaf-blind to determine
necessary services and which agency should take the lead in providing services to the
eligible customer. If required, the customer may receive services from both agencies as
outlined in his/her Individualized Plan for Employment.
The Florida Division of Blind Services mission is to help blind and visually impaired
Floridians achieve their goals and live productive and independent lives. Services cover

DRAFT Lee County Human Services Gap Analysis
Secon Five: Special Populaons
Chapter 25 | Deafness and Blindness: Birth or Early Childhood Development Page | 356
all ages from babies to senior citizens. The agency also offers Employer Services, the
Braille and Talking Books Library and the Business Enterprise Program. Specific
programs include:
The Blind Babies Program provides community-based early-intervention
education to children from birth through 5-year-olds who are blind or visually
impaired, and to their parents and families, and through community-based
provider organizations.
The Children's Program serves children who are blind from age 5 through
transition to the Vocational Rehabilitation Program. This program supplements
services already offered by the school system to foster the child's learning and
ability to function independently. The child's parents, guardian and family
members should be an integral part of the program to foster independence.
The goal of the Transition Program is to assist young people in meeting their
future employment goals through transitioning from school to work or from
school to a higher educational program. Students must have a visual impairment
in both eyes and require vocational rehabilitation services to prepare for
employment. Transition services are generally provided through the Vocational
Rehabilitation Program. However, they also could be provided through the
Children's Program. In either case, the student will have a Plan of Services. The
types of services to be provided through Blind Services are normally
incorporated into the student's Individual Education Plan as well. The final goal is
to ensure that a child can be an independent adult.
Independent Living Services are provided to enable individuals who are blind or
severely visually impaired to live more independently in their homes and
communities with a maximum degree of self-direction. Successful outcomes
enable individuals to live more independently in their community and/or
transition to the working world.
Vocational Rehabilitation Services are provided to assist blind and visually
impaired individuals seeking employment. Qualified individuals must have a
bilateral visual impairment that constitutes or results in a substantial
impediment to employment and needs services to prepare for, enter, engage in,

DRAFT Lee County Human Services Gap Analysis
Secon Five: Special Populaons
Chapter 25 | Deafness and Blindness: Birth or Early Childhood Development Page | 357
or retain gainful employment. Successful outcomes lead to achievement of
employment goals.
The Rehabilitation Center for the Blind and Visually Impaired is a place where
people who are blind can reside temporarily while they learn to lead productive,
self-sufficient lives. The Rehabilitation Center program incorporates instruction
in a variety of independence skills, as well as case management, including home
management, cooking, cleaning, personal care, labeling, orientation and
mobility, Braille, access computer technology, adaptive equipment and devices,
college prep, job readiness, home repairs, adaptation to blindness and many
other skills that contribute to independence and the confidence to seek the
highest level of employment possible.
Florida Department of Education. Children or youth who are determined to be deaf or
hard of hearing can be determined to be Exceptional Student Education (ESE) eligible.
As such there are special programs and supports.
The Florida School for the Deaf and Blind
582
, St. Augustine. FSDB is a fully accredited,
tuition-free state public school for eligible Pre-K and K-12 students who are deaf/hard of
hearing, blind/visually impaired, or deafblind. Transportation for day and boarding
students is provided free of charge. FSDB serves 975 or more students each year
through statewide parent-infant/family programs as well as a Montessori Pre-K early
learning center and K-12 elementary, middle and high schools on its campus.
Local Agencies
Florida Agencies Serving the Blind: This is a group of 18 member agencies, most of
which include “Lighthouse” as part of their names, who are the independent nonprofit
providers of specialized Vision Rehabilitation and Education for people of all ages who
are blind or visually impaired. Their local service areas (some agencies serve just one
county and others have multiple counties), combine to provide full coverage for all 67
Florida counties, with more than 2 million severely visually impaired residents, including
2,000 children between birth and age 21. Lighthouse of SWFL is in Lee County.
582
www.fsdbk12.org

DRAFT Lee County Human Services Gap Analysis
Secon Five: Special Populaons
Chapter 25 | Deafness and Blindness: Birth or Early Childhood Development Page | 358
School District of Lee County. The district provides educational services to 153 students
identified as deaf or hard-of-hearing. The Deaf or Hard-of Hearing Program offers a full
continuum of services to meet both academic and communication needs identified on a
student's Individual Educational Plan (IEP). Eligibility for the program is based on both a
documented hearing loss and educational need. Students ages 3 through 22 can receive
itinerant services at their home school or attend a designated school site where classes
are taught by a teacher certified in deaf education. Designated visual impairment
intervention schools include Villas Elementary, Varsity Lakes Middle and Fort Myers
High. The auditory-oral and total communication options are available at all levels. Sign
language interpreting services provide students access to classroom curriculum and
extracurricular activities. Additionally, a range of audiological services are provided for
students through the district audiologist.
Gaps
The following gaps are noted:
Mental Health Services. The status of mental health services for deaf and hard of
hearing people in the United States is less than adequate. Mental health service
providers may mistake cultural, language and communication issues for intellectual
delays, developmental delays or mental illness.
Communication challenges in the criminal justice and court systems. Deaf and hard of
hearing individuals face greater legal challenges due to communication barriers that are
typically not recognized by lawyers, courts or police. In encounters with the police, lack
of communication may result in detention without the ability to call one’s lawyer. The
provision of effective communication can be provided in a variety of ways, such as
qualified interpreters, real-time captioning (or CART) or other accommodations.
Newborn evaluations for deafness/hard of hearing. While the EDHI provided for in-
hospital evaluations, not all newborns who are suspected of being deaf or hard of
hearing receive the necessary follow-up evaluations they need to confirm their hearing
status.

DRAFT Lee County Human Services Gap Analysis
Secon Five: Special Populaons
Chapter 25 | Deafness and Blindness: Birth or Early Childhood Development Page | 359
Early Screening for Vision Difficulties: Many children do not receive a vision screening
until they are nearing school age (ages 4 or 5) and this can cause missed opportunities
for intervention.
Employment. One study found that 29.5% of individuals with a visual disability were
employed full-time in 2016
583
. Another found 32%.
584
48% of deaf people are
employed
585
. However, discrimination in employment is a documented phenomenon
586
.
While there is employer bias there is also parental resistance. Some parents do not
think their child capable of employment.
587
Fear of Losing Benefits if employed. There is a fear of losing benefits if one becomes
employed. The Florida Ticket to Work program is designed to resolve this concern. A
gap is a lack of awareness of this program by some.
The lack of specialized services for deaf/blind persons. Deaf-blind individuals are a highly
diverse group with various combinations of vision or hearing loss occurring at various
times and sequences
588
. There is no coherent local, State or national funding for
services for this population. Knowledge about this population is limited in the health
care field. There is a lack of interpreters and training for respite care providers.
Guide Dogs. It is estimated that there are 10,000 guide dog teams currently working in
the U.S. There are only about 2% of blind and visually impaired individuals with guide
dogs
589
. This is because guide-dog schools require a strict set of pre-requisite
specialized skills and training in orientation and mobility skills to qualify for a dog.
Computer Access. Learning to use the computer while blind requires specialized
training and interventions to use enlargement software and screen readers.
583
Erickson, W. et.al. 2017. Disability statistics from the American Community Survey. Ithaca, NY: Cornell
University.
584
Bell, E. et.al. 2018. Rehabilitation and employment outcomes for persons that are blind or visually impaired.
Journal of Blindness Innovation and Research. 8(1)
585
Garberoglio, C et.a. 2016. Deaf people and employment in the United States. National Deaf Center on
Postsecondary Outcomes.
586
https://www.npr.org/2019/01012/deafandunemploye
587
https://www.npr.org/2019/01012/deafandunemployed
588
www.aadb.org
589
Guide Dogs for the Blind. www.guidingeyes.org

DRAFT Lee County Human Services Gap Analysis
Secon Five: Special Populaons
Chapter 25 | Deafness and Blindness: Birth or Early Childhood Development Page | 360
Staffing shortage. There is a critical staffing shortage of teachers and qualified
professionals to provide appropriate interventions to the blind and visually impaired.
What makes this gap even more challenging is there are few universities that offer
programs leading to certification. Qualifications to teach the blind and visually impaired
can be found at https://www.acvrep.org/ and https://aerbvi.org/
Definitions
590
Vision difficulty. Children with vision difficulty are children who range in age from birth
to 17-years-old. This definition includes those children who have serious difficulty
seeing even when wearing glasses as well as those who are blind.
Legal blindness. Students who are legally blind can range in age from birth to 21-years-
old. This definition only includes those students with vision loss who are legally blind.
Legal blindness is a level of vision loss that has been defined by law to determine
eligibility for benefits. It refers to explicitly to those who have a central visual acuity of
20/200 or less in the better eye with the best possible correction, or a visual field of 20
degrees or less.
Low Vision or Partially Sighted. This is having visual acuity and/or field of vision that is
less than normal or having a visual limitation in only one eye. Vision that is limited to a
narrow angle in the center of the field of vision is sometimes called Tunnel Vision.
590
www.dbs.myflorida.com

DRAFT Lee County Human Services Gap Analysis
Secon Five: Special Populaons
Chapter 26 |Persons with Other Physical Disabilities Page | 361
CHAPTER 26
Persons with other Physical Disabilities
Introduction
In addition to people with intellectual and developmental disabilities or those born with
hearing and visual disability, there are other forms of disability. While these first two
are associated with birth or childhood, other disabilities may develop later in life. This
chapter addresses three other disabilities – vision loss during adulthood, hearing loss
during adulthood and physical disabilities.
There is a broad range of very specific disabilities, some of these disabilities are due to
injury and others develop during the course of one’s life. When combined with the
physical impacts of aging, some of these disabilities are associated with the elderly. The
area is often addressed under the rubric of independent living.
Context and Background
What is Independent Living?
Independent living can be considered a movement, a philosophy or specific programs. In
the context of the Administration for Community Living (ACL), independent living
programs are supported through funding authorized by the Rehabilitation Act of 1973,
as amended (the Act). Title VII, Chapter 1 of the Act states the current purpose of the
program is to “promote a philosophy of independent living including a philosophy of
consumer control, peer support, self-help, self-determination, equal access, and
individual and system advocacy, to maximize the leadership, empowerment,
independence, and productivity of individuals with disabilities, and the integration and
full inclusion of individuals with disabilities into the mainstream of American society.”
Key provisions of the Act include responsibilities of the Designated State Entity (DSE),
provisions for the Statewide Independent Living Councils (SILCs), requirements for the
State Plan for Independent Living (SPIL) and Center for Independent Living standards
and assurances. (See below for details on all these areas.)

DRAFT Lee County Human Services Gap Analysis
Secon Five: Special Populaons
Chapter 26 |Persons with Other Physical Disabilities Page | 362
To receive funding, states must jointly develop and submit a State Plan for Independent
Living (SPIL), which is a three-year plan for providing independent living services in the
state. The Designated State Entity (DSE) is the agency that, on behalf of the State,
receives, accounts for and disburses funds received under Subpart B of the Act. The
Statewide Independent Living Council (SILC) is an independent entity responsible to
monitor, review and evaluate the implementation of the SPIL. Centers for Independent
Living (CILs) are consumer-controlled, community-based, cross-disability, nonresidential
private nonprofit agency that is designed and operated within a local community by
individuals with disabilities and provides an array of independent living services.
Independent Living in Florida
The Florida Independent Living Council (FILC), formed in 1999, is a not-for-profit
statewide planning organization. The council is made up of 14 voting members who are
appointed by the Governor and the majority of the voting members must consist of
individuals with disabilities who are not employed by a Center for Independent Living
(CIL) or a state agency.
The role of the FILC is to provide leadership, research, planning and education required
to support independent living services in Florida.
Vision Loss and Blindness
Florida leads the nation in blind population, and it is growing. Florida has 21 million
residents (Census as of July 2016) of which 19.4% are 65 years old or older. Applying
Florida’s population to findings from a nine-year longitudinal study of Medicare
recipients performed by Duke University
591
, the number of severely visually impaired
Florida seniors is currently in the range of 2 million older individuals. An annual census
performed by the American Printing House for the Blind yields a total of 3,000 severely
visually impaired children in public schools
592
.
As diabetes becomes ever more common, adults are being affected with diabetic
retinopathy, which causes blindness; other major causes of adult vision loss are
591
(https://www.ncbi.nlm.nih.gov/pubmed/12963614
592
www.beyondvisionloss.org

DRAFT Lee County Human Services Gap Analysis
Secon Five: Special Populaons
Chapter 26 |Persons with Other Physical Disabilities Page | 363
glaucoma, macular degeneration, retinitis pigmentosa and cataracts. At the other end of
the generational spectrum, a steady 6% of premature babies have an associated vision
impairment in addition to other handicaps
593
.
It should be noted that despite the growth of the senior population there is a decrease
in the prevalence of both vision loss and blindness. However, for seniors ages 85 and
older, percentages significantly increase (22.3% with vision loss and 2.3% experiencing
blindness in 2014)
594
.
While there are not Florida specific data, data exist on vision loss for people 40 and
older. The latest version of Vision Problems in the U.S., (2012) provides a diagnoses-
specific look at visual impairment for Americans age 40 and older. The study
defines vision impairment as “having worse than 20/40 vision in the better eye, even
with eye glasses,” and the study defines blindness according to the United States’
definition of legal blindness, or “visual acuity with best correction in the better eye
worse than or equal to 20/200 or a visual field extent of less than 20 degrees in
diameter.”
The following are selected estimates for Americans ages 40 and up from the
2012 [Vision Problems in the US:]
595
2,907,691 people have vision impairment not including blindness (2.0% of the
40 and older population, as estimated by the 2010 Census)
o 337,752 age 40 to 64 (0.33% of the same-age population)
o 2,569,959 age 65 and older (6.4% of the same age population)
1,288,275 people are legally blind (0.90% of the 40 and older population, as
estimated by the 2010 Census)
o 155,002 age 40 to 64 (0.15% of the same-age population)
o 1,133,272 age 65 and older (2.8% of the same-age population)
2,069,403 people have age-related macular degeneration, often called
“AMD.”
596
593
Statistics about Seniors with Vision Loss. Originally Published as "Research Navigator: Age is just a Number"
February 25, 2016
594
ibid
595
www.visionproblemsus.org
596
www.visionproblemsus.org

DRAFT Lee County Human Services Gap Analysis
Secon Five: Special Populaons
Chapter 26 |Persons with Other Physical Disabilities Page | 364
24,409,978 people have cataracts. By age 80, more than half of all Americans
have cataract(s)
7,685,237 people have diabetic retinopathy. Which also increases the risk of
cataract and glaucoma.
2,719,379 people have glaucoma
597
In terms of trends the following are estimated
598
:
Cases of early age-related macular degeneration are expected to double by 2050,
from 9.1 million to 17.8 million for those age 50 or older.
Cases of diabetic retinopathy among people age 65 or older are expected to
quadruple by 2050, from 2.5 million to 9.9 million.
Hearing Loss
The U.S. Department of Health and Human Services estimates
599
Number of adults with hearing trouble: 41.3 million
Percent of adults with hearing trouble: 16.5%
Of these, almost 6 million are profoundly deaf.
There are more than 800,000 deaf or hard-of-hearing individuals in Florida.
Physical Difficulties and Activities of Daily Living
Local statistics in this area are limited. National data reports the following data
600
:
Number of adults unable (or very difficult) to walk a quarter-mile: 19.4 million
Percent of adults unable (or very difficult) to walk a quarter-mile: 7.8%
Number of adults with any physical functioning difficulty: 40.7 million
Percent of adults with any physical functioning difficulty: 16.3 million
597
Vision problems in the U.S. www.visionproblemsusa.org
598
Center for Disease Control and Prevention, Behavioral Risk Factor Surveillance System
599
http://www.nidcd.nih.gov/health/statistics/hearing.asp (National Institute on Deafness another
Communications Disorders)
600
: Summary Health Statistics Tables for U.S. Adults: National Health Interview Survey, 2018, Tables A-6b, A-6c pdf
icon[PDF – 147 KB]
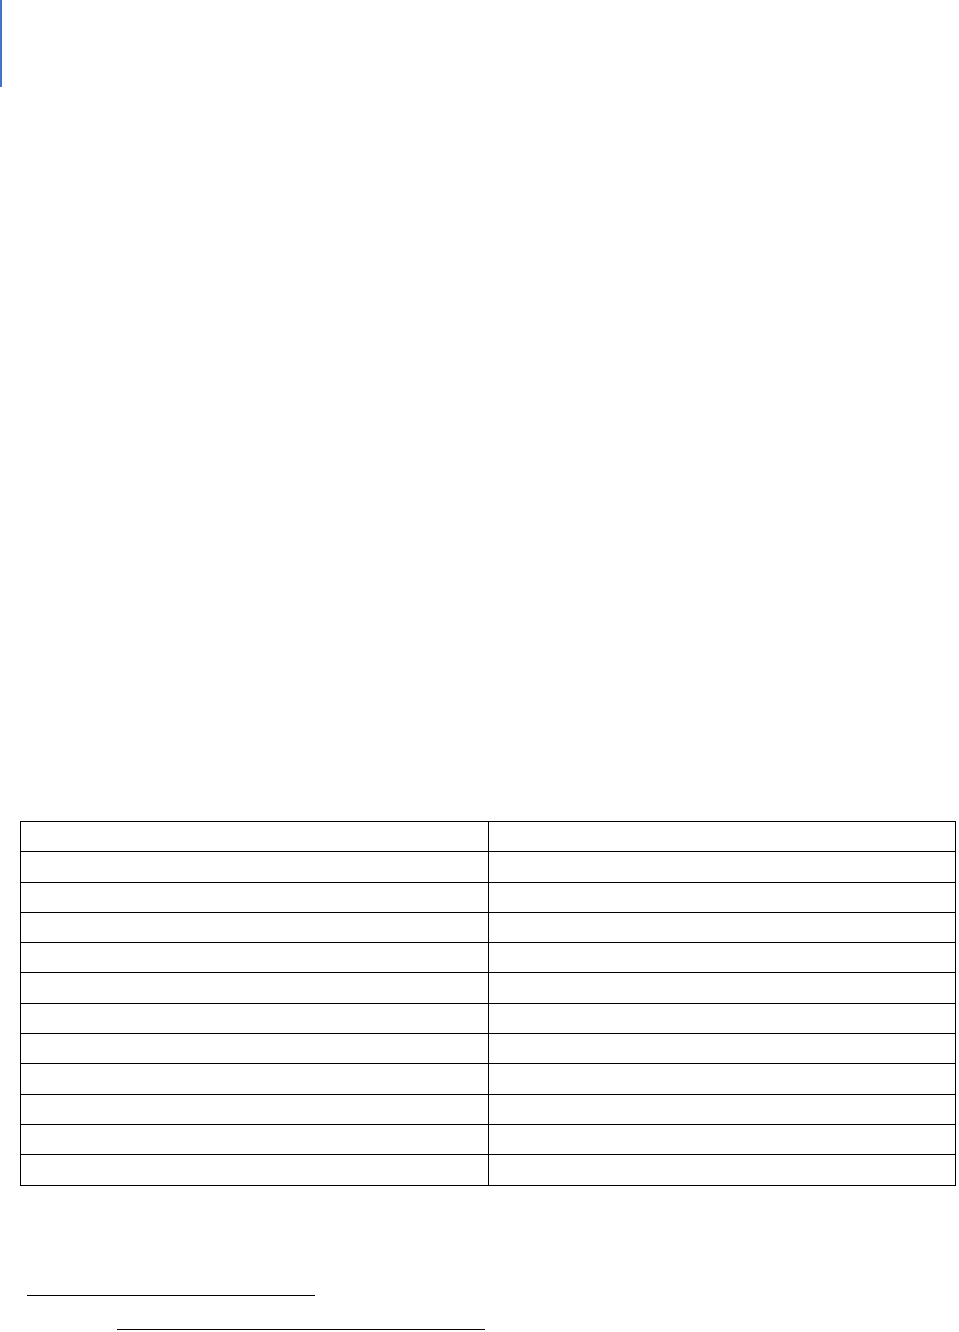
DRAFT Lee County Human Services Gap Analysis
Secon Five: Special Populaons
Chapter 26 |Persons with Other Physical Disabilities Page | 365
Number of adults age 18 and older reporting a lot of difficulty or cannot do at all in
at least one domain of functioning: 20.7 million (2017)
Percent of adults age 18 and older reporting a lot of difficulty or cannot do at all in at
least one domain of functioning: 8.7% (2017)
Number of adults age 65 and older reporting a lot of difficulty or cannot do at all in
at least one domain of functioning: 9.5 million (2017)
Percent of adults age 65 and older reporting a lot of difficulty or cannot do at all in at
least one domain of functioning: 19.5% (2017)
The disability of some individuals is sufficient that they need personal care assistance.
Statistics include:
601
Percent of adults age 65 to 74 who need help with personal care from others: 3.9%
Percent of adults age 75 and older who need help with personal care from others:
11.6%
Disabled Seniors
Duplicating data from the chapter on seniors, the following Table 101 shows the
disability status of seniors in Lee County.
Table 101. Disability Status of Seniors
602
Disability status of seniors
Number
One type of disability
33,211
Two or more disabilities
29,403
Specific disability (could have more than one)
Hearing
28,380
Vision
9,422
Cognitive
14,721
Ambulatory
37,095
Self-care
11,935
Independent Living
22,114
No Disabilities
173,329
Probable Alzheimer’s
22,756
Disabled Veterans
601
Source: Health, United States, 2018, table 15 pdf icon [PDF – 9.8 MB]
602
Profile of older Floridians, op.cit

DRAFT Lee County Human Services Gap Analysis
Secon Five: Special Populaons
Chapter 26 |Persons with Other Physical Disabilities Page | 366
A variety of services are provided to disabled veterans. These are described in the
chapter on veterans.
Poverty and Disability
One of the consequences of disabilities can be lowered income or poverty. Some
statistics are presented below. Disability is both a cause and consequence of poverty. It
is a cause because it can lead to job loss, reduced earning, barriers to skill development
and significant additional expenses. It is a consequence because poverty can limit
access to health care, appropriate housing and accessible transportation.
The poverty rate for working-age people with disabilities is nearly two-and-a-half times
higher than that for people without disabilities
603
. The Census Bureau estimated the
poverty rate for individuals with disabilities to be 28.4% in 2013, compared to 12.4% for
those without disabilities
604
. For example, the annual earnings and poverty status of
non-institutionalized individuals age 21 to 64 with a visual disability in the United States
in 2016
605
.
Median Annual Earnings: $38,500
Median Annual Household Income: $41,300
Number living below the poverty line: 1,048,600 (27.7%)
System-of-Care
There are a range of agencies addressing disability in the State. They are described
below. Each operates as its own system.
603
Vallas, R. et.ao. 2014. Disability is a cause and consequence of poverty. www.talkpoverty.org
604
Denavas-Walt, C. et.al. 2014. Income in poverty in the United States. 2013. U.S. Census
605
Summary Health Statistics Tables for the U.S. Population: National Health Interview Survey, 2018, Table P-3c pdf
icon [PDF – 104 KB]

DRAFT Lee County Human Services Gap Analysis
Secon Five: Special Populaons
Chapter 26 |Persons with Other Physical Disabilities Page | 367
Home Health Services – ACHA
Home Health Services provide skilled nursing and home health aide services for
Medicaid recipients from birth to end of life. Private-duty nursing and personal-care
services can be provided for Medicaid recipients under 21 years of age. Personal-care
services provide assistance with activities of daily living (ADL) and age-appropriate
instrumental activities of daily living (IADL) to help the person complete tasks he/she
would normally be able to if not for a medical condition or disability.
606
Examples of
ADL activities including eating, bathing, dressing, toileting and transferring. IADL
includes light housework, meal preparation, grocery shopping, etc. These services are
Medicaid funded and managed in the State by the Agency for Health Care
Administration.
Community and Support Services – Florida Department of Elder Affairs
These are non-Medicaid Services for people 60 or older. The Older Americans Act funds
adult day care, caregiver training and support, chore, congregate dining, home-
delivered meals, homemaker services, information and referral assistance, medical
transportation, nutrition education, personal care and shopping assistance. The
Community Care for the Elderly (CCE) program uses State funds to provide case
management and other services to frail elders age 60 and older. Other services include
adult day health care, home health aide, counseling, home repair, medical therapeutic
care, home nursing, emergency alert response and information. CCE services assist
elders to perform certain daily tasks such as meal preparation, bathing or grooming.
The Home Care for the Elderly (HCE) uses State funds to provide a subsidy to caregivers
to help maintain low-income elders in their own homes or in the homes of caregivers.
Payment is made for support and health maintenance and to assist with food, housing,
clothing and medical care. A special subsidy is available to help with specialized health
care needs. The Respite for Elders Living in Everyday Families (RELIEF) offers in-home
respite that is an expansion of respite currently available through other programs,
including evening and weekend respite. The purpose of this service is to increase the
ability of a family unit to continue to care for a homebound-elderly individual by
providing in-home respite beyond the basic provisions of current public programs. It is
volunteer based.
606
acha.myflorida.com

DRAFT Lee County Human Services Gap Analysis
Secon Five: Special Populaons
Chapter 26 |Persons with Other Physical Disabilities Page | 368
OAA funds are allocated by formula to Area Agencies on Aging which in turn contract
with local providers.
The Florida Department of Elder Affairs administers the CCE program through the Area
Agencies on Aging, which in turn subcontract with lead agencies that provide services
through a network of providers. To be eligible, someone must be 60 or older and
functionally impaired. Priority is given to those who have been determined by Adult
Protective Services to be victims of abuse, neglect or exploitation and who need
immediate services.
The Home Care for the Elderly provides care for those 60 and older in family-type living
arrangement within private homes as an alternative to institutional or nursing home
care. A basic subsidy of $106 per month is provided. Special subsidies are provided in
certain conditions. The Area Agency on Aging is responsible for local administration and
determination of eligibility.
A variety of food assistance programs also are offered. These include:
Adult Care Food Program:
This program assists eligible Adult Care Centers and Mental Health Day Centers in
providing meals to elders. In addition to seniors, those 18 or older with a functional
disability are eligible.
Senior Farmers Market Nutrition Program:
This program improves the nutritional health of low-income elders by providing
coupons that can be redeemed for locally grown fresh fruits and vegetables at
approved farmers markets.
Nutrition Services Incentive Program (NSIP):
The NSIP reimburses Area Agencies on Aging and service providers for the costs of
congregate and home-delivered meals through a supplement of approximately
$0.72 per meal as of 2015. Younger adults with disabilities can also be included.
Florida Coordinating Council for the Deaf and Hard of Hearing, Florida Department of Health
The Council’s website describes its role as follows:
607
607
www.floridahealth.gov/home/providersand partner resources/FCCDHHhome

DRAFT Lee County Human Services Gap Analysis
Secon Five: Special Populaons
Chapter 26 |Persons with Other Physical Disabilities Page | 369
Florida Coordinating Council for the Deaf and Hard of Hearing, hereafter referred to as
the “Coordinating Council” is mandated by Section 413.271 Florida Statutes to serve as
an advisory and coordinating body which recommends policies that address the needs
of Florida’s deaf, hard of hearing, late-deafened and deaf-blind (hereafter referred to
collectively as “hearing loss”) community.
The Coordinating Council is a resource for deaf and hard of hearing Floridians who need
assistance with everyday needs including employment, education and access to
services. The Coordinating Council is dedicated to assisting the nearly 3 million
Floridians affected by hearing loss through providing technical assistance and resources
to individuals, governmental agencies, private and public organizations.
The Coordinating Council’s technical assistance allows both public and private entities to
better and more efficiently serve persons with hearing loss and their families.
Assistance to Veterans
608
What follows are edited quotes from the reference site:
The Aid and Attendance Pension benefit is another program available in Florida that can
be used to pay family members to provide care. This program is only relevant for war-
time veterans or their surviving spouses who require assistance with their activities of
daily living. Spouses cannot be paid as caregivers, but adult children and other relatives
can be compensated.
The Aid and Attendance Pension benefit is a cash benefit and the amount of financial
assistance varies depending on the beneficiary’s current income. Annually, the VA sets a
maximum amount of income a beneficiary can have and then the VA supplements the
veteran’s income up to the point of the maximum benefit. For example, in 2018, the
Maximum Annual Pension Rate (MAPR) for a couple is approximately $25,000. If the
couple has $15,000 in income, the VA will give them an additional $10,000.
The VA does allow families to deduct certain expenses from their income, so in practice
they can still be eligible even if their income is considerably higher than $25,000 per
year. One expense they can deduct from their countable income is their cost of care.
Therefore, an elderly veteran can hire their adult child (or another relative or friend) to
provide them with personal care and the amount they pay their caregiver can be
608
www.payingforseniorcare.com

DRAFT Lee County Human Services Gap Analysis
Secon Five: Special Populaons
Chapter 26 |Persons with Other Physical Disabilities Page | 370
deducted from their income. The VA will compensate the veteran an amount equal to
what they pay to their caregiver over and above their existing pension benefit. The
spouse cannot be the caregiver.
Another option veterans can use to pay their caregivers is a program called Veterans
Directed Home and Community Based Services (VD-HCBS). For veterans who require the
level of care on par with what is provided in a nursing home, this program gives them
the option to receive that care at home and to pay family members or friends for
providing care. In brief, how this program works is that the veteran is provided with a
budget for care instead of being provided with care by the VA. The responsibility for
finding the care providers, then falls onto the veteran and / or their family. With control
of the budget, the veteran can hire family members, friends and even their spouses to
provide them with the hands-on assistance with the activities of daily living they would
otherwise receive in a nursing home.
Any veteran that participates in the VA Medical Center Care system and requires
“nursing home level care” is eligible for this program. Notably, veterans with
Alzheimer’s usually meet these criteria. Veterans can only be referred to AAASWFL by
Bay Pines VA Healthcare System. The Veterans Administration refers clients who are at
risk of institutional placement. AAASWFL then assists the veterans with budget
management and finding programs that suit their needs.
Gaps
The primary gap is that the need for services exceeds the available financial resources.
This is demonstrated by the size of the waitlists for services. In Florida, as of 2017 the
following waitlists existed
609
:
Individuals with IDD: 21,017
Aged/Disabled: 49,798
Traumatic Brain Injury/Spinal Cord Injury (TBI/SCI): 201
609
Waiting List Enrollment for Medicaid Section 1915© Home and Community-Based Services Waivers.
www.kff.org/statehealthfacts/medicaid&CHIP/homeandcommunitybasedservices/waitinglist

DRAFT Lee County Human Services Gap Analysis
Secon Five: Special Populaons
Chapter 26 |Persons with Other Physical Disabilities Page | 371
Of note, the waiting list in Florida differs from national patterns. Nationally, 67% of the
waiting list is composed of those with IDD, while seniors and adults comprise 28%.
Florida is the opposite.
610
Key Future Trends. The increase in the number of people receiving Medicaid HCBS and
the number of people in need of those services over the years is attributable to a
number of factors. Those include the aging of the population; the fact that medical and
technological advances that prolong the lifespan provide previously unavailable
treatments for certain conditions and offer new options to support independent
community living; changing individual and societal preferences for HCBS in lieu of
institutional care; and state efforts to meet their community integration obligations
under the Americans with Disabilities Act (ADA) and the Olmstead decision.
611
610
ibid
611
https://www.kff.org/medicaid/issue-brief/key-questions-about-medicaid-home-and-community-based-
services-waiver-waiting-lists/view/footnotes/#footnote-399062-20

DRAFT Lee County Human Services Gap Analysis
Secon Five: Special Populaons
Chapter 26 |Persons with Other Physical Disabilities Page | 372
Intenonally le blank.

DRAFT Lee County Human Services Gap Analysis
Secon Five: Special Populaons
Chapter 28 | Veterans Page | 373
Chapter 27
Seniors
Introduction
This chapter begins with this quote about the future of Florida. It is an accurate
description of Lee County’s future.
The Silver Wave
612
“Seniors will constitute the majority of Florida’s predicted population growth between
now and 2030, and this boom means Florida will encounter elder issues in a way the
state – already a longtime haven for retirees – has never seen before.
Persons age 65 and older currently make up about 20% of Florida’s population. By
2030, more than one in four Floridians will be part of this age group. Florida adds a
quarter-million additional residents each year through 2030, and the majority of these
new residents – 57% of them – will be age 60 and older.
Between 2015 and 2050, the age 85 and older population is projected to more than
triple, which has significant implications. This age group is the most likely to need long-
term services and support to help with everyday tasks such as bathing, dressing, eating,
transferring and toileting. Members of this age group not only have higher rates of
disability than younger people, but they are also more likely to live alone, without a
spouse or other family member to provide them with assistance.
Add to that the increasing rate in the number of people living with Alzheimer’s disease
and related dementias. In Florida alone, an estimated 480,000 older adults live with
Alzheimer’s today, and this figure is expected to increase to 720,000 in the next 11
years. Alzheimer’s disease is the number one most costly condition to Medicare and
Medicaid budgets, more costly to the nation than heart disease or cancer.”
612
The Silver Wave. Florida Health Care Association.
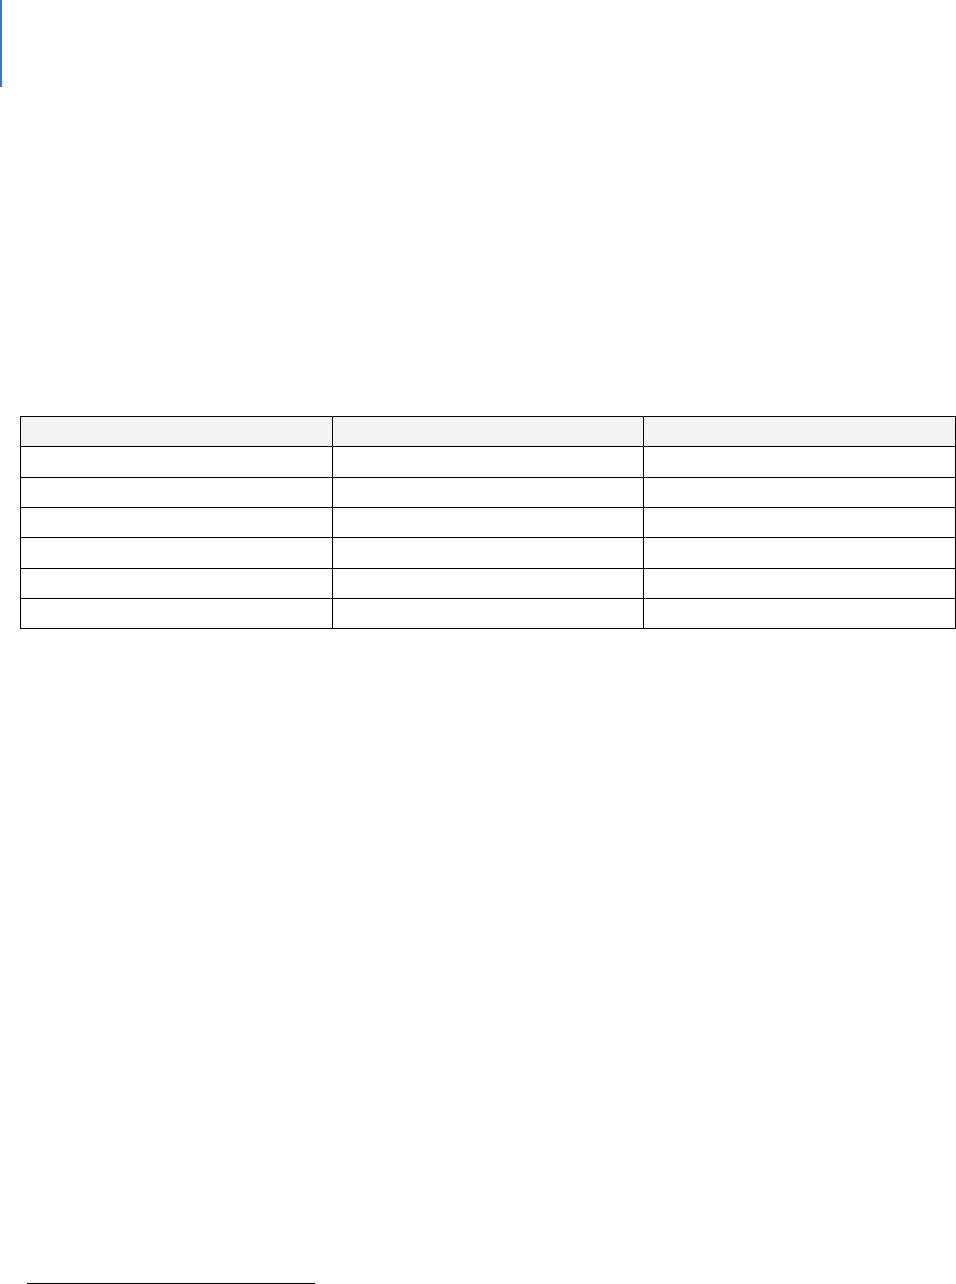
DRAFT Lee County Human Services Gap Analysis
Secon Five: Special Populaons
Chapter 28 | Veterans Page | 374
Context and Background
Current projections for the number of seniors in Lee County, age 65 and older, range
from 182,764
613
to 188,866.
614
The Department of Elder Affairs estimates various age
brackets within the senior category. Table 102 shows their estimates for 2018.
Table 102. Age Group Population Estimates for Lee County
615
Age
Population
Percentage
60+
235,949
33.1%
65+
182,764
25.6%
70+
129,834
18.2%
75+
80,402
11.3%
80+
43,806
6.1%
85+
20,932
2.9%
The department of Elder Affairs projects the 85 and older age group population to be
48,200 by 2040, as shown below in Figure 33.
613
Profile of Older Floridians, lee County, 2018. Website: elderaffairs.state.fl.us
614
Website:worldpopulationview.com/leecountyfl
615
Profile of older Floridians, op.cit
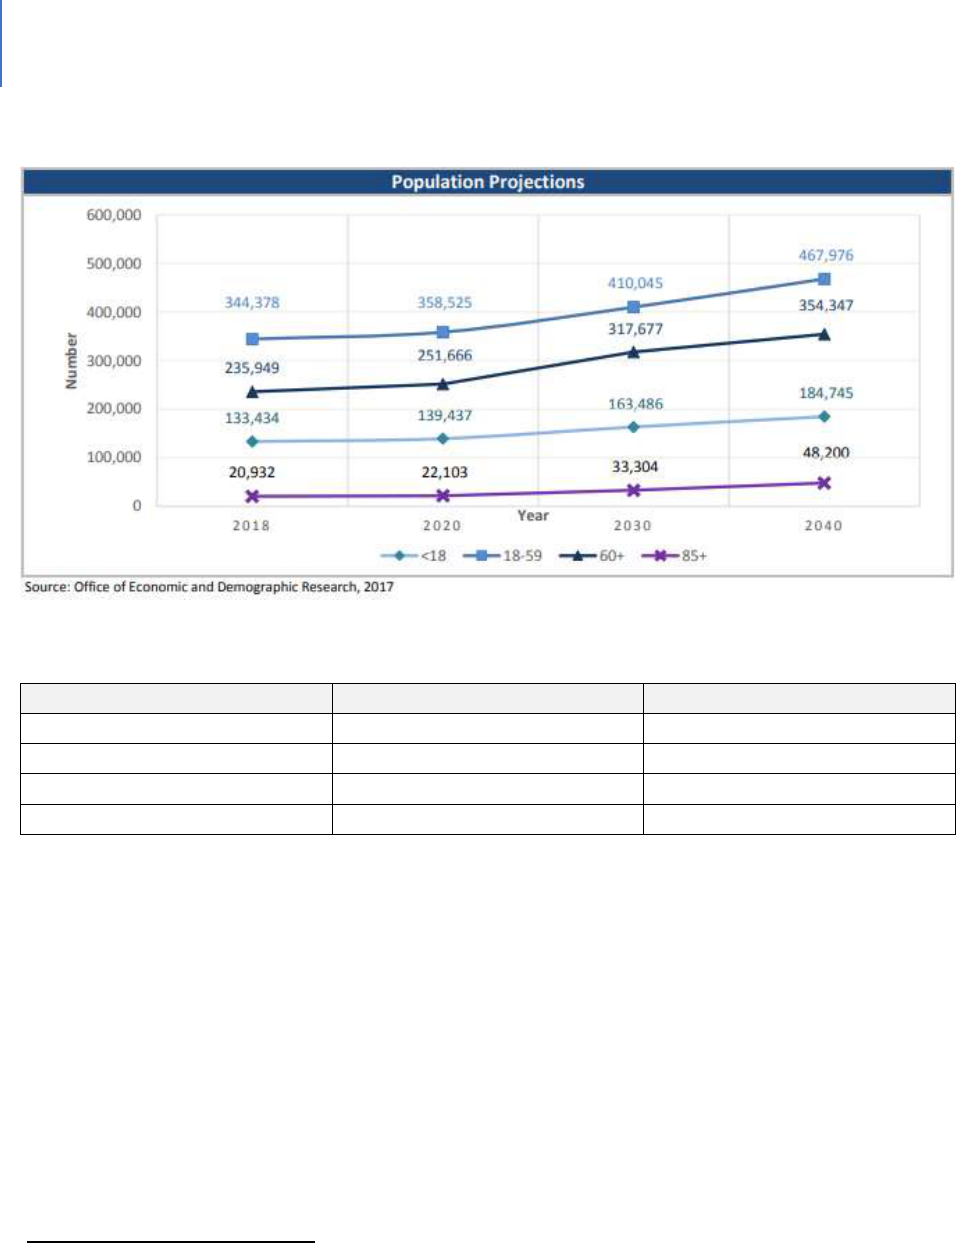
DRAFT Lee County Human Services Gap Analysis
Secon Five: Special Populaons
Chapter 28 | Veterans Page | 375
Figure 33. Lee County Population Projections
616
Table 103. Financial Status of Seniors
617
Financial Status
Number
Percentage
Below poverty guideline
19,109
8.1%
Below 125% of FPL
28,288
12.0%
Minority below FPL
5,835
2.5%
Minority below 125% of FPL
7,596
32%
As Table 103 notes that about 8% of seniors have an income that is below the federal
poverty line. Another source estimates that approximately 4% of seniors age 65 to 74
live below the poverty line and approximately 3% of seniors age 75 and older are
classified as living in poverty.
618
This is approximately 13,000 seniors, which is close to
the estimate in Table 105 of food-insecure seniors. Appendix I summarizes some of the
methodological issues with the federal poverty line.
Table 104 presents a view of senior households from the perspective of housing cost-
burden. While these are not individuals in poverty, the table does indicate that nearly
14% of the county’s seniors are financially constrained.
616
FL Dept of Elder Aairs. 2018 Projecons, Lee County
617
ibid.
618
Website: datausa.io/leecountyfl
DRAFT Lee County Human Services Gap Analysis
Secon Five: Special Populaons
Chapter 28 | Veterans Page | 376
Table 104. Elder Households with Cost Burden
619
Above 30% and Income Below 50% Area Median Income
Elder Households
101,499
Percent of all households
13.9%
One of the potential consequences of financial constraint is food insecurity. Tables 105
and 106 present data on this situation.
Table 105. Food Insecurity in Lee County
620
Population
700,165
Overall Food-Insecure Population
86,050
Food-Insecure Seniors (Est)
12,900
With respect to SNAP or Food Stamps, Table 106 presents a more challenging view of
food security for seniors than does Table 105.
Table 106. Seniors and SNAP 2017
621
Participants
14,430
Potentially Eligible
28,288
Participation Rate
51%
Another consequence of financial constraint is the use of health care services. Table
107 presents data on this issue.
Table 107. Medically Underserved (65+)
622
Total Medically Underserved
46,801
Living in Areas Defined as Medically
Underserved
46,801
Dependency Ratio. This is the percentage of seniors compared to non-senior adults.
The higher this percentage, the lower the workforce numbers available to support the
needs of senior citizens. The projected dependency ratios are shown in Figure 34
below. By 2030, the dependency ratio in Lee County will be 63%. This means that there
will be close to one senior (65 and older) for every working-age adult in the County. This
619
The Shimberg Center for Housing Studies, 2017
620
Harry Chapin Food Bank
621
Profile of older Floridians, op.cit
622
Profile of older Floridians, op.cit.
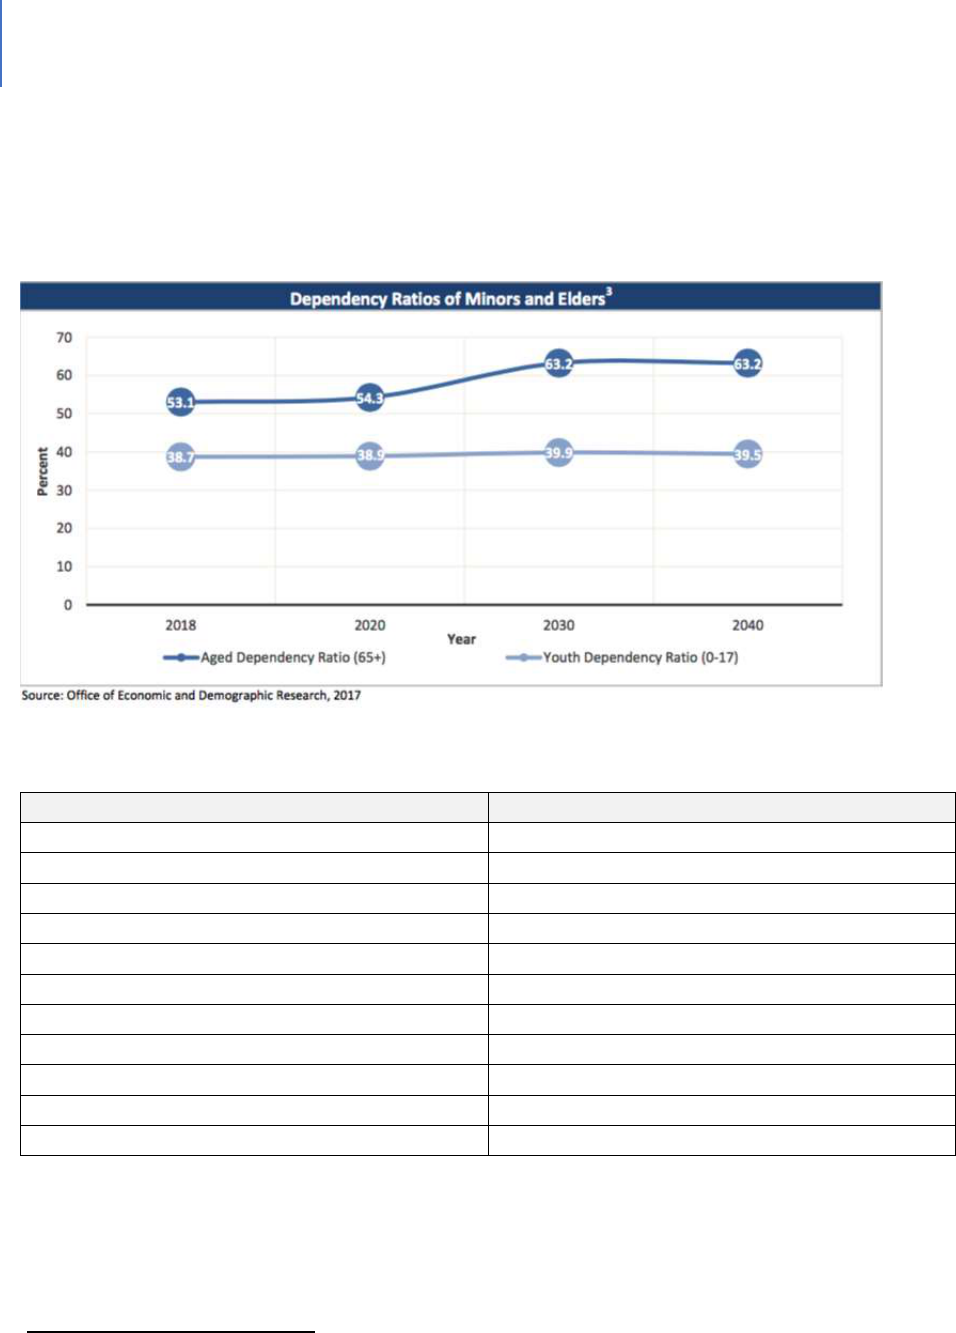
DRAFT Lee County Human Services Gap Analysis
Secon Five: Special Populaons
Chapter 28 | Veterans Page | 377
will represent a serious challenge to a workforce for which there is a high need for
senior services. Table 108 presents data on the current disability status of seniors.
These numbers will only increase in the future.
Figure 34. Dependency Ratio Projections
Table 108. Disability Status of Seniors
623
Disability Type / Description
Number
One Type of Disability
33,211
Two or more Disabilities
29,403
Specific Disability (could have more than one)
Hearing
28,380
Vision
9,422
Cognitive
14,721
Ambulatory
37,095
Self-care
11,935
Independent Living
22,114
No Disabilities
173,329
Probable Alzheimer’s
22,756
623
Profile of older Floridians, op.cit

DRAFT Lee County Human Services Gap Analysis
Secon Five: Special Populaons
Chapter 28 | Veterans Page | 378
The System-of-Care
The State of Florida’s Department of Elder Affairs has overall responsibility for
addressing various senior issues. It contracts with the Area Agency on Aging (AAA) for
Southwest Florida to provide programs and services that help older adults and adults
with disabilities to live as independently as possible. Services include:
The Elder Hotline
Home and community-based care
Medicare counseling
Health and wellness workshops
Elder abuse prevention and education
Emergency home energy assistance
Medicare savings for low-income beneficiaries
Medicaid-managed long-term care
Respite care
Veteran-directed home and community-based services.
Most these programs are provided through Federal and State grants.
624
Federal Grants
Older Americans Act (OAA):
Title III B: Provides supportive services to help elders live independently in their own
homes and communities.
Title III C1: Provides congregate meals and nutrition education in strategically located
centers.
Title III C2: Provides home-delivered meals and nutrition education to home-bound
individuals.
Title III D: Provides disease prevention and health promotion services. These services
are designed to help adults age 60 and older through education and activities
that support and promote healthy lifestyles and behaviors.
Title III E: Provides services through the National Family Caregiver Support Program.
These services help families caring for frail elders. Assistance is also available
624
Website: aaaswfl.org

DRAFT Lee County Human Services Gap Analysis
Secon Five: Special Populaons
Chapter 28 | Veterans Page | 379
to grandparents or older relatives who are caregivers for children 18 and
younger or for children with disabilities.
Title VII: Provides the Elder Abuse Prevention program. This program is designed to
increase awareness of the problem of elder abuse, neglect and exploitation.
State of Florida Grants
Community Care for the Elderly (CCE): The CCE program provides community-based
services to help frail elders live in the least restrictive, yet most cost-effective,
environment suitable to their needs.
Alzheimer’s Disease Initiative (ADI): The ADI program provides services to meet the
changing needs of individuals with, and families affected by, Alzheimer’s disease and
similar memory disorders.
Home Care for the Elderly (HCE): The HCE program supports care for Floridians, age 60
and older, living in private homes as an alternative to institutional or nursing home care.
Local Activities
In addition to managing the above programs, the Area Agency on Aging Southwest
Florida (AAASWFL) also seeks to inform seniors about emergency planning, disaster
assistance, special medical needs, special needs shelters and registering for special
needs shelters. AAASWFL offers a free, evidence-based caregiver support workshop,
“Powerful Tools for Caregivers,” and a free, evidence-based falls prevention / balance
workshop. These workshops are provided in Lee County.
In addition to these social services targeted to seniors, there is also a range of facilities
and health care services designed for seniors. Table 109 provides a summary.
DRAFT Lee County Human Services Gap Analysis
Secon Five: Special Populaons
Chapter 28 | Veterans Page | 380
Table 109. Health Care Facilities for Seniors
Facility / Service Type
Number or Beds or Agencies
Skilled Nursing Facilities
2,230 beds
Assisted Living Facilities
3,711 beds
Medicaid Certified Home Health Care Agencies
15
Medicare Certified Home Health Care Agencies
35
Homemaker and Companion Service Companies
58
Adult Day Care Capacity
548 persons
Adult Family Care Home Beds
98 beds
Needs More Specific to Seniors
While seniors share many of the same needs as other age groups, they do have some
specific needs that a system-of-care should address. These include:
Activities of Daily Living (ADL) (bathing, dressing, etc.) and Instrumental Activities of
Daily Living (IADL) (heavy chores, shopping) Assistance. 19% needed ADL and 54%
needed IADL.
625
Isolation
626
and Living Alone. Seniors who live alone are at greater risk. Those living
with someone, particularly with their spouse, have a better mental health status,
more income and are more likely to receive care.
627
20% of Lee County residents
age 65 and older live alone, putting them at risk of social isolation or a lack of regular
contact with others. Social isolation relates to several health issues, including poor
diet, dementia, lack of exercise, high blood pressure, arthritis and depression. There
also is a correlation between isolation and elder abuse, exploitation and self-neglect.
Medications. 50% of seniors in Florida have delayed filling prescription medications
for a limited period. 27% have delayed for three months or more.
628
Dental / Eye Care. 27% have not been able to afford dental or eye care.
629
625
Assessing the needs of Elder Floridians, 2016. Department of Elder Affairs
626
Data provided by AAASWFL
627
Robards, J., et al (2012). Marital status, health and mortality. Maturitas, 73(4), 295–299.
628
Assessing, op.cit.
629
ibid.

DRAFT Lee County Human Services Gap Analysis
Secon Five: Special Populaons
Chapter 28 | Veterans Page | 381
Information. Studies have shown that one of the key reasons elders do not
participate in SNAP (or Food Stamps) is they mistakenly believe they will get only the
minimum benefit ($16). In fact, in Federal Fiscal Year 2009, the average monthly
benefit for each person older than 60 in the program nationally was $119 per
month.
Falling. Nationwide, falls are the leading cause of fatal and nonfatal injuries among
seniors age 65 and older (Bergen, Stevens, & Burns, 2016). One out of four older
adults fall each year, and 20% of those falls cause serious injuries such as broken
bones or head injuries. DOH data indicate that the 2017 death rate from
unintentional falls in Lee County was 86.9 per 100,000, far higher than the statewide
average of 54.6 deaths per 100,000.
Gaps in the System-of-Care
Some of the following gaps have been addressed in other chapters and will simply be
noted here:
Housing. For a proportion of seniors, housing is a cost-burden.
Food Security. A proportion of seniors, many of whom are housing cost-burdened,
also face food insecurity. It is estimated that 30% of seniors are at-risk of
malnutrition.
630
For those who live alone, the percentage is 37%.
631
Older people
are significantly less likely to participate in SNAP (or Food Stamps).
Elder Abuse. 18% of seniors reported being a victim of fraud or swindle.
632
Self-harm. Approximately 8% of statewide elders had to go without treatment for
emotional or mental health issues.
633
Transportation. “About one-half of statewide respondents (47%) reported that they
get around by driving themselves. The remaining one-fifth (18%) of elders reported
using a variety of other modes of transportation, such as taxis, vans, special transit
630
Assessing the needs of Elder Floridians, 2016. Department of Elder Affairs
631
ibid
632
Assessing the needs of Elder Floridians, 2016. Department of Elder Affairs
633
ibid.

DRAFT Lee County Human Services Gap Analysis
Secon Five: Special Populaons
Chapter 28 | Veterans Page | 382
and senior ride services. Without access to affordable transportation, seniors may
face poorer health, social isolation and a reduced quality of life. Research has shown
that elders age 65 and older, who no longer drive, take 15% fewer trips to the
doctor, 59% fewer trips to shop or eat out, and 65% fewer trips to visit friends and
family, when compared to drivers of the same age.”
634
Behavioral Health. A significant percentage of seniors do not access mental health
care services. This is partially a cost issue and partially a negative perception of
mental illness issue.
Staffing. One in seven Florida nurses work in a skilled nursing or hospice facility.
There is a 62.4% turnover rate. The turnover rate for nursing assistants ranges from
45% to 66%.
635
While the population of seniors will grow by 100%, the primary labor
pool for long-term care, women age 25 to 64, will only grow by 1%.
636
. There will
also be a need for more specialized staff. As the dependency ratio in Lee County
continues to rise, there will be fewer and fewer people to provide professional
caregiving.
Elder Specific Gaps
The following gaps are of significance to seniors. Some can be of benefit to other groups
also.
Information and Education. A portion of seniors do not understand the programs
and services available to them. The comparatively lower percentage accessing Food
Stamps is an example. Also, there is the attitude among some about not taking
“welfare.” This negative perception needs to be addressed.
Caregiver Support. While a percentage of elders live in nursing homes or assisted
living facilities, far more are cared for at home.
637
The waitlist for home and
community services means there is a gap in caregiver support and respite care.
Florida has 2.7 million residents who are part-time or full-time caregivers for an
aging loved one. However, Florida ranks 46
th
in terms of offering support. In the
634
ibid.
635
The silver wave, op.cit.
636
ibid.
637
The silver wave, op.cit.

DRAFT Lee County Human Services Gap Analysis
Secon Five: Special Populaons
Chapter 28 | Veterans Page | 383
seven-county region that includes Lee County, recent needs assessments have
determined that about one-third of older adults (age 60 or older) consider
themselves an unpaid caregiver for someone else—and most (69%) receive no
additional help with the caregiving. It’s not uncommon for caregivers to neglect self-
care in favor of caring for their loved one—but this altruism has a cost. Nationwide,
22% of caregivers believe their health has declined because of caregiving, 20%
report high physical strain and 35% report high emotional stress.
638
There is a waitlist for home and community based services. As of February 2019,
there were 71,650 Floridians on the list. The State spends 22% of its Medicaid funds
on home and community-based services. The national average is 45%.
639
The
State’s waitlist prioritizes those with the highest level of need to ensure those who
are at the highest risk of hospitalization or placement in a nursing facility are
prioritized for services.
In Lee County, lengthy waitlists exist for all the home and community-based
programs funded through the state DOEA and Older Americans Act programming,
including Community Care for the Elderly (CCE), Home Care for the Elderly (HCE),
Alzheimer’s Disease Initiative (ADI) and Older Americans Act Title IIIB
(OAA3B). Consumers are prioritized based on the results of their assessments
conducted by AAASWFL.
As of Dec. 1, 2019, the Lee County waitlist consisted of:
CCE: 107 Active, 1,335 waitlisted (CCE provides in-home services
such as housekeeping, meals, personal care / hygiene, adult day
care, transportation and case management).
HCE: 33 Active, 190 waitlisted (HCE provides a small stipend to an
in-home family caregiver to assist in payment for the client’s
needs).
ADI: 36 Active, 406 waitlisted (ADI provides services that support /
provide temporary relief from caregiving responsibilities for
someone with Alzheimer’s Disease or related disorders).
OAA3B: 63 Active, 1439 waitlisted.
638
Data provided by AAASWFL
639
Website: health.wusf.usf.edu

DRAFT Lee County Human Services Gap Analysis
Secon Five: Special Populaons
Chapter 28 | Veterans Page | 384
Waitlist Explanation. Clients are waitlisted for all the programs for which they are
eligible at the time of their assessment. This means the same person could be wait-
listed for more than one of the above programs at the same time. Also, a waitlist
does not mean that they have a high level of need. There are a small number of
people who have had assessments performed just to make sure they’re “in the
system,” despite not really having many challenges.
Reimbursement rates for long-term care do not cover the costs. It is estimated that
Medicaid underfunds nursing center care by more than $12 per patient per day,
making the delivery of quality services very difficult.
640
640
ibid.

DRAFT Lee County Human Services Gap Analysis
Secon Five: Special Populaons
Chapter 28 | Veterans Page | 385
CHAPTER 28
Veterans
Introduction
At the national, State and local level there is a commitment to address the needs of
those who served in the nation’s military. The dominant service provider is the
Veteran’s Administration. Both the State and County governments also provide
support.
Context and Background
There are 1,525,400 veterans in Florida. Of these, 789,717 are 65 years of age or older.
Florida has the nation’s third-largest veteran population – behind California and
Texas.
641
In Lee County, the veteran population is 59,238.
System-of-Care
The system-of-care for Veterans is a combination of federal, State and County services.
The prime entities include:
Veterans Administration (VA). Nationally, the VA provides a network of hospitals,
clinics and nursing homes for veterans in addition to administering a variety of
benefit programs and cemeteries.
Florida Department of Veterans Affairs. Within the State, there are a variety of
benefits for veterans:
Homestead tax exemptions or discounts
Educational benefits
Various employment benefits
Various exemptions from fees
641
Fast Facts. Florida Department of Veterans Affairs. www.floridavets.org

DRAFT Lee County Human Services Gap Analysis
Secon Five: Special Populaons
Chapter 28 | Veterans Page | 386
Lee County Veteran Services. Lee County Veteran Services is part of the Department
of Human Services and provides counseling and education to veterans, their
dependents and survivors on potential benefits available from the Department of
Veterans Affairs and other government agencies. This office prepares all
applications for benefits, which include:
Compensation and pension benefits
Aid and attendance benefits
Appeals modernization program
Survivor and burial benefits
Additional VA benefits
Local Resources for Veterans
In addition to the direct services provided by Lee County Veteran Services, there are
other local services. These include:
A VA Healthcare Center in Cape Coral. The Cape Coral clinic oers the following
services:
Primary care
Mental healthcare
Post-traumatic stress disorder
Substance abuse counseling, intensive outpatient program and a recovery
program
General mental health counseling
Sexual trauma recovery
Women’s healthcare
Ambulatory surgery
Audiology
Cardiology and EKGs / echocardiograms
Compensation and pension examinations in cooperation with the Veterans
Benefits Administration
Coumadin clinic
Dental

DRAFT Lee County Human Services Gap Analysis
Secon Five: Special Populaons
Chapter 28 | Veterans Page | 387
Dermatology
Eye care
Blind Rehabilitation Outpatient Services (BROS) for the visually impaired
Low vision clinic compensation
Optometry
Surgery including laser eye surgery
Gastroenterology
Home and community care (clinic-based home care, community homeless
veteran services and outreach, nursing home, community hospice)
Imaging
X-ray
Ultrasound
MRI
CT
Mammography
Neurology/EEGs
Nuclear imaging (standard and cardiovascular diagnostics)
Nutrition counseling / weight management
Orthopedics
Pharmacist consultation and medication pick-up
Phlebotomy (blood draws and specimen collection)
Physical and occupational therapy
Podiatry
Prosthetics
Tobacco cessation program
Social work
Spinal cord injury
Urology
Referrals to specialty care at the C.W. Bill Young VA Medical Center
Vet Centers. These centers offer community-based counseling for a range of social and
psychological services, including professional readjustment counseling to veterans and
families, military sexual trauma counseling and bereavement counseling for families that
experience an active-duty death.

DRAFT Lee County Human Services Gap Analysis
Secon Five: Special Populaons
Chapter 28 | Veterans Page | 388
In addition, there are various volunteer and nonprofit organizations such as Hearts and
Homes for Veterans. Finally, there is the local human services network that serves
veterans.
Gaps
Nationally, gaps have been identified and efforts developed to ameliorate the gaps.
Among these are:
Transition from Active Service to Civilian Life. For those veterans needing services from
the VA (such as traumatic brain injury, post-traumatic stress disorder – PTSD, substance
abuse, mental health, etc.), there have been gaps in the transition.
Homelessness. In the 2000 to 2019 timeframe, homelessness among veterans was
identified as a serious gap. 45% of homeless veterans were found to suffer from mental
illness.
642
Since that time, a variety of efforts have been enacted. Homelessness among veterans
in Florida has been effectively cut in half since 2011. Significant reasons for Florida’s
substantial decrease in the rate of homelessness among veterans are the national
initiatives implemented to end veteran homelessness. In Florida, millions of dollars
have been invested through VA Supportive Services for Veteran Families grants, as well
as HUD VA Supportive Housing (VASH) vouchers that provide long-term rental
assistance to help homeless veterans with high needs obtain and sustain permanent
housing. Florida’s Point in Time (PIT) 2011 count reported 5,644 homeless veterans.
The 2017 count reported 2,789 homeless veterans. (2017 Florida Council on
Homelessness Annual Report.)
643
Lee County has an active program to reduce veteran homelessness.
642
www.apa.org/advocacy/military-veterans/mentalhealthneeds.
643
ibid.

DRAFT Lee County Human Services Gap Analysis
Secon Five: Special Populaons
Chapter 28 | Veterans Page | 389
Scheduling and Capacity for VA Services. Delays in scheduling services for veterans
became a topic of considerable concern.
644
The RAND Corporation conducted an
independent assessment of veterans health care. They concluded that more resources
and capabilities will be needed to meet the growing demands.
645
Mental Health and Substance Abuse Services. 20% to 30% of veterans who served in
Iraq or Afghanistan suffer from major depression or post-traumatic stress disorder.
646
647
25% of these veterans showed signs of a substance abuse disorder.
648
However, only
50% of veterans who need this service will receive it.
649
This topic was a concern in
2011,
650
and there has been improvement.
651
However, demand still exceeds capacity.
Suicide. There are high suicide rates among veterans. The rate of suicide among female
veterans is 35 per 100,000, a rate much higher than among female civilians.
652
In 2014,
among male veterans, it was 41.6 per 100,000. Professionals in the field attribute this
to uneven access to appropriate mental health services provided by the VA or local
mental health providers.
653
644
Butler, M. 2014. VA scheduling scandal. www.journal.ahima.org
645
Hussey, P. et.al. 2015. Resources and capabilities of the Department of Veterans Affairs to provide timely and
accessible care to veterans. Rand Corporation.
646
ibid
647
www.thenationalcouncil.org/topics/veterans
648
National Institute of Drug Abuse
649
SMVR TA centers. www.samsha.gov
650
Senate Hearing 112-212. 2011. U.S. Government Publishing Office.
651
DAV report. https://www.dav.org/wp-content/uploads/2018 Women-Veterans Report Sequel.pdf
652
Ramchand, R. 2017. Congressional testimony before the Senate appropriations committee preventing veteran’s
suicides. April 27.
653
Hester, R. 2017. Lack of access to mental health services contribung to the high suicide rates among
veterans. Int. J. Ment Health Syst. 11:47 doi: 10.1186/s13033-017-0154-2

DRAFT Lee County Human Services Gap Analysis
Secon Five: Special Populaons
Chapter 28 | Veterans Page | 390
Intenonally le blank.

DRAFT Lee County Human Services Gap Analysis
Secon Six: Geography
Section Six: Geography Page | 391
Secon Six: Geography

DRAFT Lee County Human Services Gap Analysis
Secon Six: Geography
Section Six: Geography Page | 392
Intenonally le blank.
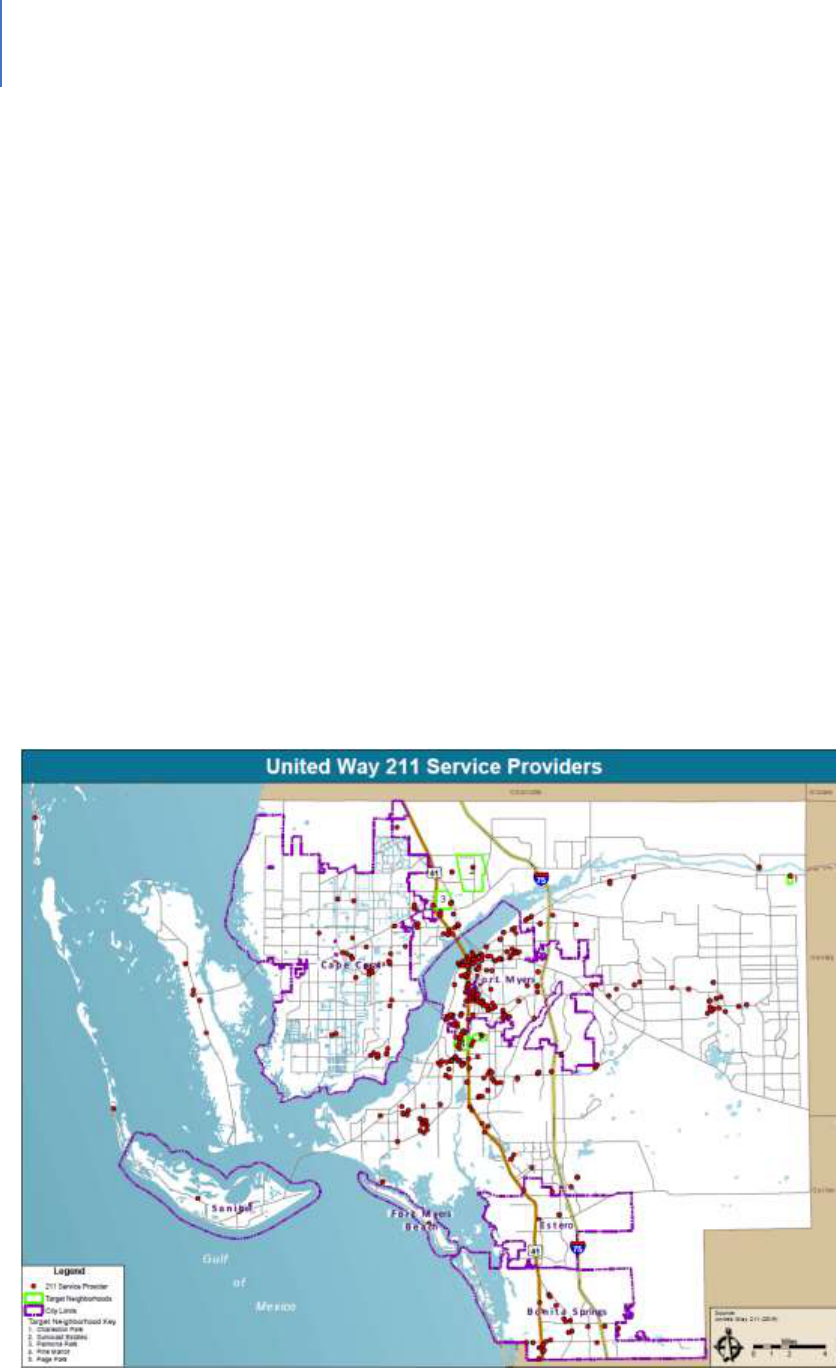
DRAFT Lee County Human Services Gap Analysis
Secon Six: Geography
Chapter 29 | Spatial Match Analysis Page | 393
CHAPTER 29
Spatial Match Analysis
Introduction
The purpose of this gap analysis is to determine the degree to which service providers
are located with respect to where their clients reside. One of the major gaps that has
been identified in Lee County is public transportation in that it is not easy for many to
access service locations. The desired goal would be that services are provided close
enough to residences that transportation is not a barrier. The purpose of a special
match analysis is to determine the degree to which that goal is realized.
Figure 35 is a map showing the service locations of human service providing agencies in
Lee County. An agency may have more than one location so the map does not equate to
the number of service providers. As the map indicates, most service providers are
clustered in the older areas of Fort Myers and along U.S. 41. Other service providers are
scattered across the County.
Figure 35. Map United Way 211 Providers
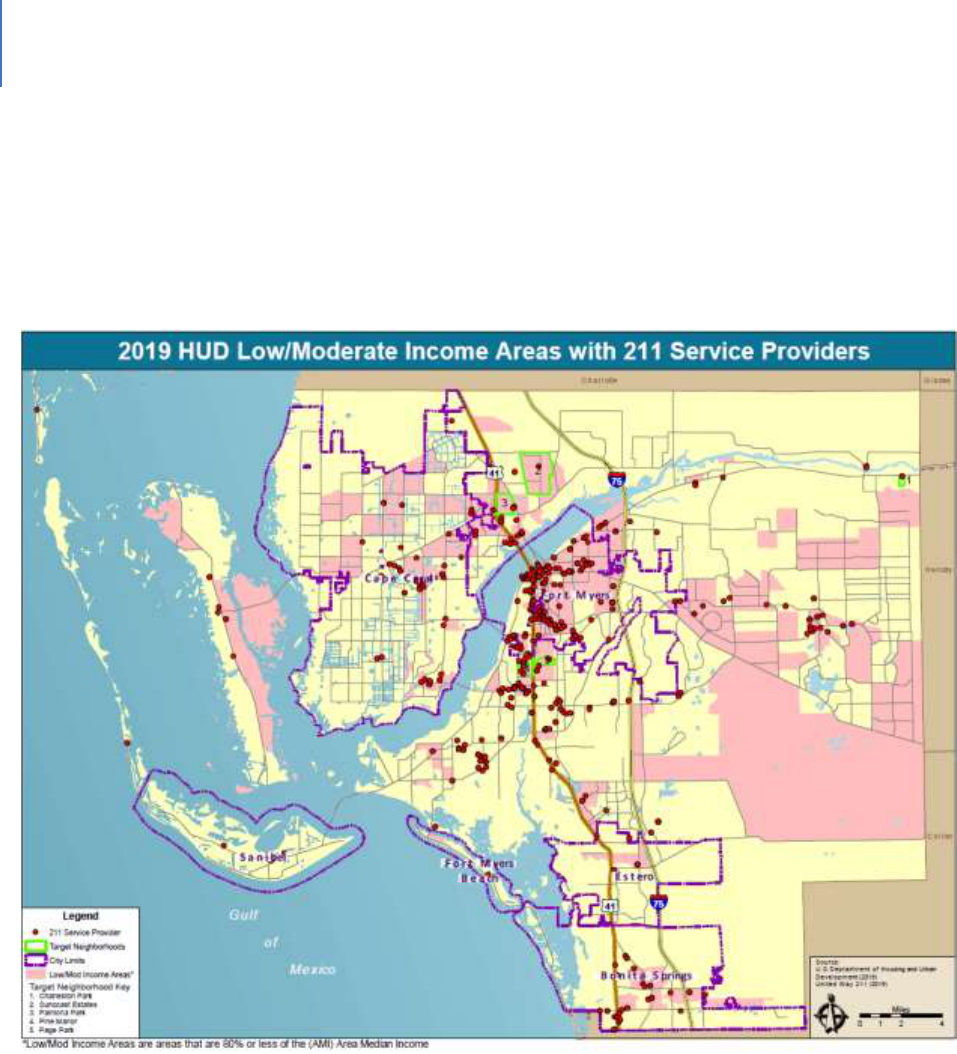
DRAFT Lee County Human Services Gap Analysis
Secon Six: Geography
Chapter 29 | Spatial Match Analysis Page | 394
Figure 36. Overlays the service providers onto a map of low-to-moderate income areas.
These areas vary in terms of population density. As the map indicates, the Lehigh Acres
area is sparsely served.
Figure 36. Map HUD Low/Mod Income Areas with 211 Service Providers

DRAFT Lee County Human Services Gap Analysis
Secon Six: Geography
Chapter 29 | Spatial Match Analysis Page | 395
Figure 37. Distribution of parks, recreational facilities and libraries
As the figure indicates, these facilities are distributed across the county.
Figure 37. Map Parks, Preserves, Conservation Land and Public Libraries
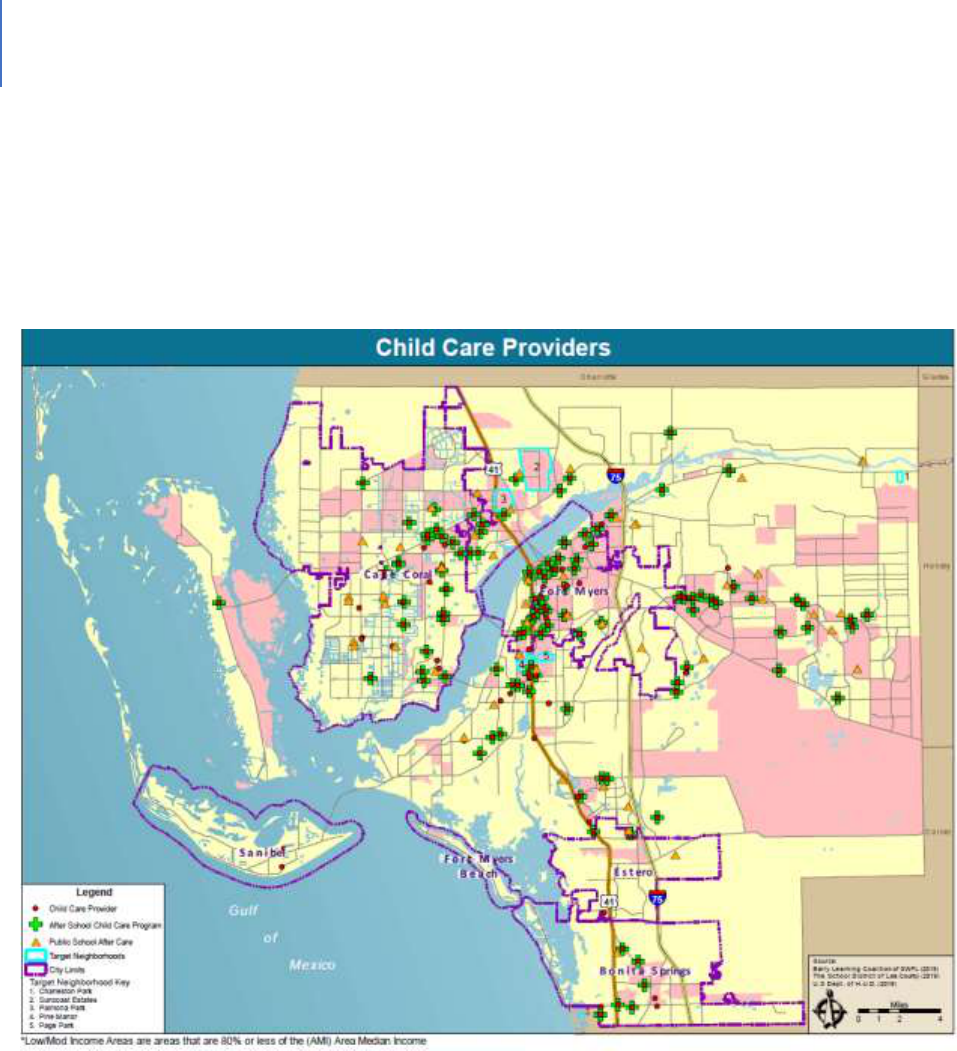
DRAFT Lee County Human Services Gap Analysis
Secon Six: Geography
Chapter 29 | Spatial Match Analysis Page | 396
Figure 38. Distribution of childcare centers and after-school programs
As the figure indicates, there is a fair dispersal of providers, with Lehigh Acres again
being less densely served.
Figure 38. Map Childcare Providers
GAPS
From a spatial perspective, most services providers are located in greater downtown
Fort Myers. As the population of the county has grown and geographically dispersed,
service locations have not matched that growth pattern. This concentration leads to
transportation challenges.

DRAFT Lee County Human Services Gap Analysis
Secon Seven: Funding
Section Seven: Funding Page | 397
Secon Seven: Funding

DRAFT Lee County Human Services Gap Analysis
Secon Seven: Funding
Section Seven: Funding Page | 398
Intenonally le blank.

DRAFT Lee County Human Services Gap Analysis
Secon Seven: Funding
Chapter 30 | Funding Responsibilities Page | 399
CHAPTER 30
Funding Responsibility and Other Roles
Introduction
This study has identified a variety of gaps in the broader human service delivery system.
As the chapters have noted, this is a highly complex set of systems. The funding is
equally complex with a variety of funding streams, formulas and requirements.
Findings
Table 110 does not attempt to summarize this complexity. Rather it seeks to categorize
certain high-level information as described in the following paragraph.
The table has four categories. One category is a Federal/State funding source that can
mean either direct federal funding, federal funding that is administered through the
State, a federal-state partnership or State generated funds. A second category is
required County funding, which can mean a required match of the County or a General
Fund appropriation as a part of a County function. A third category is non-required
County funding, which is a policy choice and or a description of the County’s role. A
fourth category is “other,” which addresses other agencies that have a funding
responsibility.
“X”s are placed in the boxes in the table to indicate the entities having some funding
responsibility. “N/A” refers to non-applicable.

DRAFT Lee County Human Services Gap Analysis
Secon Seven: Funding
Chapter 30 | Funding Responsibilities Page | 400
Table 110. Fiduciary Responsibilities and Other Roles
Topic
FED/
State
County -
Required
County – Policy Choice
Other
Infrastructure Funding
Supportive Housing
X
Policy Choice;
Administration of
Federal/State Funds
Affordable Housing
X
Policy Choice;
Administration of
Federal/State Funds
Transit
X
Policy Choice
Food Security &
Nutrition
X
IFAS Nutrition Education
Facilities
X
Policy Choice:
Comprehensive Plan
Municipalities
Employment
X
Policy Choice: Economic
Development
School District,
Workforce Dev.
Child & Youth Development Funding
Child and Youth
Development
X
Policy Choice: Recreation;
after school. PFR $
Systems of Care Funding
Behavioral Health
X
Mental
Health
Match
OVERMATCH
Behavioral Health
and Criminal Justice
X
Mental
Health
Match, Jail
OVERMATCH: Specialty
Courts, Diversion
Child Abuse and
Neglect; Foster Care
X
Policy Choice
SHERIFF –
County General
Fund
Domestic Violence
X
Policy Choice
SHERIFF –
County General
Fund
Elder Abuse, Neglect
& Exploitation
X
Policy Choice
SHERIFF –
County General
Fund
Sexual violence and
stalking
SHERIFF –
County General
Fund
Exposure to violence
Suicide and self-harm
DRAFT Lee County Human Services Gap Analysis
Secon Seven: Funding
Chapter 30 | Funding Responsibilities Page | 401
Topic
FED/
State
County -
Required
County – Policy Choice
Other
Juvenile delinquency
X
Detention
portion
SHERIFF –
County General
Fund
Homelessness
X
Policy Choice
Public Health Dept
X
X
Special Populations Funding
Intellectual and
Developmental
Disabilities
X
MEDICAID
Hearing and Visual
Disabilities - Children
X
MEDICAID
Persons with other
physical disabilities
X
MEDICAID
Seniors
X
Policy Choice – Recreational
facilities per Comp Plan
Veterans
X
Policy Choice: Veterans
Office

DRAFT Lee County Human Services Gap Analysis
Secon Seven: Funding
Chapter 30 | Funding Responsibilities Page | 402
Intenonally le blank.
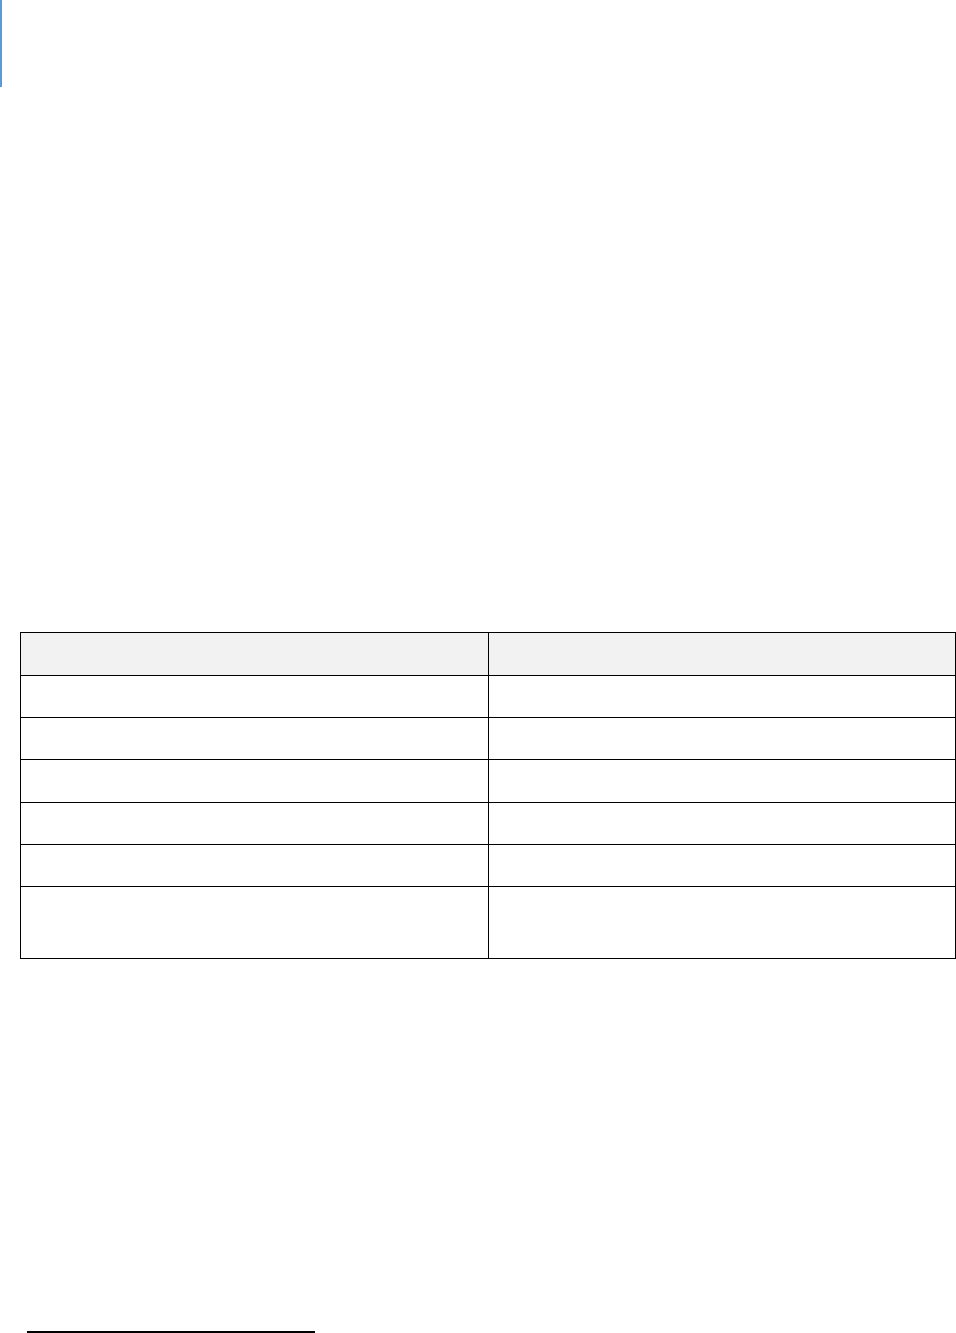
DRAFT Lee County Human Services Gap Analysis
Secon Seven: Funding
Chapter 31 | Equity Funding Page | 403
CHAPTER 31
Equity Funding
This chapter seeks to address the queson of whether Lee County receives an equitable
share of State or federal funding to address the needs of its residents. There is no such
thing as perfect equity due to funding cycles, special projects, cost of living variaons,
accuracy of census counts or other factors that create variability.
The focus of this chapter is whether there is a signicant variaon in funding provided
to Lee County. There appears to be only one, which is in mental health per-capita
funding. Table 111 presents the data.
Table 111. Non-Acute Funding for Mental Health Services, Central Florida Behavioral Network
654
Non-Acute Funding
Funding Per Person
Circuit 6 (Pasco)
$87.45
Circuit 6 (Pinellas)
$93.59
Circuit 10 (Hardee, Highlands and Polk)
$95.36
Circuit 12 (DeSoto, Manatee and Sarasota)
$80.50
Circuit 13 (Hillsborough)
$93.70
Circuit 20 (Charloe, Collier, Glades, Hendry
and Lee)
$65.11
Clearly, Circuit 20 is substanally underfunded on a per-person basis. The State of
Florida is ranked between 48 and 50 as to the level of State funding for mental health
services as discussed in the behavioral health chapter. There are signicant gaps in
mental health services in the State as a result. This makes the funding level for Lee
County even more insucient and is a major factor in why mental health services are
considered a severe gap by community professionals.
654
Central Florida Behavioral Health Network

DRAFT Lee County Human Services Gap Analysis
Secon Seven: Funding
Chapter 31 | Equity Funding Page | 404
Intenonally le blank.

DRAFT Lee County Human Services Gap Analysis
Secon Seven: Funding
Chapter 32 | County Funding Page | 405
CHAPTER 32
County Funding
Introducon
Prior chapters have idened which enes are responsible for funding the various
human services being provided in the county. “Human services” is dened broadly as
those services that promote the physical and psychological wellbeing of Lee County
residents. It encompasses the basic human needs for food, shelter, employment,
transportaon and recreaon. It also includes those services most commonly thought
of as human services that address the needs of people in deep poverty or those with
various disabilies. It does not include public safety needs addressed by law
enforcement, re protecon and emergency medical services nor does it include
physical health services.
This chapter reports on the FY 18/19 funding that was provided by the Lee Board of
County Commissioners (BoCC). Count-provided funding was of three types:
Mandated. This is County funding for human services that is required by law
and regulaon. In some cases, the specic amount of the funding is stated. In
other cases, the requirement is that the County fund the program or service, but
the specic funding level is not stated.
Policy Choice. These are programs or services that the BoCC chooses to fund or
not. There is no requirement that these programs or services be funded. Rather
it is a policy decision on the part of the Board, which means it can be modied
at the direcon of the Board.
Grants and Donaons. These are funds the County secures for use in Lee County
via submial of proposals or some other mechanism. These are outside-the-
County resources that are obtained for the benets of Lee County residents.

DRAFT Lee County Human Services Gap Analysis
Secon Seven: Funding
Chapter 32 | County Funding Page | 406
The Denion of Human Services
The internal structure of county governments varies by a mix of policy direcon and
managerial choice. One county may group a range of services into one department and
label that department human services. Another may choose to distribute that same
group of services across several departments. Using those department budgets as an
indicator of commitment to human services is erroneous.
Therefore, a review of department funding to determine a county’s commitment to
human services is likely to be misleading. The more accurate approach is to incorporate
all programs and services that promote human health and wellbeing. Some of these
services are focused on individuals with disabilies or “problems” or in deep poverty.
Others are for the welfare of all residents whose wellbeing is supported or enhanced by
the program.
The criteria for this analysis is general wellbeing. From that perspecve recreaon
programs, library services or transit are equally a human service as is a program focused
solely on serving a homeless person.
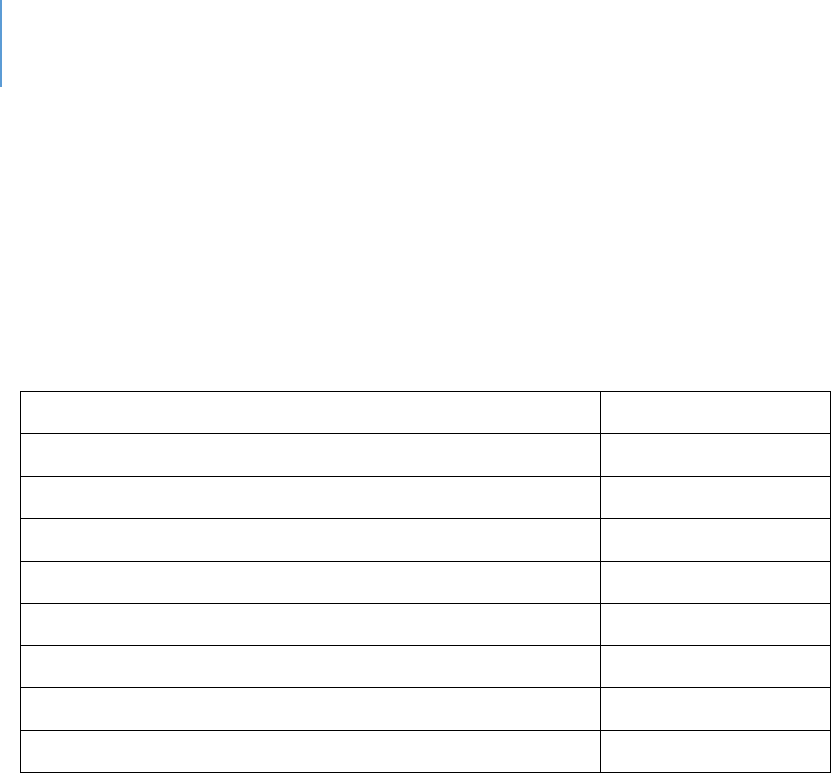
DRAFT Lee County Human Services Gap Analysis
Secon Seven: Funding
Chapter 32 | County Funding Page | 407
Mandated Funding
Table 112 presents the programs and services which County government is mandated
to provide. As the table shows, the County commits slightly more than $29 million to
various services.
Table 112. Mandated Services
Medicaid
1
$8,965,047
State Mandated
3
Child Protecve Team Exams
$245,700
Indigent Cremaon
$57,241
Mental Health
$4,425,451
State Health (incl. operang expense)
3
$2,285,329
Juvenile Jusce Cost Share
1
$1,915,460
Inmate Medical Expense
2
$11,297,090
TOTAL
$29,191,318
1 Lee County BOCC Non-Departmental General Fund
2 Lee County Sheri's Oce General Fund
3 Lee County BOCC Human Services General Fund

DRAFT Lee County Human Services Gap Analysis
Secon Seven: Funding
Chapter 32 | County Funding Page | 408
Policy Choice Funding
This is funding that is at the discreon of the Board of County Commissioners. As the
table shows, the County spends roughly $80 million by choice on the wellbeing of its
residents.
Table 113. Policy Choice funding FY 18-19 Actuals
Partnering for Results Program
3
:
Youth Services
$2,869,804
Disabled
$821,463
Seniors
$399,927
Domesc Violence
$327,519
HIV/AIDS
$121,720
Behavioral Health
$85,155
Homeless
$78,000
United Way 211
$45,000
Aordable Housing
$35,786
Veterans
$25,000
Sub-total
$4,809,374
$4,809,374
Human Service Dept. Operang
3
$4,029,065
Sub-total
$4,029,065
Comprehensive Human Services
Transit
5
$16,730,848
Partnering for Transportaon Results
6
$444,254
Lee County Parks and Recreaon
7
$22,220,215
Lee County Library Services
8
$32,035,769
Sub-total
$71,431,086
TOTAL
$80,269,525
3 Lee County BOCC Human Services General Fund
5 Lee County BOCC Transit (Lee Tran) General Fund, Fares, Ads (excludes Beach Trolley)
6 Lee County BOCC Transit Grants (Non-Departmental)
7 Lee County BOCC Parks MSTU and General Fund (excludes: Professional and Amateur Sports: $7.4 million and
Conservaon 2020: $5.4 million)
8 Lee County BOCC Library Mileage
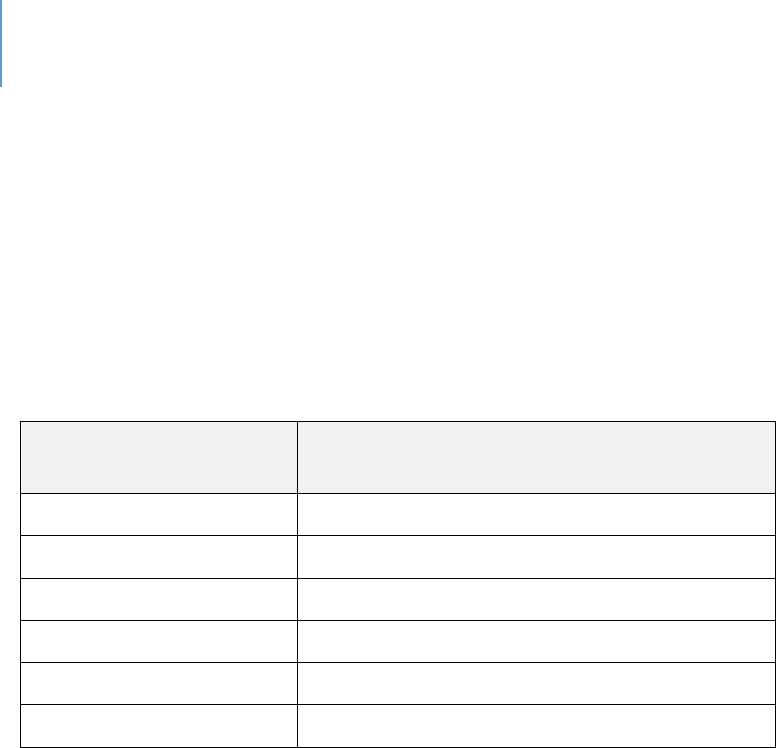
DRAFT Lee County Human Services Gap Analysis
Secon Seven: Funding
Chapter 32 | County Funding Page | 409
Table 114 shows where the Lee BoCC provides discreonary funding annually to the
court system of $7.7 million for addional posions in the following areas: Pretrial
Services, Drug Court, Veterans Court, Domesc Violence, Teen Court, Juvenile
Arbitraon, Mediaon, Family Court, Public Guardians, Jail Reducon, Early Resoluon
Cases, Mental Health Court, Inial Defense Unit, Rapid Response Unit, Guardian Ad
Litem and Legal Aid.
Table 114. Court System FY 18-19 Actuals
Enty
Addional Discreonary Funding for
Posions
Court Administraon
$5,523,938
State Aorney
$649,300
Public Defender
$771,265
Guardian Ad Litem
$80,160
Legal Aid(s)
$719,366
TOTAL
$7,744,029

DRAFT Lee County Human Services Gap Analysis
Secon Seven: Funding
Chapter 32 | County Funding Page | 410
Grants and Donaons
Table 115 shows the amount of grants and donaons that were obtained by the County
for the benets of residents. More than $15 million was secured for these purposes.
Table 115. Discretionary Grants/Donations
Community Development Block Grant
4
$2,184,886
Criminal Jusce, Mental Health, Substance Abuse
4
$226,319
Community Service Block Grant
4
$95,748
HOME Investment Partnerships Program
4
$1,145,132
Emergency Grant Soluons
4
$463,918
Low Income Home Energy Assistance Program
4
$1,158,870
Neighborhood Stabilizaon Program (1&3)
4
$494,227
Human Services Other
4
$338,174
Homeless Coalion Stang
4
$26,786
Florida Challenge Grant
4
$80,113
Unied Stang Grant
4
$80,357
HOPWA
4
$94,169
TANF Homeless Prevenon
4
$36,774
FEMA Disaster Case Management
4
$515,392
Supporve Housing Program (Human Services)
4
$1,474,389
Transit Federal and State Funding
9
$6,913,693
TOTAL
$15,328,947
4 Lee County BOCC Human Services Grants and Donaons
9 Lee Tran Fed and State Funding
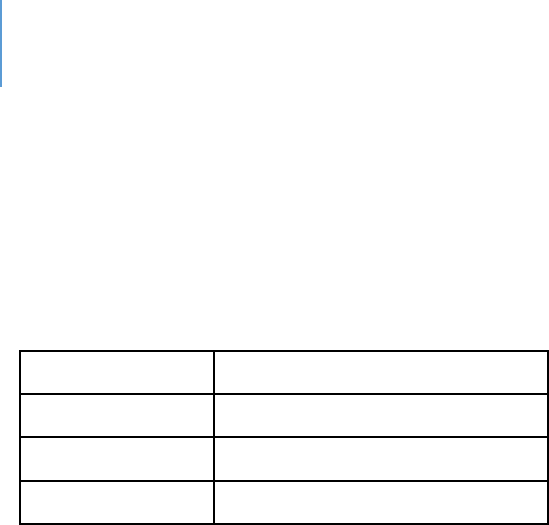
DRAFT Lee County Human Services Gap Analysis
Secon Seven: Funding
Chapter 32 | County Funding Page | 411
Total
As Table 116 shows, the total expenditure of funds for the wellbeing of County
residents was more than $132 million.
Table 116. Total Human Services Expenditure
Mandated
$29,191,318
Policy Choice
$88,013,554
Grants
$15,328,947
GRANT TOTAL
$132,533,819

DRAFT Lee County Human Services Gap Analysis
Secon Seven: Funding
Chapter 32 | County Funding Page | 412
Intenonally le blank.

DRAFT Lee County Human Services Gap Analysis
Secon Eight: Conclusions
Section Eight: Conclusions Page | 413
Secon Eight: Conclusions

DRAFT Lee County Human Services Gap Analysis
Secon Eight: Conclusions
Section Eight: Conclusions Page | 414
Intenonally le blank.

DRAFT Lee County Human Services Gap Analysis
Secon Eight: Conclusions
Chapter 33 | Core Drivers Page | 415
CHAPTER 33
Core Drivers
Introduction
This study has identified numerous gaps with varying degrees of impact and
significance. The question this chapter seeks to answer is whether there is a set of
underlying factors that contribute to many of these gaps in part if not in whole. The
chapter will present the argument that there are four factors that are found in most
gaps. This is not to imply that these are the only four factors or that other factors are
not at work; nor is it to imply that for any specific individual that these four factors are
always present singularly or in some combination. They are not, and there are certainly
other factors to consider, some of which are specific to the topic under examination.
These four factors are termed the “core drivers” in that (1) they are common to many
service needs and (2) they drive much of the activity needed to address the needs in a
comprehensive way. What are these four factors or drivers?
The core argument of this chapter is presented in Section One: Core Drivers. Section
Two presents an illustrative case study of how these core drivers relate to a selected
human service problem, domestic violence. Section Three discusses why these core
drivers are significant. Section Four contains five attachments, four of which provide
more in-depth discussion of the core drivers. A fifth attachment relates to the case
study.

DRAFT Lee County Human Services Gap Analysis
Secon Eight: Conclusions
Chapter 33 | Core Drivers Page | 416
Section One: The Core Drivers
The four core drivers are cost-burden & poverty, serious mental illness, substance abuse
and trauma. Each is discussed below with its rationale for being considered a core
driver.
Cost burden & poverty. The term cost-burden is used here with the term poverty
because there are critiques of Federal Poverty Levels as being unrealistic as to
actual cost of living.
655
The concept of cost-burden will be used to help address
this criticism. Poverty is used in two senses: Its standard financial use and as the
poverty of experience. This is a broader concept of poverty that encompasses
the point that impoverished individuals or families, particularly children, do not
have a variety of important developmental experiences. It should be noted that
there are multiple critiques of both how household income is calculated as well
as the federal poverty level. These are discussed in Appendix J. However,
because proposed alternatives are not yet broadly used or available, the existing
data will be used.
It is evident from the design of many human services that cost-burden is a factor.
For some services, poverty level determines eligibility. For others, the only
reason they are needed, such as food banks, it that the person or household is
cost-burdened.
In addition, human services are public services in the sense they are designed to
be provided to the public regardless of their economic resources. Individuals
with a mental illness for example, may be able to pay for private mental health
care through personal wealth or insurance. For those without such financial
options, public mental health services are provided. By this very fact, cost-
burden and poverty is a frequently found factor in many human services.
Serious mental illness. The term Serious Mental Illness (SMI) describes a mental,
behavioral or emotional disorder that results in serious functional impairment
and substantially interferes with or limits one or more major life activities. These
include schizophrenia, severe bipolar illness and severe major depression. The
655
www.nccp.org/topics/measuringpoverty.

DRAFT Lee County Human Services Gap Analysis
Secon Eight: Conclusions
Chapter 33 | Core Drivers Page | 417
term Any Mental Illness (AMI) covers all recognized mental illnesses, of which
there are more than 300 diagnostic categories.
656
Unless one has independent financial resources, there is a logical link between
serious mental illness and cost-burden. Individuals with serious mental illness
are frequently unable to secure employment or maintain employment stability,
and as a result they are financially challenged.
Serious mental illness has been linked at times to issues involving other systems
of care including.
657
Legal
Homelessness
Self-harm
Domestic violence
Various medical conditions
Substance abuse
Dropping out of school
Unemployment
Substance abuse. Substance abuse can be considered a sub-category of mental
health in that addictive disorders are classified as a mental illness. As noted just
above, 19% of adults with mental illness also experienced a substance abuse
disorder. These are called co-occurring disorders. Studies link depression, anxiety
and substance abuse and find that alcohol and drugs are often used to self-medicate
the symptoms of mental health problems.
658
There are significant costs incurred by communities in terms of criminal justice costs,
loss of local economic productivity and loss of community safety. Other social
problems associated with substance abuse include:
659
Domestic violence
Child abuse
656
National Institute of Mental Health/home/mentalhealthinformation/statistics
657
Mayo, ibid.
658
https://www.helpguide.org/articles/addictions
659
www.healthypeople.gov/2020topicsandobjectives/substanceabuse

DRAFT Lee County Human Services Gap Analysis
Secon Eight: Conclusions
Chapter 33 | Core Drivers Page | 418
Crime
Suicide
Homicide
Teenage pregnancy
HIV/AIDS and sexually transmitted diseases
Financial exploitation of family members or vulnerable persons
Physical fights
Trauma. While trauma can be linked to mental health or illness or substance abuse from
both causal and consequential perspectives, it is significant enough to be considered as
a separate driver. Those who are mentally healthy and have no history of substance
abuse can experience trauma that results in some level of maladaptive behavior or
internal distress.
SAMHSA
660
defines trauma as:
661
“Individual trauma results from an event, series of
events, or set of circumstances experienced by an individual as physically or emotionally
harmful or life-threatening with lasting adverse effects on the individual’s functioning
and mental, physical, social, emotional, or spiritual wellbeing.”
First, trauma impacts everyone differently. Many people exhibit resilient behaviors or
brief symptoms. Short-term reactions are normal. Others have more destructive
reactions, including:
662
Mental illness
Anxieties
Depression
Avoidance
Difficulty regulating anger, shame, sadness
Addiction: self-medication to control emotions
Compulsive behaviors such as gambling
Poor physical health outcomes, including long-term fatigue, sleep disorders
High-risk behaviors, such as eating disorders
660
Substance Abuse and Mental Health Services Administration
661
www.integration.samsha.gov/clinical practice/trauma
662
ibid.

DRAFT Lee County Human Services Gap Analysis
Secon Eight: Conclusions
Chapter 33 | Core Drivers Page | 419
Section Two: How these core drivers underlie various human service issues: A
case study of domestic violence
The Thesis
These thesis of this case study is simple. It is that if one examines cases of
domestic violence in-depth, there is a reasonable probability that one or more of
the core drivers will be present. This is not true in every case, as there are
abusers who are not seriously mentally ill, do not abuse substances, who were
not exposed to trauma and are affluent. But the probability is that in a good
percentage there will be at least one core driver present.
A case study
To examine how these four drivers relate to the other human services issues, an
in-depth analysis of one issue will be conducted. The issue of domestic violence
will be used.
In domestic violence, one spouse or partner – this example uses the male in a
heterosexual relationship – abuses the other physically, psychologically or
emotionally. This abuse may occur without any evidence of mental illness,
substance abuse, prior abuser, trauma or poverty. There have been a variety of
explanations offered to understand the causes of domestic violence. These are
provided in Attachment E.
663
Explaining causality is not what this section is attempting to do. Instead, this is
an attempt to determine correlation and/or association. Correlation is not
causality. Furthermore, each of the causal models discussed in Attachment E
attempted to be all-encompassing. No such argument is made here. Instead,
this is an attempt to determine probabilities.
These four core drivers cannot explain all problematic behavior, however, they
do indicate probability. If the household is under a cost-burden, and if a male (to
use a common experience) is engaged in substance abuse, there is a higher
probability that domestic violence may occur. Or if the male (again to draw on
663
theories of violence. www.hdrlibrary.umn.edu

DRAFT Lee County Human Services Gap Analysis
Secon Eight: Conclusions
Chapter 33 | Core Drivers Page | 420
likelihood) was abused in some form as a child and carries that trauma, then the
likelihood of domestic violence increases. The same goes for mental illness.
When more of the four core drivers are present, the likelihood is greater. The
hypothesis of this analysis is that the presence of one or more of these four
drivers increases the likelihood of problematic behaviors or situations. It should
be noted that there is no personality type associated with being a batterer.
664
If this hypothesis has validity, it means that interventions in any of the four core
drivers would affect a variety of human service issues. It should be noted that
there is a concern in the domestic violence field that mental illness, alcoholism,
childhood trauma or poverty can be used as excuses to justify or explain an act
of domestic violence. These acts are inexcusable and are no reason for anyone –
the person being abused, law enforcement or treatment professional – to ignore
or minimize such acts. However, it is an empirical question as to whether
abusers have higher rates of these factors than non-abusers. To test the
hypotheses, the following statistics are examined:
Studies of men arrested for domestic violence have found:
The prevalence of depression, aggression and mood disorder:
There are high rates of PTSD;
665
There are high rates of depression;
666
Men who are abusers report higher rates of anxiety than non-
abusers;
667
Rates of aggression were higher than with males not having a
mental health issue.
668
Rates of alcohol and drug disorders are very high:
669
There is a high correlation between alcohol and substance abuse
and intimate partner violence. Incident studies have found that
up to 92% of intimate partner violence (IPV) assailants used drugs
664
ibid
665
Shorey, R. et.al. 2012. The prevalence of mental health problems in men arrested for domestic violence. J. Fam
Violence. 27(8): 741-748.
666
Ibid.
667
Hester, M. 2015. "Occurrence and impact of negave behavior, including domesc violence and abuse, in men
aending UK primary care health clinics: a cross-seconal survey." BMJ Open 2015;5: e007141 DOI:
10.1136/bmjopen-2014-007141
668
ibid
669
ibid.

DRAFT Lee County Human Services Gap Analysis
Secon Eight: Conclusions
Chapter 33 | Core Drivers Page | 421
or alcohol on the day of the assault, and nearly half were
described by families as daily substance abusers for the prior
month;
670
Between 24% and 45% of domestic violence incidents involved
alcohol/drug use;
671
The most consistent predictor of a call to police for a domestic
assault was drunkenness.
672
There is a high prevalence of prior criminal records:
A study in Massachusetts found that 84.4% of men arrested for
domestic violence has prior criminal records averaging 13 charges
including alcohol/drug and offenses against persons;
673
A similar study in Cook County, IL, found that 57% of men charged
with domestic violence has prior records for drug offenses and
other crimes. On the average, they had 13 arrests.
674
Childhood trauma may be present:
Boys who witness abuse in the home are seven times more likely
to batter;
675
Childhood trauma has been found to be related to violence
against women as adults;
676
Parental mental illness, addiction and domestic violence are
strongly associated with childhood physical abuse.
677
Poverty is present:
Families who experience domestic violence are often
impoverished. For example, 63% of welfare recipients in
Michigan had experienced several physical abuses. Half of
homeless women and children report being victims of domestic
violence;
678
670
ibid.
671
ibid
672
ibid
673
Klein A. 2015. Practical implications of current domestic violence research for probation officers and
administrators. www.bwjp.org/assets/documents/pdfs
674
ibid.
675
Theories of violence. www.hrlibrary.umn.edu
676
Fulu, E. et.al. 2017. Pathways between childhood trauma, intimate partner violence and harsh parenting. The
Lancet. 5 (5) 512-522.
677
Fuller-Thompson E., et.al. 2019. Parental mental illness, addiction, domestic violence tied to childhood abuse.
J. Interpers Violence. Doi:10.1177/0886260519853407
678
Satyanathan, D. et. Al. Domestic violence and poverty. Michigan Family Impact Seminars. www.purdue.edu

DRAFT Lee County Human Services Gap Analysis
Secon Eight: Conclusions
Chapter 33 | Core Drivers Page | 422
Poor and minority women are disproportionally affect by
domestic violence;
679
It is estimated that roughly 80% of homeless mothers with
children have previously experienced domestic violence.
680
Another set of data indicate that the individuals being abused, primarily women,
themselves suffer from some forms of mental illness either prior to the abuse or
because of abuse
681
,
682
:
54% to 84% of battered women suffer from PTSD;
63% to 77% of battered women experience depression, and
38% to 75% percent experience anxiety;
Abuse rates are higher among homeless women with serious mental
illnesses. A study with 99 episodically homeless women with serious mental
illness, found that significant numbers had been physically (70%) or sexually
(30.4%) abused by a partner. Rates of physical or sexual abuse in adulthood
by any perpetrator were 87% and 76%, respectively;
Women who have experienced domestic abuse are three times the risk of
developing a mental illness, including severe conditions such as
schizophrenia and bipolar disorder, as those who have not;
683
Women who are abused as children are at increased risk of being victimized
in adulthood.
684
This data indicates that the core drivers of mental illness, substance abuse, trauma
and poverty are correlated with domestic violence. The act of domestic violence
itself is traumatic and children who observe it are experiencing trauma. Again, this
is not an argument for causation that these core drivers cause domestic violence.
Nor do they fully explain or account for domestic violence.
679
Aizer, A. 2011. Poverty, violence and health. J. Hum Resour. 46(3): 518-538.
680
The intimate relationship between domestic violence and homelessness. Institute for Children, Poverty and
Homelessness. www.icphusa.org
681
Briere, J. & Jordan, C. 2004. Violence against women: Outcome complexity and implications for assessment and
treatment. J Interpers Violence, 19: 1252
682
Trauma, mental health and domestic violence. www.fcadv.org
683
Mahase, E. 2019. Women who experience domestic abuse are three times as likely to develop mental illness.
BMJ 2019:365:14126
684
Cold, J. et.al. 2001. Relation between childhood sexual and physical abuse and risk of victimization in women.
The Lancet 358: 450-454

DRAFT Lee County Human Services Gap Analysis
Secon Eight: Conclusions
Chapter 33 | Core Drivers Page | 423
What they do offer, however, is practical guidance for interventions. In a limited-
resource world, choices must be made as to which interventions to support. Clearly,
interventions that seek to address mental health, substance abuse, trauma or
poverty are likely to have positive impacts on the rates of domestic violence. Will
they fully end it? No. Can there be an impact? Yes.
Domestic violence was examined as a case study. It is beyond the scope of this
paper to examine other social issues such as stranger violence, child abuse and
neglect, elder abuse and neglect, etc. to determine if these core drivers are factors
in those situations. It is likely they are for the following reasons:
The experience of being abused or victimized has some shared core
components, which generate some similar psychological or emotional
effects.
There are documented impacts across various categories of human service
needs. For example, the high percentage of homeless women and children
who have experienced domestic violence.
These problematic situations involve some level of trauma for someone.
Conclusion
The thesis that mental illness, substance abuse, trauma or poverty could be
related to domestic violence is accepted.

DRAFT Lee County Human Services Gap Analysis
Secon Eight: Conclusions
Chapter 33 | Core Drivers Page | 424
Section Three: Why are these core drivers significant?
Three reasons:
1. Cost-burden, mental illness and substance abuse underlie the three major
gaps of the human services system in Lee County. As reported elsewhere in this
assessment, housing, transportation and mental health are consistently reported
in various data collection methods as the three most significant needs. Cost-
burden underlies the housing and transportation barriers. The lack of services to
address serious mental illness and substance abuse speak for themselves.
2. As reported in the funding section, substantive funds are expended by federal,
State and local government on various human service issues. The effectiveness
of many of the Systems-of-Care, and the funds dedicated to them, is limited by
the resources and tools available to address cost-burden, mental illness,
substance abuse or trauma. The case study on domestic violence presented
below will illustrate how these four factors impact other human service issues.
3. Stand-alone interventions, which address only a single issue while ignoring
the other factors in a person’s life, are minimally effective at best. This is the
concept behind System-of-Care thinking, which emphasizes addressing the
whole person. If an intervention does not address these four core drivers in
addition to the specific presenting issue, it is of minimal value in most cases.
Section Four: Attachments
Four attachments are provided after this chapter that provide a more in-depth
discussion of each of these four drivers. A fifth attachment is related to the case study.
These attachments are:
Attachment A: Cost-burden and poverty. The housing chapter provides data on
housing cost-burden in the county and other chapters, such as food and
nutrition, provide data. This attachment however combines all that information
so that the reader can gain an understanding of the scope of cost-burden and
poverty in Lee County.

DRAFT Lee County Human Services Gap Analysis
Secon Eight: Conclusions
Chapter 33 | Core Drivers Page | 425
Attachment B: Serious Mental Illness. This attachment provides an overview of
the topic. The behavioral health and behavioral health and criminal justice
chapters provide in-depth perspectives. This attachment focuses on behaviors
associated with mental illness.
Attachment C: Substance Abuse. As with Attachment B, this attachment
provides an overview. The same two chapters listed above provide the in-depth.
This attachment focuses on behaviors associated with substance abuse.
Attachment D. Trauma. This attachment provides an overview. The chapters on
domestic violence, child abuse, elder abuse, sexual violence and exposure to
violence all address specific settings in which trauma may occur. This attachment
focuses on behaviors associated with trauma.
Attachment E: Explanations for domestic violence. This attachment provides
supplementary information relevant to the case study presented below.

DRAFT Lee County Human Services Gap Analysis
Secon Eight: Conclusions
Chapter 33 | Core Drivers Page | 426
Attachment A: Cost-Burden and Poverty
Cost-burden and Poverty
The term cost-burden is used here with the term poverty because there are critiques of
Federal Poverty Levels as being unrealistic as to actual cost of living.
685
The concept of
cost-burden will be used to help address this criticism. Poverty will be used in two
senses: Its standard financial use and as the poverty of experience. This is a broader
concept of poverty that encompasses the point that impoverished individuals or
families, particularly children, do not have a variety of important developmental
experiences. This concept will be further discussed later in this chapter.
Cost-burden makes empirical assumptions about what proportion basic cost-of-living
categories (food, housing, transportation and utilities) should comprise a household’s
budget. Household size shifts these proportions, but the concept applies across
household sizes.
The following are some standard definitions:
HUD defines cost-burdened families as those who pay more than 30% of their
income for housing and may have difficulties paying for other necessities;
686
Severe cost-burden is defined as paying more than 50% of one’s income for
rent.
687
However, there are several problems with this definition. Household size can
significantly affect this percentage. Cost-of-living differences can also make it
problematic. None of this is to deny that households can find it difficult to afford
housing once other living costs are included.
HUD has established that low-income households (those earning less than 50% of the
area median income and who pay more than half their income in rent) live in
685
www.nccp.org/topics/measuringpoverty.
686
www.huduser/gov/portal/pdredge/pdr_edge_fead_article_092214
687
ibid
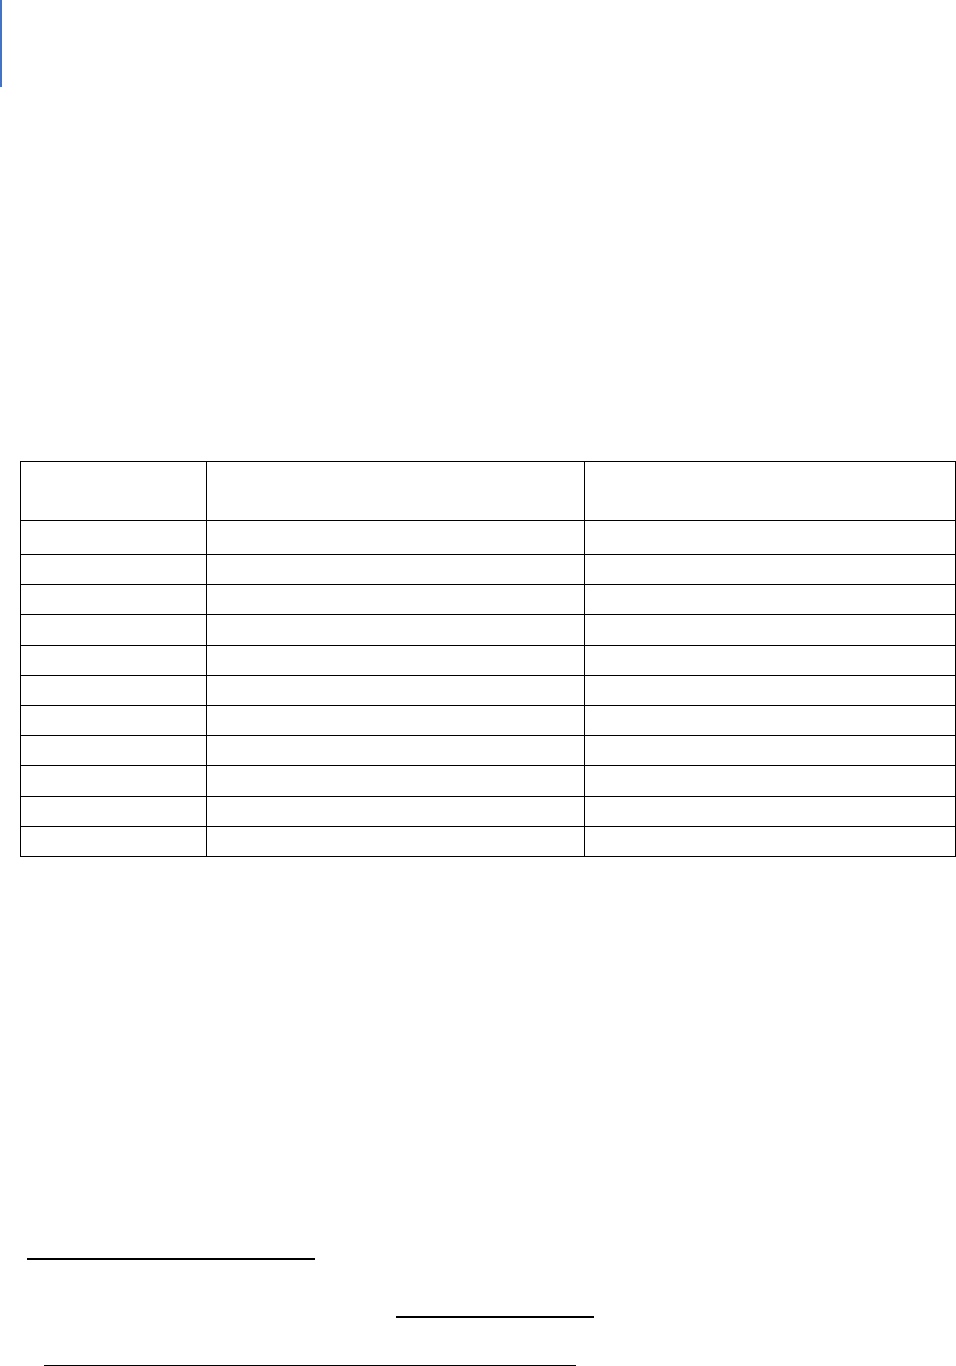
DRAFT Lee County Human Services Gap Analysis
Secon Eight: Conclusions
Chapter 33 | Core Drivers Page | 427
substandard housing conditions.
688
While there are legitimate differences on how to
measure cost-burden, its reality is acknowledged.
Florida is among the highest cost-burdened states for rental housing at 56.4%.
689
However, among the major Florida counties and the counties on the west coast, in 2017
(as shown in Table 117), Lee County had the lowest cost-burden percentage. In 2018, it
did not.
Table 117. Cost-burdened Data
690
County
Percentage of Cost-burdened
Renters 2017
Percentage of Cost-burdened
Renters 2018
691
Broward
61.4%
61.3%
Charlotte
51.7%
63.5%
Collier
56.9%
58.5%
Hillsborough
53.4%
53.0%
Lee
48.7%
55.4%
Manatee
57.3%
49.0%
Miami-Dade
64.8%
64.3%
Orange
56.0%
55.3%
Palm Beach
59.3%
60.7%
Pinellas
55.4%
53.6%
Sarasota
55.4%
52.3%
A variety of websites designed to assist with budgeting have the following
recommended budget percentages for non-housing expenses. These include:
15% to 20% for transportation;
15% for food and household supplies;
5% to 10% for utilities; and
10% to 20% for healthcare and insurance.
These sites recommend that housing, food and transportation should not exceed 65% of
household income.
688
2013. Worst case housing needs 2011: Report to Congress. HUD.
689
Salviati, C. 2018. 2018 Cost Burden Report. www.apartmentlist.com
690
op.cit.
691
https://www.apartmentlist.com/rentonomics/cost-burden-2019/
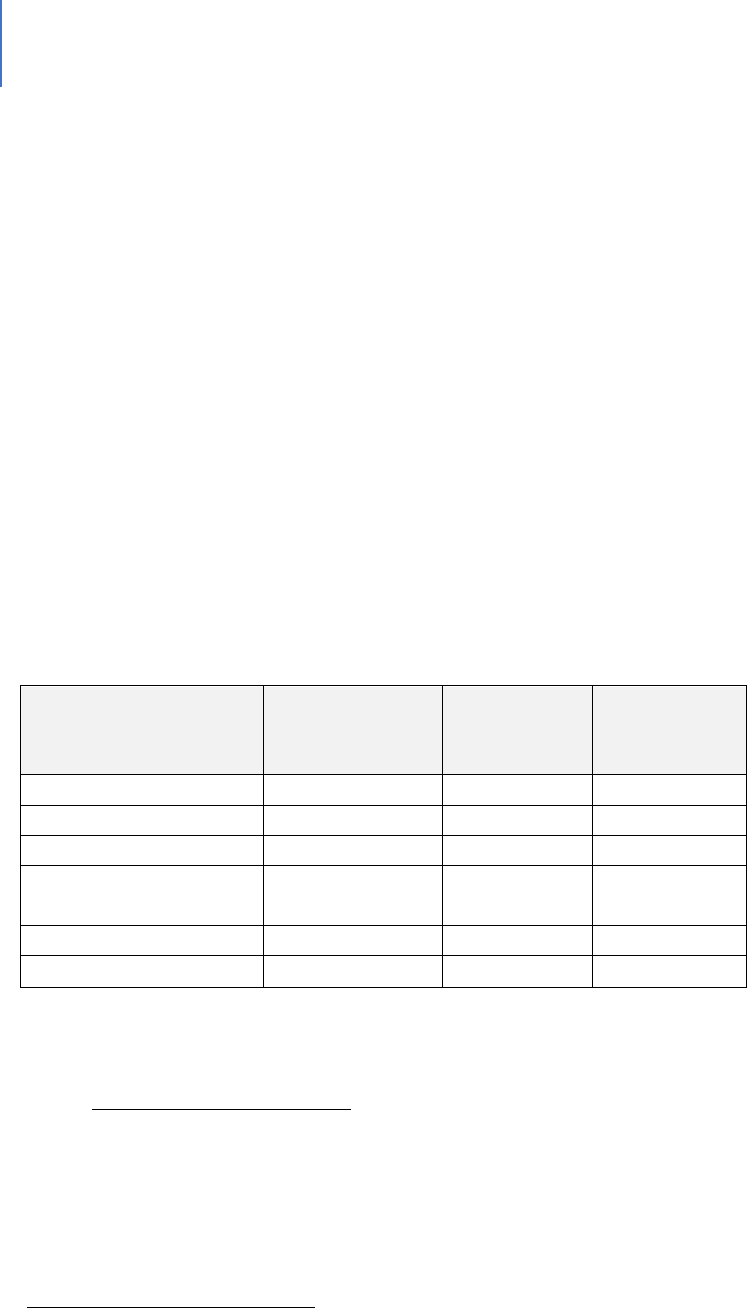
DRAFT Lee County Human Services Gap Analysis
Secon Eight: Conclusions
Chapter 33 | Core Drivers Page | 428
To examine actual spending practices, the Bureau of Labor Statistics produces an annual
report on consumer expenditures. These numbers show what various households
spend. As Table 118 shows, the average household spends slightly more than 30% to
32% on housing including utilities. The next highest percentage is transportation in the
15% to 17% range and food in the 12% to 13% range. If the mid-point of these ranges is
taken, then 59% to 60% of household income is spent on these three basics.
Using this data, a moderate cost-burdened household may be defined as those spending
substantially more than 60% of their income on a combination of housing,
transportation and food. Severe cost-burden is defined primarily in terms of housing
costs with households spending 50% or more of their income on housing (rent,
mortgage and utilities) considered as severely burdened. A severe cost-burdened
household would spend 75% to 80% of its income on housing, transportation and food.
Table 118. Shares of average expenditures on selected major components by composition of
consumer unit, 2018
692
Item
All Consumer
Units
Married
Couple Only
Married
Couple with
Children
Housing
32.8%
30.2%
31.3%
Transportation
15.9%
15.6%
17.1%
Food
12.9%
12.4%
13.2%
Personal insurance
and pensions
11.9%
11.7%
14.0%
Healthcare
8.1%
10.2%
7.0%
Apparel and services
3.0%
2.7%
3.2%
Transportation is the second largest housing expenditure category after housing.
693
Cost-burden in Lee County
Having derived the above definitions of moderate and severe cost-burdened, is there an
issue of cost-burden in Lee County? As the tables below will demonstrate, more than
20,000 households in Lee County live on a month-to-month existence in which any
unusual expense may not be manageable.
692
Consumer expenditures, 2018. Bureau of Labor Statistics. Economic News Release, September 10, 2018
693
TET 2018 – Household spending on transportation. U.S. Bureau of Transportation Statistics. www.bts.gov
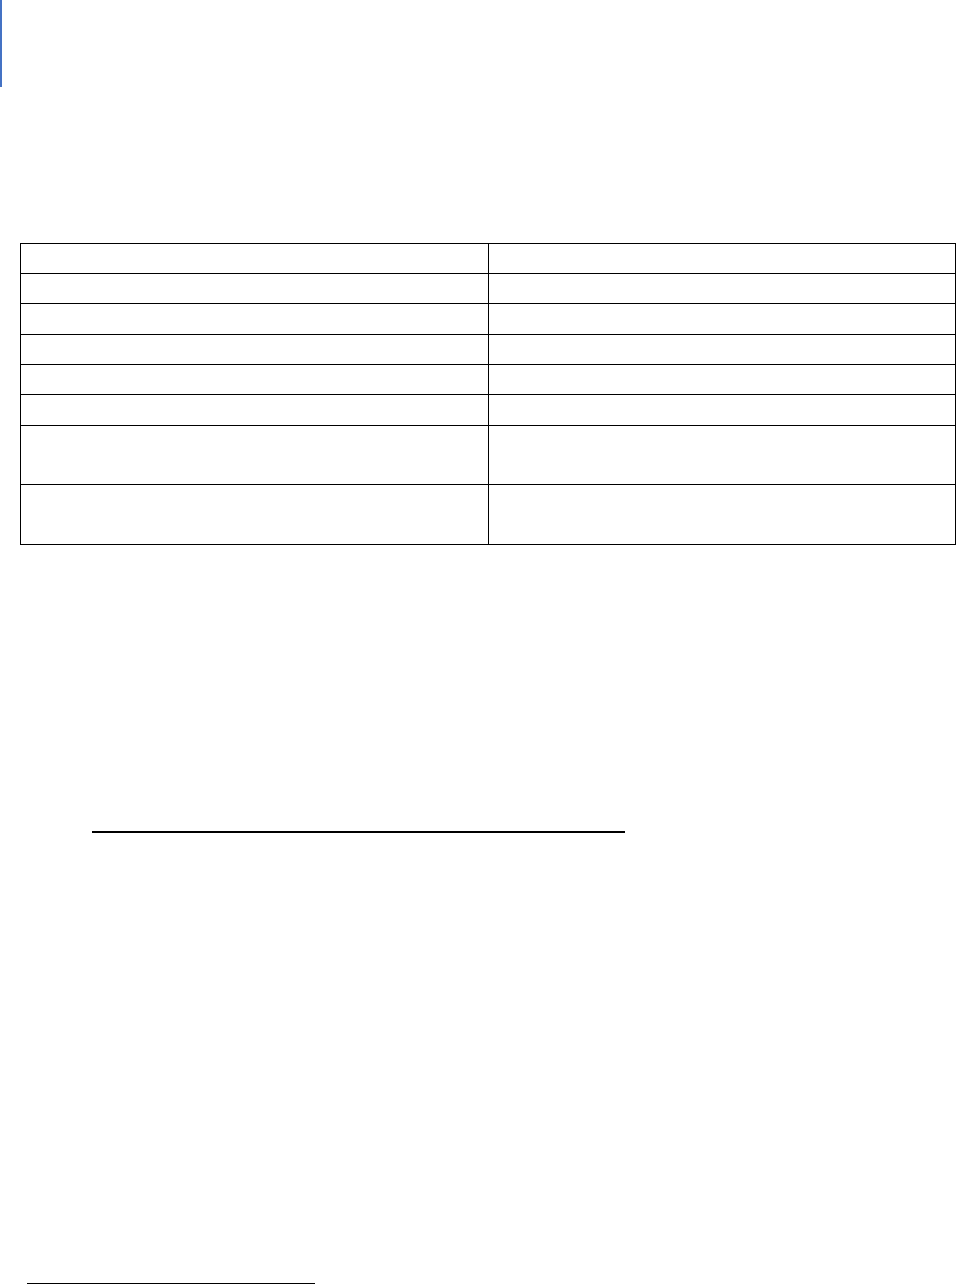
DRAFT Lee County Human Services Gap Analysis
Secon Eight: Conclusions
Chapter 33 | Core Drivers Page | 429
Table 119 presents more detailed rental housing cost-burden data for Lee County.
Table 119. Moderate and Severe Housing Cost-Burden
694
Category 2018 Data
Data
Total Number of Rental households
71,442
Overall percentage that are cost-burdened
55.4%
Percentage moderately cost-burdened
27.0%
Percentage severely cost-burdened
28.4%
Total Number of Cost burdened
39,614
Total Number of moderately cost-burdened
households
19,325
Total number of severely cost-burdened
households
20,289
As the table indicates, more than 20,000 households in Lee County are severely cost-
burdened with respect to spending 50% or more on housing. If average transportation
and food costs are added in, the total cost-burden of these households for the three
basics is 75% to 80%. As stated earlier, these households are in a marginal or month-to-
month existence where any unusual expense may not be manageable.
The Impacts of Being Cost-burdened as Severe Poverty
For purposes of this analysis, severe cost-burden will be equated to poverty. What are
the conditions associated with poverty and what are the consequences of poverty?
These associated conditions
695
are linked to poverty:
Substandard housing
Homelessness
Inadequate nutrition
Inadequate child-care
Lack of access to health care
Unsafe neighborhoods
Under-resourced schools
694
Salviati, op.cit.
695
Effects of poverty, hunger and homelessness on children and youth. American Psychological Association, Public
Interest directorate. Children, Youth and Families.

DRAFT Lee County Human Services Gap Analysis
Secon Eight: Conclusions
Chapter 33 | Core Drivers Page | 430
Poor academic achievement
School drop-out
Abuse and neglect
Behavioral and socioemotional problems
Physical health problems
Developmental delays
Researchers have determined the following effects:
Poverty in general has negative effects on social life
696
It has negative effects on political participation
697
The risk of weakening social relations is increased
698
Poverty can be a major cause of social tensions
699
Children from poor backgrounds lag at all stages of education
700
People with lower incomes are at more risk of social isolation
701
There is a relationship between poverty and crime
702
Alcohol and substance abuse are associated with poverty
703
Poverty is related to anti-social behavior
704
The Poverty of Experience
Child development research has identified that lack of school readiness separates
disadvantaged children from their more affluent peers. As early as age 18 months, low-
income children begin to fall behind in vocabulary development and other skills critical
for school success.
705
696
Mood, C. & Jonsson, J. 2016. The social consequences of poverty: an empirical test on longitudinal data. Soc
Indic Res: 127:633-652.
697
Ibid
698
ibid
699
effects of poverty on society. www.borgenproject.org
700
effects op.cit
701
impact of poverty on relationships. www.jrf.org.uk/data/impact-poverty-relationships
702
Poverty and crime. 2011. www.poverties.org
703
Effects of poverty on society, health, children and violence. www. Poverties.org
704
ibid
705
www.gradelevelreading.net/3rdgradereadingsuccessmatters

DRAFT Lee County Human Services Gap Analysis
Secon Eight: Conclusions
Chapter 33 | Core Drivers Page | 431
Other data points that illustrate this gap are:
706
61% of low-income children have no children’s books at home;
Poor children hear as many as 4 million fewer words than their more affluent
peers;
707
By age 2, poor children are already behind their peers in listening, counting and
other skills essential to literacy;
A child’s vocabulary as early as age 3 can predict third-grade reading
achievement;
By age 5, a typical middle-class child recognizes 22 letters of the alphabet,
compared to nine for a child from a low-income family;
It has been determined that children who are not proficient in reading when
finishing the third-grade are more likely to enter the “drop-out of school”
track
708
. Students’ reading skill level by third-grade (e.g., proficient, basic, or
below basic) affects their likelihood of graduating from high school. 23% of
students with below-basic reading skill levels dropped out or failed to finish high
school on time, compared to 9% of students with basic skill levels and 4% of
students with proficient reading skills.
709
Dropping out of school has a negative impact both for the student who drops out and
for American society. The key points are:
Increased demand for public assistance.
Half of Americans on public assistance are dropouts. A study out of
Northeastern University found that each high school dropout costs
taxpayers $292,000 through the course of their lives.
710
.
706
ibid
707
Gilkerson, J. et.al. 2016. Mapping the language environment using all-day recordings and automated analysis.
American Journal of Speech Language Pathology. Doi.org/10.1044/2016_AJSLP-15-0169.
708
Early Warning: Why Reading at 3
rd
grade matters. Annie E. Casey Foundation
709
Hernandez DJ. Double jeopardy: how third-grade reading skills and poverty inuence high school graduaon.
New York: The Annie E. Casey Foundaon; 2011
710
graduationalliance.com

DRAFT Lee County Human Services Gap Analysis
Secon Eight: Conclusions
Chapter 33 | Core Drivers Page | 432
Reduced opportunity for tax revenue.
Less income means less taxes paid.
711
Lifetime earnings of high school
dropouts are $260,000 less than peers who earn a diploma. Dropouts on
average bring in $20,241 annually ($10,000 less than high school grads
and more than $36,000 less than those with a bachelor’s degree).
The unemployment rate for dropouts is generally 4% higher than the
national average.
712
Each year’s class of dropouts will cost the country more than $200 billion
during their lifetimes in lost earnings and unrealized tax revenue.
713
The estimated tax revenue loss from every male between the age of 25
and 34 who did not complete high school would be approximately $944
billion, with cost increases to public welfare and crime at $24 billion.
714
Demand for health care and inability to afford health care.
High school dropouts are more likely to have higher rates of heart
disease, diabetes, asthma and high blood pressures than high school
graduates.
715
They are more likely to die prematurely.
716
Dropouts have a 27% higher rate of poverty compared to 14% for high
school graduates and 5% for college graduates.
717
711
graduationalliance.com
712
graduationalliance.com
713
Caerall, J. S. (1985). On the social costs of dropping out of schools. (Report No. 86-SEPT-3). Stanford, CA:
Stanford University, Center for Educaonal Research.
714
Thorstensen, B. I. If you build it, they will come: Invesng in public educaon (PowerPoint Presentaon).
Retrieved January 12, 2004. Available:hp://abec.unm.edu/resources/gallery/present/invest_in_ed.pdf
715
Vaughn, M, et.al. 2014. Dropping out of school and chronic disease in the United States. Z Gesundh Wiss 22(3):
265-27
716
DeBaum, B. et.al. 2013. Well and Well-Off: Decreasing Medicaid and Health-Care costs by increasing
educational attainment. http://alt4ed.org.
717
2012-2016 American Community Survey 5 Year Estimates. U.S. Census Bureau

DRAFT Lee County Human Services Gap Analysis
Secon Eight: Conclusions
Chapter 33 | Core Drivers Page | 433
Demand for law enforcement, corrections and prisons.
High school graduates are less likely to engage in criminal behavior or
require social services.
718
Poor reading skills by age 8 are not the only reason for dropping out of school of course.
Some other factors are:
Students whose parents are not involved are more likely to drop out of school;
719
Drop-out rates are higher in schools with safety and violence issues;
720
Sixth-graders who exhibit high aggression scores and low study skills have a 50%
drop-out rate compared to those with low aggression scores and high study skills
who have a drop-out rate of less than 2%;
721
Drop-out rates are related to family income. Students from low-income families
have a dropout rate of 10%; students from middle-income families have a
dropout rate of 5.2%, and 1.6% of students from high-income families dropout.
The immediate consequences of being cost-burdened can be stress, housing instability,
food insecurity and/or potential inability to be a reliable employee. The longer-term
possible consequences of lower income can be health issues, reliance on welfare and/or
engagement with the criminal justice system. These can separately or in some
combination contribute to problematic behaviors requiring some form of social
intervention.
718
Sum, A. et al. (2009). The Consequences of Dropping Out of High School: Joblessness and Jailing for High School
Dropouts and the High Costs for Taxpayer. Boston, MA: Center for Labor Market Studies
719
Jaynes, WH. The relaonship between parental involvement and urban secondary school student academic
achievement. Urban Educ. 2007;42(1):82–110.
720
Bekhuis, T. Unsafe public schools and the risk of dropping out: a longitudinal study of adolescents. Paper
presented at the annual meeng of the Eastern Psychological Associaon; 1995; Boston (MA).
721
Orpinas, P. 2018. Longitudinal examination of aggression and study skills from middle to high school. Journal of
School Health. 83(30 246

DRAFT Lee County Human Services Gap Analysis
Secon Eight: Conclusions
Chapter 33 | Core Drivers Page | 434
Attachment B: Mental Health Discussion
Mental Health
The term mental health refers to a person’s cognitive, behavioral and emotional
wellbeing. It is a state of psychological wellbeing from which an individual can function
effectively in society, cope with the stresses of normal life, work productively and
contribute to their community. Sometimes the term is used to refer to an absence of a
mental disorder. However, it is not simply the absence of mental disorder, but the
presence of various strengths.
Life complications that may be linked at times to mental illness include:
722
Legal and financial problems;
Poverty and homelessness;
Self-harm or harm to others;
Weakened immune system;
Heart disease and other medical conditions;
Problems with tobacco, alcohol or drugs;
Missing work or school;
Relationship difficulties;
Dropping out of school: high school students with a significant symptom of
depression are more than twice as likely to drop compared to their peers:
723
Unemployment: the rate of unemployment is higher among adults with mental
illness;
724
Substance abuse: 19% of adults with mental illness also experienced a substance
abuse disorder.
725
Mental Illness Can Range in Severity and Type. There are various classification schemas.
The DSM identifies 300 specific mental illnesses. One such schema identifies the
following types:
722
Mayo, ibid.
723
Dupere, V. et.al. 2018. Revisiting the link between depression symptoms and high school drop-out. J. Adolesc
Health 62(2):205-211.
724
Lipari, op.cit.
725
Lipari, op.cit.

DRAFT Lee County Human Services Gap Analysis
Secon Eight: Conclusions
Chapter 33 | Core Drivers Page | 435
Anxiety disorder is severe fear or certain situations. There are a variety of sub-
types such as panic disorders, phobias and obsessive-compulsive disorder;
Mood disorders are significant changes in mood. Sub-types include major
depression, bipolar disorder, seasonal affective disorder;
Schizophrenia, the primary psychotic disorder, is a highly complex condition that
may be a group of related illnesses. Schizophrenia may include delusions,
thought disorders, hallucinations, withdrawal, lack of motivation, a flat mood;
Eating disorders;
Addictive and substance abuse disorders;
Impulse control, personality and conduct disorders;
Trauma-related disorders;
Attention Deficit Hyperactivity Disorder.
Mental illness can be caused by a variety of factors including:
726
Inherited traits;
Environmental exposure prior to birth to drugs, alcohol and other toxins;
Brain chemistry;
The interaction between nature and nurture, which can affect brain
development.
The risk of mental illness can be associated with additional factors such as:
727
Stressful life situations;
A chronic medical condition;
Brain damage due to serious injury;
Traumatic experiences;
User of alcohol or drugs;
A childhood history of abuse and neglect;
Few healthy relationships.
The term Serious Mental Illness (SMI) describes a mental, behavioral or emotional
disorder that results in serious functional impairment and substantially interferes with
or limits one or more major life activities. These include schizophrenia, severe bipolar
726
Mental illness. www.mayoclinic.org. Patient Care & Health Information//diseases and conditions
727
Mayo ibid

DRAFT Lee County Human Services Gap Analysis
Secon Eight: Conclusions
Chapter 33 | Core Drivers Page | 436
illness and severe major depression. The term Any Mental Illness (AMI) covers all
recognized mental illnesses.
728
Scope of the Issue.
It is estimated that one in five Americans experience mental health problems
each year.
729
A 2015 estimate has 9.8 million adults with serious mental
illness.
730
In 2017, this number was estimated to be 11.2 million persons.
731
This
was 4.8% to 5% of all American adults at the time. One in six youth age six to 17
experience a mental health disorder each year.
732
Lifetime prevalence of any
mental disorder among adolescents age 13 to 18 however was 49.5%.
733
Treatment Data
43% of U.S. adults with any mental illness received treatment in 2018.
734
64% of U.S. adults with serious mental illness received treatment in 2018.
735
50% of U.S. youth age 6 to 17 with a mental health disorder received treatment
in 2016.
736
Impact
Mental illness is the leading cause of disability. Nearly 25% of the nation’s 8
million SSDI recipients have a mental impairment as their primary qualification
for benefits.
737
Psychiatric disabilities comprise the largest diagnostic group on
Social Security disability rolls.
738
728
National Institute of Mental Health/home/mentalhealthinformation/statistics
729
What is mental health? Medical News Today. www.medicalnewstoday.com
730
ibid.
731
National institute
732
Whitney, D & Peterson, M. 2019. US National and State-level prevalence of mental health disorders and
disparities of Mental Health Care use in Children. JAMA Prediatr, 173(4): 389-391.
733
National Institute
734
Lipari. R. et.al. 2019. Key Substance Abuse and Mental Health Indicators in the United States. Results from the
2018 National Survey on Drug Use and Health. SAMSHA
735
ibid.
736
Whitney, op.cit.
737
Goodman, N. et.al. 2005. Federal program expenditures for working-age people with disabilities. Ithaca, NY:
Employment and Disability Institute. Cornell University.
738
Bond, G. et.al. 2007. Can SSDI and SSI beneficiaries with mental illness benefit from evidence-based supported
employment? Psychiatric Services. www.ps.psychiatryonline.org.

DRAFT Lee County Human Services Gap Analysis
Secon Eight: Conclusions
Chapter 33 | Core Drivers Page | 437
Attachment C: Substance Abuse
Substance Abuse
Substance abuse can be considered a sub-category of mental health in that addictive
disorders are classified as a mental illness. As noted just above, 19% of adults with
mental illness also experienced a substance abuse disorder. These are called co-
occurring disorders. Studies link depression, anxiety and substance abuse and find that
alcohol and drugs are often used to self-medicate the symptoms of mental health
problems.
739
Given the impact of substance abuse on individuals and society, it will be presented as a
distinctive driver here while acknowledging there is overlap.
Impact
Impact on Individuals
A variety of negative impacts can occur for individuals abusing drugs. These
include:
Death, illness and disabilities: More are associated with drug abuse than any
other preventable health condition;
740
Stroke, psychosis, overdose and death;
741
Mental illness, HIV/AIDS, cancer or other diseases;
Impaired decision-making, stress, experience of normal pleasures, nutrition,
sleep and increased impulsivity risk for trauma and violence.
Impact on Families
The impact on families of a substance-abusing member can vary greatly
depending upon family structure and age. Children may act as surrogate
parents, develop elaborate denial systems, engage in age-inappropriate
739
https://www.helpguide.org/articles/addictions
740
Effects of drug abuse and addiction. www.gatewayfouindation.org/home/FAQs
741
Health consequences of drug misuse. www.drugabuse.gov/Home/relatedtopics

DRAFT Lee County Human Services Gap Analysis
Secon Eight: Conclusions
Chapter 33 | Core Drivers Page | 438
behavior. Older parents with substance-abusing children may be enablers.
Spouses may become co-dependent.
Impact on Other Relationships
There can be financial, work problems or resentment in other relationships.
Impact on Communities
There are significant costs incurred by communities in terms of criminal justice costs,
loss of local economic productivity and loss of community safety. Other social
problems associated with substance abuse include:
742
Domestic violence
Child abuse
Crime
Suicide
Homicide
Teenage pregnancy
HIV/AIDS and sexually transmitted diseases
Financial exploitation of family members or vulnerable persons
Physical fights
Just as there are a variety of mental illnesses, so are there differing forms of substance
abuse. Among these are:
Legal or Illegal Drugs
743
Opioids: narcotic pain-killing drugs produced from opium or made synthetically;
Barbiturates, benzodiazepines and hypnotics: Central nervous system
depressants;
Alcohol: The main cause of death among people under 21 due to injury;
Cannabis: Often the first drug tried and a gateway drug;
Synthetic cannabinoids (K2 or Spice): Chemical compounds that are like
marijuana in effects but more addictive and dangerous;
744
Meth, cocaine and other stimulants: Can be prescription or illegal, used to boost
energy, lose weight or control appetite;
742
www.healthypeople.gov/2020topicsandobjectives/substanceabuse
743
Drug addiction. www.mayoclinic.org/patientcare&healthinformation/diseasesand conditions
744
Drug addiction. www.mayoclinic.org/patientcare&healthinformation/diseasesand conditions

DRAFT Lee County Human Services Gap Analysis
Secon Eight: Conclusions
Chapter 33 | Core Drivers Page | 439
Club drugs: Commonly used at night clubs, concerts and parties; may cause
sedation, confusion, memory loss and may be associated with sexual assault;
Hallucinogens: Cause hallucinations, impulsive behavior, reduced perception of
reality;
Inhalants: Fluids or gases, which can be inhaled and may cause brain damage or
sudden death.
Scope of the Problem
The following facts demonstrate the scope of the issue.
It was estimated in 2017 that 18 million people age 12 and older (6% of the age
12 and older population) had misused medications at least once in the prior
year.
745
Almost 21 million Americans have at least one addiction, yet only 10% receive
treatment.
746
Drug overdose deaths have more than tripled since 1990.
747
From 1999 to 2017, more than 700,000 Americans died from overdosing on a
drug.
748
In 2017, 34.2 million Americans committed DUI, 21.4 million under the influence
of alcohol and 12.8 million under the influence of drugs.
749
About 20% of Americans who have depression or an anxiety disorder also have a
substance use disorder.
750
In 2015, 66.7 million people reported binge drinking in the past month with 27.1
million using illicit drugs or misusing prescription drugs.
751
Substance misuse and substance use disorders also have serious economic
consequences, costing more than $400 billion annually in crime, health and lost
productivity.
752
745
Misuse of prescription drugs. National Institute on Drug Abuse/publications/research reports
746
Statistics on Addiction in America. www.recoveryworldwide
747
ibid
748
ibid
749
ibid
750
ibid
751
Facing Addiction in America: The Surgeon General’s Report on Alcohol, Drugs and Health.
www.ncbi.nim.nih.gov
752
Sacks JJ, Gonzales KR, Bouchery EE, Tomedi LE, Brewer RD. 2010 national and state costs of excessive
alcohol consumption. American Journal of Preventive Medicine. 2015;49(5): e73–e79

DRAFT Lee County Human Services Gap Analysis
Secon Eight: Conclusions
Chapter 33 | Core Drivers Page | 440
The factors affecting the likelihood of addiction include:
Family history of addiction
Mental health disorder
Peer pressure
Lack of family involvement
Early use.
Attachment D: Trauma
Trauma
While trauma can be linked to mental health or illness or substance abuse from both
causal and consequential perspectives, it is significant enough to be considered as a
separate driver. Persons who are mentally healthy and have no history of substance
abuse can experience trauma that results in some level of maladaptive behavior or
internal distress.
SAMHSA defines trauma as:
753
“Individual trauma results from an event, series of events, or set of circumstances
experienced by an individual as physically or emotionally harmful or life-threatening
with lasting adverse effects on the individual’s functioning and mental, physical, social,
emotional, or spiritual wellbeing.”
Other definitions include:
“A psychological, emotional response to an event or an experience that is deeply
distressing or disturbing”.
754
“Trauma is the experience of severe psychological distress following any terrible or life-
threatening event.
755
”
What is more significant than the scope, are the impacts, which are discussed next.
753
www.integration.samsha.gov/clinical practice/trauma
754
www.centerforanxieitydisorders.com/whatistrauma
755
www.psychologytoday.com/basics/trauma

DRAFT Lee County Human Services Gap Analysis
Secon Eight: Conclusions
Chapter 33 | Core Drivers Page | 441
Impacts of Trauma
First, trauma impacts everyone differently. Many people exhibit resilient
behaviors or brief symptoms. As the Center for Substance Abuse Treatment
notes.
756
“The impact of trauma can be subtle, insidious, or outright destructive.
How an event affects an individual depends on many factors, including
characteristics of the individual, the type and characteristics of the event(s),
developmental processes, the meaning of the trauma and sociocultural factors”.
Short-term reactions are normal. Others have more destructive reactions,
including:
757
Mental illness
Anxieties
Depression
Avoidance
Difficulty regulating anger, shame, sadness
Addiction, such as self-medication to control emotions
Compulsive behaviors such as gambling
Poor physical health outcomes, including long-term fatigue, sleep
disorders
High-risk behaviors, such as eating disorders
In addition to the above effects, early trauma can affect brain development
758
and physiological development.
759
. In adults, severe emotional trauma can affect
the region of the brain that regulates negative emotions.
760
756
Treatment Improvement Protocol Series No 57. Center for Substance Abuse Treatment. Rockville, MD:
SAMSHA
757
ibid.
758
www.harleytherapy.co.uk.couselling/childhoodeffectsoftrauma
759
DeBellis, M. et.al. 2014. The biological effects of childhood trauma. Child Adolesc Psychiatry Clin N Am. 23(2):
185-222
760
www.brainblogger/2015/01/24

DRAFT Lee County Human Services Gap Analysis
Secon Eight: Conclusions
Chapter 33 | Core Drivers Page | 442
Types of Trauma
There are several types of trauma
761
. These include:
Sexual assault
Child maltreatment including bullying and early childhood trauma
Domestic violence, physical, emotional or psychological
War-related trauma
Medical trauma
Traumatic loss or grief
Natural disaster
Community violence
762
In the above types, a person is experiencing a traumatic situation. It is important to
note that simply witnessing an act of violence can be traumatic.
763
Scope
The following data points illustrate the scope of trauma.
One estimate is that 61% of men and 51% of women report exposure to at least
one lifetime traumatic event.
764
Another is that 70% of adults have experienced
some type of traumatic event at least once in their lives.
765
90% of clients in public behavioral health care settings have experienced
trauma.
766
Approximately 35 million children have experienced one or more types of
childhood trauma.
767
761
www.teachtrauma.com
762
wwwnctsn.org/whatischildtrauma
763
https://www.psychguides.com/trauma
764
integration op.cit
765
www.thenationalcouncil.org/uploads/2013/05/trauma-infographic
766
integration, op.cit
767
The National Survey of Children’s Health, 2018. Health Resources and Services Administration Maternal and
Child Health Bureau

DRAFT Lee County Human Services Gap Analysis
Secon Eight: Conclusions
Chapter 33 | Core Drivers Page | 443
Attachment E: Suggested causes for domestic violence
Suggested Causes for Domesc Violence
The following causes have been examined by researchers. Each as a stand-alone cause was
found to be problematic. These causes include:
All men who are abusers are mentally ill;
Battered women are mentally ill;
Men battered because they had learned violence in their families as children,
and women sought out abusive men because they saw their mothers being
abused. This is the learned behavior theory;
Violence is a loss of control. Alcohol use leads to a loss of control;
The learned helplessness theory which argued that women stay in abusive
relationships due to a personality disorder;
The cycle of violence theory that men did not express their feelings regularly
and then exploded;
The family conflict model which argued that both the man and woman
contributed to violence;
Abuse is about maintaining control and power;
Abuse reflects societal norms of dominance and inequality.

DRAFT Lee County Human Services Gap Analysis
Secon Eight: Conclusions
Chapter 33 | Core Drivers Page | 444
Intenonally le blank.

DRAFT Lee County Human Services Gap Analysis
Secon Eight: Conclusions
Chapter 34 | Board of County Commissioners – Specific Issues Page | 445
CHAPTER 34
The Board of County Commissioners: Specific Issues
Introduction
This analysis has identified numerous gaps in the overall human services system in the
County. As indicated in the funding responsibilities section, the BoCC has specific
responsibilities for certain elements of that system. This chapter focuses on
responsibilities that the County is legally mandated to address, has chosen to address by
policy and/or has significant financial implications for County government.
Overall Analysis Findings
As noted in the Executive Summary and elsewhere, the three major gaps identified by
the assessment were behavioral health, housing and transit. This chapter addresses
certain aspects of those major gaps which are either the responsibility of the County or
in which the County has made major investments. These aspects are discussed in the
“Key Points and Conclusions” section immediately following this paragraph.
Key Points and Conclusions
Area One: Behavioral Health and Criminal Justice
Introduction
Two major systems interface as numerous people in the criminal justice system
need behavioral health treatment and assistance. Addressing these issues is
costly and complicated. Lee County is not unique in having this challenge as
most communities are faced with these same issues.
Key Points
As noted above, behavioral health services are one of the three most critical
gaps in the County.

DRAFT Lee County Human Services Gap Analysis
Secon Eight: Conclusions
Chapter 34 | Board of County Commissioners – Specific Issues Page | 446
At least 25% of jail inmates have mental health issues and would be better
served in a more appropriate facility.
768
According to some local professionals,
this percentage may be under-estimated in Lee County.
Inmates with mental health issues stay about twice the time of the general
population and cost between two and four times as much to manage.
This represents up to $20 million that could be used more productively.
Varieties of solutions are proposed in the chapter on behavioral health and
criminal justice.
Conclusion
This is the county’s largest investment area for which it has full responsibility.
Given its significance, a more thorough analysis of the solutions proposed in the
chapter on behavioral health and criminal justice is warranted. This will involve
substantive analytical work on actual costs and potential cost-benefits as well as
multi-stakeholder planning for any changes.
Area Two: PFR Funding
Introduction
The County provides funds to a variety of local nonprofits under its Partnering
for Results (PFR) program. Ensuring these investments are both productive and
efficient is an on-going endeavor.
Key Points
The County currently provides more than $5 million in funding for local agencies.
Conclusion
There are two areas to examine in greater depth with respect to PFR funding:
1. During proposal and selections, give greater weight to evidence-based
programs.
2. Requiring requesters to address their system-of-care features.
768
Conclusion of expert panel comprised of Court Administration, Public Defender, Sheriff and State Attorney after
review of data presented by the Sheriff.

DRAFT Lee County Human Services Gap Analysis
Secon Eight: Conclusions
Chapter 34 | Board of County Commissioners – Specific Issues Page | 447
Area Three: Homelessness
Introduction
Homelessness is an ongoing concern driven by a variety of factors. The County
has assumed a lead agency role in addressing homelessness in the County.
Key Points
The provision of emergency housing funds does not last the full year and has
been generated from a variety of sources, some of which were one-time. There
is a life-time limit of three assistance events with IFAS providing budgeting
training. Revising these policies to keep people in existing housing may save
significant staff effort in finding other housing.
Conclusion
A General Fund commitment to this service, along with other funds the
Department of Human and Veteran Services may be able to generate, could be a
cost-effective and cost-beneficial investment to prevent a repetitive homeless
status and to lower public costs associated with it.
Area Four: Housing
Introduction
All of the data collection methods for this project identified supportive and
affordable housing as a critical need. The value of any treatment program is
lessened if the person does not have stable and safe housing.
Key Points
This is one of the three most critical gaps.
The County has a variety of tools to assist the private sector in developing non-
market rate housing.
Housing costs are beginning to be problematic from an economic development
perspective.
Responsibility for housing strategy is dispersed in County government.

DRAFT Lee County Human Services Gap Analysis
Secon Eight: Conclusions
Chapter 34 | Board of County Commissioners – Specific Issues Page | 448
Conclusion
The County is clearly not in the housing business as a developer. It does have a
variety of tools to facilitate housing development. Given the critical nature of
this issue from both supportive housing and affordable housing perspectives, a
re-thinking of the County’s strategy regarding housing is warranted.
Area Five: Transit
Introduction
As with housing, all of the data collection methods identified a lack of public
transit as a major barrier to client success. The inability to get to treatment, to
work, to everyday life tasks, affects the value of other interventions.
Key Points
Transit is considered one of the three most critical gaps in the human services
field.
Conclusion
Public expectations about transit are not aligned with the fiscal realities of
transit. Public education on this challenge is warranted. Given this challenge,
continuing to incorporate the public transit perspective in transportation
planning is warranted.

DRAFT Lee County Human Services Gap Analysis
Secon Eight: Conclusions
Chapter 35 | Conclusions Page | 449
CHAPTER 35
Conclusions
Introduction
As reported in the prior chapters, there are numerous gaps in the various systems of
care whether defined by an issue such as elder abuse, neglect and exploitation, or by a
population or demographic group like individuals with intellectual and developmental
disabilities. This chapter will not simply repeat those findings. It will address common
gap themes and underlying patterns. Underlying patterns emerge from the needs
identified among various service delivery systems or from trends that affect the delivery
of human services in Lee County. There is no priority order to the presentation of the
themes and patterns.
Patterns
Pattern One: Population Growth and Infrastructure
One underlying pattern is that the population growth of Lee County outruns its
infrastructure. The provision of human services requires staffing, facilities and
organizational systems. For the most part, human services are provided on a reactive
basis. For instance, a need emerges of sufficient scale and significance that members of
the community decide to respond. The organizational form needed to respond to this
need takes time to develop. Rarely can one generate the funds, establish an
organizational structure, find an appropriate facility and hire staff as quickly as the need
develops and is recognized. This phenomenon is true even in slow-growth communities.
It is even truer in the high-growth areas.
Pattern Two: The National Shortage of Professionals
Chapter 9 presented data about a national shortage of various behavioral health
professionals. In high-growth Lee County, this shortage can be even more acute. Time
and the development of technologies that enable these professionals to be more
productive in their service delivery could lessen this problem. For the moment,
however, this pattern presents an operational challenge to the expansion of services to
fill gaps. Even if all of the other necessary elements were in place – the money, the

DRAFT Lee County Human Services Gap Analysis
Secon Eight: Conclusions
Chapter 35 | Conclusions Page | 450
buildings and the organizational structure – staffing shortages could limit the ability to
deliver services.
Pattern Three: Compensation Issues for Direct-service and First-line Workers
The wage compensation for most direct-services workers ranges from minimum wage to
$12 to $14 per hour. Wages at this level can mean high staff turnover as a job with a
25-cents-per-hour raise can be significant. This compensation level, coupled with work
that can be highly demanding and stressful, is not conducive to a stable work force in
fields in which relationships with clients are important.
Pattern Four: The Increasing Complexity of the Work and the Further Professionalization of the
Field
There is a tendency to believe that work in the human services field simply requires a
high level of concern for people coupled with a willingness to serve others. While those
are requirements, far more skill and knowledge is required to be effective. The field
deals with the most complex of phenomenon – human behavior – in its full range of
expression. There are on-going advances in brain research, genetics, the combined
impacts of environment and biology and various forms of intervention. Even with the
most basic services, such as childcare, there is a growing knowledge and skill base that is
required of a childcare worker.
Pattern Five: The Need for More Integrated Delivery Systems
It has long been recognized that individuals have multiple needs and that addressing
one need while ignoring others is a pathway to failure. The concepts of systems of care
and “wrap-around” services have developed as a response. While much progress has
been made, there is much to be done. Of significance is the physical health and mental
health interface where conditions in either category can affect the other. The
significance of integrated approaches to physical and mental health has been
recognized. However, this recognition has yet to turn into operational reality.
Pattern Six: Evidence-based Practice
Without doubt, every human service program or effort is well intentioned, and most
possess a logic that leads to the belief they will make a difference. The reality is
otherwise. Some efforts have no impact; others have a short-term impact. A few could

DRAFT Lee County Human Services Gap Analysis
Secon Eight: Conclusions
Chapter 35 | Conclusions Page | 451
have a negative impact. For these reasons, the field in general has emphasized high-
quality evaluations of programs to determine if they are effective. Efforts that pass
these evaluations are termed evidence-based. They represent the best investment of
public or private resources.
Pattern Seven: The Need for More Coordinated and Flexible Funding Streams
With respect to federal funds, these are often the result of interest group lobbying and
are therefore written for a specific group of people. Administrative regulations then
develop the eligibility criteria. In effect, equally needy individuals who may fail to meet
a specific criterion are ineligible to receive services. This can also result in less than
effective use of public funds when State or local funds are required as match. The
ability of local officials to most effectively respond to their community and its distinctive
features is therefore limited.
Pattern Eight: The Need for Prevention and Early Intervention
The research data on the long-term social and financial costs to society of failing to
address known at-risk issues in early childhood is very clear. The operational challenge
is that those investment costs occur in the present while the savings are far in the
future. Given current needs and the challenge of addressing those needs, it is difficult
to invest in prevention and early intervention.
Pattern Nine: The Silver Wave
As noted in the chapter on seniors, the growth of the senior population in Lee County
will be significant. As this population ages and the 85 and older age group increases
proportionally, there will be increased demand for public services. As the dependency
ratio discussed in that chapter changes, there will be proportionally fewer workers to
provide the needed services. The open question is whether there will be sufficient
advances in technology to offset the needed workers.

DRAFT Lee County Human Services Gap Analysis
Secon Eight: Conclusions
Chapter 35 | Conclusions Page | 452
Pattern 10: Public Understanding and Education
This pattern involves a combination of ignorance and stigma. Some people are not
aware of services for which they are eligible or that are available. At the same time,
there still is a stigma attached to mental illness or shame associated with certain events
such as sexual abuse or financial exploitation. As noted in various chapters, there is a
reluctance to report various violations, and as a result the scope of some problems is
severely under-estimated.
Pattern 11: The Data Gaps
There are several sub-fields in the arena of human services and the level of data
collection varies greatly. Data collection is not cost-free and often it becomes a lower
priority. Yet the lack of data, or data gaps, make planning and public investments
challenging. Even more than basic data collection, data on impacts and effective
intervention also is lacking. The current and growing need for services, coupled with
significant financial investments made by governmental bodies and private
philanthropy, strengthens the need for better data to help these investment decisions.
More importantly, better data and better data sharing would help service providers be
more effective and efficient.
Pattern 12: Dynamic and Diverse Economies and Affordability
One of the current realities is that the more dynamic and diverse a local economy
becomes, the more challenging affordability becomes. This is obvious in areas such as
San Francisco, the Silicon Valley or Boston. Some of this is due to local land-use policies
that make housing development difficult. However, that is not the only reason. For a
local analysis, compare rental housing affordability in Lee, Broward and Palm Beach
counties as shown in Table 120. While Lee County is significantly increasing its diversity
beyond retirement and tourism, both Broward and Palm Beach have long achieved a
greater diversity so that tourism and retirement are less dominant economic drivers.
One could assume that as these service economy drivers become less dominant,
affordability would increase. As the table shows, that does not occur. Instead, both
Broward and Palm Beach are more cost-burdened.
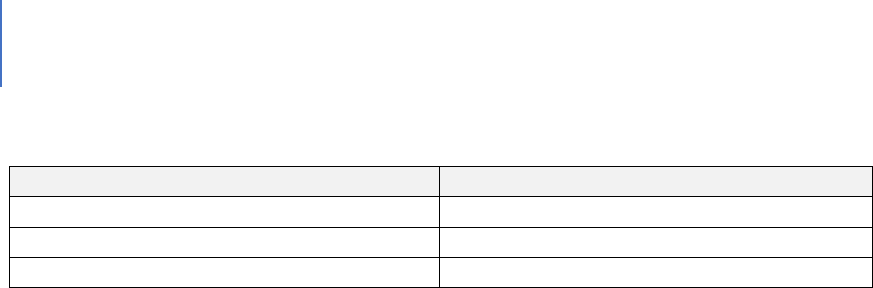
DRAFT Lee County Human Services Gap Analysis
Secon Eight: Conclusions
Chapter 35 | Conclusions Page | 453
Table 120. Renter Cost-burden Comparison
County
Renter Cost-Burdened Percentage
Broward
61.3%
Lee
55.4%
Palm Beach
60.7%
Pattern 13: In-home Services
In addition to the need for more integrated physical and mental health care, there is a
recognized need to provide more services in-home. This has several advantages. First,
the transportation barrier is eliminated. Second, any stigma attached to going to a
facility, particularly a mental health or substance abuse facility, is avoided. Third, a
significant clinical advantage is that the family can be seen in its natural setting. This
provides important data to the treatment provider.
Pattern 14: Trauma
Trauma is not a new concept, but the scientific and clinical understanding of its impact
has increased in recent years. The experience of trauma is highly personal, but it is
found in almost every specific system-of-care. Having professionals trained in
recognizing and addressing trauma is a growing requirement for effective service
delivery.
Pattern 15: Education for Non-Behavioral Health Disciplines
Just as there is a growing demand for increases in the knowledge and skill of human
service professionals, there is the same need for other professionals who interact with
the system to have a better understanding of various behaviors associated with differing
conditions. There has been a great emphasis on including mental health professionals
with law enforcement. The field of developmental disabilities shares a similar concern
that law enforcement officials understand some of the behaviors associated with this
disability.

DRAFT Lee County Human Services Gap Analysis
Secon Eight: Conclusions
Chapter 35 | Conclusions Page | 454
Pattern 16: Assessment
An improved ability to assess individuals and families would be of value across the
various sub-fields. Professionals in the field rely upon assessments to determine
treatment plans, placements, classification and allocation of resources. The use of valid
and reliable assessment tools by persons trained in the administration and
interpretation of the assessment is a step toward greater effectiveness and efficiency.
Pattern 17: Employment
For the adult-oriented human service systems of care, employment is a consistent
concern. The benefits of employment are obvious. A variety of challenging barriers
exists including transportation, employer bias, the need for some special
accommodations and training.
Pattern 18: Language and Cultural Diversity
As the County becomes more culturally and linguistically diverse, demands are being
placed upon the human service field to respond with multi-lingual staff and more
culturally sensitive interventions or services.
Pattern 19. The Growing Service Demand in Lehigh Acres
There are high transportation costs for these residents both financially and in terms of
commute times. Service sites in Lehigh Acres are limited and there are proportionally
fewer available services.
Pattern 20: Increased Use of Technology
There is a growing use of various telepresence tools to deliver services. This use will
increase as technology improves and comfort level on the part of both clients and
clinicians increases. Yet to be determined are the potential uses of specific Artificial
Intelligence (AI) tools to address specific issues. AI has the potential to address staffing
issues from an agency perspective. AI and robotics have the potential to provide client
services to address the worker gap projected in the dependency ratios.

DRAFT Lee County Human Services Gap Analysis
Secon Eight: Conclusions
Chapter 35 | Conclusions Page | 455
Common Gap Themes
Common Theme One: Mental Illness and Substance Abuse
Across all the systems of care examined in this study, significant gaps in mental health
and substance abuse services were mentioned. As noted, the State of Florida is among
the states spending the least on mental health funding. As noted in the Equity Funding
chapter, Lee County is funded for mental health services at a lower rate than other
counties. At the same time, the County expends significant financial resources on its jail
and criminal justice system, which houses a significant proportion of mentally ill
inmates. This is the most significant service gap in the County that affects almost all
human services in one way or another.
Common Theme Two: Housing
Finding housing for individuals with disabilities or various human service issues is highly
challenging, both for cost and perception factors. There is a significant gap in
permanent supportive housing capacity. In addition, a sizable number of households
are cost-burdened, which means they may place demands upon the human service
system.
Common Theme Three: Transportation
Transportation gaps are the third commonly mentioned gap. The inability to get to
services is a problem from a client perspective. The unreliability of clients in keeping
appointments is a problem from the provider perspective. The cost of providing a more
comprehensive public transit system is a problem from a funder perspective. There is
no simple solution to this gap. Instead, there will be incremental steps including smaller
vehicles, greater use of telepresence options and location of services along major transit
routes.

DRAFT Lee County Human Services Gap Analysis
Secon Eight: Conclusions
Chapter 35 | Conclusions Page | 456
Intenonally le blank.

DRAFT Lee County Human Services Gap Analysis
Appendices
Appendices Page | 457
Appendices

DRAFT Lee County Human Services Gap Analysis
Appendices
Appendices Page | 458
Intenonally le blank.

DRAFT Lee County Human Services Gap Analysis
Appendices Page | 459
Appendix A.
Human Surveys Gap Survey Results
Rate the adequacy of services
For each service below, please rate the adequacy of services in Lee County on a scale of 1 to 5
Survey Group
Services
1 -
Most
Inadequ
ate
2 -
Inadequa
te
3
4
5 -
Highly
Adequ
ate
6 -
Don'
t
kno
w
"N"
Total
wit
h (6-
Don’t
Know
Out)
Average
Low to
High
HOUSING
Affordable Workforce Housing
18
6
3
2
3
29
1.62
1
BEHAVIORAL HEALTH
Available Residential Mental Health Services
13
15
2
2
30
1.63
2
HOUSING
Emergency / Temporary Shelters
12
14
5
1
32
1.84
3
HOUSING
Supportive Housing for Persons Needing
Additional
Support
11
13
4
1
3
29
1.86
4
HOUSING
Temporary Housing Assistance
9
14
4
1
4
28
1.89
5
HOUSING
Rapid Re-housing
10
9
7
1
5
27
1.96
6
HOUSING
Transitional Housing
9
9
9
5
27
2.00
7
BEHAVIORAL HEALTH
Available Mental Health Services for Crisis
11
11
7
2
1
31
2.00
8
JUSTICE INVOLVED SERVICES
Re-entry after Jail or Prison - Housing
8
11
2
2
1
8
24
2.04
9
MAINSTREAM SERVICES
Affordable Health Care / Insurance
11
9
9
2
1
31
2.06
10
BEHAVIORAL HEALTH
Available Mental Health Services for Children
and
Adolescents
7
14
5
2
4
28
2.07
11
CHILDREN/YOUTH
Affordable Child-care
9
9
8
2
4
28
2.11
12
JUSTICE INVOLVED SERVICES
Re-entry after Jail or Prison – Supportive
Services
6
11
4
1
1
9
23
2.13
13
BEHAVIORAL HEALTH
Available Out-patient Mental Health Services
7
15
5
4
1
31
2.19
14
MAINSTREAM SERVICES
Public Transportation
8
12
7
5
32
2.28
15
CHILDREN/YOUTH
Child Abuse Prevention
6
7
9
3
7
25
2.36
16
JUSTICE INVOLVED SERVICES
Domestic Violence Prevention
5
9
8
3
7
25
2.36
17
SERVICES FOR PERSONS WITH
DISABILITIES
Sheltered Employment for Persons with
Developmental Disabilities
4
6
5
3
14
18
2.39
18
JUSTICE INVOLVED SERVICES
Victim Assistance – Rape/Sexual Violence
5
7
6
4
10
22
2.41
19
BEHAVIORAL HEALTH
Substance Abuse Residential Treatment
Programs
5
11
6
2
2
6
26
2.42
20
SERVICES FOR PERSONS WITH
DISABILITIES
Services for Persons with Developmental
Disabilities
5
9
6
3
1
8
24
2.42
21
JUSTICE INVOLVED SERVICES
Victim Assistance – Domestic Violence
5
8
6
5
8
24
2.46
22
CHILDREN/YOUTH
Child Abuse Intervention
6
5
10
4
7
25
2.48
23
CHILDREN/YOUTH
Parenting Support
4
10
7
5
6
26
2.50
24
JUSTICE INVOLVED SERVICES
Victim Assistance – Other crimes
5
6
5
4
1
11
21
2.52
25
CHILDREN/YOUTH
Available Child-care for Working Parents
8
5
7
8
4
28
2.54
26
BEHAVIORAL HEALTH
Substance Abuse Prevention Programs
3
13
7
4
2
3
29
2.62
27
BEHAVIORAL HEALTH
Substance Abuse Outpatient Treatment
Programs
4
8
9
4
1
6
26
2.62
28
SENIOR SERVICES
Supportive Services for the Elderly
(transportation,
meals, personal care)
7
3
5
7
1
9
23
2.65
29
JUSTICE INVOLVED SERVICES
Domestic Violence Services & Support Groups
4
5
11
5
7
25
2.68
30
SERVICES FOR PERSONS WITH
DISABILITIES
Services for Hearing Impaired
3
5
7
4
1
12
20
2.75
31
SENIOR SERVICES
Senior Recreational Facilities/Programs
6
3
7
6
2
8
24
2.79
32
CHILDREN/YOUTH
Child-care that Meets a Quality Standard
3
6
9
7
7
25
2.80
33
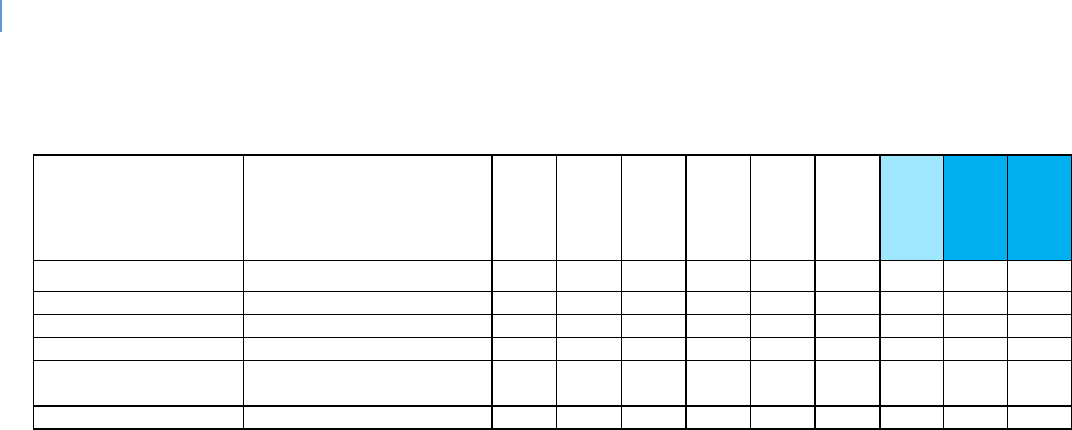
DRAFT Lee County Human Services Gap Analysis
Appendices Page | 460
Survey Group
Services
1 -
Most
Inadequ
ate
2 -
Inadequa
te
3
4
5 -
Highly
Adequ
ate
6 -
Don'
t
kno
w
"N"
Total
wit
h (6-
Don’t
Know
Out)
Average
Low to
High
SERVICES FOR PERSONS WITH
DISABILITIES
Services for Visually Impaired
3
5
8
5
1
10
22
2.82
34
CHILDREN/YOUTH
Youth Recreational Facilities/Programs
3
5
10
9
5
27
2.93
35
CHILDREN/YOUTH
After-school Care
3
5
10
8
1
5
27
2.96
36
MAINSTREAM SERVICES
Education and Job Training Services
1
6
14
9
2
30
3.03
37
MAINSTREAM SERVICES
Employment Support (soft skills, job
application skill;
job links)
1
7
12
9
1
2
30
3.07
38
MAINSTREAM SERVICES
Food Availability / Nutritional Support
2
7
10
7
5
1
31
3.19
39
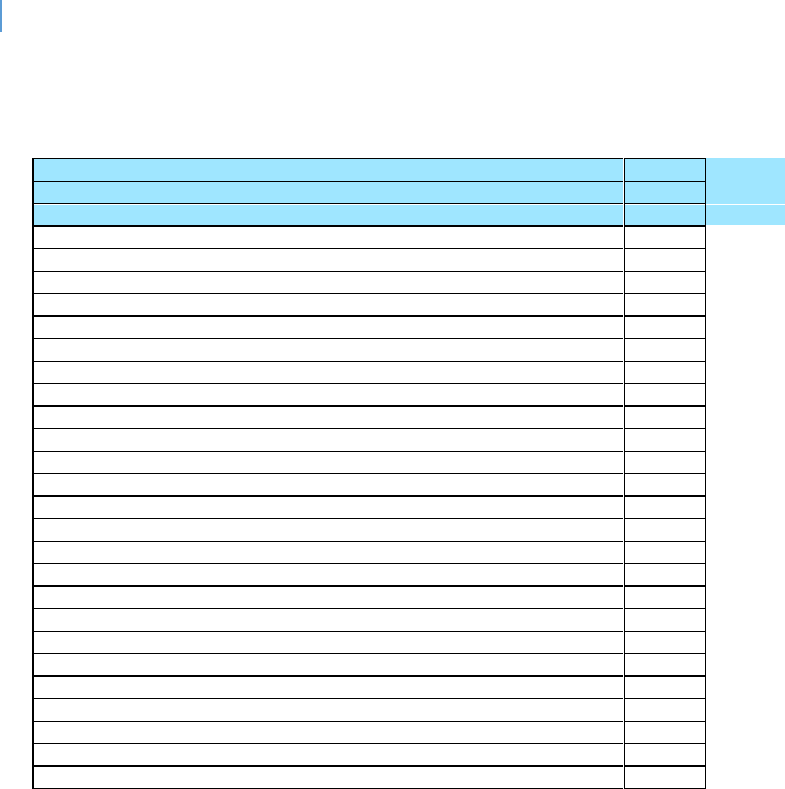
DRAFT Lee County Human Services Gap Analysis
Appendices Page | 461
Most Inadequate (Pick 3)
Of the various services above, please select the three you believe are the most inadequate.
Affordable Workforce Housing
15
16%
Public Transportation
9
9%
Available Mental Health Services for Children and Adolescents
8
8%
Available Residential Mental Health Services
7
7%
Emergency / Temporary Shelters
7
7%
Rapid Re-housing
6
6%
Affordable Child-care
4
4%
Available Mental Health Services for Crisis
4
4%
Temporary Housing Assistance
4
4%
Transitional Housing
4
4%
Supportive Housing for Persons Needing Additional Support
3
3%
Affordable Health Care / Insurance
2
2%
Available Out-patient Mental Health Services
2
2%
Employment Support (soft skills, job application skill; job links)
2
2%
Parenting Support
2
2%
Re-entry after Jail or Prison - Housing
2
2%
Substance Abuse Prevention Programs
2
2%
Substance Abuse Residential Treatment Programs
2
2%
Victim Assistance – Rape/Sexual Violence
2
2%
Available Child-care for Working Parents
1
1%
Child Abuse Prevention
1
1%
Child-care that Meets a Quality Standard
1
1%
Domestic Violence Services & Support Groups
1
1%
Education and Job Training Services
1
1%
Food Availability / Nutritional Support
1
1%
Re-entry after Jail or Prison – Supportive Services
1
1%
Services for Persons with Developmental Disabilities
1
1%
Supportive Services for the Elderly (transportation, meals, personal care)
1
1%
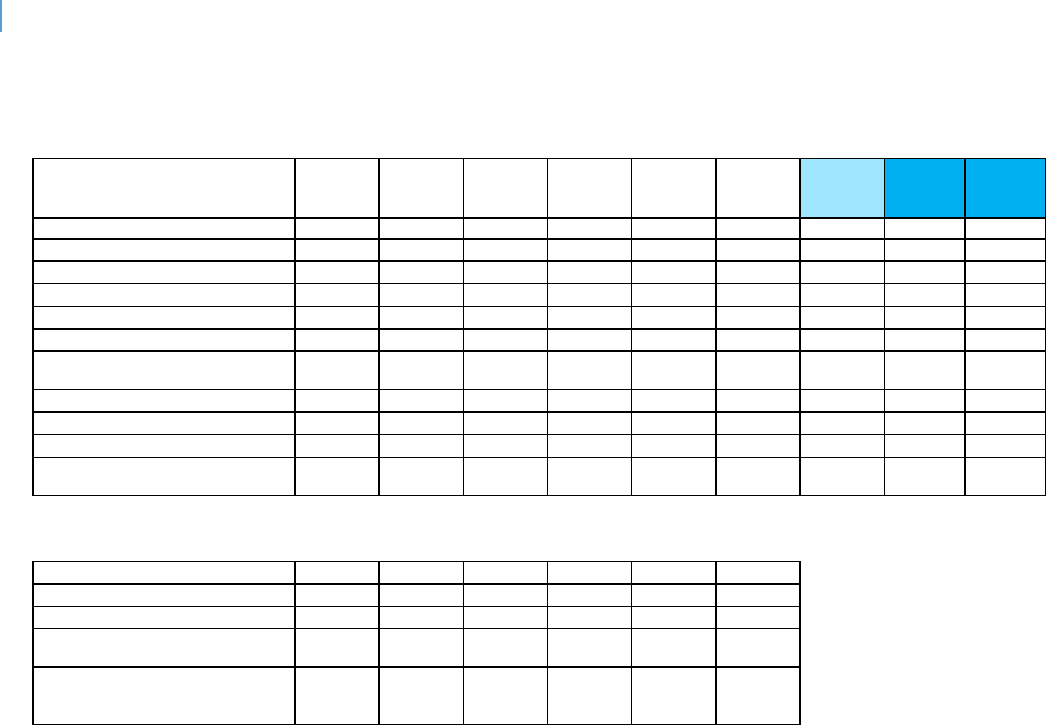
DRAFT Lee County Human Services Gap Analysis
Appendices Page | 462
Rate how well the group's needs are being met
For each need below, please rate how well the group's needs are being met in Lee County.
1 - Poor
2 -
Inadequate
3
4
5 - Excellent
6 - Don't
know
Total with
(6-Don’t
Know Out)
Average
Low to
High
Homeless needs
11
10
5
2
1
3
29
2.03
4
Elderly needs
4
4
8
7
2
7
25
2.96
10
Migrants needs
6
7
8
2
9
23
2.26
5
Children needs
4
8
5
10
1
4
28
2.86
9
Disabled needs
3
9
10
6
4
28
2.68
7
Developmentally Impaired needs
4
10
8
5
5
27
2.52
6
Visually Impaired / Deaf / Hard of
Hearing needs
2
5
11
2
1
11
21
2.76
8
Mentally Ill needs
11
12
3
3
3
29
1.93
3
Working Poor needs
10
12
5
1
4
28
1.89
1
Veterans needs
4
4
5
6
5
8
24
3.17
11
Re-entry needs (Persons released from
jail or prison)
9
8
5
1
9
23
1.91
2
If question 5 did not address a group's needs that you are aware of please list that group below.
OTHER
Affordable Housing for workforce
1
Low Income
1
Single women without dependent
children
1
Those needing emergency shelter
(especially if they have been arrested in
the past)
1

DRAFT Lee County Human Services Gap Analysis
Appendices Page | 463
Three needs that are the most unmet
For the group(s) that you have specific knowledge, please list up to three needs that are the most
unmet.
Response
Please list up to three needs that are the most unmet:
Children
1. Parental Supportive Services 2. Increases wages for Early Learning Educators
3. Academic summer programs for children entering kindergarten.
Children
Healthy food Stable home environment Utilities shut off
Children
The school system will push out students with a 'certificate' that is not a diploma. This makes it impossible for
young adults to get jobs that have a living wage. Affordable housing that is not third-world quality. Access
to fresh food for persons who live in underserved neighborhoods
Children
protection from all forms of abuse, available food, safe transportation to and
from school
Children
Preventive care and support , education, community support, affordable
recreation activities , MENTORSHIP CONNECTIONS.
Children
No safe and affordable housing for families in poverty, no quality early childhood programs available at no
cost, no foster homes. Children are sleeping in cots in the business office of Lutheran Services overnight with
social workers
having to sleep at their desks.
Children
Stable home lives, nutrition, mental health services
Developmentally Impaired
employment, housing, transportation
Developmentally Impaired
Adults who are developmentally impaired need more resources and assistance
for caregivers
Elderly
Transportation Medical Transportation - Non-emergency
Elderly
No insurance covers home health for dementia and 80% of my caseload is Medicaid eligible but there are no
memory care beds available in Lee County. Wait list up to two years. Absolutely no financial support for a
disease that cost
between $6-14,000 a month.
Elderly
Where are the resources - Elderly has no idea where to go - no PSAs advising
them where resources are available
Elderly
Housing Transportation Easy accessibility of services
Elderly
affordable housing, transportation, affordable home care
Homeless
More Shelters, Affordable housing, More resources based on needs such as
Health care, Clothing, transportation, obtain birth certificates
Homeless
Housing Assistance-deposit, 1st and last month's rent Deposit for water and
electric Housing for felonies and evictions
Homeless
More options to transition out of homeless Support Funds
Homeless
Alternative shelters for mentally ill homeless Any shelter for homeless single women without dependent
children Public transportation
Homeless
1-Housing for someone who does not have a substance abuse issue. 2- ID's 3-
Mental Health care
Homeless
Shelter, Help finding a job
Homeless
Homeless or on the verge of becoming homeless, working poor benefits for
them, mentally ill services for them
Homeless
Affordable housing Temporary re housing Transitional housing
Homeless
Affordable Housing, Access to Healthcare, Community of Support
Homeless
Transportation Shelter
Mentally Ill
Available Services for individuals in Crisis, Mental Health Education, Community Awareness and Support, Pre
and Post Intervention Services
Mentally Ill
Access to services, transportation, community support education and
prevention
Mentally Ill
Housing MH services including MM and CM services

DRAFT Lee County Human Services Gap Analysis
Appendices Page | 464
Mentally Ill
Residential services, outpatient services, community integration services.
Mentally Ill
affordable treatment, quality of service, supportive housing (residential care)
Mentally Ill
1-Housing 2- Case Management
Mentally Ill
No quality services at no cost, access and wait lists makes it difficult to obtain
services, caseloads are too high for mental health workers.
Mentally Ill
No insurance to afford to address their mental health needs Parents, children
are families feeling that they are not worth the help and their needs are not important or immediate
Migrants
Income, language assistance
Migrants
Education Resources
Other
Inmates that are incarcerated, but identifying as victims of human trafficking
1. Do not have anybody to go to court with them to speak on behalf of them as a victim to help get them into a
program. 2. Do not have a support group to process their trauma. 3. Housing that promotes rehabilitation
from being a
victim of human trafficking
Other
Kids that foster out of the system
Persons released from jail or
prison
transitional housing is the biggest one, employment for felons
Persons released from jail or
prison
Reentry is a huge problem that is unmet by the nation. Should be programs that begin in prison and assist in
the transition to community living to include: housing, employment, treatment, education...etc.
Persons released from jail or
prison
Access to Employment, Housing, Collaborative Community Support Services
Persons released from jail or
prison
Transitional Housing Job services SA and MH counseling
Veterans
Veterans wait too long for medical care, their mental health issues are not adequately addressed in a timely
manner, many of our homeless are veterans, and many have mental health/drug issues. We owe them much
better care and
consideration.
Visually Impaired / Deaf / Hard of
Hearing
Transportation Housing Easy accessibility of services
Working Poor
Availability of child-care, and housing
Working Poor
Working Poor
affordable housing, healthcare, childcare
Working Poor
medical care, affordable housing, affordable child-care
Working Poor
Affordable housing Job training MH services Dental
Working Poor
Affordable afterschool care Make less than what can afford in rent Not able to make ends meet even though
working hard to maintain stable housing for their
family.
Working Poor
Affordable housing Dental care
Working Poor
Resources
Working Poor
Affordable housing, transportation resources, education and community
support programs
Working Poor
Living wage, transportation, child-care

DRAFT Lee County Human Services Gap Analysis
Appendices Page | 465
Services Dicult to Obtain
Are there any other human services in addion to those listed above that are dicult to
obtain in Lee County?
If Yes, what are they?
Assistance with first/last/deposit for housing and not eliminating homeless who were evicted in the
past.
Burial Assistance for those who cannot afford to bury or cremate their loved one
Dental Affordable medical Affordable daycare Clothing
Evidenced base treatment programs for youth, prevention programs, homebased services available for all new parents, residential
programs for youth with mental health issues
Help for the undocumented, and more programs for people with more severe mental health.
income does not match cost of living in this area; more accessible, timely, direct transportation (remote areas-parts of Cape Coral,
Lehigh Acres, Bonita Springs, North Fort Myers)
Prescription Assistance Affordable Rent for Families (in line with wages)
Section 8
Transportation for undocumented immigrants or pregnant woman in need of prenatal
appointments
Transportation- more bus stops that are closer to employees work. More shelters at the bus stops
to prevent heat strokes. Less expensive tickets to ride the bus.

DRAFT Lee County Human Services Gap Analysis
Appendices Page | 466
Intenonally le blank.

DRAFT Lee County Human Services Gap Analysis
Appendices Page | 467
Appendices B- F
Appendix B.
PRC Comprehensive Health Needs Assessment
hp://www.leecounty.healthforecast.net/2017%20PRC%20CHNA%20Report%20-%20Lee%20
County,%20FL.pdf
Appendix C.
Need Assessment for CSBG Work Plan
hps://www.leegov.com/dhs/funding/csbg
Appendix D.
2019-2023 Consolidated Plan HUD
hp://www.leegov.com/dhs/Documents/Planning/Final%20Dra%20for%20Public%20Comm
ent.pdf
Appendix E.
Connuum of Care Plan
hp://www.leegov.com/dhs/Documents/CoC/Lee%20County%20CoC%20Strategic%20Plan%2
02019.pdf
Appendix F.
Impediments to Fair Housing Choice
hp://www.leegov.com/dhs/Documents/Fair%20Housing/Final%20PY%202019%20Analysis%
20of%20Impediments%20to%20Fair%20Housing%20Choice.pdf#search=Impediments%20to%
20Fair%20Housing%20Choice

DRAFT Lee County Human Services Gap Analysis
Appendices Page | 468
Intenonally le blank.
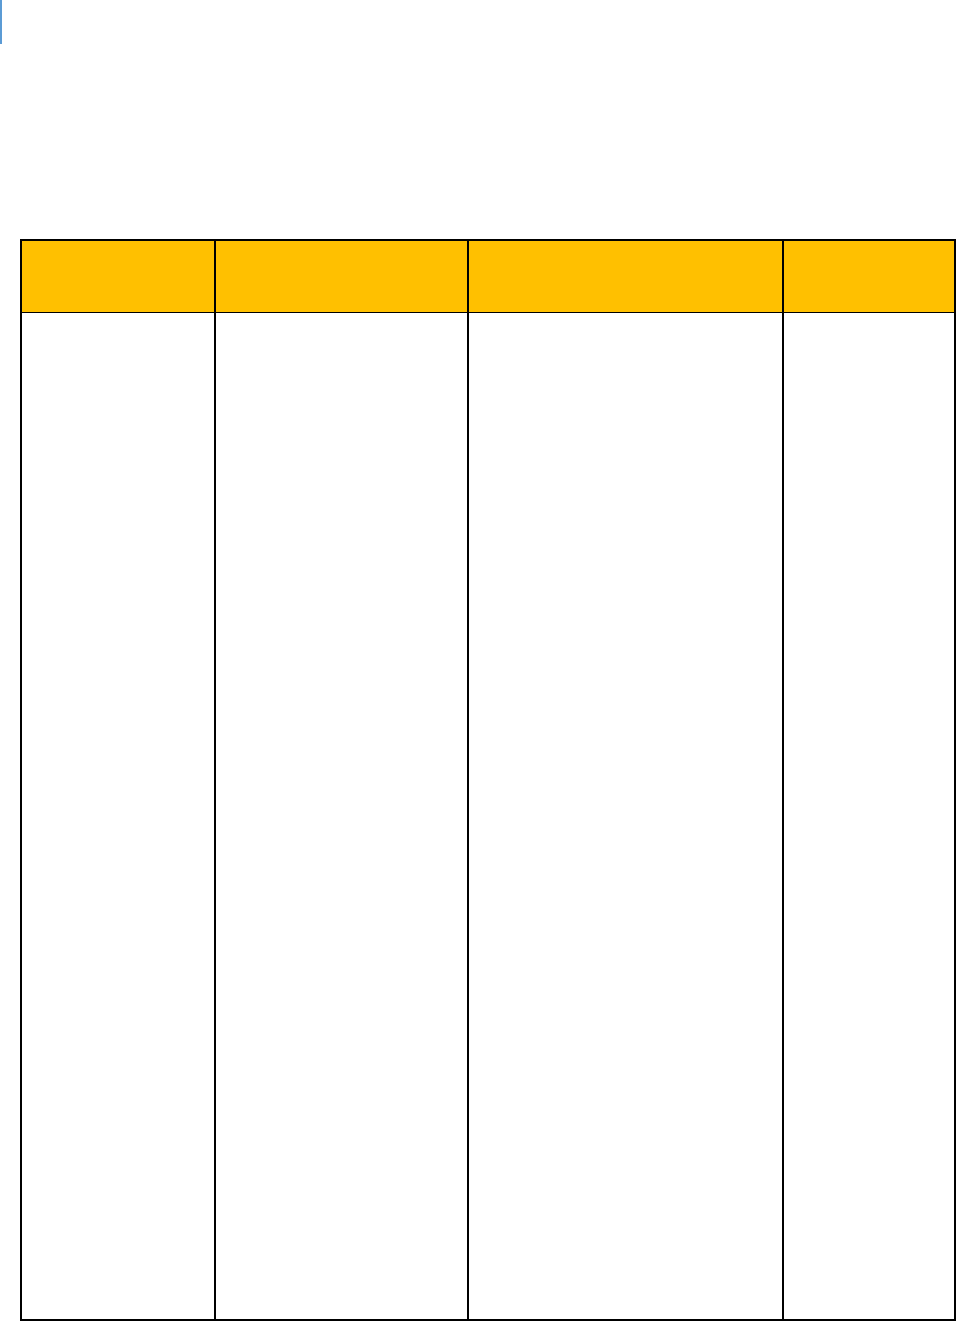
DRAFT Lee County Human Services Gap Analysis
Appendices Page | 469
Appendix G.
Lee County Parks and Recreaon CIP
Parks and Recreation CIP as of Oct. 30, 2019
Project name
Status
Summary
BoCC
direction
JY Linear Park
Trailhead
The design
consultants STA has
been approved by
procurement.
With the first section of John
Yarbrough Linear Park
having opened to the
public back in 2005, this
County facility now stretches
for 4.8 miles in between Six
Mile Cypress Parkway and
Colonial Boulevard, as well
as along Ten Mile Canal. The
development of a new
segment in between
Colonial Boulevard and
Hanson Street, roughly 1.8
miles long, is also being
planned by the City of Fort
Myers. To better
accommodate users, there
is a need to develop a
trailhead facility containing
paved parking, restrooms
and other amenities, as
none currently exist, which is
causing problems. Most
notably, from a parking
perspective, patrons arriving
at this facility in vehicles are
having to park on adjacent
private properties, one of
which recently posted “No
Parking” signage.
Additionally, people who
have disabilities have
difficulties accessing this
park given that there is no
ADA-compliant parking. To
remedy these problems, the
County purchased an
abutting 7.3-acre property
off Six Mile Cypress Parkway
in 2018 with the specific
intent of developing it with
This project is
slated for the
December 3
rd
Board
meeting.

DRAFT Lee County Human Services Gap Analysis
Appendices Page | 470
Project name
Status
Summary
BoCC
direction
paved parking, among
other amenities.
Telegraph
Creek Kayak
Launch
Possibly purchasing
property
This primitive launch parcel is
0.9 acres off North River Rd.
located on Telegraph Creek
in Alva.
No further
information.
Abel Canal
Greenway
Waiting on a LAP
Agreement from
FDOT.
The design phase,
which is tentatively
scheduled to begin in
2020, is expected to
take between 30 and
38 months to
complete.
This joint project between
Lee County and the Florida
Department of
Transportation involves the
design and construction of a
12’-wide paved shared-use
pathway along the northern
side of the Able Canal.
Once constructed, this
pathway will extend for
roughly 6 miles and provide
connections between
significant existing public
sites, including a 578-acre
stormwater management
area (i.e., Harns Marsh),
Lehigh Acres Park/Barbara
Farrell Park, Lehigh
Elementary School and
Lehigh Acres Trailhead Park.
This pathway will also
provide connections
between various residential
and commercial areas.
Additionally, this project will
involve the design and
construction of new
stormwater management
areas, a 240’-long
bicycle/pedestrian bridge
spanning the Charlie
Diversion Canal, high-
emphasis crosswalks at
roadway intersections,
shade structures, site
amenities (e.g., benches,
kiosks and recycling/trash
receptacles), signage and
landscaping.

DRAFT Lee County Human Services Gap Analysis
Appendices Page | 471
Project name
Status
Summary
BoCC
direction
Lehigh
Community
Park Expansion
Working with
procurement and
plan on going out to
bid.
Purchased 41.8 acres within
Lehigh Community Park,
which will meet the
demands of the Lehigh
Community. Plans to design
and construct multipurpose
fields and other park
amenities for the future.
Alva Equestrian
Park
Recently acquired 85 acres
parcel, located off North
River Road in Alva. Plans for
this park will consist of hiking
and equestrian trails. Future
plans to add restrooms.
No further
information.
Matanzas Pass
Boardwalk
Expansion
Construction to start
November/December
2019.
Replacing portion of the
existing boardwalk, bridges,
benches, pavilion and
kayak launch.
BoCC
awarded
contract at
the 11/5/19
meeting.
Phillips Park
Expansion
Closed on property
11/2019.
Adding pickleball courts
and basketball court.
Brooks Park
Master Plan &
Improvements
The design
consultants STA has
been approved by
procurement.
Adding a paved parking lot,
restrooms, and shade
structure.
This project is
slated for the
December 3
rd
Board
meeting.
Player
Development
Complex Fields
Adding 12 to 15 youth
baseball fields on property
located adjacent to the
existing complex.
Pine Island
Commercial
Marina
Bathymetric survey of
canal complete by
Coastal Engineering
Consultants,
Inc. Plans and specs
expected by end of
November 2019.
Dredging along 650 feet of
the canal and boat slip,
replacing 450 linear feet of
seawall along the canal,
installing concrete sidewalk,
and installing one standard
and one boat trailer
Americans with Disabilities
Act (ADA) parking spaces.
Lynn Hall Park
Boardwalk &
Dune
Improvement
Construction to start
November 2019.
Construction of dune
walkovers and ADA ramps.
BoCC
awarded
contract at
the 11/5/19
meeting

DRAFT Lee County Human Services Gap Analysis
Appendices Page | 472
Intenonally le blank.

DRAFT Lee County Human Services Gap Analysis
Appendices Page | 473
Appendix H.
Lee County Library System’s CIP
Library CIP as of November 2019
Project name
Status
Summary
Bonita Springs
Public Library
Project was substantially
complete on 7/1/2019. Library
was open to the public in
August 2019. Final completion
was issued on 11/27/2019.
Punch list is largely complete
with a few outstanding warranty
items.
New (Replacement)
Public Library for
Bonita Springs
Budget: $14,195,196
Administration East
Bldg. – Library
Administration
Office Renovation
In process to hire an architect to
start the design.
Library Administration
Office to be located to
Administration East
Building
Budget: $80,000
(Design Only)
East County
Regional Library
Final walk thru completed
6/18/2019. Waiting on close
out documents.
AMH addition and
miscellaneous
renovations
Budget: $550,000
North Fort Myers
Public Library
Project was substantially
complete on 6/17/2019. Library
was open to the public in
August 2019. Final completion
was issued on 11/07/2019.
Punch list is complete. Working
on close out.
New (Replacement)
Public Library for North
Fort Myers
Budget: $13,637,654
South County
Library Renovations
Not Started.
Building renovations
Budget: $4,000,000
Riverdale Library
Renovations
Not Started.
Building renovations
Budget: $1,500,000

DRAFT Lee County Human Services Gap Analysis
Appendices Page | 474
NW Regional
Library Sewer
Service
Construction should take place
starting April / May 2020
pending public sewer
availability.
Public utility connection
Budget: $1,500,000
*Lakes Regional
Library Renovations
In design / GMP approval
pending
Building renovations
Budget: $1,167,973
*The lakes renovaon is technically a budgeted major maintenance project. The funding is
from a bequest le specically to the Lakes Library.

DRAFT Lee County Human Services Gap Analysis
Appendices Page | 475
Appendix I.
Child Well-Being Index Summary
Child Well-Being Technical Explanaon

DRAFT Lee County Human Services Gap Analysis
Appendices Page | 476
Intenonally le blank.
DRAFT Lee County Human Services Gap Analysis
Appendices Page | 477
FLORIDA CHILD WELL-BEING INDEX SUMMARY
Keeping a focus on where counties can make life
better for our children & families
BROWARD
(18th overall)
DUVAL
(48th overall)
HILLSBOROUGH
(28th overall)
ECONOMIC
WELL-BEING
YEAR
%
Number
%
Number
Children in poverty
2009
16.6
22.6
22.2
2011
20.5
25.5
23.7
2014
20.1
79,836
26.7
54,020
23.3
70,010
2016
18.3
73,826
20.6
42,564
20.0
62,184
2017
18.0
73,178
23.0
48,079
21.4
67,670
Unemployment rate
2010
10.2
11.4
10.7
2011
9.4
10.3
9.6
2015
5.0
49,980
5.7
26,386
5.0
34,139
2016
4.6
46,241
5.0
23,601
4.5
31,675
2019*
3.3
34,548
3.7
18,499
3.4
25,376
High housing cost-burden (>30%
income spent)
2010
48.3
40.1
40.8
2007-2011
50.8
39.7
42.4
2012-2016
44.4
298,721
36.3
124,260
36.3
180,089
2013-2017
43.5
294,274
34.9
121,502
35.1
177,499
Teens not in school and not
working
2006-2010
8.5
11.2
9.9
2012-2016
6.8
6,043
9.4
4,031
7.2
4,987
2013-2017
6.6
5,895
9.4
4,053
6.9
4,774
EDUCATION
WELL-BEING
YEAR
%
Number
%
Number
3 & 4 year old children not
enrolled in school
2007-2011
39.2
46.2
52.4
2012-2016
42.1
18,978
51.2
12,670
50.8
17,638
2013-2017
41.1
18,994
50.9
12,358
52.0
17,978
4th grade students not proficient
in English Language Arts
2014/15
73.0
14,237
77.0
73.0
11,056
2015/16
75.0
15,395
77.0
7,745
74.0
11,762
2017/18
69.0
14,162
76.0
7,785
72.0
12,214
Spring 2019*
66.0
13,174
74.0
7,666
71.0
12,045
8th grade students not proficient
in math
2014/15
75.0
91.0
94.0
7,659
2015/16
73.0
9,296
86.0
4,856
89.0
7,157
2017/18
77.0
9,681
91.0
4,571
91.0
7,035
Spring 2019*
78.0
9,557
90.0
4,379
90.0
7,203
High school students not
graduating on time
2011/12
23.6
32.3
27.4
2014/15
23.4
23.4
1,980
24.0
3,485
2015/16
21.3
4,208
21.2
1,740
20.9
3,073
2016/17*
19.0
19.2
17.1
2017/18*
15.7
14.9
14.2
DRAFT Lee County Human Services Gap Analysis
Appendices Page | 478
FLORIDA CHILD WELL-BEING INDEX SUMMARY
Keeping a focus on where counties can make life
better for our children & families
BROWARD
(18th overall)
DUVAL
(48th overall)
HILLSBOROUGH
(28th overall)
HEALTH WELL-
BEING
YEAR
%
Number
%
Number
Low-birthweight babies
2010
9.1
9.3
9.1
2011
9.3
9.0
9.4
2015
9.3
2,074
10.0
1,306
9.0
1,586
2016
9.7
2,194
10.0
1,330
8.9
1,541
2017
9.7
2,164
10.0
1,315
9.3
1,613
Uninsured children
2009
26.7
19.7
21.6
2010
14.6
9.9
10.6
2014
10.5
43,850
7.1
15,033
7.9
25,006
2015
7.3
31,110
6.1
12,897
6.4
20,483
2016
7.0
29,524
5.3
11,332
5.5
18,020
2017*
8.3
35,698
6.5
14,005
7.1
23,765
Overweight and obese 1st, 3rd &
6th grade students
2008/09
36.7
24.2
29.3
2010/11
17.6
29.7
33.8
2013/14
41.0
18,616
32.5
7,630
33.8
15,668
2015/16
34.8
19,732
32.9
8,773
34.1
16,917
2016/17*
31.7
16,606
32.9
8,912
33.9
16,647
2017/18
31.3
18,210
33.6
9,046
25.7
13,711
High school teens who used
alcohol/drugs (past 30 days)
2010
39.9
43.0
47.1
2012
38.9
37.3
36.6
2014
32.3
356
38.3
402
37.7
341
2016
34.2
192
33.4
302
32.1
236
2018
27.2
154
29.2
166
30.4
FAMILY &
COMMUNITY
YEAR
%
Number
%
Number
Children in single parent families
2006-2010
33.5
36.6
35.5
2011-2015
35.7
126,385
40.8
72,455
36.9
97,309
2012-2016
35.9
126,999
40.3
72,256
37.0
99,104
2013-2017
36.6
129,581
39.2
71,171
37.2
101,309
Children living in high poverty
areas
2006-2010
7.6
11.7
11.5
2011-2015
9.3
37,321
15.4
31,588
14.9
45,172
2012-2016
7.5
30,066
14.0
28,885
15.2
46,576
2013-2017
8.8
35,865
14.1
29,232
12.6
39,265
Children with verified
maltreatment (per 1,000)
2011/12
9.7
9.3
7.8
2015/16
11.7
4608
10.7
2244
9.5
3029
2016/17
10.3
4,117
9.6
2058
8.7
2,782
2017/18
8.9
3,569
9.1
1973
7.5
2,468
Youth contacts with the juvenile
justice system (per 1,000)
2009/10
37.7
42.9
43.7
2011/12
29.3
29.7
31.3
2014/15
15.4
2,785
24.0
2,137
24.4
3,354
2016/17
12.1
2,170
17.9
1,636
18.5
2,625
2017/18
11.2
2,007
12.5
1,150
17.2
2,486
Data from: http://floridakidscount.org/ 2017, 2018, 2019 INDEX
*Updates made using the same sources more recent data or additional categories rows were not included in the FL Child Well-Being Index

DRAFT Lee County Human Services Gap Analysis
Appendices Page | 479
FLORIDA CHILD WELL-BEING INDEX SUMMARY
Keeping a focus on where counties can make life
better for our children & families
LEE
(42nd overall)
MANATEE
(27th overall)
MARTIN
(8th overall)
ECONOMIC
WELL-BEING
%
Number
%
Number
%
Number
Children in poverty
18.2
23.1
22.1
25.9
26.7
21.9
26.1
32,594
22.5
14,980
20.7
5,264
22.0
28,354
20.5
14,321
17.9
4,634
20.4
26,584
17.0
11,868
16.7
4,356
Unemployment rate
12.5
11.4
10.8
10.9
10.0
9.9
5.0
16,084
5.0
8,162
5.2
3,670
4.6
15,077
4.6
7,693
4.9
3,465
3.4
11,799
3.4
6,124
3.5
2,618
High housing cost-burden (>30%
income spent)
38.8
38.5
37.4
42.5
41.1
37.9
34.0
87,744
33.1
44,958
33.7
21,199
33.0
87,320
31.9
44,793
31.8
20,173
Teens not in school and not
working
9.4
10.3
8.7
8.4
2,345
8.8
1,318
7.3
468
8.2
2,359
9.1
1,374
5.6
360
EDUCATION
WELL-BEING
%
Number
%
Number
%
Number
3 & 4 year old children not
enrolled in school
56.2
56.4
46.8
58.6
7,849
58.0
4,390
39.5
987
57.8
7,673
56.9
4,189
41.7
1,158
4th grade students not proficient
in English Language Arts
75.0
4,804
73.0
2,508
71.0
74.0
4,948
76.0
2,923
75.0
1,018
74.0
5,248
72.0
2,824
72.0
950
73.0
5,031
70.0
2,665
72.0
929
8th grade students not proficient
in math
86.0
2,949
78.0
2,508
59.0
81.0
3,140
75.0
2,048
68.0
751
81.0
3,599
84.0
1,773
62.0
655
66.0
3,863
86.0
1,721
59.0
632
High school students not
graduating on time
28.1
23.8
15.1
25.3
1,630
22.1
643
11.1
171
22.2
1,367
16.5
459
11.3
172
21.3
18.9
16.1
17.2
14.6
12.1
DRAFT Lee County Human Services Gap Analysis
Appendices Page | 480
FLORIDA CHILD WELL-BEING INDEX SUMMARY
Keeping a focus on where counties can make life
better for our children & families
LEE
(42nd overall)
MANATEE
(27th overall)
MARTIN
(8th overall)
HEALTH WELL-
BEING
%
Number
%
Number
%
Number
Low-birthweight babies
7.8
7.9
7.0
7.9
8.3
7.9
7.5
510
6.8
237
5.3
67
8.6
581
7.6
262
7.5
96
8.0
536
7.8
271
7.2
91
Uninsured children
25.8
24.3
22.4
15.7
13.0
15.2
13.0
17,096
9.9
7,036
9.6
2,639
9.3
12,382
7.9
5,655
12.3
3,323
8.0
10,918
7.0
5,168
9.0
2,483
9.3
12,655
7.5
5,569
10.5
2,907
Overweight and obese 1st, 3rd &
6th grade students
28.0
44.5
32.2
34.0
52.7
32.9
32.1
6,204
29.7
2,592
32.3
1,296
33.9
6,407
3.7
3,764
33.6
1,313
33.6
6799
29.7
3,258
35.4
1,386
36.2
8101
31.1
3,477
36.0
1,464
High school teens who used
alcohol/drugs (past 30 days)
42.8
43.8
45.2
42.5
34.6
42.4
35.2
180
33.4
147
36.5
144
30.5
224
30.5
275
38.9
200
32.2
31.7
37.4
FAMILY &
COMMUNITY
%
Number
%
Number
%
Number
Children in single parent families
30.7
34.3
28.3
38.9
43,622
34.5
20,167
27.6
6,531
39.0
44,302
35.2
20,851
27.7
6,450
37.4
42,431
35
21,003
29.1
6,897
Children living in high poverty
areas
8.3
17.5
11.1
10.5
13,231
21.2
14,348
2.8
724
11.7
14,781
15.9
10,922
13
3,382
11.8
15,178
14.1
9,807
3.7
975
Children with verified
maltreatment (per 1,000)
7.2
11.2
5.5
8.1
1,044
17.4
1208
7.2
176
8.9
1,151
14.4
1,032
9.6
233
6.5
870
11.6
851
7.6
188
Youth contacts with the juvenile
justice system (per 1,000)
41.0
54.3
41.9
30.7
41
31.1
22.1
1,228
32.4
980
20.1
242
18.3
1,069
21.3
681
18.6
220
16.8
1,011
21.7
703
14.9
178
Data from: http://floridakidscount.org/ 2017, 2018, 2019 INDEX
DRAFT Lee County Human Services Gap Analysis
Appendices Page | 481
FLORIDA CHILD WELL-BEING INDEX SUMMARY
Keeping a focus on where counties can make life
better for our children & families
MIAMI-DADE
(44th overall)
OKEECHOBEE
(59th overall)
PALM BEACH
(10th overall)
ECONOMIC
WELL-BEING
%
Number
%
Number
%
Number
Children in poverty
24.0
31.7
21.5
28.9
36.2
24.1
27.7
149,722
35.3
2,986
21.9
24.8
135,018
29.4
2,527
19.0
52,473
22.0
121,165
31.3
2,635
16.8
47,117
Unemployment rate
11.1
12.6
11.0
9.4
11.9
10.0
6.1
81,983
6.2
1,068
5.0
34,867
5.4
72,494
5.4
956
4.8
34,228
3.3
47,135
4.1
719
3.6
26,706
High housing cost-burden (>30%
income spent)
52.9
34.7
44.7
54.6
39.6
46.1
49.3
421,253
28.3
3,633
39.9
214,719
48.5
416,055
25.3
3,372
39.1
212,377
Teens not in school and not
working
10.4
19.8
8.8
8.4
10,587
13.3
304
6.2
3,895
7.8
9,892
15.0
353
6.1
3,875
EDUCATION
WELL-BEING
%
Number
%
Number
%
Number
3 & 4 year old children not
enrolled in school
42.8
73.6
44.3
40.0
25,565
72.3
804
42.9
12,904
40.0
25,620
72.2
754
41.2
12,518
4th grade students not proficient
in English Language Arts
73.0
18,165
84.0
73.0
9,822
71.0
19,015
81.0
382
71.0
10,132
67.0
17,695
84.0
389
69.0
10,147
64.0
16,640
81.0
361
66.0
9,472
8th grade students not proficient
in math
87.0
13,642
91.0
76.0
6,439
84.0
13,907
82.0
251
61.0
7,690
85.0
12,920
77.0
280
57.0
7,409
85.0
12,051
83.0
269
59.0
8,284
High school students not
graduating on time
24.0
41.1
23.0
21.9
5,818
34.1
165
20.6
2,967
19.6
5,209
29.5
124
17.7
2,446
19.3
28.3
15.0
14.6
23.1
12.8

DRAFT Lee County Human Services Gap Analysis
Appendices Page | 482
FLORIDA CHILD WELL-BEING INDEX SUMMARY
Keeping a focus on where counties can make life
better for our children & families
MIAMI-DADE
(44th overall)
OKEECHOBEE
(59th overall)
PALM BEACH
(10th overall)
HEALTH WELL-
BEING
%
Number
%
Number
%
Number
Low-birthweight babies
9.1
10.0
8.9
8.7
7.9
9.1
8.4
2733
7.3
38
8.5
1,259
8.6
2,809
7.2
35
8.3
1,236
8.4
2,657
9.3
50
8.5
1,281
Uninsured children
34.0
31.2
25.7
17.2
14.1
15.8
9.8
55,839
13.2
1,177
11.3
31,912
7.8
44,501
11.1
980
8.8
25,332
6.8
38,760
8.1
718
7.7
22,525
6.7
38,773
9.7
839
8.4
24,691
Overweight and obese 1st, 3rd &
6th grade students
42.9
34.8
39.3
43.9
31.5
38.8
37.7
25,371
39.6
622
37.6
12,998
40.3
17,525
37.9
552
37.5
14,654
40.6
17,386
40.8
612
36.8
14,823
41.6
26,650
41.4
578
36.7
10,711
High school teens who used
alcohol/drugs (past 30 days)
41.8
51.8
46.0
43.4
45.0
43.7
37.2
321
41.1
218
40.7
398
31.1
203
30.5
138
33.3
306
31.1
32.5
31.4
FAMILY &
COMMUNITY
%
Number
%
Number
%
Number
Children in single parent families
35.3
32.4
33.9
36.8
172,002
40.9
2,814
35.0
84,523
37.5
174,609
37.8
2,481
34.8
84,561
37.6
175,723
32.4
2,188
33.8
82,868
Children living in high poverty
areas
13.8
7.6
8.0
22.7
124,875
49.6
4,474
14.8
40,375
20.5
112,390
30.1
2,701
12.4
34,186
18.7
103,273
24.7
2,194
11.3
31,440
Children with verified
maltreatment (per 1,000)
5.1
24.1
7.3
4.4
2499
15.5
146
5.0
1,364
3.9
2,200
16.5
156
4.3
1,168
2.9
1,648
17.2
162
4.2
1,186
Youth contacts with the juvenile
justice system (per 1,000)
27.5
47.7
31.1
16.2
35.4
25.4
11.1
2,788
19.9
85
17.4
2,152
8.2
2,084
21.1
93
14.6
1,808
7.5
1,925
30.2
134
14.6
1,840
Data from: http://floridakidscount.org/ 2017, 2018, 2019 INDEX
DRAFT Lee County Human Services Gap Analysis
Appendices Page | 483
FLORIDA CHILD WELL-BEING INDEX SUMMARY
Keeping a focus on where counties can make life
better for our children & families
PINELLAS
(29th overall)
ST. LUCIE
(37th overall)
State of Florida
ECONOMIC
WELL-BEING
%
Number
%
Number
Children in poverty
18.7
25.4
21.5
23.6
31.7
25.1
22.2
34,874
36.6
15850.0
24.2
962,857
19.6
30,877
26.3
16,032
21.3
869,892
17.2
27,024
19.1
11,873
20.6
850,924
Unemployment rate
10.8
13.8
11.1
9.7
12.6
10.0
4.9
23,111
6.2
8,191
5.4
522,065
4.4
21,081
5.7
7,601
4.9
480,368
3.1
15,865
4.3
6,327
3.5
363,000
High housing cost-burden (>30%
income spent)
38.9
44.0
41.8
42.1
47.4
43.1
36.2
146,807
37.6
40,907
37.3
2,754,755
35.3
143,678
36.2
39,878
36.1
2,712,928
Teens not in school and not
working
9.0
10.1
9.7
8.7
3,154
5.9
802
8.0
75,614
8.0
2,896
5.7
792
7.7
73,002
EDUCATION
WELL-BEING
%
Number
%
Number
3 & 4 year old children not
enrolled in school
53.2
52.4
48.9
49.9
8,537
55.6
3,827
49.5
223,266
49.2
8,493
52.8
3,647
49.5
223,989
4th grade students not proficient
in English Language Arts
75.0
5,402
81.0
2,382
73.0
74.0
5,521
82.0
2,442
74.0
154,853
75.0
5,743
77.0
2,365
71.0
153,187
72.0
5,288
76.0
2,231
70.0
147,939
8th grade students not proficient
in math
93.0
3,230
82.0
1,805
81.0
90.0
3,536
83.0
1,741
78.0
105,044
91.0
3,552
90.0
1,644
80.0
104,397
91.0
3,046
88.0
1,475
79.0
103,199
High school students not
graduating on time
28.0
29.4
25.5
21.7
1,696
24.5
728
22.1
44,254
19.9
1,527
13.2
382
19.3
38,214
17.1
9.9
17.7
14.0
8.2
13.9
29,124
DRAFT Lee County Human Services Gap Analysis
Appendices Page | 484
FLORIDA CHILD WELL-BEING INDEX SUMMARY
Keeping a focus on where counties can make life
better for our children & families
PINELLAS
(29th overall)
ST. LUCIE
(37th overall)
State of Florida
HEALTH WELL-
BEING
%
Number
%
Number
Low-birthweight babies
9.1
8.9
8.7
8.8
8.1
8.7
7.6
663
7.8
243
8.6
19,367
8.5
719
8.7
262
8.7
19,661
8.8
725
8.6
259
8.8
19,699
Uninsured children
22.4
25.6
8.7
11.0
15.0
13.4
8.4
13,983
10.0
6283
9.7
406,126
6.0
10,010
7.1
4,464
7.3
312,070
7.0
11,650
6.6
282,464
6.5
10,815
5.5
3,102
7.2
314,181
Overweight and obese 1st, 3rd &
6th grade students
32.4
40.7
34.5
34.9
38.7
34.4
40.5
9,292
40.4
3,548
35.5
194,508
41.9
11,366
39.8
3,255
35.0
199,422
35.9
8,234
39.9
3,573
34.3
193,809
35.1
7,565
43.5
3,744
34.5
205,359
High school teens who used
alcohol/drugs (past 30 days)
44.6
44.5
43.6
37.1
38.4
40.4
37.1
491
35.9
167
36.3
11,157
36.8
257
27.7
123
32.9
12,425
30.5
33.4
29.5
9,187
FAMILY &
COMMUNITY
%
Number
%
Number
Children in single parent families
35.7
34.2
33.2
38.3
53,185
34.8
18,930
35.7
1,253,515
37.7
52,221
35.9
19,378
35.7
1,258,425
37.0
51,500
35.2
19,048
35.3
1,258,424
Children living in high poverty
areas
5.8
9.2
8.5
7.0
11,241
13.0
7,947
13.5
547,478
9.5
15,251
12.7
7,740
12.3
500,585
7.0
11,234
10.2
6,249
11.2
458,646
Children with verified
maltreatment (per 1,000)
14.8
9.5
9.3
14.6
2,357
8.5
527
9.4
38843
12.8
2,078
7.4
4,563
8.3
34,481
11.9
1,944
7.4
472
7.5
31,585
Youth contacts with the juvenile
justice system (per 1,000)
41.9
46.7
40.4
31.8
33.8
30.0
30.8
2,262
26.9
745
23.0
42,211
21.3
1,551
21.4
602
17.8
33,389
20.7
1,507
20.8
591
16.4
31,206
Data from: http://floridakidscount.org/ 2017, 2018, 2019 INDEX
*Updates made using the same sources more recent data or additional cate
DRAFT Lee County Human Services Gap Analysis
Appendices Page | 485
2019 Florida Child Well-being Index - Terminology and Sources
All rates are per 100 (percentages) unless otherwise noted.
An asterisk (*) represents data that are suppressed due to confidentiality. This is when there are less
than 10 when reporting a number or when the denominator is less than 100 when reporting a
percentage.
An increase or decrease of at least 1% constitutes change.
Index Rank
Rankings are based on a scale containing 16 indicators of child well-being. Indicators in each
category are:
Economic- children in poverty, unemployment rate, high housing cost burden, teens not in
school and not working
Education- 3 and 4 year old children not enrolled in school, fourth-grade students not proficient
in English Language Arts, eighth-grade students not proficient in math, high school students
not graduating on time
Health- low-birthweight babies, uninsured children, overweight and obese 1
st
, 3
rd
, and 6
th
-grade
students, high school teens who used alcohol/drugs in the past 30 days.
Family and Community- children in single parent families, children living in high poverty
areas, children with verified maltreatment, and youth contacts with the Juvenile Justice
System.
Given the nature of our data, we were able to convert all data to ratios by county. Working with ratios
by county gave us the advantage to compare all counties fairly, regardless of the county’s population
size. All of our indicators were selected to follow the same direction, in our case, lower numbers are
best. That way when we summed all ratios, high values in one indicator did not mask low values in
another or vice versa. Scores for each indicator were summed to produce a score for each of the four
categories by county. Then, the scores for the four categories were summed to produce an overall
county score. The counties were ranked from 1 (best) to 67 (worst) for each category and as an overall
rank for the state.
Economic
Children in poverty – Children under age 18 who are living below the federal poverty level as
determined by the U.S. Census Bureau's Small Area Income and Poverty Estimates (SAIPE) program.
In 2017, the poverty threshold for two adults and two children under age 18 was $24,858.
The U.S. Census Bureau's Small Area Income and Poverty Estimates (SAIPE) program provides
annual estimates of income and poverty statistics for all school districts, counties, and states. The main
objective of this program is to provide estimates of income and poverty for the administration of
federal programs and the allocation of federal funds to local jurisdictions. In addition to these federal
programs, state and local programs use the income and poverty estimates for distributing funds and
managing programs. The estimates are not direct counts from enumerations or administrative records,
nor direct estimates from sample surveys. Instead, for counties and states, they model income and
poverty estimates by combining survey data with population estimates and administrative records. For
school districts, they use the model- based county estimates and inputs from federal tax information
and multi-year survey data to produce estimates of poverty. Detailed information about SAIPE
methodology and data input can be found at https://www.census.gov/programs-surveys/saipe.html
U.S. Census Bureau, Small Area Income and Poverty Estimates, Washington, DC
DRAFT Lee County Human Services Gap Analysis
Appendices Page | 486
Unemployment rate – The unemployment rate represents the number unemployed as a percent of
the labor force.
Unemployed - All persons who had no employment during the reference week (identified in
the survey), were available for work, except for temporary illness, and had made specific
efforts to find employment sometime during the 4-week period ending with the reference
week. Persons who were waiting to be recalled to a job from which they had been laid off
need not have been looking for work to be classified as unemployed.
Employed - All persons who, during the reference week, (a) did any work at all (at least 1
hour) as paid employees, worked in their own business, profession, or on their own farm, or
worked 15 hours or more as unpaid workers in an enterprise operated by a member of the
family, and (b) all those who were not working but who had jobs or businesses from which
they were temporarily absent because of vacation, illness, bad weather, childcare problems,
maternity or paternity leave, labor-management dispute, job training, or other family or
personal reasons, whether or not they were paid for the time off or were seeking other jobs
Labor force - comprises all persons age 16 and older classified as employed or unemployed.
The Local Area Unemployment Statistics (LAUS) program is a federal-state cooperative effort in
which monthly estimates of total employment and unemployment are prepared for approximately
7,500 areas. These estimates are key indicators of local economic conditions. The Bureau of Labor
Statistics (BLS) of the U.S. Department of Labor is responsible for the concepts, definitions, technical
procedures, validation, and publication of the estimates that state workforce agencies prepare under
agreement with BLS. The concepts and definitions underlying LAUS data come from the Current
Population Survey (CPS), the household survey that is the source of the national unemployment rate.
State monthly model- based estimates are controlled in "real time" to sum to national monthly
employment and unemployment estimates from the CPS. These models combine current and historical
data from the CPS, the Current Employment Statistics (CES) survey, and state unemployment
insurance (UI) systems. Estimates for counties are produced through a building-block approach known
as the "Handbook method." This procedure also uses data from several sources, including the CPS, the
CES program, state UI systems, and the Census Bureau's American Community Survey (ACS), to
create estimates that are adjusted to the statewide measures of employment and unemployment.
Detailed information about unemployment statistics can be found at https://www.bls.gov/lau/
U.S. Department of Labor, Bureau of Labor Statistics, Washington, DC
High housing cost burden – Occupied households (both owner and renter occupied) that spent more
than 30 percent of their monthly income for housing costs (rent, mortgage payments, taxes, insurance,
and/or related expenses).
U.S. Census Bureau, American Community Survey 2013-2017 5 year estimates, table B25106
Teens not in school and not working – Teens age 16-19 who were not enrolled in school,
were unemployed, and were not in the labor force.
Not enrolled in school – All teens age 16-19 not enrolled in school either part-time or full-
time. Unemployed – All civilians age 16-19 are classified as unemployed if they (1) were
neither “at work” nor “with a job but not at work” during the reference week, and (2) were
actively looking for work during the last 4 weeks, and (3) were available to start a job. Also
included as unemployed are civilians who did not work at all during the reference week, were
waiting to be called back to a job from which they had been laid off, and were available for
work except for temporary illness.
Not in the labor force - All people age 16-19 who are not classified as members of the labor
force. this category consists mainly of students, homemakers, retired workers, and seasonal

DRAFT Lee County Human Services Gap Analysis
Appendices Page | 487
workers interviewed in an off season that were not looking for work, institutionalized people,
and people doing only incidental unpaid family work (less than 15 hours during the reference
week).
U.S. Census Bureau, American Community Survey 2013-2017 5 year estimates, table B14005
Education
3 & 4 year old children not enrolled in school –3 and 4 year old children who were not enrolled in
either public or private school at any time during the 3 months prior to the time of the interview.
U.S. Census Bureau, American Community Survey 2013-2017 5 year estimates, table B14003
The Florida Standards Assessment (FSA) has replaced the Florida Comprehensive Assessment Test
2.0 (FCAT 2.0). Beginning with the 2014-15 school year the student assessment results reported are
based on the new standards. Students FSA responses are scored into 5 categories:
Level 1- Inadequate – Highly likely to need substantial support for the next
grade/course. Level 2 - Below satisfactory – Likely to need substantial support for the
next grade/course. Level 3 - Satisfactory – May need additional support for the next
grade/course.
Level 4 - Proficient – Likely to excel in the next grade/course.
Level 5 - Mastery – Highly likely to excel in the next
grade/course.
Fourth grade students not proficient in English Language Arts –4
th
grade students scoring
inadequate, below satisfactory, and satisfactory on the English Language Arts FSA.
Eighth grade students not proficient in math - 8
th
grade students scoring inadequate, below
satisfactory, and satisfactory on the Math FSA.
Note: Due to no students having been reported as tested in Franklin County for the 8
th
grade
mathematics portion of the Florida Standard Assessment for school year 2017/2018, 2016/17 data
were used for the current year.
Bureau of K-12 Student Assessment, Florida Department of Education, Tallahassee, Florida
High school students not graduating on time - High school students not graduating on time as defined
by the Federal Graduation Rate.
Federal Graduation Rate - Federal regulations require each state to calculate a four-year
adjusted cohort graduation rate, which includes standard diplomas but excludes GEDs, both
regular and adult, and special diplomas. The US Department of Education (USED) adopted
this calculation method in an effort to develop uniform, accurate and comparable graduation
rates across all states. The USED required states to begin calculating the new graduation rate
in 2010-11.
Florida’s graduation rate is a cohort graduation rate. A cohort is defined as a group of students
on the same schedule to graduate. The graduation rate measures the percentage of students
who graduate within four years of their first enrollment in ninth grade. Subsequent to their
enrollment in ninth grade, students who transfer out and deceased students are removed from
the calculation. Entering transfer students are included in the graduation rate for the class with
which they are scheduled to graduate, based on their date of enrollment. In the calculation,
stringent guidelines are prescribed for not only the definition of a graduate, but also for the

DRAFT Lee County Human Services Gap Analysis
Appendices Page | 488
definition of a transfer.
Students who transfer to adult education programs or Department of Juvenile Justice
(DJJ) facilities remain with their regular high schools’ cohorts.
Bureau of Accountability and Reporting, Florida Department of Education, Tallahassee, Florida
Health
Low birthweight babies – Infants born to resident mothers who weighed less than 2,500 grams (5 lbs.
8.2 oz.) at birth.
Division of Public Health Statistics and Performance Management, Florida Department of
Health, Tallahassee, Florida
Uninsured children – Children under age 19 with no health insurance coverage.
The U.S. Census Bureau’s Small Area Health Insurance Estimates (SAHIE) program produces
timely, single-year estimates for all counties and states by detailed demographic and income
groups.
SAHIE are model-based enhancements of the American Community Survey (ACS) estimates created
by integrating additional information from administrative records, postcensal population estimates,
and decennial census data. SAHIE methodology employs statistical modeling techniques to combine
this supplemental information with survey data to produce estimates that are more reliable. SAHIE
are broadly consistent with the direct ACS survey estimates, but with the help from other data
sources, SAHIE estimates are more precise than the ACS 1-year and 5-year survey estimates for
most counties. Detailed information about SAIPE methodology and data input can be found at
https://www.census.gov/programs-surveys/sahie.html
U.S. Census Bureau, Small Area Health Insurance Estimates, Washington, DC
Overweight and obese 1
st
, 3
rd
, and 6
th
grade students –1
st
, 3
rd
, and 6
th
grade students with a body mass
index greater than or equal to the 85
th
percentile.
Florida schools are required to do Body Mass Index (BMI) screenings for students in 1
st
, 3
rd
, and 6
th
grade to identify children who are at risk for obesity which may lead to other health problems. The
screening uses the child's age, height, and weight to determine body density. It does not take into
account muscle mass or bone structure. BMI is a number calculated from a person's weight and height.
BMI provides a reliable indicator of body fatness for most people and is used to screen for weight
categories that may lead to health problems.
Healthy weight – 5
th
through the 84
th
percentile Underweight – less than the 5
th
percentile Overweight – 85
th
through the
94
th
percentile Obese – greater than or equal
to 95
th
percentile
Division of Community Health Promotion, Florida Department of Health, Tallahassee, Florida
High school teens who used alcohol/drugs (past 30 days) – Surveyed high school youth who indicated
use of alcohol or any illicit drug in the past 30 days.
The Florida Youth Substance Abuse Survey (FYSAS) is a collaborative effort between the Florida
departments of Health, Education, Children and Families, Juvenile Justice, and the Governor's Office

DRAFT Lee County Human Services Gap Analysis
Appendices Page | 489
of Drug Control. It is based on the "Communities That Care" survey, assessing risk and protective
factors for substance abuse, in addition to substance abuse prevalence.
Each year there are minor adjustments made to the FYSAS instrument (i.e. in 2011 two items
measuring the use of synthetic marijuana were added), therefore caution should be used when
comparing measures from one year to another. Detailed information about the survey and
methodology can be found at https://www.myflfamilies.com/service-
programs/samh/prevention/fysas/Note: 2012 data were used for the baseline year for Hardee County
due to no students being reported as participating in the Florida Youth Substance Abuse Survey in
2014.
Note: 2016 data were used for the current year for Hardee and Taylor counties due to no students
being reported as participating in the Florida Youth Substance Abuse Survey in 2018.
2018 Florida Youth Substance Abuse Survey
Substance Abuse and Mental Health Program Office, Florida Department of Children and
Families, Tallahassee, Florida
Family and Community
Children in single parent families – Children under age 18 living in families with only one parent
present. Parent is either a male householder or a female householder with no spouse present.
U.S. Census Bureau, American Community Survey 2013-2017 5 year estimates, table B09002
Children living in high poverty areas – Children under age 18 living in census tracts where the
poverty rates of the total population are 30% or more.
In 2017, the poverty threshold for two adults and two children under age 18 was $24,858.
Population Reference Bureau analysis of data from the U.S. Census Bureau, 2000 Decennial Census
Summary File 1 and Summary File 3 and the 2006-2010 to 2013–2017 American Community Survey
5- year data.
Population Reference Bureau, Washington, DC
Children with verified maltreatment – Children (unduplicated) with at least one finding of verified
maltreatment (child abuse and / or neglect). The number of children with verified maltreatment and
the total child population (ages 0-17) in each county was used to calculate a maltreatment rate per
1,000 children. Data are reported for the period July 1, 2017 to June 30, 2018.
Investigation- Once a call to the Florida Abuse Hotline is accepted, it is referred to either the
Department of Children and Families or the Sheriff’s office for a Child Protective
investigation.
The term verified maltreatment is used when a preponderance of credible evidence exists and results
in a determination that the specific harm or threat of harm was the result of abuse, abandonment or
neglect.
FSFN Data Repository; Run Date 9/13/2018
Florida Department of Children and Families, Tallahassee, Florida
January 1, 2013 and 2017 Population Estimates
Office of Economic and Demographic Research, Florida Legislature
Youth contacts with the Florida Juvenile Justice System – Youth (unduplicated) taken into custody by

DRAFT Lee County Human Services Gap Analysis
Appendices Page | 490
a law enforcement officer based on probable cause and charged with a law violation. Youth are not
arrested but rather screened and assessed through the Florida Department of Juvenile Justice (FLDJJ)
intake process. The number of children screened through the intake process and the total child
population (ages 10-17) in each county was used to calculate a rate per 1,000 youth.
Bureau of Research & Data Integrity, Florida Department of Juvenile Justice, Tallahassee,
Florida January 1, 2018 Population Estimates
Office of Economic and Demographic Research, Florida Legislature

DRAFT Lee County Human Services Gap Analysis
Appendices Page | 491
Appendix J.
Calculang Household Income
Appendix J: Household Income and Federal Poverty Level: Criques of the
methodologies:
Household Income
Crique #1: How the Census measures household income in incomplete
Basically only cash income (wages, interest or dividends, social security, etc.) is
measured. Items not measured include taxes paid, earned income tax credit benets
received, and all kinds of noncash benets. If you get something from the government
that’s not cash — Medicare or Medicaid or SNAP, for example — that’s not income. And
if you get something from your job that’s not cash, health insurance for example, that’s
not income either
769
.
Crique #2 The census’s inaon measure is too pessimisc
The Census Bureau adjusts for inaon using the consumer price index rather than
either of the two main “chained” price indexes that economists generally regard as
more accurate, and which tend to grow less year to year
Crique #3 Demographic eects make comparisons of median incomes tricky
Compared with 1999, the current American population contains a greater share of
retired people and a greater share of people in their early 20s because the millennial
and baby boom generations contain more people than the Silent Generation and
Generation X cohorts.
The flip side is that in 1999, experienced middle-aged workers made up a larger share of
our population. Both retired people and inexperienced workers earn less than veteran
workers.
Consequently, the demographic shift from millennials being small children to millennials
being young workers pushes median household income down. The demographic shift
769
Yglesisas, M. 2016. 5 ways the census income report misleads us about the real state of the U.S. Economy.
www.vox.com. 9/15/2016

DRAFT Lee County Human Services Gap Analysis
Appendices Page | 492
from older boomers being experienced workers to being retirees also pushes median
household income down.
Crique #4: Household size is shrinking
Generally, the fewer people in a household, the lower the household income.
Depending on the details of your life (child support, housing arrangements, tax status,
etc.), your actual disposable income may go up or down. But the census doesn’t care
about disposable income; it’s very simplistically looking at household money income.
Crique #5: The survey data is problemac
The census report is survey data — basically a big poll. Polls are great when you don’t
have better information.
Quoting Yeglesisas, “using a survey to assess Americans’ income in 2015 is a little like
running a poll to figure out who won the 2012 election when you could count the votes
instead. The problem here is federal privacy laws generally prohibit government
statistical agencies from relying on administrative data to produce national economic
statistics.
The same applies, of course, to government social programs. Instead of running a poll on
how many people get federal housing assistance, we could look at housing agencies’
records. When Bruce Meyer and Nikolas Mittag got access to New York state
administrative data, they found massive undercounting in the surveys of the number of
people who were getting useful stuff from the government. They found that more than a
third of people getting housing assistance, 40 percent of people getting food stamps,
and 60 percent of people getting TANF or state-based general assistance didn't say so
when surveyed. And even people who said they got assistance underestimated how
much they were getting.
In total, the administrative data showed that the poverty rate was about 2.5 percentage
points lower than the surveys showed.”
770
770
ibid.

DRAFT Lee County Human Services Gap Analysis
Appendices Page | 493
Federal Poverty Guidelines
771
Background
A poverty measure typically has two components: the thresholds used to determine
whether an individual or family’s income is below the poverty line, and the resource-
counng rules used in making that determinaon.
Crique #1: The thresholds are out of date
Current poverty thresholds were established in the 1960s. At that me, research
indicated that the typical family spent about one-third of its income on food, so poverty
thresholds were derived by mulplying a low-cost food budget by three. Since then the
thresholds have only been adjusted for inaon. A family is considered poor if its pre-
tax cash income falls below the applicable poverty threshold. Living costs and
standards have changed in many ways since the 1960s. Food now comprises only about
one-seventh of an average family’s expenditures. The poverty line represented nearly
50% of median income for a family of four in the early 1960s, but now represents only
about 28% of median income. So, the level at which a family is considered poor has
fallen further and further outside the mainstream.
Crique #2: The thresholds are essenally arbitrary
This is because they simply represent a number calculated more than 40 years ago and
then adjusted for inaon, and they no longer represent anything in relaon to family
incomes or costs.
Crique #3: The resource-counng rules both understate and overstate resources.
They fail to reect the eects of policies such as refundable tax credits, near-cash
benets such as Supplemental Nutrion Assistance Program (formerly food stamps) or
subsidized housing assistance. At the same me, they also do not consider the impact
for family budgets of tax liabilies, work expenses, or health care costs.
Crique #4: The rules make no adjustment for geographical variaon.
There are large variaons in costs across areas and regions of the country.
771
Poverty vs Federal Poverty Level. www.publichealthonline.gwu.edu/blog/poverty-vs-federalpovertylevel

DRAFT Lee County Human Services Gap Analysis
Appendices Page | 494
Intenonally le blank.
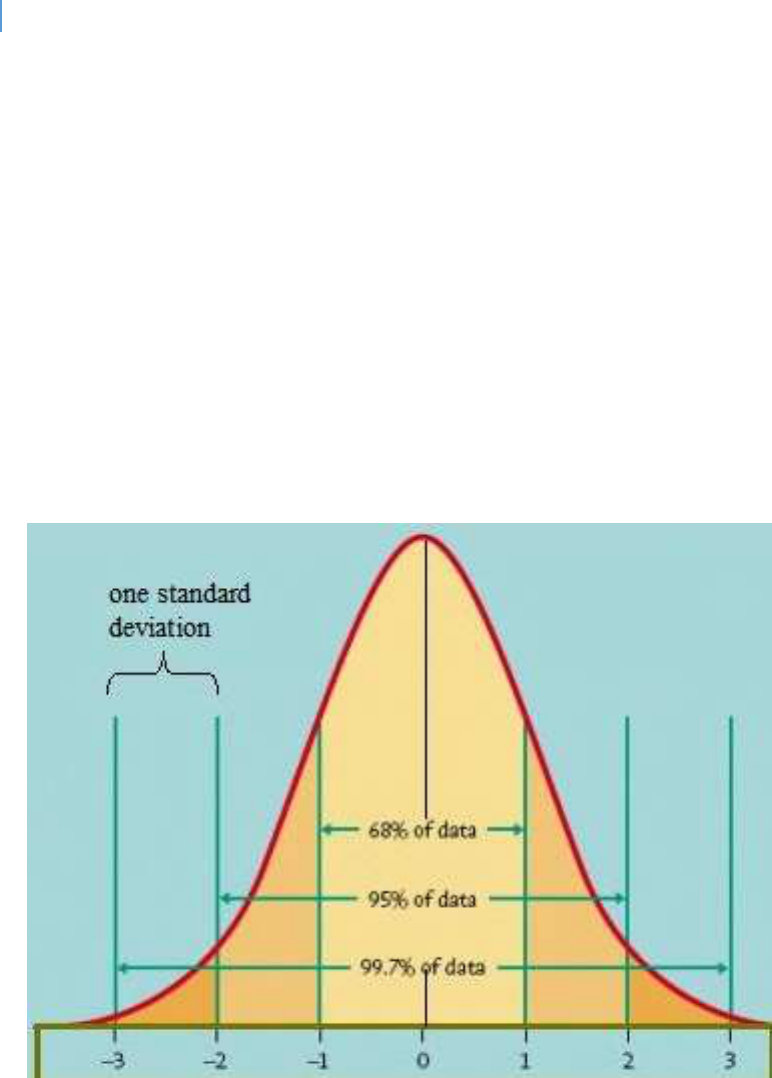
DRAFT Lee County Human Services Gap Analysis
Appendices Page | 495
Appendix K.
The Bell Curve and Smoothing Data
Appendix J: The Bell Curve and Smoothing Data
The Bell Curve
The Bell Curve is a stascal model presenng the assumed frequency of a normal
distribuon of data. It is shown in gure 39. The “0” represents the mean score of the
distribuon. 68.2% of the scale will fall within one standard deviaon of the mean.
Figure 39. The Bell Curve and Its Standard Deviations

DRAFT Lee County Human Services Gap Analysis
Appendices Page | 496
The Data Issue
This report draws its data from a variety of sources, some private but primarily ocial
governmental sources. Most of this data involves one or more of the following methods:
National, state or local surveys which sample the overall population
Local public records which have been aggregated;
State level data collected from state agencies which are organized into various
geographical sub-regions
Aggregations of various data bases
While each of these sources provides helpful data, each has its own limitaons. These
include:
Differences in data collection practices which can range from consistency and quality
of data collection to differing interpretation of variables;
Differences in data reporting from year to year;
Data may be collected at a general level without the detailed data that enables a
more granular analysis. This can create the need for data interpolation or other
forms of estimation;
Vagueness in survey questions;
Survey responses may be inaccurate due to memory, mis-understanding of the
question, survey fatigue or a hesitation to provide full information for some reason.
Table 121 is an illustraon of the data interpretaon challenge. The data in the table is
aggregated data used to create an overall child wellbeing index for Florida counes. As the
table shows, there can be signicant variaon in annual rankings. Averaging is one way of
smoothing this data so that a more reliable and valid ranking can be developed. It also
serves as a cauonary tale in any comparave rankings or rangs that hard precision is
illusionary. It is an over-simplicaon that a small average dierence is in any way
meaningful.
DRAFT Lee County Human Services Gap Analysis
Appendices Page | 497
Table 121. Overall Child Well Being Rankings: Top Ten Counties 3 Year Average
772
County
2019
2018
2017
Rank of 67 Counes
3-Year Average
Saint Johns
1
1
3
1.7
Okaloosa
3
2
4
3.0
Sarasota
5
4
1
3.3
Nassau
6
3
2
3.7
Santa Rosa
2
6
8
5.3
Marn
8
8
5
7.0
Clay
12
5
6
7.7
Brevard
14
9
12
11.7
Wakulla
7
16
19
14.0
Leon
16
10
18
14.7
These factors require cauon in data interpretaon. Cauonary steps include:
Use of multiple data sources where available;
Use of multi-year data where available;
The smoothing of data through various statistical techniques such as moving averages or
exponential smoothing;
773
Use of error rates in probability sampling;
Reference to meta-analysis studies if available;
Formulation of alternative hypotheses;
Examination of alternative explanations via literature review.
772
http://floridakidscount.org/docs/2019Index/2019-cwbi.pdf
773
What are moving average or smoothing techniques? www.itl.nist.gov

DRAFT Lee County Human Services Gap Analysis
Appendices Page | 498
Comparave Analysis
One of the analycal tools used in this analysis is the comparison of Lee County data to
State of Florida or other Florida counes where such data is available. In some cases,
this is per-capita data, in other cases averages. The challenge is how to reasonably
compare such data and avoid false conclusions about the validity of any dierences.
For example, assume the State of Florida average is 15.2 (with a higher number being
beer) and Lee County’s average is 14.9. In terms of this score Lee County is below
average. But is it really? If one were working with probability stascs this queson
could be tested empirically through standard error data to determine if the dierence
was stascally signicant or not. Yet even stascal signicance may be of lile to no
praccal signicance. Praccal signicance is determined by a variety of factors such as:
How many people are impacted by the difference?
What is the cost and time required to impact the number of people impacted?
How significant an issue is this for the persons involved?
How does this difference compare to other differences that may exist?
How well do we understand causal factors and effective strategies?
If we were to attempt to reach or exceed average (assuming we are below it),
what would it cost, how likely is success and to what degree would the quality of
life in the community improve in a meaningful way?
To avoid drawing non-valid conclusions in this study when comparave data is being
examined, the following criterion was used:
If the Lee County average was within 10% of the comparable average, above or below,
then Lee County was considered as average. This conclusion is reported in the various
tables as “within 10% average”. Why 10%?
The Bell Curve in gure 39 shows that 68% of a normal distribuon responses fall within
one standard deviaon. Approximately 30% of this one standard deviaon is equal 10%
of one side of the mean. Given the deviaons that would be expected from mulple
samplings or due to collecon error, this is an esmaon that numbers falling within
one-third of the standard deviaon may be considered funconally or praccally
equivalent. This is not an argument that they are stascally equivalent but rather that
they are funconally equivalent.
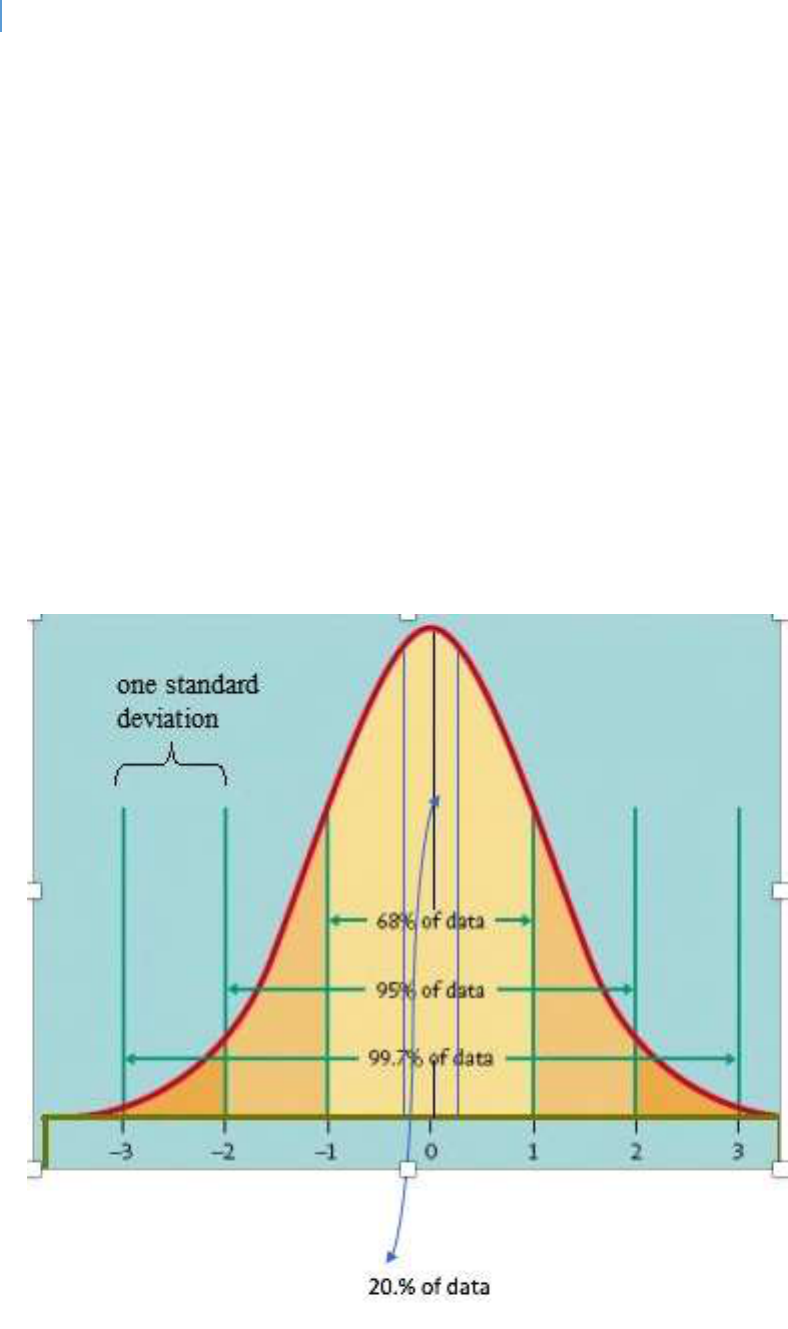
DRAFT Lee County Human Services Gap Analysis
Appendices Page | 499
Figure 40 illustrates the proporon of the Bell Curve that it is assumed equals funconal
equivalence.
Why compare Lee to other Florida counes and not naonal data points?
While there are local dierences in Florida counes, they all operate within the same
state policy framework and, for the most part, all have the same tools to work with to
address the needs and concerns of the county they serve. Counes or parishes in other
states have dierent tools and must work in dierent state policy frameworks. While
comparisons among diering Florida counes are rarely “apple to apple” comparisons,
they are at least “apple to fruit.” Trying to compare a Florida county to a county in any
other state may become an “apple to vegetable” exercise.
Figure 40. Functional Equivalence Bell Curve Assumption

DRAFT Lee County Human Services Gap Analysis
Appendices Page | 500
Limitaons of this Approach
There are several limitaons of this approach. These include:
Non-normal bell curves. Not all data fits a normal bell curve distribution. In these cases,
a ten percent (10%) variation could be more or less significant than it would be in a
normal distribution.
Lack of standard deviation and range data. This data is often not provided in the data
bases available for this analysis.
Highly precise data. This approach assumes that, for the reasons explained above, the
data available for this analysis has a sufficient degree of variability that assuming an
average is very precise is erroneous. If the data is highly precise with very little
variability, a slightly below or above average score could be meaningful.
Mis-interpretaons of this approach
This approach is vulnerable to the following mis-interpretaons:
There is no need for improvement. Data falling within the 10% range of the average
score means there is no need for community action. It does not mean this at all. A
community may decide that being “average” on any measure is not their goal or desire.
This data simply states where a community is, not where it wants to be.
Average means there is no gap. This is a variation of the prior mis-interpretation. These
comparisons are made within the State of Florida. The State itself may have a gap
compared to the nation. In this case, it simply means that the gap in Lee County is the
same as the gap in the other counties. Or there may be a national gap and Lee County is
like the rest of the nation.
The focus should be on those areas where Lee County is below average. Not
necessarily. Any additional investments should be based on the best available
understanding of causal factors. It is possible that making greater investments in an

DRAFT Lee County Human Services Gap Analysis
Appendices Page | 501
area where the County is even above average may be the most effective strategy to
raise a below average behavior.
Accurate Interpretaons of this Approach
This data is best interpreted using the following guidelines:
Focus for further analysis. This approach does not seek to be the final word on any
outcome. Rather it seeks to sort this data to facilitate further analysis and discussion.
Differences may be false and due simply to collection procedures or substantive due to
actual community conditions. The presentation of comparative data made in this
analysis is intended to help focus that discussion and determine which outcomes may
need greater community attention.
Functional significance. This approach is not intended to calculate statistical significance
or could it with the existing data limitations. Rather it is intended to help focus on the
practical implications of differences.
Causal modeling. In a resource-constrained world, the question always is how to use
those limited resources for optimum impact. Discussion and analysis of how the various
behaviors are related to one another and which could have the most impact can begin
with these data.
