
Impossible Beef and Meatball
Impossible Foods
WSP Canada
February 7, 2022
Page 1
ADDENDUM TO:
COMPARATIVE ENVIRONMENTAL LCA OF THE IMPOSSIBLE BURGER WITH
CONVENTIONAL GROUND BEEF BURGER
CLIENT:
Final version
FEBRUARY 7, 2022
WSP CANADA
WSP.COM/CA

Impossible Beef and Meatball
Impossible Foods
WSP Canada
February 7, 2022
Page 1
LIFE CYCLE ASSESSMENT REPORT
Addendum to Quantis (2019): Comparative Environmental LCA of the Impossible Burger with Conventional Ground Beef
Burger, which is published here.
Client:
Impossible Foods Inc. (“Impossible Foods”)
Redwood City, California, CA
Client Contact:
Arjun Lev Pillai Hausner
Impact Strategy Senior Analyst
arjun.hausner@impossiblefoods.com
Study Practitioner:
WSP Canada Inc.
Colin Powell, PhD
Colin.powell@wsp.com
Darius Tolkien-Spurr
Darius.Tolkien-Spurr@wsp.com
DISCLAIMER
WSP Canada (WSP) prepared this report solely for the use of the intended recipient, Impossible Foods (IF), in accordance with the professional services
agreement between the parties. In the event a contract has not been executed, the parties agree that the WSP General Terms for Consultant shall govern their
business relationship which was provided to you prior to the preparation of this report. The report is intended to be used in its entirety. No excerpts may be
taken to be representative of the findings in the assessment. The conclusions presented in this report are based on work performed by trained, professional and
technical staff, in accordance with their reasonable interpretation of current and accepted engineering and scientific practices at the time the work was
performed.
The content and opinions contained in the present report are based on the observations and/or information available to WSP at the time of preparation, using
investigation techniques and engineering analysis methods consistent with those ordinarily exercised by WSP and other engineering/scientific practitioners
working under similar conditions, and subject to the same time, financial and physical constraints applicable to this project.
WSP disclaims any obligation to update this report if, after the date of this report, any conditions appear to differ significantly from those presented in this
report; however, WSP reserves the right to amend or supplement this report based on additional information, documentation or evidence.
WSP makes no other representations whatsoever concerning the legal significance of its findings.
The intended recipient is solely responsible for the disclosure of any information contained in this report. If a third party makes use of, relies on, or makes
decisions in accordance with this report, said third party is solely responsible for such use, reliance or decisions. WSP does not accept responsibility for
damages, if any, suffered by any third party as a result of decisions made or actions taken by said third party based on this report.
WSP has provided services to the intended recipient in accordance with the professional services agreement between the parties and in a manner consistent
with that degree of care, skill and diligence normally provided by members of the same profession performing the same or comparable services in respect of
projects of a similar nature in similar circumstances. It is understood and agreed by WSP and the recipient of this report that WSP provides no warranty,
express or implied, of any kind. Without limiting the generality of the foregoing, it is agreed and understood by WSP and the recipient of this report that WSP
makes no representation or warranty whatsoever as to the sufficiency of its scope of work for the purpose sought by the recipient of this report.
In preparing this report, WSP has relied in good faith on information provided by others, as noted in the report. WSP has reasonably assumed that the
information provided is correct and WSP is not responsible for the accuracy or completeness of such information.
WSP disclaims any responsibility for consequential financial effects on transactions or property values, or requirements for follow-up actions /or costs.
The original of this digital file will be kept by WSP for a period of not less than 10 years. As the digital file transmitted to the intended recipient is no longer
under the control of WSP, its integrity cannot be assured. As such, WSP does not guarantee any modifications made to this digital file subsequent to its
transmission to the intended recipient. This limitations statement is considered an integral part of this report.

Impossible Beef and Meatball
Impossible Foods
WSP Canada
February 7, 2022
Page 2
Contents'
EXECUTIVE SUMMARY 5
1 GOAL OF THE STUDY 9
2 SCOPE OF THE STUDY 11
3 LIFE CYCLE INVENTORY ANALYSIS 25
4 LIFE CYCLE IMPACT ASSESSMENT 30
5 LIFE CYCLE INTERPRETATION 36
6 REFERENCES 50
APPENDIX A – IB AND BB PROCESSES 52
APPENDIX B – IM AND MM PROCESSES 53
APPENDIX C – ANCILLARY PROCESSES 54

Impossible Beef and Meatball
Impossible Foods
WSP Canada
February 7, 2022
Page 3
TABLES
TABLE 1 – FUNCTIONALLY EQUIVALENT SCENARIOS 12
TABLE 2 – NUTRITIONAL DATA FOR IB, BB, IS, PS, IM, MM 13
TABLE 3 – BOUNDARY DESCRIPTIONS FOR IB SCENARIOS (WSP
ANALYSIS) 15
TABLE 4 – BOUNDARY DESCRIPTIONS FOR IM SCENARIOS (WSP
ANALYSIS) 17
TABLE 5 – BOUNDARY DESCRIPTIONS FOR MM SCENARIOS (WSP
ANALYSIS) 21
TABLE 6 – DATA QUALITY INDICATORS 24
TABLE 7 - PEDIGREE SCORING QUALITY CRITERIA 24
TABLE 8 – LIST OF INGREDIENTS FOR HEME, IB AND IM 27
TABLE 9 – PACKAGING AMOUNTS, PER KG OF PRODUCT 30
TABLE 10 – ALL SCENARIO INDICATOR CATEGORY RESULTS, PER
FUNCTIONAL UNIT 32
TABLE 11 – CONTRIBUTION OF EACH STAGE TO THE IB-US AND BB-US
SCENARIOS 34
TABLE 12 – CONTRIBUTION OF EACH STAGE TO THE IM1-US AND MM1-
US SCENARIOS 34
TABLE 13 - CONTRIBUTION OF EACH STAGE TO THE IM2-US AND MM2-
US SCENARIOS 34
TABLE 14 - SIGNIFICANT CONTRIBUTING PROCESSES (I.E. THOSE THAN
CONTRIBUTE 5% OR MORE TO OVERALL TOTAL) FOR
THE IB-US 35
TABLE 15 - SIGNIFICANT CONTRIBUTING PROCESSES (I.E. THOSE THAN
CONTRIBUTE 5% OR MORE TO OVERALL TOTAL) FOR
THE IM1-US 36
TABLE 16 – DATA QUALITY EVALUATION 38
TABLE 17 - DATA QUALITY COMMENTARY FOR THE IB-US SIGNIFICANT
PROCESSES 40
TABLE 18 – EVALUATION OF DATA QUALITY CRITERIA FOR THE IB-US
SCENARIOS 41
TABLE 19 - DATA QUALITY COMMENTARY FOR THE IM1/IM2-US
SIGNIFICANT PROCESSES 42
TABLE 20 – EVALUATION OF DATA QUALITY CRITERIA FOR THE IM1/IM2-
US SCENARIOS 44
TABLE 21 – UNCERTAINTY TYPES 45
TABLE 22 – IMPACT CATEGORY RESULTS PER 100 CALORIES OF FOOD 46
TABLE 23 – IMPACT CATEGORY RESULTS PER 10 G OF PROTEIN IN FOOD 47

Impossible Beef and Meatball
Impossible Foods
WSP Canada
February 7, 2022
Page 4
TABLE 24 – RELEVANT IMPACT CATEGORY RESULTS WITH DIFFERENT
MODELS USED 48
TABLE 25 – IB BULK MEAT - REDACTED 54
TABLE 26 – IB AND BB PROCESSING – REDACTED 54
TABLE 27 – IB AND BB - PACKAGING 54
TABLE 28 – IM BULK MEAT - REDACTED 55
TABLE 29 – MM BULK MEAT - REDACTED 55
TABLE 30 – IM AND MM – REDACTED 55
TABLE 31 – IM1 AND MM1 - PACKAGING 55
TABLE 32 – IM2 AND MM2 - PACKAGING 55
TABLE 33 - SOYBEAN PROTEIN CONCENTRATE; MODIFIED PROCESS
(IMPOSSIBLE FOODS, 2020) 56
TABLE 34 – CRUDE SUNFLOWER OIL; MODIFIED PROCESS (IMPOSSIBLE
FOODS, 2020) 57
TABLE 35 – REFINED SUNFLOWER OIL; MODIFIED PROCESS (IMPOSSIBLE
FOODS, 2020) 58
TABLE 36 – FREEZER TRUCK TRANSPORTATION (IMPOSSIBLE FOODS,
2020) 58
TABLE 37 – FREEZER FREIGHTER TRANSPORTATION (IMPOSSIBLE FOODS,
2020) 59
TABLE 38 – COCONUT OIL, INCLUDING TRANSPORT 60
TABLE 39 – HEME INGREDIENTS AND PRODUCTION 61
FIGURES
FIGURE 1 – INVENTORY BOUNDARY FOR THE IB SCENARIOS (WSP
ANALYSIS) 15
FIGURE 2 – INVENTORY BOUNDARY FOR THE IM SCENARIOS (WSP
ANALYSIS) 17
FIGURE 3 – INVENTORY BOUNDARY FOR BB SCENARIOS (WSP ANALYSIS) 19
FIGURE 4 – INVENTORY BOUNDARY FOR MM SCENARIOS (WSP
ANALYSIS) 20

Impossible Beef and Meatball
Impossible Foods
WSP Canada
February 7, 2022
Page 5
1 EXECUTIVE SUMMARY
Impossible Foods Inc. (Impossible Foods) aims to restore biodiversity and reduce the impact of climate change by transforming
the global food system. To do this, Impossible Foods makes meat, fish, and dairy analogs from plants. Impossible Foods has
developed two new plant-based meat alternatives (PBMA): 1) the Impossible Meatball Made from Plants (IM), that aims to
mimic the flavour and texture of a meat-based meatball (MM)
1
and has a recipe that can be represented by an equal (50% each)
mix of two other bulk Impossible products (i.e. uncooked bulk products of the Impossible Burger (IB) and Impossible Sausage
Made from Plants (IS)); and 2) a new recipe for its IB product. The ingredients used in these products have generally been
examined prior in two critically reviewed LCAs, to be leveraged directly for this work.
Impossible Foods has commissioned WSP Canada Inc. (WSP) work to calculate four specific life cycle potential impact
categories (global warming potential, freshwater eutrophication potential, land occupation, and water consumption) of the new
IB recipe and compare it against a beef burger (BB) in the US and two different versions of the IM produced in the United
States (US) and distributed to the US and compare it against a MM comprised equally of ground beef and ground pork. These
impact categories were chosen because they will provide the most business value to Impossible Foods in their discussions with
customers and other clients and are the most salient to animal agricultural environmental impacts. As a result, the net new
contributions of this addendum related to the new IB recipe and the IM products are as follows:
■ Four specific life cycle potential impact categories are calculated for a new IB product produced in the US and distributed
to the US and compared against a BB produced and distributed in the domestic markets of the US.
■ Four life cycle potential impact categories of two IM products, manufactured in the US and distributed within the US and
are compared against functionally equivalent MMs (MM1 for retail consumption and MM2 restaurant-type food service)
produced in the domestic markets of the US.
Boundary and scope
The type of inventory is cradle-to-gate of the initial purchaser of finished product, whether a retailer or food services provider,
prior to purchase/consumption by an end consumer; the retail, use and end-of-life stages are excluded from the boundary
because they are assumed to be identical for the respective comparative scenarios.
The four impact categories for all scenarios are considered on a per kilogram (kg) of delivered final product basis. ReCiPe
Midpoint (H) v1.12/World Recipe H was used to quantify all indicators. These four impact categories were quantified using
primary data from Impossible Foods manufacturing facilities and secondary data from literature, industry sources and
commercial databases. Only the results for the four impact categories were quantified because these are the key environmental
areas of concern for Impossible Foods; this specific reporting of impact categories is also consistent with previous PBMA life
cycle assessments (LCAs) (Dettling, Tu, Faist, DelDuce, & Mandlebaum, 2016; Khan, Loyola, Dettling, & Hester, 2019) as
well as other meat-based LCAs.
This study was conducted with the intention to communicate the LCA results and conclusions internally and externally.
Internal communication will aid in internal decision-making and provide information to the company’s stakeholders who are
interested in the impacts associated with producing the Impossible Foods products. While the results are intended to be
communicated externally, the study was not critically reviewed because the only net difference is an examination of the select
potential environmental impacts of a new IB recipe and a new IM recipe. The changes to the IB recipe from the product
1
A note that this LCA does not assess the flavour nor texture of the particular products under study.

Impossible Beef and Meatball
Impossible Foods
WSP Canada
February 7, 2022
Page 6
examined in Qantis (2019) are very minor. The IM recipe uses ingredients and processes that were previously subject to critical
review in both Qantis (2019) and Impossible Foods (2020). The data in Qantis (2019) and Impossible Foods (2020) are used
and referenced directly throughout this report and relevant details are referenced when necessary.
Results
In general, the four impact categories of the Impossible products are (IB and IM) lower than the meat-based products (BB and
MM, respectively). The following are the key findings from this work:
IB AND BB
■ The GWP result for the IB is 91% lower than that of the BB scenario because of the enteric fermentation and manure
management emissions for the BB.
■ The freshwater eutrophication potential result for the IB is 85% lower than that of the BB scenarios because of the
additional crop inputs and manure application for the BB.
■ The land occupation result for the IB is 96% lower than that of the BB scenarios because of the additional crop inputs; the
land use result for both IB and BB is primarily due to crop production. The primary contributor for the IB is heme and
coconut oil.
■ The water consumption result for the IB is 92% lower than that of the BB scenarios primarily because of crops used in
feed production.
IM AND MM
■ The GWP result for the IM is 85% lower than that of the MM scenarios because of the enteric fermentation and manure
management emissions for the BB and PS, as noted prior. The GWP results for the IM1-US and IM2-US scenarios do not
differ significantly because the only difference in the life cycle stages is packaging.
■ The freshwater eutrophication potential result for the IM is 82% lower than that of the MM scenarios because of the
additional crop inputs and manure application for the BB and PS, as noted prior.
■ The land occupation result for the IM is 88% lower than that of the MM scenarios because of the additional crop inputs for
the BB and PS.
■ The water consumption result for the IM is 87% lower than that of the MM scenarios primarily because of crops used in
feed production.
The application of the results, interpretation, and conclusions of this study are limited to the products considered in this study.
Furthermore, the results calculated for the Impossible Foods products are limited to the unique recipe and cannot be extrapolated
or applied to the production of other PBMAs by other means.
In summary, the study has found that there are clear potential environmental benefits in the impact categories of concern
discussed in this study, to using Impossible Foods products examined in this work compared to the meat-based products
examined in this work.

Impossible Beef and Meatball
Impossible Foods
WSP Canada
February 7, 2022
Page 7
Assessment Summary
Life Cycle Assessment (LCA)
Addendum to: Comparative environmental LCA of the Impossible Burger® with conventional ground beef burger
Parameter
Description
Company Name
and
Contact
Information
Study Commissioner:
Impossible Foods
Redwood City, California, USA
Client Contact:
Arjun Lev Pillai Hausner
Impact Strategy Senior Analyst
arjun.hausner@impossiblefoods.com
Study Practitioners:
WSP Canada Inc.
Colin Powell
Colin.powell@wsp.com
Darius Tolkien-Spurr
Darius.tolkien-spurr@wsp.com
Standards Used
ISO 14040 2006: Environmental management – Life cycle assessment – Principals and framework
ISO 14044 2006: Environmental management – Life cycle assessment – Requirements and
guidelines
Product Name
There are two products under study in this LCA:
1) a new Impossible Burger (IB) recipe for which new comparative claims will be made
against a beef-based burger (BB) in the US (IB-US, BB-US);
2) an Impossible Meatball (IM), which has a recipe that is equal amounts IB and IS, for
which new comparative claims will be made against a meat-based meatball (MM)
comprised of equal amounts (50% each) beef and pork, in the US (IM-US, MM-US). Two
different marketable IM products will be examined here: IM1-US, MM1-US are for retail
delivery and IM2-US, MM2-US are for food service delivery (the only difference between
the products is packaging).
Product Description
The products above are a frozen plant-based meat alternative (PBMA) meant to mimic ground meat
(beef, pork sausage, and a combination of both, respectively, as per above for the meatball). The IB
is uncooked and frozen. The MM is pre-cooked (fried) and frozen.
Functional Unit
(study basis)
The function of the product is food for human consumption. The functional unit is one kilogram
(kg) of product manufactured in the US in 2021 and delivered to an end user (retailer or food
service). The functional unit scenarios are discussed in the LCA.
Temporal
Boundary
Data from Impossible Foods are up to date and relevant for the current year. Secondary data from
Ecoinvent v3.6 cut-off databases have a validity range up to 2021. The time period in which the
results should be considered valid is five years from publication date of this study.
Country/Region of
Product
Consumption
The IB and IM products are produced in the Midwest US. Then, they are distributed to the US (IB-
US, IM-US). The functionally equivalent beef, pork and meatball products studied in this work are
produced and distributed in the US.
Version and Date of
Issue
Version 1 – February 7, 2022

Impossible Beef and Meatball
Impossible Foods
WSP Canada
February 7, 2022
Page 8
Glossary of Terms
BB: Beef Burger
GaBi
®
: Life cycle assessment software program
GWP: Global Warming Potential
IB: Impossible Burger
IM: Impossible Meatball
IM1 and 2: Specific recipe formulations of the IM
IS: Impossible Sausage Made from Plants
ISO: International Organization for Standardization
kg: kilogram
LCI: Life Cycle Inventory
LCIA: Life Cycle Impact Assessment
MM: Meat-based Meatball
PBMA: Plant-based meat alternative
PS: Pork Sausage
US: United States

Impossible Beef and Meatball
Impossible Foods
WSP Canada
February 7, 2022
Page 9
1 GOAL OF THE STUDY
Impossible Foods Inc. (Impossible Foods) has developed two new plant-based meat alternatives (PBMA): 1) a new
Impossible Burger (IB) replacing one currently on the market; and 2) the Impossible Meatball Made from Plants
(IM), that aims to mimic the flavour and texture of a meat-based meatball (MM)
2
and has a recipe comprised of
ingredients equivalent to a 50/50 equal split of the IB and the Impossible Sausage Made from Plants (IS, an existing
product).
Impossible Foods has commissioned WSP Canada Inc. (WSP) to calculate four potential impact categories (global
warming potential, freshwater eutrophication potential, land occupation, and water consumption (only
withdrawals)), using the ReCiPe Midpoint (H) v1.12/World Recipe H (RIVM, 2018) method, of the new IB recipe
produced and distributed within the United States (US) and two different versions of the IM produced and
distributed within the US. These impact categories were chosen because they will provide the most business value to
Impossible Foods in their discussions with customers and other clients and are the most salient to animal agricultural
environmental impacts. As a result, the net new contributions of this addendum related to the new IB recipe and the
IM products are as follows:
■ Four specific life cycle potential impact categories are calculated for a new IB product produced in the US and
distributed to the US and compared against a beef burger (BB) produced and distributed in the domestic
markets of the US.
■ Four life cycle potential impact categories of two IM products, manufactured in the US and distributed within
the US and are compared against functionally equivalent MMs (MM1 for retail consumption and MM2
restaurant-type food service) produced in the domestic markets of the US.
The nature of this study is current and the IB and IM are currently being (or will soon be) produced in the US.
The goal of this study is twofold:
■ Determine the absolute values of the above four potential impact categories of the new IB and IM scenarios;
and,
■ Calculate the difference in the above four impact categories between the IB and IM scenarios and their
respective meat-based scenarios.
This study analyzes only the recipes and products used by Impossible Foods for the IB and IM and cannot be
applied to that of other PBMAs or Impossible Foods products. The IB and IM are not functionally equivalent and
not meant to be compared to each other. Only the results for the four impact categories were quantified because
these are the key environmental areas of concern for Impossible Foods; this specific reporting of impact categories is
also consistent with previous PBMA life cycle assessments (LCAs) subject to critical review (Dettling, Tu, Faist,
DelDuce, & Mandlebaum, 2016; Khan, Loyola, Dettling, & Hester, 2019; Heller & Keoleian, 2018) well as other
meat-based LCAs. We recognize this as a limitation to the overall presentation of results but are confident that these
four impact categories are most relevant for food products and there is precedent for disclosure over only these
impact categories.
2
A note that this LCA does not assess the flavour nor texture of the particular products under study.

Impossible Beef and Meatball
Impossible Foods
WSP Canada
February 7, 2022
Page 10
1.1 REASONS FOR CARRYING OUT THE STUDY
This study was conducted to inform internal decision-making and to provide information to the public who are
interested in the potential environmental impacts of Impossible Foods’ products. These four potential impact
categories are of interest to Impossible Foods and their stakeholders. Only the results for the four impact categories
were quantified because these are the key environmental areas of concern for Impossible Foods; this specific
reporting of impact categories is also consistent with previous PBMA LCAs.
Impossible Foods commissioned this study to determine the absolute values of four potential impact categories from
the life cycle of their IB and IM products and compare those values against meat-based benchmarks. Therefore, the
results of this study include absolute and comparative values that are intended to be communicated externally.
1.2 INTENDED APPLICATIONS
This project report is intended to support Impossible Foods in quantifying those four particular impact categories
associated with IB and IM ingredients, production, and distribution and in supporting the comparative assertions of
those four particular impact categories associated with the IB and IM products studied here against their respective
functionally equivalent meat-based products, intended to be disclosed to the public.
1.3 TARGET AUDIENCE
Specific audiences may include the company’s employees, business partners, customers, and the general public. The
study results are prepared for both Impossible Foods’ internal use and to be communicated externally in
conformance with ISO 14040, 14044, and 14062 (ISO, 2018).
1.4 COMPARATIVE ASSERTION FOR PUBLIC DISCLOSURE
This LCA is intended to be compliant with the requirements of ISO 14044 (ISO, 2006), which governs the
requirements for public product-to-product comparisons for LCAs. A comparative assertion is intended to be made
with the products described in this report. A critical review panel was not convened for this report for the following
reasons:
■ the IB recipe used in this report is only slightly different than that examined in Qantis (2019) and Impossible
Foods (2020) and the ingredients and processes have been previously critically reviewed;
■ the beef and pork models that are used in the BB and PS (which make up the MM) have been published and
critically reviewed previously in Qantis (2019) and Impossible Foods (2020), respectively, and are used for this
report.

Impossible Beef and Meatball
Impossible Foods
WSP Canada
February 7, 2022
Page 11
2 SCOPE OF THE STUDY
2.1 FUNCTION
The primary functions of the food products under study are to provide food for consumers to eat.
2.2 FUNCTIONAL UNIT
In order to maintain functional equivalence, the functional unit is one kilogram (kg) of product produced in
2021/2022. There are a number of functionally equivalent scenarios examined here, specifically with respect to
location of production and the destination. These scenarios are detailed in Table 1.
Table 1 – Functionally equivalent scenarios
Functionally equivalent scenario
Impossible Foods product
Meat-based comparator product
Scenario 1
IB-US
BB-US
Scenario 2
IM1-US
MM1-US
Scenario 3
IM2-US
MM2-US
All Impossible Foods products are produced in the US and delivered to the destination in the name (i.e. IB-US is
produced in the US and distributed in the US). For all meat-based comparator products, all products are produced
and distributed in the same location (i.e. BB-US is produced in the US and distributed in the US.
While it is acknowledged that there is not a single measurement on which to set a functional basis for food
consumed due to the multiple reasons people eat food (i.e., for nutrition, to reduce or mitigate hunger, social
gathering, etc., which are not addressed in this study), the Impossible Foods products examined in this study (IB, IS,
IM1 and IM2) were designed to be nutritionally and aesthetically similar to their meat counterparts (BB, PS, MM1
and MM2). Table 2 provides the nutritional data comparison for the Impossible Foods and meat-based products.

Impossible Beef and Meatball
Impossible Foods
WSP Canada
February 7, 2022
Page 12
Table 2 – Nutritional data for IB, BB, IS, PS, IM, MM
Nutrient
Units
IB
100 g
(provided
by
Impossib
le Foods)
BB -
Beef,
ground,
80% lean
meat,
raw
100 g
(USDA,
2018)
IS
100 g
(provided
by
Impossib
le Foods)
PS - pork
sausage,
link/patty,
unprepare
d
100 g
(USDA,
2019)
IM
85 g
(provided by
Impossible
Foods)
MM -
Italian
Style
Meatball
(pork and
beef
blend) per
85g
(Cooked
Perfect,
2021)
Calories
kcal
201.51
254
237
288
164.91
250
Fat
g
11.37
20
16.68
24.80
11.45
19
Saturated fat
g
5.18
7.581
7.19
7.57
3.94
7
Trans fat
g
0
1.18
0
0.101
0.00
unk
Cholesterol
mg
0
71
0
70
0.00
55
Sodium
mg
324.95
66
588.17
739.00
361.43
630
Total
carbohydrate
g
8.17
0
9.07
0.93
5.53
5
Total dietary
fiber
g
4.76
0
1.16
0
0.69
1
Total sugars
g
0.59
0
1.30
0.93
0.40
1
Protein
g
16.65
17.17
12.58
15.39
9.94
14
The products are compared in this LCA on a per-mass basis, as was done in the other LCAs for Impossible Foods
(Impossible Foods, 2020). It is noted, though, that human bodies digest animal proteins differently than vegetables
and thus the specific digestion of the PBMA and the meat-based product may differ; this effect was not examined in
this specific study. An additional limitation to using the per-weight basis to examine the impact categories would be
the fact that some people eat to satiate specific dietary needs, for example, protein intake. An analysis is completed
in Section 5.3.2 to examine the impact categories on a caloric and protein functional-unit basis to understand if the
conclusions change based on a different functional unit.

Impossible Beef and Meatball
Impossible Foods
WSP Canada
February 7, 2022
Page 13
2.3 DESCRIPTIONS OF THE SYSTEMS
As noted above, the Impossible Foods products examined in this study are compared against their respective
functionally equivalent meat alternatives. These systems studied are discussed in this section.
2.3.1 IMPOSSIBLE FOOD PRODUCTS UNDER STUDY – IB AND IM
There are three varieties of Impossible Foods Products under study in this LCA:
■ IB: a PBMA that mimics the taste and texture of a meat-based beef burger patty and is delivered uncooked and
frozen to a retailer;
■ IM1: a PBMA that mimics the taste and texture of a meat-based meatball and has a recipe that is equivalent to
an equal mix of the ingredients of IB and IS, that is delivered pre-cooked and frozen to a distributor, with
packaging that is designed to be sold direct to consumers at retail locations; and,
■ IM2: a PBMA that mimics the taste and texture of a meat-based meatball and has a recipe that is equivalent to
an equal mix of the ingredients of IB and IS, that is delivered pre-cooked and frozen to a distributor, with
packaging that is designed to be sold direct to food service establishments for consumption by consumers in
food service establishments.
IM1 and IM2 have the same ingredient recipe but different packaging. All Impossible Foods products studied are
intended to be included in recipes and meals as a direct and equivalent substitute for their meat-based alternatives.
Again, it is noted that while the IM recipe has ingredient quantities comprised of a 50/50 split of the ingredients in
the IB and IS bulk mix, the IM is produced separately using the raw ingredients and not produced by combining the
IB and IS bulk mixes.
IMPOSSIBLE BURGER – IB
The IB is a PBMA and a direct alternative for its meat counterpart, beef. It is intended to be included in recipes and
meals as direct substitutes for a hamburger patty. This specific IB is an update to a previous recipe that was subject
to a critical review (Qantis, 2019). The primary difference between the previous IB recipe and this IB recipe is the
removal of potato protein. There are slight modifications to the quantities of other ingredients. The IB is to be
compared to its BB functional equivalents only. The IB examined in this study is manufactured in the US and
delivered to retailers in the US (IB-US). The product is a plant-based product comprising grains, legumes, and oils,
and heme, which gives the product its characteristic meat flavor, color, and behavior.
Heme is manufactured through a fermentation and isolation process wherein a genetically modified yeast strain is
produced in culture and expresses leghemoglobin protein, which is then isolated downstream (Khan, Loyola,
Dettling, & Hester, 2019). It is shipped from its manufacturing facilities to the IB bulk product processing facilities
in the Midwest US. There, it is mixed and processed with other plant-based proteins and fats.
The scope of the system studied includes all activities to produce one functional unit of IB, packaged and frozen,
from “cradle to the gate of the retail/wholesale distributor’s truck.” Retail, use, and end-of-life stages are excluded
from the study as these do not differ significantly between the IB and the reference BB products. Overhead services
(i.e., lighting and heating of buildings on site) are considered a non-attributable process (i.e., processes that are not
directly connected to the studied product) but are included because they are typically provided with the total
electricity and fuel consumption data. Other non-attributable processes such as infrastructure and equipment,
Impossible Beef and Meatball
Impossible Foods
WSP Canada
February 7, 2022
Page 14
corporate activities, transport of employees to and from work, etc. are excluded as either the information is not
available or, while it is recognized that these non-attributable processes may have some environmental impacts that
can be quantified using hybrid LCA methodologies, they are not significant contributors of impacts in agricultural
systems and are thus not included. While it is recognized that some new or retrofitted infrastructure may be required
for some processes in this study, it is not possible to allocate all of the impacts to the new activities nor is it possible
to quantify that allocation due to the prospect of other uses during and after the study period. Thus, the infrastructure
processes were excluded from the inventory calculation.
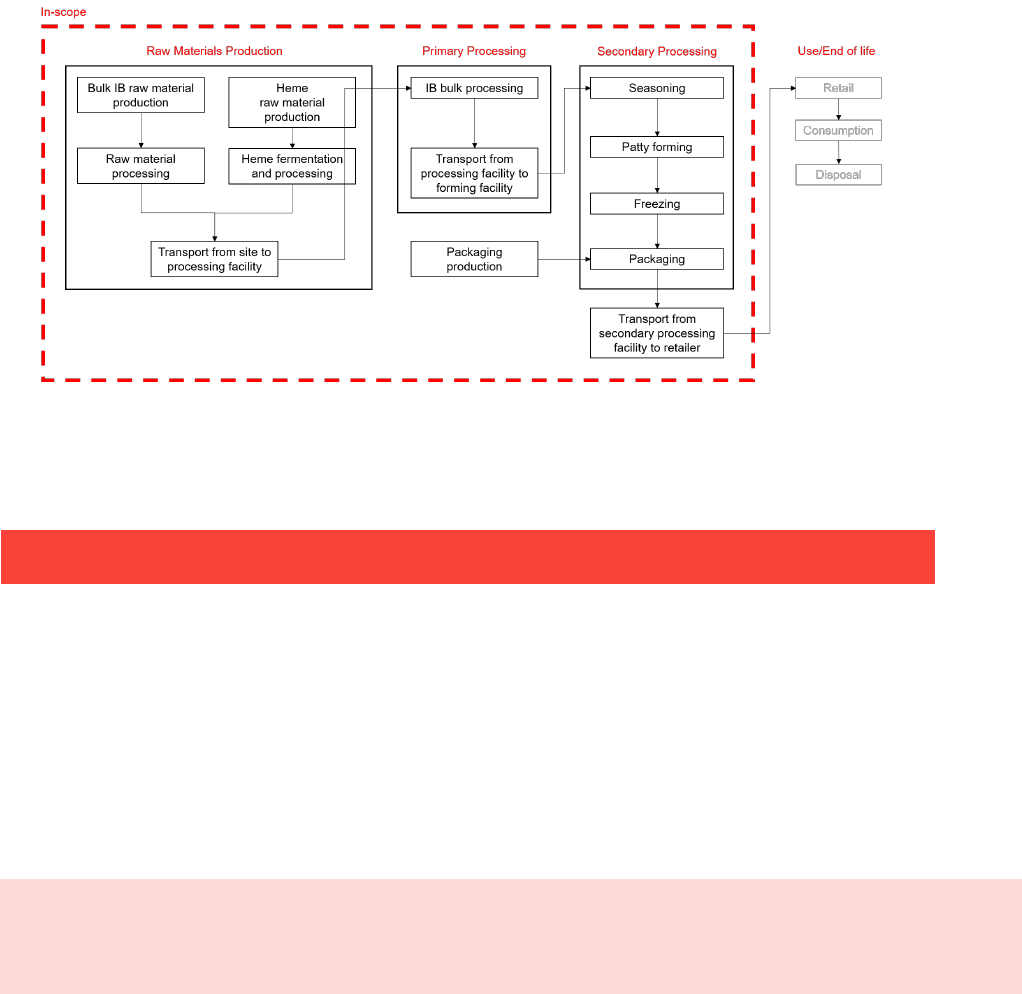
Figure 1 further details the system under study, including raw materials production, the IB primary and secondary
processing stages, packaging and then distribution to retailers. As noted prior, the use and end-of-life stages are not
included here because they are not considered to differ from the BB equivalent.
Figure 1 – Inventory boundary for the IB scenarios (WSP analysis)
The in-scope life cycle stages of the IB, with the specific substages that are relevant to the potential environmental
impact calculations, are described briefly in Table 3.
Table 3 – Boundary descriptions for IB scenarios (WSP Analysis)
Stages
Sub-stages
Description

Impossible Beef and Meatball
Impossible Foods
WSP Canada
February 7, 2022
Page 15
Raw
materials
production
Bulk IB raw material
production
The ingredients in the IB include organic and inorganic chemicals, plant fats,
proteins and carbohydrates. The organic and inorganic chemical production
may require electricity, natural gas and other fossil fuel inputs, as well as
other primary chemical inputs. Crop production to obtain the plant fats,
proteins, and carbohydrates generally includes soil preparation, which
includes applying fertilizer or manure to add nutrients, and tillage and plowing
to remove unwanted weeds or grass. Once the soil is prepared, the seeds
are sowed, followed by irrigation and further application of fertilizers and/or
manure. Once the crops reach maturity, they are harvested using a combine
and dried, packaged and stored until ready for shipment. Impacts from this
substage primarily arise from fossil fuel use to produce fertilizer and run farm
equipment, nitrate and nitrogen emissions from the application of fertilizers
and lime, manure management resulting in leaching causing potential
eutrophication, water withdrawal and return for irrigation and land occupation
for the cropland itself. (Chicken Farmers of Canada, 2018; Dalgaard,
Halberg, & Hermansen, 2007; Putman, 2017).
Heme raw material
production and fermentation
The ingredients in the heme include organic and inorganic chemicals, yeast,
plant fats and carbohydrates. The organic and inorganic chemical production
may require electricity, natural gas and other fossil fuel inputs, as well as
other primary chemical inputs. The agricultural processes require fossil fuel
inputs, including fertilizers and/or manure, as well as water, to grow the
plants. Heme is produced at Impossible Foods’ production facility, through
fermentation, in which a genetically modified yeast strain expresses the
naturally occurring leghemoglobin protein. Following fermentation, the
leghemoglobin protein is isolated and concentrated from the fermentation
media (Khan, Loyola, Dettling, & Hester, 2019).
Transport from site to
processing facility
The raw materials and crops, including heme, for the IB are delivered via
truck to the Impossible Foods production plant in Midwest US from their
typical locations.
Primary
processing
IB bulk processing
The production process for the IB involves first the development of a bulk product.
This includes the mixing of heme and various plant proteins and oil preparations.
There is electricity and water withdrawal in all processing steps, as well as small
amounts of ammonia consumption from refrigeration.
Transport from processing
facility to forming facility
The bulk IB products are then delivered to a forming facility in Midwest US.
Secondary
processing
Packaging
Seasoning, patty forming,
and freezing
After delivery of the bulk IB product to the forming facility, the product is
seasoned and formed into patties for sale. The product is then frozen and
packaged (packaging occurs at the same site as the seasoning and patty
forming).
Packaging
The IB packaging consists of plastic film that is wrapped around the patties.
These wrapped patties are then packed in corrugated cardboard. Packaging
and patty production are co-located, obviating transportation emissions
between these steps (Khan, Loyola, Dettling, & Hester, 2019). Electricity,
natural gas, and water withdrawal are fully considered in the production
process.
Impossible Beef and Meatball
Impossible Foods
WSP Canada
February 7, 2022
Page 16
Distribution
Transport from secondary
processing to retailer
The packaged IB is then delivered to retailers, primarily grocery stores and/or
restaurants throughout the US via trucks. For Australia and/or New Zealand,
trucks deliver the products to the Los Angeles port and ships deliver them to
Sydney, where additional truck travel is used to deliver the products to
distributors and then onwards.
MEATBALL MADE FROM PLANTS – IM
The IM is intended to be a direct substitute for a meat-based meatball to be used in recipes and other instances where
a meatball is consumed. The boundary of the system studied includes all activities necessary to produce the IM1 and
IM2 from cradle-to-gate of the initial purchaser of finished product, whether a distributor, food service operator, or
traditional retailer, prior to purchase by an end consumer. Retail, use, and end-of-life stages are excluded from the
study as these do not differ significantly between the IM and the reference MM products. Overhead services (i.e.,
lighting and heating of buildings on site) are considered a non-attributable process (i.e., processes that are not
directly connected to the studied product) but are included because they are typically provided with the total
electricity and fuel consumption data. Other non-attributable processes such as infrastructure and equipment,
corporate activities, transport of employees to and from work, etc. are excluded as either the information is not
available or, while it is recognized that these non-attributable processes may have some environmental impacts that
can be quantified using hybrid LCA methodologies, they are not in-scope for this type of LCA.
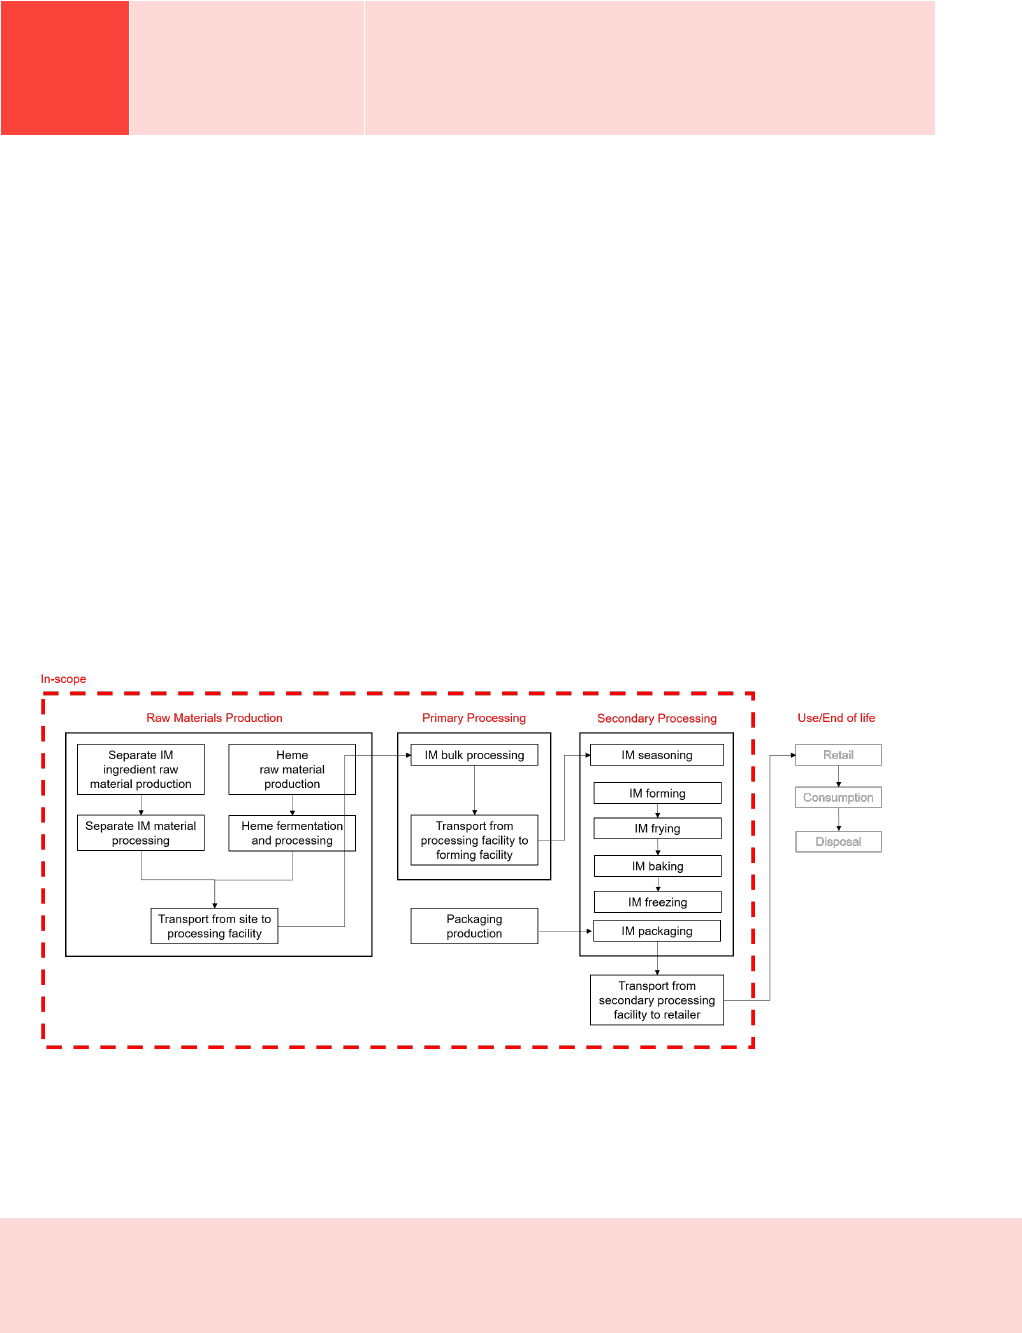
Figure 2 further details the system under study, including raw materials production, the IM primary and secondary
processing stages, packaging and then distribution to retailers. As noted prior, the use and end-of-life stages are not
included here because they are not considered to differ between the IM and MM processes.
Figure 2 – Inventory boundary for the IM scenarios (WSP analysis)
The in-scope life cycle stages of the IM, with the specific sub-stages that are relevant to the potential environmental
impact calculations, are described briefly in Table 4.

Impossible Beef and Meatball
Impossible Foods
WSP Canada
February 7, 2022
Page 17
Table 4 – Boundary descriptions for IM scenarios (WSP Analysis)
Stages
Sub stages
Description
Raw materials
production
Bulk IM raw material
production
The ingredients in the IM include organic and inorganic compounds,
plant fats, proteins and carbohydrates. The organic and inorganic
chemical production may require electricity, natural gas and other
fossil fuel inputs, as well as other primary chemical inputs. The
agricultural processes require fossil fuel inputs, including fertilizers
and/or manure, as well as water, to grow the plants. The recipe of the
IM is meant to be a 50/50 split of the IB and IS recipes, but the IM is
produced using a stand-alone process.
Heme Raw material
production, processing and
heme production
The ingredients used to produce heme in fermentation include yeast
substrates (organic and inorganic chemicals and carbohydrates) and
the yeast itself. The organic and inorganic chemical production may
require electricity, natural gas and other fossil fuel inputs, as well as
other primary chemical inputs. The agricultural processes to produce
the carbohydrate substrate requires fossil fuel inputs, including
fertilizers and/or manure, as well as water, to grow the plants. Heme
is produced through fermentation, in which a genetically modified
yeast strain expresses the naturally occurring leghemoglobin protein.
Following fermentation, the leghemoglobin protein is isolated and
concentrated from the fermentation media (Impossible Foods, 2020).
Transport from site to
processing facility
The raw materials and crops for IM are delivered via truck to the IM
production plant in the Midwest US from regions that produce and distribute
large volumes of the specific ingredients (exact locations not provided
publicly for proprietary reasons).
Processing
IM bulk production
The bulk formation process for the IM involves mixing the ingredients.
There is electricity and water withdrawal in all processing steps, as well as
small amounts of ammonia consumption from refrigeration. The bulk IM
product is then delivered to a finishing and cooking facility in another
Midwest US location using a refrigerated truck.
IM forming, frying, baking,
freezing
After delivery of the bulk IM product to the finishing and cooking facility, the
product is formed, fried, baked, and then packaged. The frying stage uses
soybean oil as a cooking oil. The frying and baking stages use natural gas
and electricity to heat. This is the same finishing and cooking step as the
MM to ensure comparability. This is also borne out in practice where meat-
based and plant-based meatballs are prepared and made using the same
processes in the same facilities.
IM packaging
The IM packaging consists of a plastic bag that contains the meatballs.
These bags are then packed in corrugated cardboard. Packaging and
meatball production are co-located. No other packaging is used. The
amount of the plastic and the corrugated cardboard used for IM1 and IM2
differs and is discussed later in this document.

Impossible Beef and Meatball
Impossible Foods
WSP Canada
February 7, 2022
Page 18
Distribution to
retailer
Transport from secondary
processing to retail (IM1) and
food service (IM2)
The packaged IM products are then distributed via truck throughout the US
for IM1-US, IM2-US.
2.3.2 MEAT PRODUCTS UNDER STUDY – BB, PS, AND MM
BEEF BURGER - BB
Cattle production involves the process of feeding and rearing in different stages before going to slaughter. The
model includes cow-calf operations lasting 6 months on pasture, 3 months of backgrounding, and 7 months of
feedlot finishing. The backgrounding diet was based on hay and distiller’s grain, while the finishing diet was
primarily grain-based. This represents typical farm management practices from Nebraska, which is one of the largest
beef feedlots producing states in the United States. There is also some beef production that comes from dairy
operations, estimated to be 22%: 7% from culled dairy cows and 15% from male calves.
The cattle production system for the supply of beef used in this study is described in detail in Qantis (2019) and
provides more information related to the type of system, representativeness, and the inputs required to describe and
model a US-based beef production system. In Qantis (2019), farm data is reproduced from Asem-Hiamblie et al.
(2018) from the US Meat Animal Research Center (USMARC). In Qantis (2019), the dairy operations
environmental impacts were modeled using World Food LCA Databases (WFLDB). The model used in Qantis
(2019) is leveraged in entirety here as it still represents the best available fulsome dataset to re-produce beef
production for this particular purpose. It is recognized that some foreground and background processes may be of
lower data quality, as indicated by the authors, the sensitivity analyses of these processes in Qantis (2019)
demonstrate no material impact to the results.
It is noted by the authors that this is not necessarily representative of all beef production the US; however it
represents a significant proportion of the crop, feed, and animal management practices of the US.
After slaughter, the beef is ground into ground beef and seasoned and formed into patties in order to be functionally
equivalent to the IB. The final BB product is meant to mimic the IB, to be sold frozen and in the form of a beef
patty.
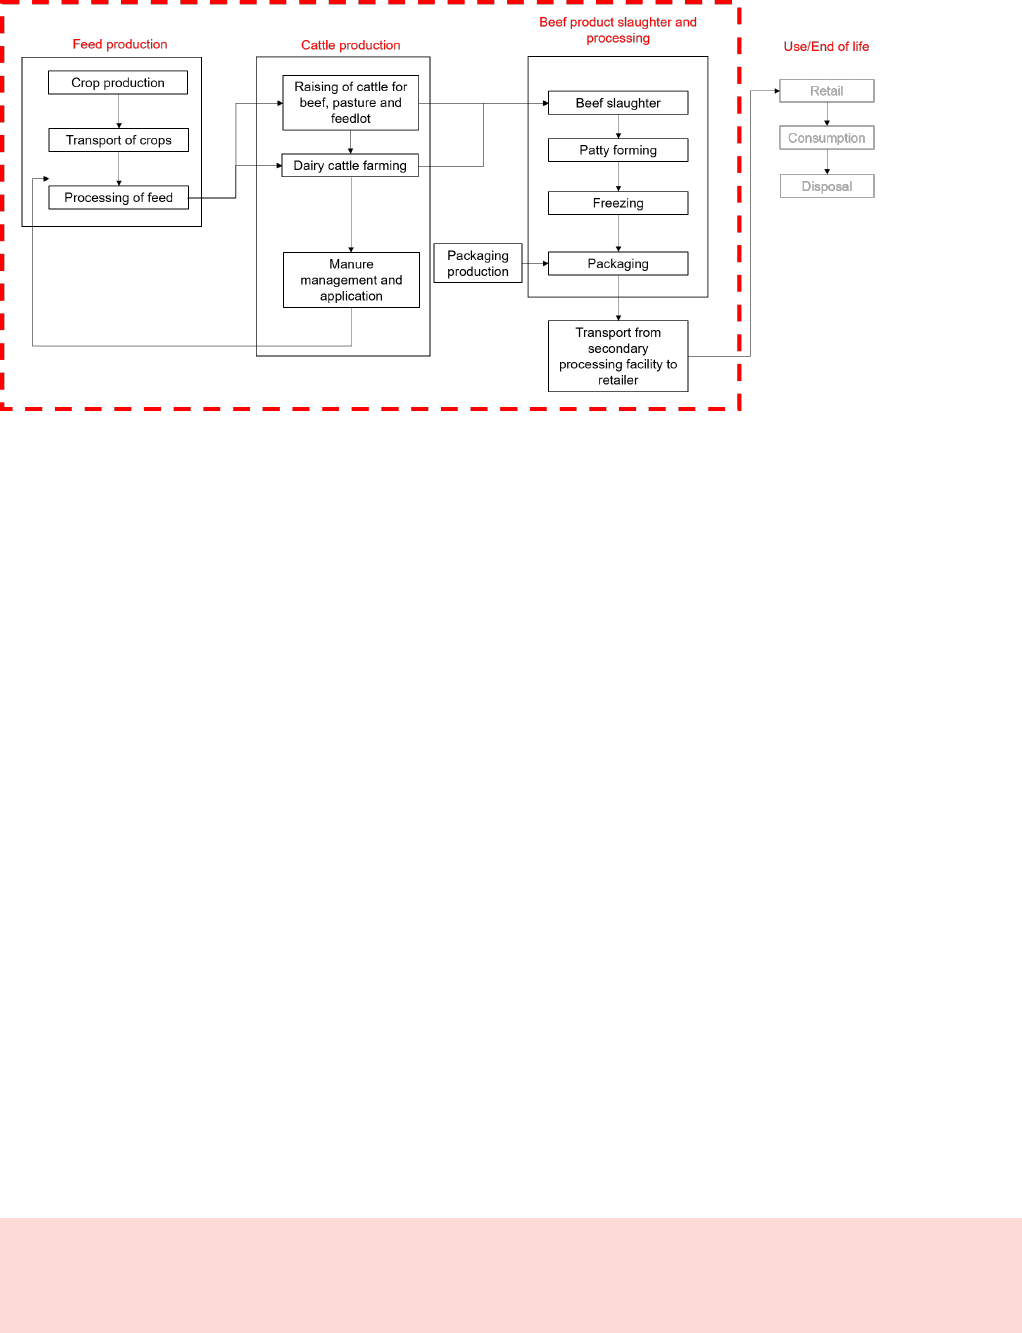
Figure 3 further details the system under study, including feed production, cattle production, dairy cow input to
slaughter, beef processing, slaughter, forming, freezing, packaging, and then distribution to retailers. As noted prior,
the use and end-of-life stages are not included here because they are not considered to differ from the IB equivalent.
Impossible Beef and Meatball
Impossible Foods
WSP Canada
February 7, 2022
Page 19
Figure 3 – Inventory boundary for BB scenarios (WSP analysis)
As noted above, overhead services are considered non-attributable but are included because they are typically
included in the total electricity and fuel consumption data. Other non-attributable processes such as infrastructure
and equipment, corporate activities, transport of employees to and from work, etc. are excluded.
GROUND PORK - PS
The PS system, examined here only because the MM is comprised equally of BB and PS, is detailed in Impossible
Foods (2020) which provides more detailed information and the results of PS delivered in the US.
MEAT-BASED MEATBALL - MM
Similar to the system boundaries for IM, the full boundary for the MM includes the production systems for both
conventional beef and pork. Figure 6 further details the system under study. The MM is comprised of equal amounts
ground beef and pork. In the MM-US scenarios, ground beef and pork are produced in the US locally, respectively,
for local processing (and cooking) into MM and then consumption. The products are meant to mimic the IM, to be
sold pre-cooked and frozen and in the form of a meatball. There are two varieties of the MM under study in this
LCA:
■ MM1: a meat-based meatball is delivered pre-cooked and frozen to a distributor for a retail customer; and,
■ MM2: a meat-based meatball is delivered pre-cooked and frozen to a distributor for food service establishments.
Consistent with the IM1 and IM2, the differences in the MM1 and MM2 are related to the quantity of packaging.
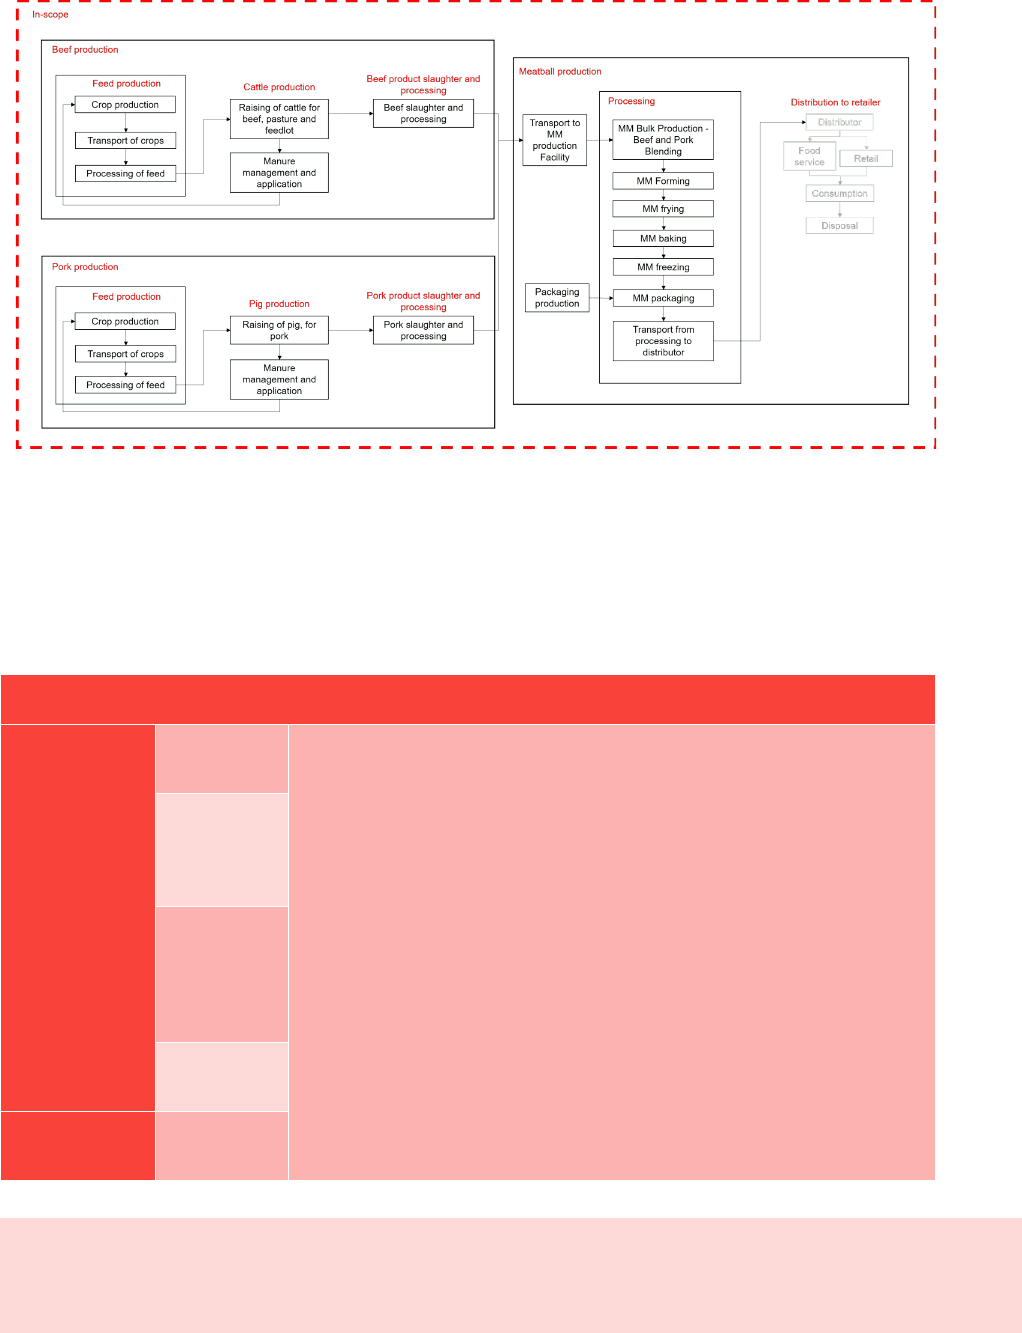
Figure 4 further details the system under study, including feed production, cattle and pig production (i.e., raising of
the animals and slaughter), processing of both the beef and pork, production of the meatball (i.e., blending an equal
composite of beef and pork), forming, and frying, baking and freezing (meant to produce functional equivalence to
the IM varieties), and then distribution to retailer/food service. As noted prior, the use and end-of-life stages are not
included here because they are not considered to differ from the IM equivalent.
Impossible Beef and Meatball
Impossible Foods
WSP Canada
February 7, 2022
Page 20
Figure 4 – Inventory boundary for MM scenarios (WSP analysis)
Also as noted above, overhead services and other non-attributable are not specifically examined but are included
because they are typically included in the total electricity and fuel consumption data.
Based on WSP analysis, the in-scope life cycle stages of the MM, with the specific sub-stages that are relevant to
environmental impact calculations, are described briefly in Table 5.
Table 5 – Boundary descriptions for MM scenarios (WSP analysis)
Stages
Sub-stages
Description
Cattle and pig
– Feed
production
Crop
production
See Qantis (2019) and Impossible Foods (2020) for descriptions related to cattle and
pig feed, production, and slaughter processes, respectively.
Transport of
crops to
processing
plant
Processing of
feed (crushing,
screening,
milling and
concentration)
Transport of
crops to farm
Cattle
production

Impossible Beef and Meatball
Impossible Foods
WSP Canada
February 7, 2022
Page 21
Stages
Sub-stages
Description
Cattle
production and
pig production
Pig production
Manure
management
and application
(cattle)
Manure
management
and application
(pig)
Beef product
slaughter/Pork
product
slaughter
Slaughtering
Meatball
production
Transport to
MM processing
facility
The ground beef and pork are delivered via truck to the meatball production plant, with
an assumed distance of 500 km from the slaughterhouses for both.
MM bulk
production –
beef and pork
blending
After the slaughter and processing, the fresh meat is ground and blended (with an equal
blend of ground beef and ground pork), seasoned and formed as necessary, identically
to the IM.
Forming,
frying, baking,
freezing
The secondary processing stage includes the finishing and cooking activities. The
formed meatballs are fried, baked, frozen, and packaged. The frying stage uses
soybean oil as a cooking oil. The frying and baking stage uses natural gas and
electricity to heat. Secondary processing is assumed to occur in the same facility as the
primary processing facility. This is the same finishing and cooking step as the IM to
ensure comparability.
Packaging
MM Packaging
Finished meatballs are packaged for sale using similar packaging to that of the IM1 and
IM2: plastic film and corrugated cardboard for retail and food service.
Transportation
to retailer
Transport from
secondary
processing to
retail (MM1)
and food
service (MM2)
The packaged IM products are then distributed via truck throughout the US for IM1-US,
IM2-US.
2.4 CUT-OFF APPROACH
It is noted that for all scenarios, a mass-based cut-off criterion for the foreground processes was used, where those
cumulative inputs that comprised less than 0.5% of the total mass of the final products were not included in the

Impossible Beef and Meatball
Impossible Foods
WSP Canada
February 7, 2022
Page 22
quantification of the impact categories. This is consistent with the previous LCA studies for Impossible Foods
(Impossible Foods, 2020). For the background processes, the Ecoinvent 3.6 cut-off database was used (the previous
models in Qantis (2019) and Impossible Foods (2020) which have different processes between this database and the
database used in that model were updated using more recent factors). The authors recognize that this may introduce
some issues related to consistency among the cut-off approaches, but that primarily, the foreground processes where
the 0.5% cut off was used were more relevant to the overall magnitude of impacts.
For processes that were above that threshold where no modelled processes were available, proxies were used.
2.5 INVENTORY DATE AND VERSION
This is the first version of the inventory comparing the new recipe for IB, IM1 and IM2 scenarios against BB, MM1
and MM2, respectively. The production data for the systems examined are based on the most recent design and
production data provided by Impossible Foods. For the BB, PS, and MM, the inventories are based on representative
industrial, market and literature data, where available.
2.6 TIME PERIOD AND GEOGRAPHIES OF THE INVENTORIES
This assessment is intended to be representative of the production of the Impossible Foods products studied and their
meat counterparts in the US during the year that the study is conducted (2021). Data and assumptions are intended to
reflect current equipment, processes, and market conditions. Data has been selected where possible to best match
these geographic and temporal conditions, and the data quality of significant inputs is evaluated using Table 11.
Information sources for this report were evaluated as relevant and considered to represent the best available data and
conditions in the industry. While certain processes may generate emissions over a longer period than the current
year, all data has been selected to represent current conditions, where practical.
For the global warming potential indicator, the 100-year time horizon global warming potentials (GWPs) without
carbon feedback from AR5 are utilized (IPCC, 2014). The biogenic methane GWP was used.
2.7 LAND USE CHANGE IMPACTS
Direct land-use changes from the use of crop lands to produce PBMA ingredients and crops for animal (beef and
pork) feed production may be significant (Reckmann, Blank, Traulsen, & Krieter, 2016). The quantification of GHG
emissions for specific ingredients is sourced from the Ecoinvent v3.6 cut-off database (Wernet, et al., 2016) and all
crop-based ingredients include direct land occupation change impacts in their processes. Regardless, direct land-use
change emissions may differ depending on the previous land occupation, the type of crop and the region in which
the crops are grown.
2.8 ALLOCATION
Allocation or system expansion may be required when a single process has multiple valuable products as outputs
(i.e., the refining of crude oil into various petroleum co-products). In these situations, inputs and emissions for the
whole process need to be allocated to the various co-products following appropriate methods.

Impossible Beef and Meatball
Impossible Foods
WSP Canada
February 7, 2022
Page 23
For all existing Ecoinvent v3.6 processes, no modifications to the allocations embedded were performed. For
processes that were modified, existing allocations were maintained. For oils, such as sunflower and coconut,
allocation was conducted on an economic basis and this approach was applied from Impossible Foods (2020) in
order to maintain consistency.
At a cattle and pig farm, prior to slaughter, livestock are the main product and manure is produced as a co-product.
In such production, it is not possible to allocate precisely what feed use, land occupation or emissions are related to
raising the cattle and pigs, or the manure and therefore system expansion must be used. The manure production
replaces fertilizer on the market, resulting in avoided production of fertilizer (that was used in the Ecoinvent
processes), and thereby a negative contribution to the potential environmental impact from the life cycle of the
livestock. In this study, manure that was produced in the cattle and pig production process was either left on pasture
or applied to the crop production processes. The reduced fertilizer requirements as a result were modelled using the
manure application process as detailed in this work. More information on these processes for cattle and pig are
provided in Qantis (2019) and Impossible Foods (2020), respectively.
For the beef and pork products in this study, an economic allocation procedure was used because the products have
such widely different values in the market. The mass and economic allocation used in this study for cattle and pig
are provided in Qantis (2019) and Impossible Foods (2020), respectively.
2.9 DATA QUALITY REQUIREMENTS
The life cycle data used in this LCA relies upon the primary data from Impossible Foods and secondary data sources
such as the Ecoinvent v3.6 database where appropriate.
Data quality for each process in the inventory boundary that contributed 5% or more of the potential environmental
impact were evaluated and the efforts to improve data quality are reported later in the paper, where necessary. The
data was assessed using the data quality indicators described in Table 6 (Weidema, et al., 2013).
Table 6 – Data quality indicators
Data quality indicators
Description
Reliability
The degree to which the sources, data collection methods and verification procedures
used to obtain the data are dependable.
Completeness
The degree to which the data is statistically representative of the relevant activity.
Completeness depends on many factors including the percentage of sites for which data
is used out of the total number of relevant sites, coverage of seasonal and other
fluctuations in data, etc.
Temporal representativeness
The degree to which the data reflects the actual time (e.g., year) or age of the activity.
Geographical correlation
The degree to which the data reflects the actual geographic location of the activity (e.g.,
country or site).
Technological representativeness
The degree to which the data reflects the actual technologies used.

Impossible Beef and Meatball
Impossible Foods
WSP Canada
February 7, 2022
Page 24
The qualitative evaluation for each data quality indicator will be based on the scoring scheme presented in Table 7
(Weidema, et al., 2013).
Table 7 - Pedigree scoring quality criteria
Score
Technology
Temporal
Geography
Completeness
Reliability
Very good
Data for the same
technology
Data with less
than 3 years of
difference
Data from the
same area
Data from all relevant
sites over an
adequate time period
Verified data based
on measurements
Good
Data for a similar
but different
technology
Data with less
than 6 years of
difference
Average data from
larger area in
which the area
under study is
included
Data from more than
50% of sites over an
adequate time period
Verified data partly
based on
assumptions or non-
verified data based
on measurements
Fair
Data for a different
technology
Data with less
than 10 years of
difference
Data from an area
with similar
production
conditions
Data from less than
50% of sites over an
adequate time period
or from more than
50% of sites for a
short time period
Non-verified data
partly based on
assumptions or a
qualified estimate
Poor
Data from
processes and
materials under
study but from
different
enterprises
Data with less
than 15 years of
difference
Data from area
with slightly similar
production
conditions
Data from only one
site relevant for the
market or some sites
but from shorter
periods
Qualified estimate
Very poor
Data for an
unknown
technology
Data with more
than 15 years or
unknown
difference to the
time period of the
data set
Data from an area
that is unknown or
distinctly different
area
Data from a small
number of sites and
from shorter periods
Non-qualified
estimate

Impossible Beef and Meatball
Impossible Foods
WSP Canada
February 7, 2022
Page 25
3 LIFE CYCLE INVENTORY ANALYSIS
3.1 DATA SOURCES FOR IM
Depending on its source, data can either be classified as primary or secondary:
■ Primary data is specific to the processes included in the product’s life cycle boundary. It can be collected in the
reporting company or from its suppliers; and
■ Secondary data is not specific to the product under study and is taken from commercial databases, industry
reports, literature, etc.
When modeling the two product systems under study, the Ecoinvent v3.6 cut-off (Wernet, et al., 2016) database was
used as the sole source for background data, with infrastructure processes excluded as noted above. There were
cases where an Agri-footprint v1.0 foreground process (Blonk Agri-footprint BV, 2014) was used (economical
allocation), as was the case in previous Impossible Foods LCAs (Impossible Foods, 2020) but the background
processes were replaced with Ecoinvent v3.6 processes; whenever possible, appropriate country inventories were
selected. When neither country-specific nor region-specific inventories were available, global or “RoW” inventories
were used. For agricultural processes, local and recent crop yields were used to update inventories and make them
more reflective of local condition (see Impossible Foods (2020)). Global inventories are typically average datasets
of all the country- or region-specific datasets available in the database for the specific product/process. This is
assumed to be a reasonable alternative in the absence of country- or region-specific datasets (Khan, Loyola,
Dettling, & Hester, 2019).
3.1.1 RAW MATERIALS PRODUCTION – IB AND IM
Primary data for the stages controlled by Impossible Foods, such as the production of the raw materials, heme, and
the forming, seasoning, and cooking (where applicable), for all Impossible Foods products examined in this study
were provided by Impossible Foods and their suppliers/manufacturers. WSP has not audited the data in any way and
relies on Impossible Foods to provide accurate data. For processes not controlled by Impossible Foods, such as
transportation, feed production and distribution, secondary data was used from commercial databases and literature.
Appendix A contains the processes used to model IB and IM.
IMPOSSIBLE BURGER - IB
The raw materials that constitute the IB are divided into two primary parts: the bulk IB mix and the ingredients to
produce heme. A list of the ingredients and the associated modelled processes and databases for the IB is provided
in Table 8. While only the broad categories of ingredients are shown here to ensure the privacy of proprietary
information, the actual ingredients, or equivalent proxies, were used to model the IB in the GaBi software.
A fixed distance of 1,500 km by diesel truck was used for each US-based product transported to the Midwest US
production facility. We note that this distance may be conservative as some crops would be produced closer to
Midwest US than 1,500 km, but it is also assumed that this transport distance is not a significant contributor to the
overall impact categories, and this is borne out in previous LCAs (Impossible Foods, 2020). Any ingredients that
originated outside North America were modeled using a combination of truck and ocean transport using actual road

Impossible Beef and Meatball
Impossible Foods
WSP Canada
February 7, 2022
Page 26
and sea distances, respectively. Specific ports were determined based on the dominant port cities in the areas where
Impossible Foods sources its ingredients.
The ingredients above made from crops were produced using conventional methods (i.e. non-organic) that consume
fertilizers, fossil fuels, water, etc. as is typical for crop production in the region of production. It is noted that yields
for the relevant crops (i.e. corn, soybean, etc.) were modified according to Impossible Foods (2020).
IMPOSSIBLE MEATBALL - IM
As mentioned prior, the IM is comprised of equal mass IB and IS; thus, the raw materials production for the IM is
contingent on the raw materials production modeled for IB and IS.
Table 8 – List of ingredients for heme, IB and IM
Ingredient
Modelled dataset*
Database
Water
Tap water production,
conventional treatment {US} -
Agg
Ecoinvent v3.6
Yeast Extract
Yeast {EU-28} - Agg
Sphera**
Dextrose
Sugarcane production {ROW}
– Agg; Proxy
Ecoinvent v3.6
Soy protein
concentrate
Used Agri-footprint v1.0
dataset for foreground process
but replaced all background
processes with Ecoinvent v3.6
processes (Blonk Agri-footprint
BV, 2014)
Ecoinvent v3.6
See Impossible Foods
(2020) for process
Coconut Oil
Used Agri-footprint v1.0
dataset for foreground process
but replaced all background
processes with Ecoinvent v3.6
processes (Blonk Agri-footprint
BV, 2014)
Ecoinvent v3.6
See Impossible Foods
(2020) for processes and
updated crop yields

Impossible Beef and Meatball
Impossible Foods
WSP Canada
February 7, 2022
Page 27
Sunflower oil
Used Agri-footprint v1.0
dataset for foreground process
but replaced all background
processes with Ecoinvent v3.6
processes (Blonk Agri-footprint
BV, 2014)
Ecoinvent v3.6
See Impossible Foods
(2020) for processes and
updated crop yields
Starch
Potato starch production
{ROW} – Agg; Proxy
Ecoinvent v3.6
Methylcellulose
Methylcellulose {DE} - Agg
Sphera**
Salt
Sodium chloride production,
powder {ROW} - Agg
Ecoinvent v3.6
Soybean oil
Soybean oil {US}, production
Ecoinvent v3.6
*All processes were default allocation. **A GaBi-sourced process for methylcellulose was used because the only similar process in Ecoinvent
was for carboxy methylcellulose from synthetic/meat-based sources.
3.1.2 PROCESSING – IB AND IM
IMPOSSIBLE BURGER
The respective ingredients for the IB undergo a processing and freezing stage, where the ingredients are combined,
mixed, formed and frozen in Midwest US.
The data for this stage were collected by the manufacturer and is based on total facility usage normalized by the
mass of functional unit produced. As noted prior, WSP has not audited this data and relies on Impossible Foods and
their suppliers to ensure accuracy of provided data. The electricity grid for Midwest US was modelled using
subregion data based on eGRID2019 data (US EPA, 2021) using a modified Ecoinvent v3.6 process.
It is assumed that there is a loss of 5% by weight from the mixing and forming stage of the IB based on past
experience of food lost in the process. Thus, the process was modelled with 5% of the output going to landfill. This
is a conservative assumption as all efforts are made to conserve the product mass. Regardless, this approach was
also used by Dettling, Tu, Faist, DelDuce, & Mandlebaum (2016) and in previous Impossible Foods LCAs
(Impossible Foods, 2020).
IMPOSSIBLE MEATBALL
To produce the IM, the ingredients are blended into a bulk material in Midwest US.
The data for this stage were collected by the manufacturer and is based on total facility usage normalized by the
mass of functional unit produced. As noted prior, WSP has not audited this data and relies on Impossible Foods and
their suppliers to ensure accuracy of provided data. The electricity grid for Midwest US was modelled using the

Impossible Beef and Meatball
Impossible Foods
WSP Canada
February 7, 2022
Page 28
utility provider subregion data based on eGRID2019 data (US EPA, 2021) using a modified Ecoinvent v3.6 process.
The same assumption of a 5% loss by weight in the forming stage also applies for the IM system.
The IM base meat is transported to another facility in another Midwest US location, where it undergoes finishing
(i.e., seasoning), forming, baking, and frying stages in the area which includes the use of conveyer belts, mixers,
ovens, frying vats, motors, refrigerators, and other equipment to cook the meatball and prepare the meatball for
distribution and sale.
The data for this stage were collected by the manufacturer and is based on total facility usage normalized by the
mass of functional unit produced by Impossible Foods. As noted prior, WSP has not audited this data and relies on
Impossible Foods and their suppliers to ensure accuracy of provided data. The electricity grid for this other Midwest
US location was modelled using the 2021 energy mix data provided by local utility provider, using a modified
Ecoinvent v3.6 process. It is assumed, as well, there is a loss of 5% by weight of the IM from this stage.
3.1.3 PACKAGING – IB AND IM
The IB, IM1 and IM2 are packed using a flexible plastic pouch, suitable for use for frozen food applications, and
this packaging is marketed to retail locations and restaurants using corrugated cardboard secondary packaging. The
amount of plastic and corrugated cardboard used for the packaging used in the products studied can be found in
Table 9.
Table 9 – Packaging amounts, per kg of product
Packaging Type
IB
IM1
IM2
Plastic Pouch (g)
2.3
0.4
0.908
Cardboard (g)
10
3.1
0.00454
3.1.4 TRANSPORTATION TO DISTRIBUTOR – IB AND IM
For IB, IM1 and IM2 going to US distributors (IB-US, IM1-US, IM2-US), a fixed distance of 1,500 km of freezer
truck travel was used to model the distribution to the distributor gate.
It is noted that the in-scope life cycle stages stop at the gate of the distributor; they do not include any activity
beyond the gate of the distributor as it expected to be equivalent between the Impossible Foods products and their
functionally equivalent meat-based scenarios, as they are expected to be equivalent.
3.2 DATA SOURCES FOR MEAT-BASED PRODUCTS
For cattle (to make the BB and MM) and pig (to make the MM) production and slaughter processes to make ground
beef and ground pig, respectively, the models used in the previous LCAs for Impossible Foods (Qantis (2019) which
compared the previous recipe for the Impossible burger against BB-US and Impossible Foods (2020) which
compared a current IS recipe against PS-US) were used directly. Both studies were subject to critical review and are

Impossible Beef and Meatball
Impossible Foods
WSP Canada
February 7, 2022
Page 29
used in their entirety here. As such, those studies provide more specific data source information on cattle and pig
feed production, cattle and pig production (rearing), manure management and application processes, and cattle and
pig slaughterhouse activities to produce ground beef and ground pork, respectively. These are not discussed here for
brevity. What follows is a description of how the ground beef and ground pork from those processes are used in the
BB and MM products to ensure comparability with the IB and IM products.
3.2.1 PROCESSING – BB AND MM
BEEF BURGER - BB
At a facility after the slaughterhouse, for the BB (not for the MM), the fresh ground beef is processed and formed
into BB patties, using the same data from the primary processing stage for the IB. For this stage in the BB product
life cycle, the data for energy, water, refrigerant, and waste to season, form, and freeze and package the IB was used
due to a lack of available data for a BB (the data are available in Table 57). A loss of 5% by weight of the fresh meat
from this stage is assumed, and that the specific heating capacities of the IB and BB are equivalent.
MEAT-BASED MEATBALL - MM
The MM is comprised of equal parts ground beef and ground pork with seasonings (to be comparable to the IM).
The bulk processing, seasoning, and forming activities used for the IM1 and IM2 are used for the MM1 and MM2,
respectively. Although the IM and the MM processing steps occur in different facilities, it is assumed that the energy
consumption and the required inputs are identical. The processes used in processing, seasoning, and forming, as well
as cooking are all identical and allocated based on mass of production for the facility (see Table 67).
3.2.2 COOKING AND FINISHING – MM ONLY
The BB is shipped frozen and uncooked.
The frying, baking, freezing, packaging, and transport activities used for the IM1 and IM2 are used for the MM1 and
MM2, respectively.
3.2.3 MM – TRANSPORTATION TO DISTRIBUTOR
For BB, MM1 and MM2 going to US retailers, a fixed distance of 1,500 km of frozen truck travel was used to model
the distribution to typical US retailers.
It is noted that the in-scope life cycle stages stop at the gate of the distributor; they do not include any activity at the
retailer as it is expected to be equivalent between the PBMA and meat-based scenarios.

Impossible Beef and Meatball
Impossible Foods
WSP Canada
February 7, 2022
Page 30
4 LIFE CYCLE IMPACT ASSESSMENT
4.1 LCIA PROCEDURES AND CALCULATIONS
LCIA was carried out using characterization factors programmed into GaBi
®
. ReCiPe Midpoint (H) v1.12/World
Recipe H (RIVM, 2018) was used to quantify global warming potential (GWP), freshwater eutrophication potential,
land occupation, and water consumption.
4.2 LCIA RESULTS
The GaBi
®
software calculates LCIA results in its balance function and computes the environmental impact results
according to pre-defined characterization methods in the selected LCIA methodology.
4.2.1 COMPARATIVE SCENARIOS
The impact category results are provided in Table 10, on a per kg of food delivered to the retailer/food service
operator basis, for IB-US, IM1-US and IM2-US, and their respective meat counterparts BB-US, MM1-US and
MM2-US.
Table 10 – All scenario indicator category results, per functional unit
Impact categories
Scenario
Global
warming
potential (kg
CO
2
e)
Freshwater
eutrophication
potential (g P-eq)
Land
occupati
on
(annual
m
2
crop
eq)
Water consumption (m
3
)
IB - US
2.94
0.91
2.52
0.07
BB - US
31.11
5.95
62.04
0.86
Difference
-91%
-85%
-96%
-92%
IM1 - US
3.73
0.98
4.52
0.10
MM1 - US
24.19
5.51
37.06
0.79
Difference
-85%
-82%
-88%
-87%
IM2 - US
3.73
0.98
4.52
0.10

Impossible Beef and Meatball
Impossible Foods
WSP Canada
February 7, 2022
Page 31
MM2 - US
24.19
5.51
37.06
0.79
Difference
-85%
-82%
-88%
-87%
The impact category results for the Impossible Foods scenarios studied are lower than those of scenarios of their
meat analogs for the four selected impact categories. Note that although the results for IM1-US and IM2-US (and
subsequently MM1-US and MM2-US) show as identical in Table 10, this is only because the numbers are rounded
to two decimal places. The difference in packaging results in differences that are only seen when going to more
decimal places.
IB AND BB
■ The GWP result for the IB is 91% lower than that of the BB scenario because of the enteric fermentation and
manure management emissions for the BB.
■ The freshwater eutrophication potential result for the IB is 85% lower than that of the BB scenarios because of
the additional crop inputs and manure application for the BB.
■ The land occupation result for the IB is 96% lower than that of the BB scenarios because of the additional crop
inputs; the land use result for both IB and BB is primarily due to crop production. The primary contributor for
the IB is heme and coconut oil.
■ The water consumption result for the IB is 92% lower than that of the BB scenarios primarily because of crops
used in feed production.
IM AND MM
■ The GWP result for the IM is 85% lower than that of the MM scenarios because of the enteric fermentation and
manure management emissions for the BB and PS, as noted prior. The GWP results for the IM1-US and IM2-
US scenarios do not differ significantly because the only difference in the life cycle stages is packaging.
■ The freshwater eutrophication potential result for the IM is 82% lower than that of the MM scenarios because of
the additional crop inputs and manure application for the BB and PS, as noted prior.
■ The land occupation result for the IM is 88% lower than that of the MM scenarios because of the additional
crop inputs for the BB and PS.
■ The water consumption result for the IM is 87% lower than that of the MM scenarios primarily because of crops
used in feed production.
4.2.2CONTRIBUTION ANALYSIS
The stage-specific contribution to the overall potential environmental impact categories for the IB-US and BB-US
(Table 11), IM1-US and MM1-US (Table 12), and the IM2-US and MM2-US (Table 13), are presented below.

Impossible Beef and Meatball
Impossible Foods
WSP Canada
February 7, 2022
Page 32
Table 11 – Contribution of each stage to the IB-US and BB-US scenarios
Impact categories
Life cycle
stage
Global warming potential
(kg CO
2
e)
Freshwater eutrophication
potential (g P-eq)
Land occupation
(annual m
2
crop eq)
Water consumption (m
3
)
IB – US
BB – US
IB – US
BB – US
IB – US
BB – US
IB – US
BB – US
Base meat
production
38%
94%
34%
82%
98%
100%
64%
97%
Processing
47%
5%
60%
17%
1%
0%
34%
3%
Packaging
1%
0%
1%
0%
0%
0%
1%
0%
Distribution
14%
1%
4%
1%
1%
0%
1%
0%
Table 12 – Contribution of each stage to the IM1-US and MM1-US scenarios
Impact categories
Life cycle
stage
Global warming potential
(kg CO
2
e)
Freshwater eutrophication
potential (g P-eq)
Land occupation
(annual m
2
crop eq)
Water consumption (m
3
)
IM1 – US
MM1 – US
IM1 – US
MM1 – US
IM1 – US
MM1 – US
IM1 – US
MM1 – US
Base meat
production
52%
93%
62%
92%
74%
97%
77%
97%
Processing
37%
6%
33%
7%
26%
3%
22%
3%
Packaging
0%
0%
0%
0%
0%
0%
0%
0%
Distribution
11%
2%
4%
1%
0%
0%
1%
0%
Table 13 - Contribution of each stage to the IM2-US and MM2-US scenarios
Impact categories
Life cycle
stage
Global warming potential
(kg CO
2
e)
Freshwater eutrophication
potential (g P-eq)
Land occupation
(annual m
2
crop eq)
Water consumption (m
3
)
IM2 – US
MM2 – US
IM2 – US
MM2 – US
IM2 – US
MM2 – US
IM2 – US
MM2 – US
Base meat
production
52%
93%
62%
92%
74%
97%
77%
97%
Processing
37%
6%
33%
7%
26%
3%
22%
3%
Packaging
0%
0%
0%
0%
0%
0%
0%
0%
Distribution
11%
2%
4%
1%
0%
0%
1%
0%

Impossible Beef and Meatball
Impossible Foods
WSP Canada
February 7, 2022
Page 33
Raw materials production for the ‘base meat’ contributes significantly to all selected impact category results for the Impossible
and meat-based products, as expected. The processing contribution for the Impossible products is more pronounced than in the
meat-based due to a smaller contribution from base meat production to GWP than for the meat-based products. Processing has
a significant contribution to the GWP and freshwater eutrophication potential result primarily because of energy demand in this
life cycle stage. For land occupation, raw materials production, as expected, contributes close to 100% of the result.
4.2.3 PROCESS CONTRIBUTION ANALYSIS
For the studied impact categories, processes that contributed more than 5% to the overall potential impact of the products are
discussed in this section. Only process contributions for the IB-US and IM1-US are provided (the IM2-US, MM2-US do not
differ from that of IM1-US and MM1-US). Where no value is given under a specific indicator, the process noted contributed
less than 5% to that overall indicator.
Table 14 provides the significantly contributing processes for IB-US.
Table 14 - Significant contributing processes (i.e. those than contribute 5% or more to overall total) for the IB-US
Process
Global warming
potential
(kg CO
2
e)
Freshwater
eutrophication
potential (g P-eq)
Land occupation
(annual m
2
crop eq)
Water consumption
(m
3
)
Textured soy protein
concentrate process
8%
6%
31%
Sunflower oil process
7%
7%
52%
37%
Carbon dioxide
process
23%
19%
5%
Heme
11%
14%
16%
Electricity process
14%
40%
Tap water process
(processing)
20%
Freezer truck
distribution process
14%
Coconut oil
13%
Ammonia
(refrigeration)
5%
For GWP, in addition to soy products, electricity, carbon dioxide, and freezer truck distribution to retailer provide significant
contributions. For freshwater eutrophication potential, impacts associated with carbon dioxide and electricity used in
processing comprise the majority of the value. For land occupation, sunflower oil and soy products contribute the most
significantly to this value. For water consumption, water consumption in processing and the production of heme and sunflower
oil contribute the most significantly.
Table 15 provides the significantly contributing processes for IM1-US.

Impossible Beef and Meatball
Impossible Foods
WSP Canada
February 7, 2022
Page 34
Table 15 - Significant contributing processes (i.e. those than contribute 5% or more to overall total) for the IM1-US
Process
Global warming
potential
(kg CO
2
e)
Freshwater
eutrophication
potential (g P-eq)
Land occupation
(annual m
2
crop eq)
Water consumption
(m
3
)
Textured soy protein
concentrate process
5%
14%
Sunflower oil process
10%
1%
49%
40%
Carbon dioxide
process
7%
7%
5%
Heme
5%
7%
6%
Electricity process
18%
44%
Natural gas
14%
Tap water process
(processing)
20%
Freezer truck
distribution process
11%
Coconut oil
7%
Ammonia
(refrigeration)
5%
Soybean oil (cooking)
6%
25%
9%
Potato starch
9%
For GWP, in addition to soy products, electricity, carbon dioxide, natural gas, and freezer truck distribution to retailer provide
significant contributions. For freshwater eutrophication potential, impacts associated with carbon dioxide and electricity used
in processing comprise the majority of the value. For land occupation, sunflower oil and soy products contribute the most
significantly to this value. For water consumption, water consumption in processing and the production of heme and sunflower
oil contribute the most significantly.

Impossible Beef and Meatball
Impossible Foods
WSP Canada
February 7, 2022
Page 35
4.3 LCIA RESULTS LIMITATIONS RELATIVE TO DEFINED GOALS
Other impact categories were not quantified in the results of the study because they do not serve to answer the questions
defined in the goal and scope of the study for the intended audience stated in Section 1. As such, the application of the results
of this study are limited to interpretations based on all potential impact categories included and cannot be generalized or
applied to other impact categories.
4.4 DESCRIPTION OF PRACTITIONER VA L U E C H O I C E S
The practitioner value choices have been limited to the selected LCIA. All results are presented on a mid-point basis, using the
methods noted in Section 4.1; normalization and weighting are not used. Other impact categories have been excluded from the
results because they do not answer the questions defined as the goal and scope for the intended audience in Section 1 of this
report.
4.5 STATEMENT OF RELATIVITY
LCIA results are relative expressions and do not predict impacts on category endpoints, the exceeding of thresholds, safety
margins, or risks. No grouping of impact categories has been performed; all impacts are presented at the mid-point level. LCIA
impacts presented in this report are based on mid-point characterization factors (e.g., kg CO
2
equivalent for GWP), and this
study does not refer to the ultimate damage to human health and the environment. For example, GWP may be a negative or a
positive environmental impact depending on the conditions in locations where emissions occur. Since this study does not
present end-point results, it does not draw any conclusions about the relative impact (positive or negative) for the categories
considered by the study.

Impossible Beef and Meatball
Impossible Foods
WSP Canada
February 7, 2022
Page 36
5 LIFE CYCLE INTERPRETAT IO N
5.1 IDENTIFICATION OF RELEVANT FINDINGS
Based on the results presented in Section 4.2, the IB, IM1 and IM2 have lower selected potential environmental impact results
over the BB, MM1 and MM2, respectively, among the four impact categories of concern.
5.2 DATA QUALITY ASSESSMENT
Data quality for each process in the inventory boundary that contributed 5% or more of the potential environmental impact was
evaluated and the efforts to improve data quality are reported in the following sections, where necessary. The data was assessed
using the data quality indicators described in Table 6 generally first and is discussed in Table 16.
Table 16 – Data quality evaluation
Data Quality
Requirement
Explanation
Technology coverage
For the Impossible Foods ingredients and other products, proxies were used for some
additives and flavourings, but these ingredients have relatively minor contributions
(and do not meet the indicated cut-off criteria) to the overall mass of the product.
Processing inputs, such as electricity and natural gas and all beef, pork, and meatball
processes, are consistent with the technologies they are meant to represent. For
secondary data, where used, changes over time are captured through updates to the
Ecoinvent databases. Therefore, technology coverage is considered good to very
good for all scenarios examined in this study.
Temporal coverage
Activity factors for Impossible Foods reflect data from 2020 and 2021. Estimates for
all utility and other data was from utility bills for direct operations and allocated
according to Impossible Foods production data. Secondary data, including impact
factors for electricity, natural gas combustion, and carbon dioxide use cover the time
period 2010-2021. Generally, activity data quality for IB, IM1 and IM2 are
considered very good whereas for impact data quality can be considered fair to good.
Activity data for the BB, PS, MM1 and MM2, including on farm activities and
livestock performance data represents US modelled or actual data from between 2010
and 2020; modelled data were based on actual farm data from 2017 time and would
be considered fair. Emissions for enteric fermentation and manure management for
beef production are from the IPCC (2006) Tier 2 and WFLDB v3.1 guidelines (as per
Qantis (2019)) and pig production are from GLEAM (FAO, 2017) based on 2017
farming activity. Both are considered fair to very good.

Impossible Beef and Meatball
Impossible Foods
WSP Canada
February 7, 2022
Page 37
Data Quality
Requirement
Explanation
Geographical coverage
The ingredients for IB, IM1 and IM2 are generally sourced from the US and where
not, geographically relevant impact factors were used to the extent possible. Where
this was not possible, this is recognized. Impossible Foods manufacturing data comes
from manufacturing data in the US and the impact factors for electricity, natural gas,
etc. are all US-based. Geographical coverage for the IB, IM1 and IM2 are considered
good to very good.
The performance data used in the modelling of the meat systems, BB, PS, and MM1
and MM2 for both the US are meant to be representative of the respective domestic
production, and the impact factors for electricity, natural gas, etc. have been selected
such that they are all US-based for US production. Geographical coverage for the
BB, PS, and MM are considered fair to good.
Completeness
Data for the IB, IM1 and IM2, including ingredients and manufacturing processes is
considered complete within the cut-off criteria and data quality is very good.
Data for the BB, PS, MM1 and MM2 are based on typical emissions sources for beef,
pork, and meatball processes and was obtained from previous studies that obtained
data directly form the farms and productions facilities being studied. Data quality for
completeness could be considered fair to good for the BB, PS, and MM.
Reliability
Because primary data for modeling the Impossible products are based on primary
data from Impossible Foods, the data quality for reliability is considered to be very
good. Variability in primary activity data has not been assessed. All background data
is from Ecoinvent and is well documented for its reliability.
With respect to the BB, PS, and MM, as noted above, on-farm data and performance
is based on farm-specific data and is considered to be reliable. However, the manure
management and application emission factors from the IPCC (2006) or GLEAM
(FAO, 2017) are a combination of best estimates and non-verified data. Data quality
for BB, PS, and MM for reliability is considered fair to good.
5.2.1 DATA QUALITY ASSESSMENT – IB-US AND BB-US
The IB-US and BB-US scenario data quality are discussed specifically here, aligning with the process contribution analysis
shown in Section 4.2.3.
IB-US

Impossible Beef and Meatball
Impossible Foods
WSP Canada
February 7, 2022
Page 38
The processes contributing significantly (greater than 5%) to the IB-US potential environmental impact categories (namely, in
this case, four impact categories: GWP, freshwater eutrophication potential, land occupation, and water consumption) were
provided in Table 14. Data quality for these processes is more directly discussed in Table 17.
Table 17 - Data quality commentary for the IB-US significant processes
Significant process and
relevant stage
Data sources
Data quality commentary
Efforts made to improve data
quality
Textured soy protein
concentrate process
Activity data: Data provided by
Impossible Foods. Environmental
impact data: Data from Ecoinvent
v3.6 database (Wernet, et al.,
2016).
Soybean yield updated to US
yields and as per USDA (2020).
See Impossible Foods (2020) for
more information. Data quality
considered good to very good.
US yields and fertilizer use as per
USDA (2020). See Impossible
Foods (2020) for more information.
Sunflower oil process
Activity data: Data provided by
Impossible Foods. Environmental
impact data: Data from Ecoinvent
v3.6 database (Wernet, et al.,
2016) and Agifootprint database
(v1.0) (Blonk Agri-footprint BV,
2014).
Sunflower seed yield updated to
US yields as per USDA (2020).
See Impossible Foods (2020) for
more information. Data quality
considered good to very good.
US yields and fertilizer use as per
USDA (2020). See Impossible
Foods (2020) for more information.
Carbon dioxide process
Activity data: Data provided by
Impossible Foods. Environmental
impact data: Data from Ecoinvent
v3.6 database (Wernet, et al.,
2016).
Data quality considered good to
very good.
None required.
Heme
Activity data: Data provided by
Impossible Foods. Environmental
impact data: Data from Ecoinvent
v3.6 database (Wernet, et al.,
2016) and Agifootprint database
(v1.0) (Blonk Agri-footprint BV,
2014).
Heme ingredient yields updated to
US yields as per USDA (2020).
See Impossible Foods (2020) for
more information. Data quality
considered good to very good.
US yields and fertilizer use as per
USDA (2020). See Impossible
Foods (2020) for more information.
Electricity process
Activity data: Amount of
electricity used quantified from
Impossible Food manufacturers.
Data for share of electricity
generation overall embedded in
electricity processes specific to the
region as discussed prior in this
work.
Environmental impact data: Data
from Ecoinvent v3.6 database
(Wernet, et al., 2016).
The specific contributions for each
generation source are from data
from 2014, but these factors were
not expected to change
significantly over time. Data quality
considered good.
Proportion of electricity generation
sources in the grid was updated as
per See Impossible Foods (2020)
for electricity grid factors.

Impossible Beef and Meatball
Impossible Foods
WSP Canada
February 7, 2022
Page 39
Tap water process
(processing)
Activity data: Data provided by
Impossible Foods. Environmental
impact data: Data from Ecoinvent
v3.6 database (Wernet, et al.,
2016).
Tap water for US generally used.
Data quality considered good.
None required.
Freezer truck
distribution process
Activity data: Data provided by
Impossible Foods. Environmental
impact data: Data from Ecoinvent
v3.6 database (Wernet, et al.,
2016) but updated for freezer
transportation as per Table 34.
Updated for freezer transportation
as per Table 34. Data quality
considered good.
Updated for freezer transportation
as per Table 34. Data quality
considered good.
Coconut oil process
Activity data: Data provided by
Impossible Foods. Environmental
impact data: Data from Ecoinvent
v3.6 database (Wernet, et al.,
2016) and Agifootprint database
(v1.0) (Blonk Agri-footprint BV,
2014)
Coconut yield updated to 2015-
2018 averaged data. Data for
contributions is from 1995. See
Appendix C for more information.
Coconut yield updated to 2015-
2018 averaged data. See
Impossible Foods (2020) for more
information.
Ammonia process
Activity data: Data provided by
Impossible Foods. Environmental
impact data: Data from Ecoinvent
v3.6 database (Wernet, et al.,
2016).
Data quality considered good to
very good.
None required.
The evaluation of each data quality criterion for significant processes in the IB-US scenarios, based on preceding comments, is
provided in Table 18.
Table 18 – Evaluation of data quality criteria for the IB-US scenarios
Process
Data
Tech.
Time
Geo.
Comp.
Rel.
Textured soy protein
concentrate process
Activity data
1
1
1
1
1
Environmental
impact data
1
2
3
2
2
Sunflower oil process
Activity data
1
1
1
1
1
Environmental
impact data
1
2
1
2
2
Carbon dioxide process
Activity data
1
1
1
1
1
Environmental
impact data
1
2
2
2
2
Heme
Activity data
1
1
1
1
1

Impossible Beef and Meatball
Impossible Foods
WSP Canada
February 7, 2022
Page 40
Environmental
impact data
1
2
2
2
2
Electricity process
Activity data
1
1
1
1
1
Environmental
impact data
1
3
1
2
2
Tap water process
Activity data
1
1
1
1
1
Environmental
impact data
1
3
1
2
2
Freezer truck distribution
process
Activity data
1
1
1
1
1
Environmental
impact data
1
3
1
2
2
Coconut oil process
Activity data
1
1
1
1
1
Environmental
impact data
1
4
1
2
2
Ammonia process
Activity data
1
1
1
1
1
Environmental
impact data
1
2
2
2
2
In general, data quality for all data used in the IB-US scenario is rated between fair and very good, with the majority of the
processes rated good and very good and only four out of the 80 indicators in Table 18 rated below good. Activity data is
considered fair to very good because of data provided by the manufacturer, with the fair data quality related to assumptions that
are made with respect to travel distances. The quality of the environmental impact data was rated from fair to very good,
depending on the criteria.
BB-US
The data quality for the ground beef part of the BB-US model is discussed in Qantis (2019) and has been subject to sensitivity
analyses and critical review. The processing, cooking, packaging and downstream transportation stages subsequent to ground
beef production are not significant contributors to the overall total of the potential impact indicators and thus are not discussed
here.
IM1-US/IM2-US
The processes contributing significantly (greater than 5%) to the IM1/IM2-US potential environmental impact categories
(namely, in this case, four impact categories: GWP, freshwater eutrophication potential, land occupation, and water
consumption) were provided in Table 14. Data quality for these processes is more directly discussed in Table 19.
Table 19 - Data quality commentary for the IM1/IM2-US significant processes
Significant process and
relevant stage
Data sources
Data quality commentary
Efforts made to improve data
quality

Impossible Beef and Meatball
Impossible Foods
WSP Canada
February 7, 2022
Page 41
Textured soy protein
concentrate process
Activity data: Data provided by
Impossible Foods.
Environmental impact data:
Data from Ecoinvent v3.6
database (Wernet, et al., 2016).
Soybean yield updated to US
yields and as per USDA (2020).
See Impossible Foods (2020) for
more information. Data quality
considered good to very good.
US yields and fertilizer use as
per USDA (2020). See
Impossible Foods (2020) for
more information.
Sunflower oil process
Activity data: Data provided by
Impossible Foods.
Environmental impact data:
Data from Ecoinvent v3.6
database (Wernet, et al., 2016)
and Agifootprint database (v1.0)
(Blonk Agri-footprint BV, 2014).
Sunflower seed yield updated to
US yields as per USDA (2020).
See Impossible Foods (2020) for
more information. Data quality
considered good to very good.
US yields and fertilizer use as
per USDA (2020). See
Impossible Foods (2020) for
more information.
Carbon dioxide process
Activity data: Data provided by
Impossible Foods.
Environmental impact data:
Data from Ecoinvent v3.6
database (Wernet, et al., 2016).
Data quality considered good to
very good.
None required.
Heme
Activity data: Data provided by
Impossible Foods.
Environmental impact data:
Data from Ecoinvent v3.6
database (Wernet, et al., 2016)
and Agifootprint database (v1.0)
(Blonk Agri-footprint BV, 2014).
Heme ingredient yields updated
to US yields as per USDA
(2020). See Impossible Foods
(2020) for more information.
Data quality considered good to
very good.
US yields and fertilizer use as
per USDA (2020). See
Impossible Foods (2020) for
more information.
Electricity process
Activity data: Amount of
electricity used quantified from
Impossible Food manufacturers.
Data for share of electricity
generation overall embedded in
electricity processes specific to
the region as discussed prior in
this work.
Environmental impact data:
Data from Ecoinvent v3.6
database (Wernet, et al., 2016).
The specific contributions for
each generation source are from
data from 2014, but these
factors were not expected to
change significantly over time.
Data quality considered good.
Proportion of electricity
generation sources in the grid
was updated as per See
Impossible Foods (2020) for
electricity grid factors.
Natural gas
Activity data: Data provided by
Impossible Foods.
Environmental impact data:
Data from Ecoinvent v3.6
database (Wernet, et al., 2016).
Tap water for US generally
used. Data quality considered
good.
None required.
Tap water process
(processing)
Activity data: Data provided by
Impossible Foods.
Environmental impact data:
Data from Ecoinvent v3.6
database (Wernet, et al., 2016)
but updated for freezer
transportation as per Table 34.
Updated for freezer
transportation as per Table 34.
Data quality considered good.
Updated for freezer
transportation as per Table 34.
Data quality considered good.

Impossible Beef and Meatball
Impossible Foods
WSP Canada
February 7, 2022
Page 42
Freezer truck distribution
process
Activity data: Data provided by
Impossible Foods.
Environmental impact data:
Data from Ecoinvent v3.6
database (Wernet, et al., 2016)
and Agifootprint database (v1.0)
(Blonk Agri-footprint BV, 2014)
Coconut yield updated to 2015-
2018 averaged data. Data for
contributions is from 1995. See
Appendix C for more
information.
Coconut yield updated to 2015-
2018 averaged data. See
Impossible Foods (2020) for
more information.
Coconut oil
Activity data: Data provided by
Impossible Foods.
Environmental impact data:
Data from Ecoinvent v3.6
database (Wernet, et al., 2016).
Data quality considered good to
very good.
None required.
Ammonia (refrigeration)
Activity data: Data provided by
Impossible Foods.
Environmental impact data:
Data from Ecoinvent v3.6
database (Wernet, et al., 2016)
and Agifootprint database (v1.0)
(Blonk Agri-footprint BV, 2014).
Heme ingredient yields updated
to US yields as per USDA
(2020). See Impossible Foods
(2020) for more information.
Data quality considered good to
very good.
US yields and fertilizer use as
per USDA (2020). See
Impossible Foods (2020) for
more information.
Soybean oil (cooking)
Activity data: Data provided by
Impossible Foods.
Environmental impact data:
Data from Ecoinvent v3.6
database (Wernet, et al., 2016).
Soybean yield updated to US
yields and as per USDA (2020).
See Impossible Foods (2020) for
more information. Data quality
considered good to very good.
US yields and fertilizer use as
per USDA (2020). See
Impossible Foods (2020) for
more information.
Potato starch
Activity data: Data provided by
Impossible Foods.
Environmental impact data:
Data from Ecoinvent v3.6
database (Wernet, et al., 2016).
Potato yield updated to US
yields and as per USDA (2020).
Data quality considered good to
very good.
US yields and fertilizer use as
per USDA (2020).
The evaluation of each data quality criterion for significant processes in the IM1/IM2-US scenarios, based on preceding
comments, is provided in Table 20.
Table 20 – Evaluation of data quality criteria for the IM1/IM2-US scenarios
Process
Data
Tech.
Time
Geo.
Comp.
Rel.
Textured soy protein
concentrate process
Activity data
1
1
1
1
1
Environmental
impact data
1
2
3
2
2
Sunflower oil process
Activity data
1
1
1
1
1
Environmental
impact data
1
2
1
2
2
Carbon dioxide process
Activity data
1
1
1
1
1

Impossible Beef and Meatball
Impossible Foods
WSP Canada
February 7, 2022
Page 43
Environmental
impact data
1
2
2
2
2
Heme
Activity data
1
1
1
1
1
Environmental
impact data
1
2
2
2
2
Electricity process
Activity data
1
1
1
1
1
Environmental
impact data
1
3
1
2
2
Tap water process
Activity data
1
1
1
1
1
Environmental
impact data
1
3
1
2
2
Freezer truck distribution
process
Activity data
1
1
1
1
1
Environmental
impact data
1
3
1
2
2
Coconut oil process
Activity data
1
1
1
1
1
Environmental
impact data
1
4
1
2
2
Ammonia (refrigeration)
Activity data
1
1
1
1
1
Environmental
impact data
1
2
2
2
2
Soybean oil (cooking)
Activity data
1
1
1
1
1
Environmental
impact data
1
2
3
2
2
Potato starch
Activity data
1
1
1
1
1
Environmental
impact data
1
3
2
2
2
In general, data quality for all data used in the IM1/IM2-US scenarios is rated between fair and very good, with the majority of
the processes rated good and very good and only six out of the 80 indicators in Table 20 rated below good. Activity data is
considered fair to very good because of data provided by the manufacturer, with the fair data quality related to assumptions that
are made with respect to travel distances. The quality of the environmental impact data was rated from fair to very good,
depending on the criteria.
MM1/MM2-US
The data quality for the MM1/MM2-US models is not evaluated because the contributing processes have been discussed in
Qantis (2019) and Impossible Foods (2020) and has been subject to sensitivity analyses and critical review. It is noted that with

Impossible Beef and Meatball
Impossible Foods
WSP Canada
February 7, 2022
Page 44
the primary contributing process, such as enteric fermentation (and manure management processes), there were different
quantification approaches used. In Qantis (2019), IPCC (2006) was used to quantify those emissions, whereas in Impossible
Foods (2020), GLEAM was used to model those emissions. There have been no studies to date comparing these two
approaches but it is recognized that each model has its own limitations and using the same model for both may not reduce these
limitations. The processing, cooking, packaging and downstream transportation stages subsequent to ground beef and pork
production are not significant contributors to the overall total of the potential impact indicators and thus are not discussed here.
5.3 SENSITIVITY ANALYSIS
Inventory uncertainty is assessed on a qualitative and quantitative basis. Three types of uncertainty are addressed: parameter
uncertainty, scenario uncertainty and model uncertainty (Table 21) with sensitivity analyses. These are discussed in the next
sections.
Table 21 – Uncertainty types
Uncertainty types
Sources
Description
Parameter uncertainty
■ Activity data
■ LCIA impact category
characterization factors
Uncertainty on the accuracy of values used in the inventory. Parameter
uncertainty can be assessed through the evaluation of data quality
indicators.
Scenario uncertainty
■ Methodological choices
Uncertainty related to assumptions or methods used for allocation or to
model product use or product end-of-life. Scenario uncertainty is
assessed via sensitivity analysis.
Model uncertainty
■ Model limitations
Uncertainty associated with the use of simplified models to represent
real life phenomena. Model uncertainty can partly be evaluated with data
quality indicators or sensitivity analysis. However, some aspects are
very difficult to quantify.
5.3.1 PARAMETER SENSITIVITY
Parameter sensitivity for direct emissions data, activity data and impact factor data were discussed in the previous section. In
general, data quality for Impossible Foods product processes was very good or good for main contributing processes, both for
activity data and impact factors. Qantis (2019) and Impossible Foods (2020) provide more details on data quality assessments
for these meat-based processes.
It is recognized that the MM recipes are a combination of ground beef and pork and this combination has yet to be evaluated
for data quality. However, it is recognized that the sensitivity analyses previously done in Qantis (2019) and Impossible Foods
(2020) showed no change in the conclusions that the Impossible products had significantly lower select potential environmental
impacts than their meat analogs. It is reasonable to expect that an equal mix of the meat-based products would perform the
same under different sensitivity analyses.
5.3.2 SCENARIO SENSITIVITY
Due to the nature of the product and the inventory boundary, typical sources of scenario uncertainty (e.g., use profile, end-of-
life profile) are not assessed through sensitivity analysis, as no assumptions were made regarding those aspects. For meat-based
products, often the choice of functional unit or the allocation scenarios may have an impact on the conclusions of the LCA

Impossible Beef and Meatball
Impossible Foods
WSP Canada
February 7, 2022
Page 45
study. However, the use of economic allocation to assign the contribution to the impact categories of the livestock
slaughterhouse activities has been shown in the Qantis (2019) and Impossible Foods (2020) to not have a significant impact on
the conclusions, thus it is not expected to have a significant expect on the conclusions here where those products are combined
in an equal manner. Thus, below, only sensitivity to the nutritional functional units is examined.
NUTRITIONAL FUNCTIONAL UNITS
As is noted above, the choice of functional unit is based on mass of food, which aligns with previous studies for PBMAs and
their meat-based equivalents. However, as some people eat food for other means, such as for caloric or protein intake, other
functional units may be useful to understand sensitivity to these desires.
This analysis leverages the caloric and protein data provided in Table 2 containing the nutritional information for IB, BB, IS,
PS, IM and MM. Table 22 shows the impact category results for all scenarios using a functional unit of 100 calories.
Table 22 – Impact category results per 100 calories of food
Impact categories
Scenario
Global warming
potential (kg
CO
2
e)
Freshwater
eutrophication
potential (g P-eq)
Land occupation
(annual m
2
crop eq)
Water consumption
(m
3
)
IB - US
0.15
0.05
0.13
0.003
BB - US
1.22
0.23
2.44
0.03
Difference
-88%
-81%
-95%
-90%
IM1 - US
0.23
0.06
0.27
0.01
MM1 - US
0.97
0.22
1.48
0.03
Difference
-77%
-73%
-82%
-80%
IM2 - US
0.23
0.06
0.27
0.01
MM2 - US
0.97
0.22
1.48
0.03
Difference
-77%
-73%
-82%
-80%
There are no significant changes in the differences between the Impossible products and the meat-based products primarily
because the nutritional information is relatively similar. Regardless, the results show that when caloric content is used as the
functional unit, there is no difference to the conclusion that modeled impact categories are lower for the Impossible scenarios
than for the meat-based scenarios.
Table 23 shows the impact category results for all scenarios using a functional unit of 10g of protein.
Table 23 – Impact category results per 10 g of protein in food
Impact categories
Scenario
Global warming potential
Land occupation

Impossible Beef and Meatball
Impossible Foods
WSP Canada
February 7, 2022
Page 46
(kg CO
2
e)
Freshwater eutrophication
potential (g P-eq)
(annual m
2
crop eq)
Water consumption
(m
3
)
IB - US
0.18
0.05
0.15
0.00
BB - US
1.81
0.35
3.61
0.05
Difference
-90%
-84%
-96%
-92%
IM1 - US
0.27
0.07
0.32
0.01
MM1 - US
1.55
0.35
2.38
0.05
Difference
-83%
-80%
-86%
-85%
IM2 - US
0.27
0.07
0.32
0.01
MM2 - US
1.55
0.35
2.38
0.05
Difference
-83%
-80%
-86%
-85%
Similar to prior findings, there are no significant changes in the differences between the Impossible products and the meat-
based products primarily because the nutritional information is relatively similar. Regardless, the results show that when
protein content is used as the functional unit, there is no difference to the conclusion that modeled impact categories are lower
for the Impossible scenarios than for the meat-based scenarios.
5.3.3 MODEL SENSITIVITY
ReCiPe Midpoint (H) v1.12 was used to quantify the impact categories considered in this study. To examine the differences in
impact category results using a different LCIA method, the IM1-US and MM1-US scenarios were run using the CML 2.0
method for the global warming indicator (the 100-year time horizon GWPs without carbon feedback from AR5 are utilized
(IPCC, 2014)), IMPACT 2002+ for aquatic eutrophication potential and land use. No other relevant water consumption
indicator was compared. The results for the three impact categories for the IM1-US and MM1-US run using CML 2.0 and
IMPACT 2002+ are shown in Table 24. Only the IM1-US and MM1-US scenarios were tested because they were assumed to
be the most demonstrative of sensitivity to model changes.
Table 24 – Relevant impact category results with different models used
Scenario
Global warming potential (kg
CO
2
e) – CML 2.0
Aquatic eutrophication
potential (g PO4
3-
eq P-lim) –
IMPACT 2002+
Land occupation (m
2
·a) –
IMPACT 2002+
IM1-US
3.81
3.10
4.44
MM1-US
25.10
17.14
37.43

Impossible Beef and Meatball
Impossible Foods
WSP Canada
February 7, 2022
Page 47
Difference
-85%
-82%
-88%
There are no differences in the conclusions between the impact categories new methods and ReCiPe Midpoint method,
indicating that these conclusions are not sensitive to the specific LCIA methods investigated in this work. It is noted that the
results are not directly comparable to the baseline results and thus only the individual impact category conclusions are relevant;
these do not change. It is noted that no additional water consumption indicator was tested because a relevant indicator in other
methods was not found.

Impossible Beef and Meatball
Impossible Foods
WSP Canada
February 7, 2022
Page 48
5.4 ASSUMPTIONS AND LIMITATIONS
The evidence presented in this report and Impossible Foods (2020) is unique to the assumptions and practices of Impossible
Foods and involves assumptions that are used by their production team to collect and record data. The reference scenarios have
been specifically developed to be comparable to Impossible Foods production models as much as possible. The results are not
intended to be a platform for comparability to other companies and/or other products. Even for similar products, differences in
unit of analysis, life cycle stage profiles and data quality may produce incomparable results.
The LCA performed for Impossible Foods compares the life cycle of various Impossible Foods products produced in the US
against meat-based products produced in the US. Any conclusion described by this report must be considered only within the
context of the study, with considerations of the data, assumptions and limitations used to arrive at those conclusions.
The limitations in this current study should be highlighted to ensure there are mitigating actions made for future studies of
Impossible Foods products against their meat-based equivalents:
■ The inherent limitations with the meat-based models that are described in the original reports: Qantis (2019) for beef and
Impossible Foods (2020) for pork.
■ Mass was used as a functional unit in this study although there are other functional units, such as calories or protein
content, that could also be relevant; a sensitivity analysis was conducted using calories and protein content as the
functional unit and the conclusions of the study did not change.
■ Only four impact categories were considered here because they were of most interest to Impossible Foods and they were
typical indicators for food-based and plant-based meat alternative LCAs; it is recognized that there are other impact
categories available to evaluate the overall environmental performance of the studied products.
■ Different LCIA methods were used to calculate the impact category results because they were not all available in a single
method; a sensitivity analysis was conducted using the same method for all impact categories and the conclusions did not
differ.
Finally, LCA results are relative expressions and do not predict impacts on category endpoints, the exceeding of thresholds,
safety margins or risks.
5.5 CONCLUSIONS AND RECOMMENDATIONS
This LCA compares various Impossible Foods products, PBMAs produced in the US, with their meat-based equivalents
produced in their domestic markets. These products are considered to have functional equivalency because of their ability to
satiate hunger, but also to provide similar quantities of nutrients.
The goal of this LCA is to compare the environmental profile made up of four impact categories, namely global warming,
freshwater eutrophication potential, land occupation, and water consumption, associated with Impossible Foods scenarios and
their functionally equivalent meat-based scenarios and understand the extent to which the results for those particular impact
categories for the Impossible scenarios are lower than for the meat-based scenarios.
The key findings are presented in this work, but generally, all Impossible scenarios had lower results in the four potential
environmental impact categories than the meat-based scenarios.
It should again be noted that the nutritional content, an important feature of food and objective behind the consumption of food,
has been considered and the directionality of the results do not change. The intention here is to portray an environmental
comparison for the four impact categories of concern as accurately and clearly as possible, which can be used along with

Impossible Beef and Meatball
Impossible Foods
WSP Canada
February 7, 2022
Page 49
nutritional considerations, and other considerations such as taste, cost, and convenience, in helping consumers make food
choices.
In summary, the study has found that there are benefits, under the four potential impact categories of concern discussed in this
study, to using the Impossible Foods scenarios studied in this work instead of a meat-based equivalent.

Impossible Beef and Meatball
Impossible Foods
WSP Canada
February 7, 2022
Page 50
6 REFERENCES
Asem-Hiablie, S., Battagliese, T., Stackhouse-Lawson, K., & Rotz, C. (2018). A life cycle assessment of the environmental
impacts of a beef system in the USA. . The International Journal of Life Cycle Assessment, 1-15.
Beegle, D., & Durst, P. (2002). Managing Phosphorus for Crop Production. Penn State University. Retrieved from Penn State
Extension: https://extension.psu.edu/programs/nutrient-management/educational/soil-fertility/managing-phosphorus-
for-crop-production
Blonk Agri-footprint BV. (2014). Agri-Footprint - Part 1 - Methodology and basic principles . Amsterdam, NL.
Chastain, J., Camberato, J., & Skewes, P. (2010). Poultry Manure Production and Nutrient Content. Retrieved from
https://www.clemson.edu/extension/camm/manuals/poultry/pch3b_00.pdf
Chicken Farmers of Canada. (2018). Sustainability Assessment of the Canadian Chicken value chain. Retrieved from
https://www.chickenfarmers.ca/resources/sustainability-assessment-of-the-canadian-chicken-value-chain/
Cooked Perfect. (2021). Cooked Perfect. Retrieved from Italian Style Meatballs:
https://www.cookedperfect.com/products/italian-style-meatballs/#nutrition-info
Dalgaard, R., Halberg, N., & Hermansen, J. (2007). Danish Pork Production: An Environmental Assessment. University of
Aarhus.
Dettling, J., Tu, Q., Faist, M., DelDuce, A., & Mandlebaum, A. (2016). Assessing the environmental benefits of plant-based
dietary choices through: a comparison of meal choices, and a comparison of meat products and MorningStar Farms®
veggie products. Qauntis.
FAO. (2017). FAO. Retrieved from Global Livestock Environmental Assessment Model (GLEAM) : www.fao.org/gleam/en/
FAO. (2021). FAOSTAT. Retrieved from Crops and livestock products: http://www.fao.org/faostat/en/#data/QCL
Goedkoop, M., Heijungs, R., Huijbregts, M., De Schryver, A., Struijs, J., & Van Zelm, R. (2009). ReCiPe 2008: A life cycle
impact assessment method which comprises harmonised category indicators at the midpoint and the endpoint level.
First edition Report I: Characterisation.
Heller, C., & Keoleian, G. A. (2018). Beyond Meat's Beyond Burger Life Cycle Assessment: A detalied comparison between a
plant-based and an animal-based protein source. Center for Sustainable Systems. Universitiy of Michigan.
Impossible Foods. (2020). Final Report Impossible Sausage Made from Plants Life Cycle Assessment. Impossible Foods Inc.
IPCC. (2006). 2006 IPCC Guidelines for National Greenhouse Gas Inventories, Volume 4. Eggleston H.S., Buendia L., Miwa
K., Ngara T. and Tanabe K. (eds). . Retrieved from https://www.ipcc-nggip.iges.or.jp/public/2006gl/vol4.html
IPCC. (2006a). 2006 IPCC Guidelines for National Greenhouse Gas Inventories: Chapter 10: Emissions from Livestock and
Manure Management. IPCC.
IPCC. (2006b). CHAPTER 11 N2O Emissions from Managed Soils, and CO2 Emissions from Lime and Urea Application .
IPCC.
IPCC. (2014). Climate Change 2014: Synthesis Report. Contribution of Working Groups I, II and III to the Fifth Assessment
Report of the Intergovernmental Panel on Climate Change. Geneva, Switzerland: IPCC.
ISO. (2006, July 1). ISO 14044: Environmental management — Life cycle assessment - Requirements and guidelines. Geneva,
Switzerland.

Impossible Beef and Meatball
Impossible Foods
WSP Canada
February 7, 2022
Page 51
ISO. (2018). Greenhouse gases — Carbon footprint of products — Requirements and guidelines for quantification.
Khan, S., Loyola, C., Dettling, J., & Hester, J. (2019). Comparative environmental LCA of the Impossible Burger with
conventional ground beef burger. Quanits.
Meat & Livestock Australia Limited. (2013). Northern Australian Beef Supply Chain. Meat & Livestock Australia Limited.
National Pork Board. (2016). Life Cycle of a Market Pig. Retrieved from Pork Checkoff: https://www.pork.org/facts/pig-
farming/life-cycle-of-a-market-pig/
Nguyen, T., Hermansen, J., & Mogensen, L. (2011). Environmental Assessment Of Danish Pork. Tjele, Denmark: Aarhus
University.
Putman, T. B. (2017). A retrospective analysis of the United States poultry industry: 1965 compared with 2010. Agricultural
Systems, 107-117.
Qantis. (2019). Comparative Environmental LCA of the Impossible Burger with Conventional Ground Beef Burger. Qantis.
Quantis. (2019). World Food LCA Database, Methodological Guidelines for the Life Cycle Inventory of Agricultural Products,
version 3.5.
Reckmann, K., Blank, R., Traulsen, I., & Krieter, J. (2016). Comparative life cycle assessment (LCA) of pork using different
protein sources in pig feed. Archives Animal Breeding, 27–36.
Reckmann, K., Blank, R., Traulsen, I., & Krieter, J. (2016). Comparative life cycle assessment (LCA) of pork using different
protein sources in pig feed. Archives Animal Breeding, 27–36.
RIVM. (2018). National Institute for Public Health and the Environment. Retrieved from Ministry of Health, Welfare and
Sport: https://www.rivm.nl/en/life-cycle-assessment-lca/recipe
Röös, E., Sundberg, C., Tidaker, P., Strid, I., & Hansson, P.-A. (2013). Can carbon footprint serve as an indicator of the
environmental impact of meat production? Ecological Indicators, 24:573-581.
Rougoor, C., Elferink, E., Lap, T., & Balkema, A. (2015). LCA of Dutch Pork. Glamur.
Tassou, S., De-Lille, G., & Ge, Y. (2009). Food transport refrigeration - Approaches to reduce energy consumption and
enviornmental impacts of road transport. Applied Thermal Engineering, 29(8-9):1467-1477.
Thoma, G., Nutter, D., Ulrich, R., Maxwell, C., Frank, J., & East, C. (2011). National Life Cycle Carbon Footprint Study for
Production of US Swine.
US EPA. (2021, February 2). eGRID 2019 Summary Tables. Retrieved from https://www.epa.gov/sites/production/files/2021-
02/documents/egrid2019_summary_tables.pdf
USDA. (2018). Beef, ground, 80% lean meat / 20% fat, raw. Retrieved from USDA Agricultural Research Service:
https://fdc.nal.usda.gov/fdc-app.html#/food-details/174036/nutrients
USDA. (2019). Economic Research Service. Retrieved from https://www.pork.org/facts/stats/u-s-pork-exports/#exportsquad
USDA. (2020). National Agricultrual Statistics Service. Retrieved from USDA:
https://www.nass.usda.gov/Publications/AgCensus/2017/Full_Report/Volume_1,_Chapter_2_US_State_Level/
Watson, K., Wiedemann, S., Biggs, L., & McGahan, E. (2018). Trends in environmental impacts from the pork. Australian
Pork Limited.
WE Energy. (2021). Climate Report 2021. https://www.wecenergygroup.com/csr/climate-report2021.pdf.

Impossible Beef and Meatball
Impossible Foods
WSP Canada
February 7, 2022
Page 52
Weidema, B., Bauer, C., Hischier, R., Mutel, C., Nemecek , T., Vadenbo, C., & Wernet, G. (2013). Overview and
methodology. Data quality guidelines for the Ecoinvent database version 3. Ecoinvent Report 1 (Final). St. Gallen,
CH: The Ecoinvent Centre.
Wernet, G., Bauer, C., Steubing, B., Reinhard, J., Moreno-Ruiz, E., & Weidema, , B. (2016). The ecoinvent database version 3
(part I): overview and methodology. The International Journal of Life Cycle Assessment, 21(9): 1218–1230.
Ziara, R. (2015). Water and Energy Use and Wastewater Production. Civil Engineering Theses, Dissertations, University of
Nebraska-Lincoln.
!
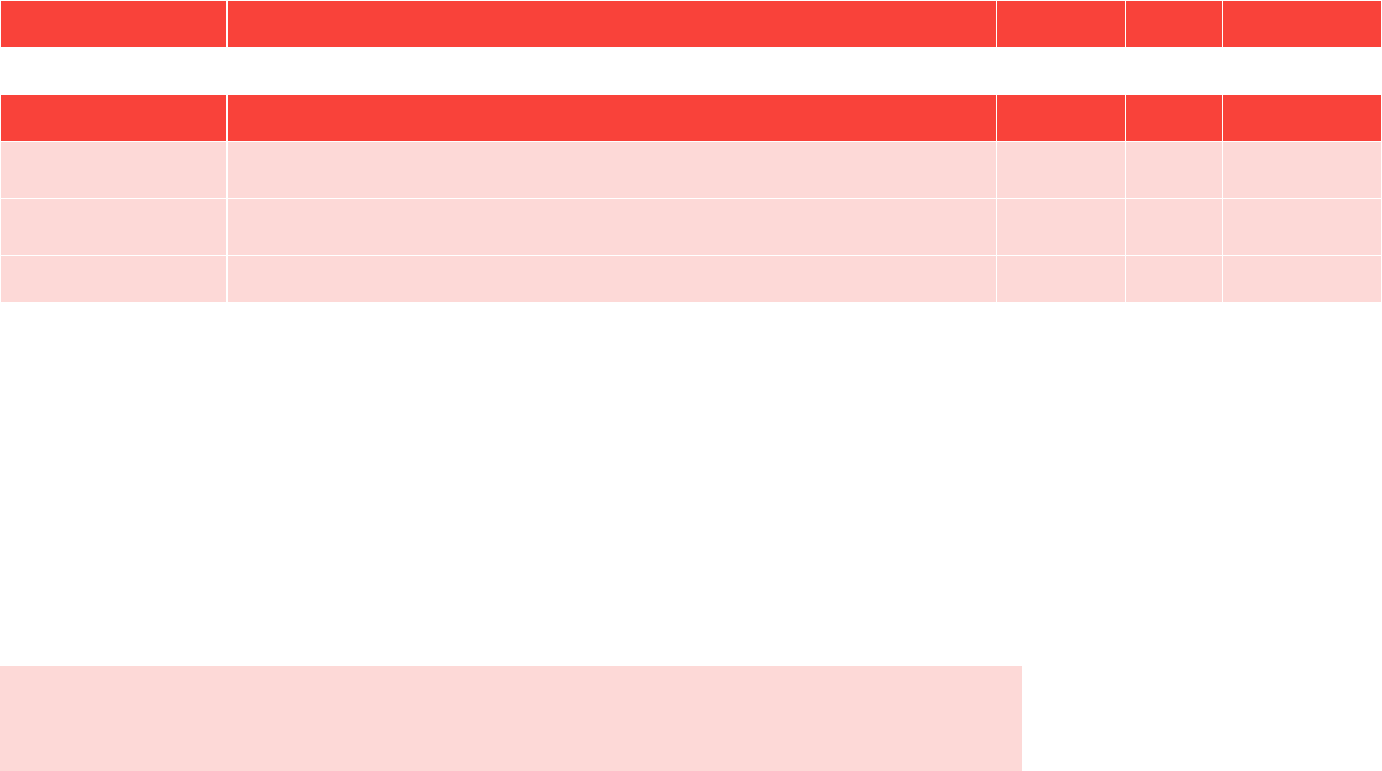
Impossible
Beef and Meatball
Impossible Foods
WSP Canada
February 7, 2022
Page 53
6 APPENDIX A – IB AND BB PROCESSES
Table 25 – IB bulk meat - REDACTED
Table 26 – IB and BB Processing – REDACTED
Table 27 – IB and BB - Packaging
Ingredient/Input
GaBi input
Amount
Units
Comments
Packaging
Packaging for 1 kg of IB and BB
1
pc
Ingredient/Input
GaBi input
Amount
Units
Comments
Plastic film
Packaging film, low density polyethylene, market for {GLO} – U-so
0.0023
kg
Paper Film
Market for kraft paper, bleached {GLO} - Agg
0.0016
kg
Cardboard box
Corrugated board box, market for {GLO} – U-so
0.01
kg
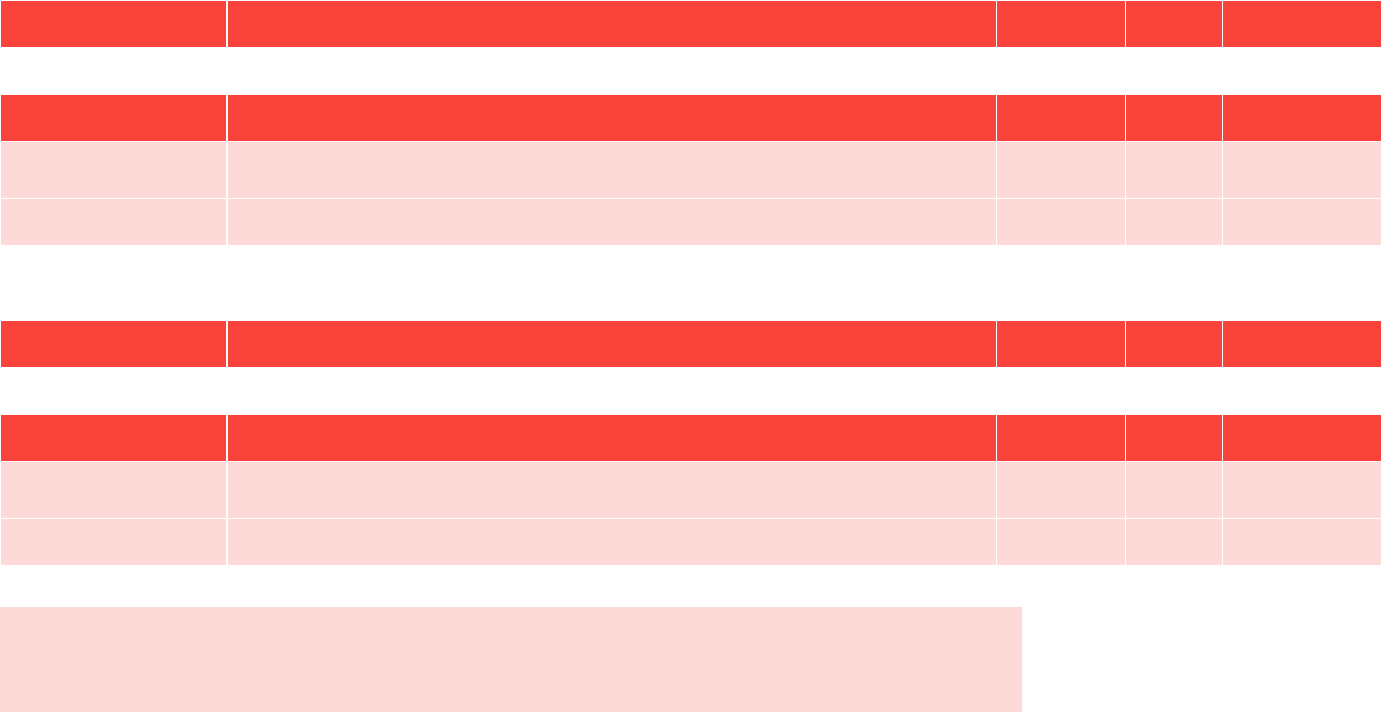
Impossible
Beef and Meatball
Impossible Foods
WSP Canada
February 7, 2022
Page 54
7 APPENDIX B – IM AND MM PROCESSES
Table 28 – IM bulk meat - REDACTED
Table 29 – MM bulk meat - REDACTED
Table 30 – IM and MM – REDACTED
Table 31 – IM1 and MM1 - Packaging
Ingredient/Input
GaBi input
Amount
Units
Comments
Packaging
Packaging for 1 kg of IM1 and MM1
1
pc
Ingredient/Input
GaBi input
Amount
Units
Comments
Plastic film
Packaging film, low density polyethylene, market for {GLO} – U-so
0.0004
kg
Cardboard box
Corrugated board box, market for {GLO} – U-so
0.0031
kg
Table 32 – IM2 and MM2 - Packaging
Ingredient/Input
GaBi input
Amount
Units
Comments
Packaging
Packaging for 1 kg of IM2 and MM2
1
pc
Ingredient/Input
GaBi input
Amount
Units
Comments
Plastic film
Packaging film, low density polyethylene, market for {GLO} – U-so
0.000908
kg
Cardboard box
Corrugated board box, market for {GLO} – U-so
0.00454
kg

Impossible
Beef and Meatball
Impossible Foods
WSP Canada
February 7, 2022
Page 55
8 APPENDIX C – ANCILLARY PROCESSES
Table 33 - Soybean protein concentrate; modified process (Impossible Foods, 2020)
Output
GaBi input
Amount
Units
Comments
Soybean protein concentrate
Soybean protein concentrate {US}
540
kg
Allocation = 63.68%
Co-product
Soybean hulls, from crushing (solvent, for protein concentrate), at plant/AR Economic
74
kg
Allocation = 0.98%
Co-product
Soybean molasses, from crushing (solvent, for protein concentrate), at plant/AR Economic
290
kg
Allocation = 28.64%
Co-product
Crude soybean oil, from crushing (solvent, for protein concentrate), at plant/AR Economic
180
kg
Allocation = 6.7%
Emissions to air
Hexane
0.8
kg
Wastewater
Wastewater, unpolluted, market for {GLO} – U-so
164
m
3
Ingredient/input
GaBi input
Amount
Units
Comments
Ethanol for cleaning
Ethanol, without water, in 99.7% solution state, from fermentation, market for {GLO} – U-so
128
kg
Diesel for heat
Diesel, burned in building machine, market for {GLO} – U-so
410
MJ
Hexane for refining
Hexane, market for {GLO} – U-so
0.8
kg
Soybean input
Soybean production {US} – agg
1
ton
Electricity
Electricity, medium voltage, market for {ConEd} – U-so
1,080
MJ
Steam
Steam, in chemical industry, market for {GLO} – U-so
720
kg

Impossible
Beef and Meatball
Impossible Foods
WSP Canada
February 7, 2022
Page 56
Table 34 – Crude sunflower oil; modified process (Impossible Foods, 2020)
Output
GaBi input
Amount
Units
Comments
Crude sunflower oil
Crude sunflower oil, from crushing (solvent), at plant/AR Economic – Agri-footprint process modified
289
kg
To be used in refined
sunflower oil (see
Impossible Foods
(2020));
allocation=80%
Byproduct
Sunflower seed meal, from crushing (solvent), at plant/AR Economic – Agri-footprint process modified
350
kg
Allocation=20%
Ingredient/input
GaBi input
Amount
Units
Comments
Hexane
Hexane, market for {GLO} – U-so
1
kg
Sunflower seed production
Sunflower seed {ROW} – U-so
1
ton
Transport from sunflower seed
to sunflower oil processor
Transport, freight, lorry 16-32 metric ton, EURO3, market for {GLO} – U-so
0.2
t·km
Transport from
sunflower seed to
sunflower oil processor
Water
Tap water production, conventional treatment {US} - agg
0.248
ton
Electricity
Electricity, medium voltage, market for {Comed} – U-so
27
MJ
Steam
Steam, in chemical industry, market for {GLO} – U-so
500
kg

Impossible
Beef and Meatball
Impossible Foods
WSP Canada
February 7, 2022
Page 57
Table 35 – Refined sunflower oil; modified process (Impossible Foods, 2020)
Output
GaBi input
Amount
Unit
s
Comments
Refined sunflower oil
Refined sunflower oil, from crushing (solvent) – Agri-footprint process modified
1,000
kg
Allocation = 98.75%
Byproduct
Soap stock (sunflower solvent crushing) – Agri-footprint process modified
37.95
kg
Allocation = 1.25%
Ingredient/input
GaBi input
Amount
Unit
s
Comments
Crude sunflower oil
Crude sunflower oil, from crushing (solvent), at plant/AR Economic – Agri-footprint process modified
1,046.8
4
kg
See Impossible
Foods (2020)
Activated charcoal for removal
of impurities
Activated bentonite, market for {GLO} – U-so
8.08
kg
Diesel for refining
Diesel, burned in building machine {GLO}| market for | Alloc Def, U
342.45
MJ
Electricity
Electricity, medium voltage, market for {Comed} – U-so
54.8
kWh
Steam
Steam, in chemical industry, market for {GLO} – U-so
731.5
kg
Table 36 – Freezer truck transportation (Impossible Foods, 2020)
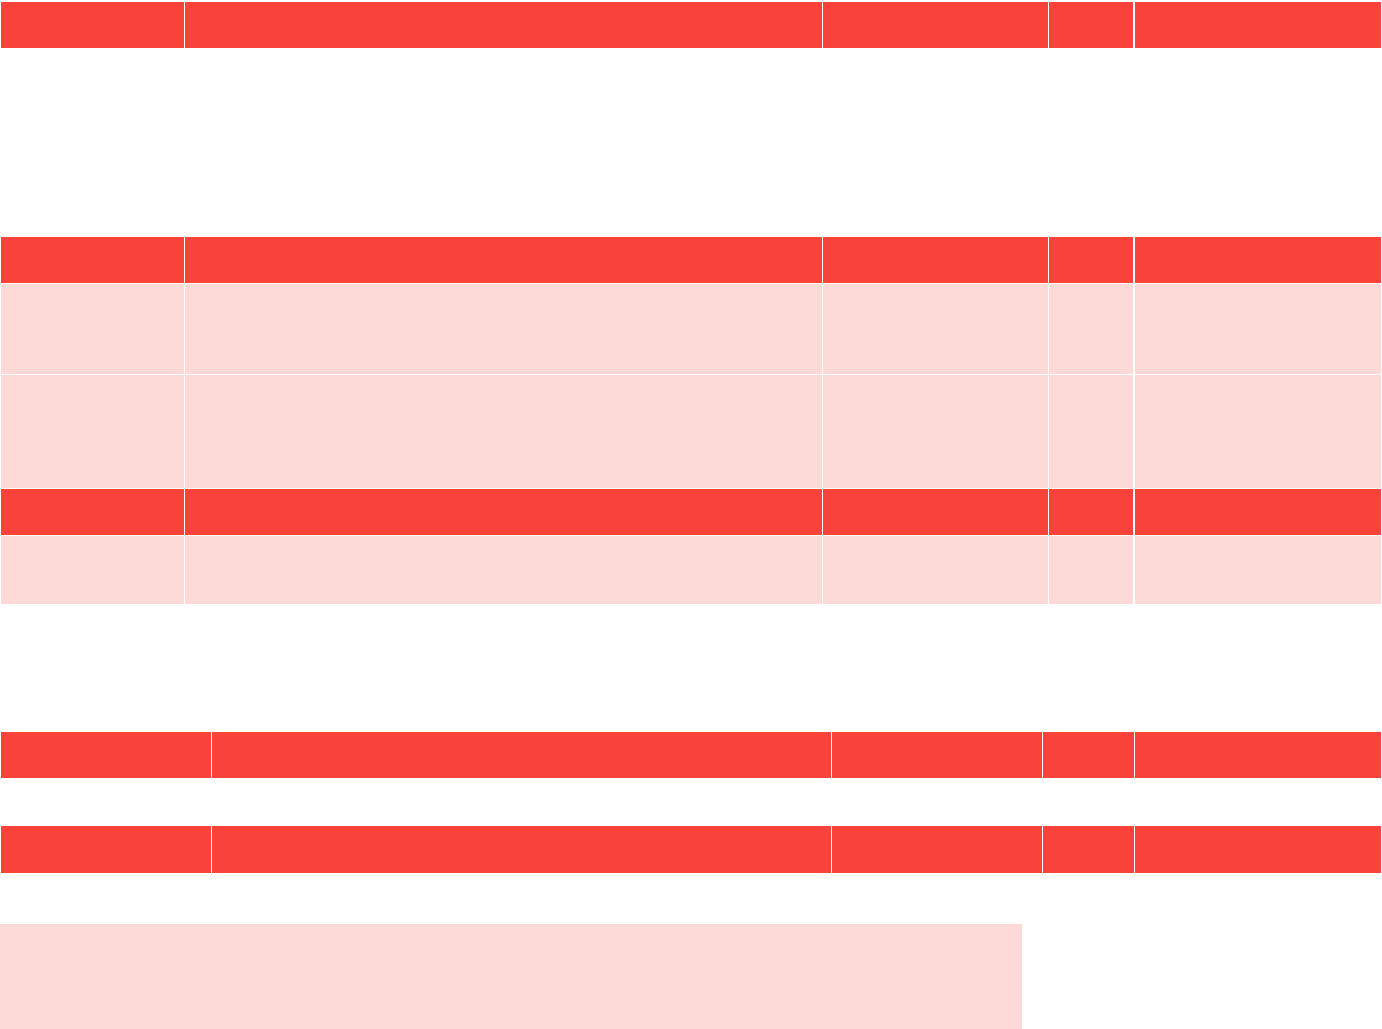
Impossible
Beef and Meatball
Impossible Foods
WSP Canada
February 7, 2022
Page 58
Output
GaBi input
Amount
Units
Comments
Freezer transport
Freezer transport
1
t·km
Removed additional
emissions from these
because only energy
increases 27%
Road wear emissions, lorry, market for {GLO} – U-so
-3.52E-6
kg
Removed additional emissions
from these because only
energy increases 27%
Brake wear emissions, lorry, market for {GLO} – U-so
-3.03E-6
kg
Tyre wear emissions, lorry, market for {GLO} – U-so
-3.49E-5
kg
Ingredient/input
GaBi input
Amount
Units
Comments
R-134a
Refrigerant R134a, market for {GLO} – U-so
2.22E-6
kg
Based on 5 kg charge and 10%
leakage per year calculated on
a per km basis
Transportation from
processing facility to
retailer
Transport, freight, lorry 7.5-16 metric ton, EURO3, market for {GLO} – U-so
1.27
tkm
Freezer transport requires 27%
more energy than non-
refrigerated, as per Tassou et
al. (2009)
Emissions to air
GaBi input
Amount
Units
Comments
R-134a
Ethane, 1, 1, 1-2-tetrafluoro-, HFC-134a
2.22E-6
kg
Amount adjusted to reflect 100
year GWPs.
Table 37 – Freezer freighter transportation (Impossible Foods, 2020)
Output
GaBi input
Amount
Units
Comments
Freezer transport
Freezer transport
1
tkm
Ingredient/input
GaBi input
Amount
Units
Comments

Impossible
Beef and Meatball
Impossible Foods
WSP Canada
February 7, 2022
Page 59
R-134a
Refrigerant R134a, market for {GLO} – U-so
2.22E-6
kg
Based on 5 kg charge and 10%
leakage per year, calculated on
a per km basis
Transportation from
processing facility to
retailer
Transport, freight, sea, transoceanic ship, market for {GLO} – U-so
1.27
t·km
Freezer transport requires 27%
more energy than non-
refrigerated, as per Tassou et
al. (2009)
Emissions to air
GaBi input
Amount
Units
Comments
R-134a
Ethane, 1, 1, 1-2-tetrafluoro-, HFC-134a
2.22E-6
kg
Amount adjusted to reflect 100
year GWPs.
Table 38 – Coconut oil, including transport
Output
GaBi input
Amount
Units
Comments
Coconut oil
Coconut oil
1
kg
Ingredient/input
GaBi input
Amount
Units
Comments
Coconut oil
Coconut oil, crude {PH}| production | Alloc Def, U - Mod
1
kg
Transportation of coconut
oil from the Philippines to
the US
Transport, freight, sea, transoceanic tanker {GLO}| market for | Alloc Def, U
23.1963
t·km
Distance from Los Angeles to
Manila
Transportation of coconut
oil from the Philippines to
the US
Transport, freight, lorry 7.5-16 metric ton, EURO3 {GLO}| market for | Alloc Def, U
0.2
t·km
200 km truck distance within
the Philippines

Impossible
Beef and Meatball
Impossible Foods
WSP Canada
February 7, 2022
Page 60
