THIS REPORT CONTAINS ASSESSMENTS OF COMMODITY AND TRADE ISSUES MADE BY USDA STAFF AND NOT NECESSARILY
STATEMENTS OF OFFICIAL U.S. GOVERNMENT POLICY
Required Report: Required - Public Distribution Date: December 18, 2023
Report Number: NL2023-0014
Report Name: Exporter Guide
Country: Netherlands
Post: The Hague
Report Category: Exporter Guide
Prepared By: Marcel Pinckaers
Approved By: Laura Geller
Report Highlights:
The exporter guide provides an economic and market overview, as well as demographic trends and
practical tips to U.S. exporters on how to conduct business in the Netherlands. The report additionally
describes three market sectors (food retail, food service, and food processing), the best market entry
strategy, and the best high-value product prospects, and focuses exclusively on consumer-oriented
products. Additional reports referenced herein can be found at the following website:
https://gain.fas.usda.gov/#/search.
1
Market Fact Sheet: The Netherlands
Executive Summary:
Although the Netherlands is a small country
geographically, it is the gateway for U.S. products
into the European Union (EU). It is also the EU’s
largest importing country and continues to be the
second largest exporter of agricultural products in the
world.
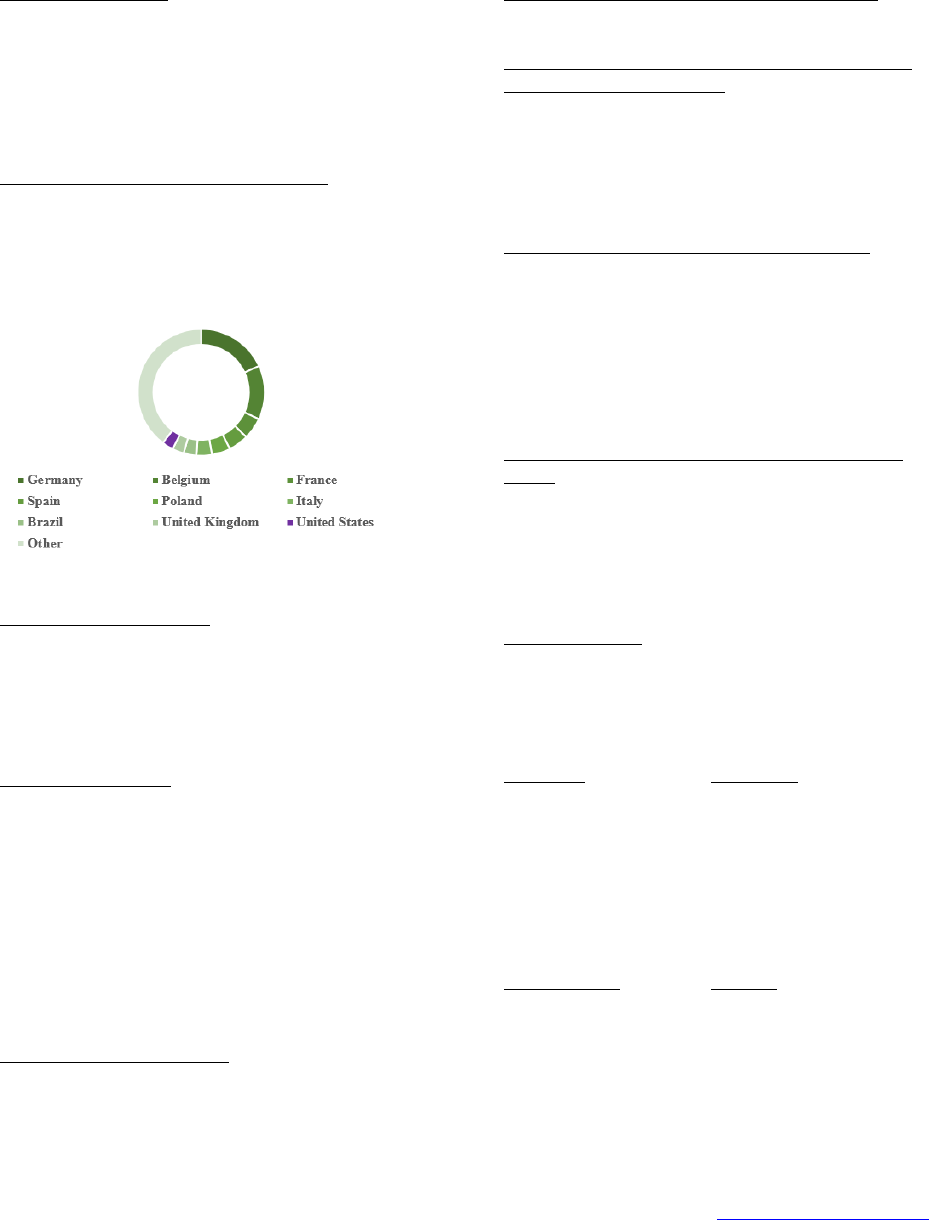
Imports of Consumer-Oriented Products:
Products from other EU Member States lead Dutch
imports of consumer-oriented products. In 2022, the
United States was the nineth largest supplier of these
products to the Netherlands, with imports valued at
over $1.5 billion.
Source: Trade Data Monitor
Food Processing Industry:
About 8,435 food companies generated net sales of
$98 billion in 2022. The industry has been a steady
supplier of jobs in the Netherlands (152,000) and the
number of food companies continues to grow due to
an increasing number of small food companies.
Food Retail Industry:
The Dutch retail sector is rather consolidated,
employing over 300,000 people, and operating in an
estimated 4,500 stores. The sector’s turnover for
2022 is forecasted $48.7 billion. Due to the increased
costs of living, consumers are looking for products on
sale and moving from branded products to private
labeled products. Cheaper further processed variants
are gaining popularity as well as discount stores.
Interest in shopping for groceries on-line continues to
grow.
Foodservice – HRI Industry:
Despite the rising costs of living, the Dutch
foodservice industry’s turnover is back on track. Last
year, total sales were valued at $15.6 billion and
exceeded the pre-pandemic level for the first time.
Consumers returned en-masse to HRI foodservice
outlets and picked up their social life they led prior to
the pandemic.
Quick Facts CY 2022
Imports of Consumer-Oriented Products, total:
$52.9 billion
List of Top 10 Growth Products in the Netherlands
(imported from the World):
1. Cocoa beans 6. Bananas
2. Food preparations 7. Baked goods
3. Fats and oils 8. Ethyl alcohol
4. Wheat and meslin 9. Cheese
5. Meat 10. Coffee
Food Industry by Channels 2022, in $ billion:
Consumer-Oriented Products Imports
Consumer-Oriented Products Exports
Agricultural & Related Products Imports
Agricultural & Related Products Exports
Food Industry
Food Retail
Food Service
$53
$97
$113
$150
$98
$49
$16
Top 10 Food Retailers in the Netherlands, Market
Share:
Albert Heijn
Jumbo
Lidl
Plus/Coop
Aldi
35.9%
21.8%
10.7%
10.4%
5.2%
Dirk/Deka
Hoogvliet
Spar
Jan Linders
Poiesz
5.1%
2.0%
1.2%
1.1%
1.0%
GDP/Population:
Population: 17.9 million
GDP: $1,021 billion
GDP per capita: $57,039
Strengths/Weaknesses/Opportunities/Challenges
Strengths:
U.S. producers offer a
great variety of food
products that have a
great story to tell
about sustainability,
farm to table supply
chains, and their
heritage.
Weakness:
Transatlantic
transportation is costly
and takes time. Some
U.S. food products
suffer from a negative
perception among
Dutch consumers due
to misinformation.
Opportunities:
There is a growing
demand for healthy
and nutritious food
products and product
with a special claim
and sustainable
production method.
Threats:
There is fierce
competition on price,
quality, uniqueness,
and innovation from
other EU member
states.
Data and Information Sources: Trade Data Monitor,
industry experts, company websites
Contact: FAS The Hague, a[email protected]ov
2
SECTION I. MARKET OVERVIEW
Population and Key Demographic Trends
At the end of 2023, the Dutch population is expected to total 18 million, and is forecast to continue to
grow by over 100,000 people annually to 19 million in 2034. The population growth is mainly due to
immigration and increasing lifespans. By 2050, roughly a quarter of the population will be 65 years and
older. Not only is this group of consumers growing, but they are also expected to be more affluent, more
active, and more experimental with food than ever before.
About half of the Dutch population currently lives in cities and the overall trend of moving to urban
areas is expected to continue. Between 2024 and 2034, the Dutch population will grow by another
million, of which three-quarters are expected to be born in cities. The population of Amsterdam alone
will grow by 150,000 and have more than 1 million inhabitants in 2036. Currently the mean population
density is 517 inhabitants per square kilometer, making the Netherlands the second most densely
populated country, after Malta, in the European Union.
In 2023, there were 8.3 million households, of which 3.3 million were single-person households. This
means that 18 percent of all residents have a single-person household. On average, 2.12 people live in a
Dutch household, while sixty years ago the average household size was 3.52. Single-person households
now account for 40 percent of all households, and this number is expected to continue to rise. In
Amsterdam, 55 percent of all households are already one-person households. The aging Dutch
population is expected to want to live independently for as long as possible. At the same time, over half
of the people who live alone have never been in a long-term relationship and are not planning on doing
so. An older and more individual population that increasingly lives in urban areas is expected to lead to
an increased demand for innovative products, smaller portions, healthy and nutritious food options,
functional foods, and affordable convenience.
Economy Size, Purchasing Power, and Consumer Behavior
The Netherlands in a Nutshell
The Netherlands is a small country in Error! Hyperlink reference not valid., bordering Error! Hyperlink
reference not valid. to the east, Error! Hyperlink reference not valid. to the south, and the Error! Hyperlink
reference not valid. to the northwest. The largest and most important cities in the Netherlands are Error!
Hyperlink reference not valid., Error! Hyperlink reference not valid., Error! Hyperlink reference not valid., and
Utrecht, together referred to as the Randstad. Amsterdam is the Error! Hyperlink reference not valid.,
while Error! Hyperlink reference not valid. is home to the Dutch seat of Error! Hyperlink reference not valid.
and Error! Hyperlink reference not valid.. The Netherlands' name literally means "Error! Hyperlink reference
not valid.," influenced by its low land and flat geography, with only half of its land exceeding one meter
Error! Hyperlink reference not valid..
Dutch Traders are Key in Distributing U.S. Exports Throughout the EU
The Netherlands is the largest importing country within the European Union (EU) and continues to be
the second largest exporter of agricultural products in the world, after the United States and before
Germany. These exports include agricultural products produced in the Netherlands and imported
products that are re-exported, often after sorting, repacking, or further processing. The port of Rotterdam
is the world’s 11
th
largest seaport and Amsterdam Schiphol is Europe’s fourth largest airport. Two of

3
Europe’s largest rivers, the Maas and the Rive, run via the Netherlands to the North Sea. Moreover, the
Netherlands has an excellent rail, river, and road infrastructure.
The GDP of the Netherlands is estimated at $1,021 billion, or $57,039 per capita. The Dutch
Netherlands Bureau for Economic Policy Analysis, or CPB in Dutch, publishes the most recent figures
and forecasts about the Dutch economy, purchasing power, unemployment rate, and other national
statistics. More detailed information about the Dutch consumer market and consumer behavior can be
found Sections II and IV.
Overall Business Climate
The fundamental strengths of the Dutch economy continue to be the Netherlands’ stable political
climate, highly developed financial sector, strategic location, a well-educated and productive labor force,
and high-quality physical and communications infrastructure. On September 19, 2023, or Budget Day,
the caretaking government presented its plans in the Budget Memorandum. These plans should lead to
an improvement in the purchasing power of those with lower incomes and prevent an increase in the
number of people below the poverty line. Since the measures are funded by increases in the financial
burden, the government deficit remains unchanged, compared to earlier projections. Additional
information on the overall business climate in the Netherlands can be found on the website of the CPB
at: Error! Hyperlink reference not valid.. On November 22, 2023, general elections were held to elect the
members of the House of Representatives, followed by the process of cabinet formation.
Table 1. Advantages and Challenges U.S. Exporters Face in the Netherlands
Advantages (U.S. supplier strengths and
market opportunities)
Challenges (U.S. supplier weaknesses and
competitive threats)
Local traders and food processors prefer to
work with U.S. suppliers because they are
professional and deliver products with a
consistent and high quality. U.S. companies
also have a great variety of products to offer.
Growing demand for single-portion packaged
food products. U.S. companies tend to
manufacture packaged food in larger
packages. A standard U.S. label on food
products fails to comply with EU labeling
requirements.
Growing demand for food products with a
special claim, certification, and sustainable
production methods. U.S. farmers have a
good story to tell about sustainability, their
supply chain (farm to table), and their
State/regional heritage (provenance).
The Dutch are price-conscious consumers.
Transatlantic transportation is costly.
Products from the United States are subject to
import tariffs
1
. Suppliers from other EU
member states have a competitive advantage
on tariffs and non-tariff trade barriers,
transportation costs, and transportation time.
Growing demand for comfort food,
innovative food concepts, and international
cuisine. Many U.S. products are innovative,
often trend setting, and known for their strong
brands.
Some U.S. food products suffer from a
negative perception among Dutch consumers
due to misinformation or an image issue (e.g.,
U.S. foodstuffs are considered unhealthy).
The Netherlands is the most important
U.S. beef from hormone-treated cattle,
1
Retaliatory tariffs: The WTO allowed the EU to raise additional tariffs up to $4 billion worth of imports from the United
States.

4
gateway for U.S. products to the European
Union.
poultry, and products containing GMO
derived ingredients that are not EU approved
cannot be exported to the Netherlands.
Growing demand for nutritious, fresh, and
food products that contribute to a healthier
lifestyle.
The EU has several Free Trade Agreements
that may advantage other 3rd country
competitors, including Canada and Mexico.
Fierce competition on price, quality,
uniqueness, and innovation.
Source: FAS/The Hague
SECTION II. EXPORTER BUSINESS TIPS
Local Business Customs and Trends
Most Dutch entrepreneurs speak and write in English and have a high level of education. They can be
informal, straightforward, open-minded, and experienced in traveling internationally. During a first
introduction, many may talk about their last visit to the United States, or about another occasion that
they spent time in the USA. The Dutch also engage in small talk that enables them to get to know the
other person in an informal way. They tend to communicate on a ‘first name’ basis. It is widely accepted
to communicate via email and increasingly via WhatsApp. The Dutchexpect to receive a response
quickly, or at least within 24 hours.
The Dutch are business-minded and like to be well informed about the company they are about to do
business with the product in question, price, and future business opportunities. They can be quick
discission makers. Doing business does not require ‘wining & dining.’ The Dutch preferably want to get
the job done during regular business hours since a healthy ‘work-life’ balance is important to them.
Food retailers, foodservice companies, and wholesalers normally do not buy directly from suppliers
from third (non-EU) markets, such as the United States. Instead, they work with dedicated and highly
specialized local traders. These traders have in most cases a lot of experience in doing business with
overseas producers, are informed about what documents need to accompany the goods from the United
States, and know which products or ingredients are not approved to import into the EU. They look for
long-term partnerships rather than a one-off business transaction.
General Consumer Tastes and Trends
General consumer trends that affect the Dutch food retail and foodservice market can be found in the
reports the Dutch Food Retail Market – June 28, 2023 and the Dutch Foodservice Market – September
22, 2023.
Market Research
Other exporter assistance and market research reports can be downloaded from the following website:
https://gain.fas.usda.gov/#/search.
Trade Shows
Please find below an overview of the trade shows that annually take place in the Netherlands.
Table 2. Trade Shows in the Netherlands

5
Name:
Target
Audience:
Dates:
Website:
Horecava
Foodservice HRI
industry buyers
January 8-11,
2024
http://horecava.nl/
PLMA
(Private
Labeling
Manufacturing
Association)
International
buyers of private
label products
May 28-29,
2024
https://www.plmainternational.com/
BBB & Folie
Culinaire
Local high-end
gastronomy
October 7-9,
2024
https://www.bbbmaastricht.nl/folie-
culinaire/
WBWE
(World Bulk
Wine Expo)
International
buyers of (private
label) bulk wine
November,
2024
https://www.worldbulkwine.com/en/
FFFFE (Free
From
Functional
Food Expo)
Buyers of
innovative
products with a
free from, vegan,
and organic claim
November 5-6,
2023
https://amsterdam.freefromfoodexpo.com/
Source: FAS/The Hague
SECTION III. IMPORT FOOD STANDARDS & REGULATIONS AND IMPORT PROCEDURES
Information about customs clearance, required documentation for imported products, labeling
requirements, tariff information and FTAs, and trademarks and patent market research can be found in the
Food and Agricultural Import Regulations and Standards (FAIRS) Country and Certificate Reports which
can be downloaded from the following website: https://gain.fas.usda.gov/#/search.
Most Dutch food legislation is harmonized at the EU level. Where EU regulatory harmonization is not
yet complete or absent, imported products must meet existing Dutch requirements. U.S. exporters should
be aware that national measures still exist for the choice of language, use of stickers, samples, special
use foods, vegetarian and vegan products, packaging waste management, food contact materials,
enzymes, processing aids, product registration, novel foods, fortified foods, food supplements, and
irradiated foodstuffs.
SECTION IV. MARKET SECTOR STRUCTURE AND TRENDS
Key Developments in the Food Industry
Demand for Sustainable Food Products Is Still Up
Total consumer spending on foods certified as sustainable grew by an impressive 13 percent in 2022 to
€10.8 billion (an estimated $10 billion). The share of sustainable food compared to total spending on
food is estimated at 18 percent in 2022. Sustainable food continues to be the most important growth
market in the Dutch food industry and consumption of these products is expected to continue to increase
albeit at a slower paste. This is mainly because the overall costs of living, including food prices,
continue to increase. A wider range of certified products and changing consumer preferences (paying

6
more attention to sustainability and health) explained the growth in spending on these products. More
information can be found in Monitor Duurzaam Voedsel 2022 (in Dutch).
Growing Interest in Authenticity
In addition to sustainability, consumers, and in particular Millennials and Generation Z, seem to be
willing to pay for authenticity. They are interested in hearing or reading about who produced a food
product and what the story behind the product is. This desire for authenticity also applies to foodservice
outlets. Hosts that have a story to tell about their restaurant, cafe, or bar appeal to today’s consumers.
Growing Awareness of Health and Well-Being and Demand for Nutritious Food
Consumers seem to increasingly be rushed and are struggling to do many things on a regular day.
Moreover, they a facing a dilemma: less time for buying food and preparing meals versus a growing
awareness of and interest in health and nutrition. The demand for convenient healthy and nutritious food
products (albeit at an affordable price) is growing more than ever before. Overall, consumers are more
interested in food and beverages. Beyond traditional media outlets, influencers are rapidly gaining
power. Consumers seem to trust what an influencer has to say about a product while retailers play a
crucial role as well, as they market food products to create, anticipate, and meet consumer needs.
Price is gaining Importance
The Consumers’ Association reports that during the last few months of 2022 and the first of 2023, prices
of some basic shopping items, including rice, coffee, milk, butter, and potatoes, increased by 15 percent
compared to those year ago. Although it is expected that this increase will level off in the second half of
2023, consumers are visiting multiple supermarkets in their search for the lowest price. Consumers are
also choosing more often private label products instead of A-brands and are exchanging products
between categories. For meat as an example, this means less meat (such as smaller portions), cheaper
variants (such as minced meat or chicken or less organic meat), or more vegetables instead of meat. The
number of people going to food banks has also grown by 15 percent in 2023. While sustainability,
authenticity, health, and nutrition are important purchasing factors for many Dutch consumers, price has
become the most important factor.
The following sectors offer opportunities for new sales: tree nuts, pulses, food products with a special
certification (organic, sustainable, free-from claim, etc.), healthy and nutritious food snacks, and
innovative alcoholic and non-alcoholic beverages.
Table 3. Best Consumer-Oriented Product Prospects
Commodity (HS code)
Imports,
million
USD, 2022
Imports from U.S.,
million USD, 2022
(U.S. market share)
Estimated average
annual import
growth
Bread, pastry, cakes (HS190590)
1,244
32 (3 %)
16%
Wine (HS220421)
1,337
26 (2 %)
9%
Coffee extracts (HS210111)
220
32 (15 %)
74%
Sugar confectionary (HS170490)
458
16 (3 %)
10%
Hake (HS030474)
41
4 (9 %)
143%
Peas (HS071310)
44
3 (7 %)
167%
Vodka (HS220860)
75
3 (4 %)
9%

7
Source: www.tradedatamonitor.com
Links to access retailer-specific information and expected growth rates of each sector, as well as a
qualitive assessment of the market opportunities for consumer-oriented products in the food retail,
foodservice, and food processing sectors, can be found in the reports the Dutch Food Processing
Ingredients Market – April 4, 2023, the Dutch Food Retail Market – June 28, 2023 and the Dutch
Foodservice Market – September 22, 2023.
Competitive Situation for Selected U.S. Consumer-Oriented Products
Table 4. Netherlands’ Imports of Consumer Oriented Products, 2022 figures
Product Category
(Product Code)
Imports in
Millions of USD
Main Suppliers,
By Percentage
Strengths of Key
Supply Countries
Advantages and
Disadvantages of Local
Suppliers
Craft beer
(HS2203)
Total imports:
$533
From USA: $4
1. Belgium
2. Germany
3. Poland
4. The U.K.
9. USA
59
13
5
4
1
Competition from
neighboring
countries,
dominated by
Belgium and
Germany.
Strong demand for cans,
new flavors, funky labels,
and innovative tastes.
Sweetpotatoes
(HS071420)
Total imports:
$157
From USA: $59
1. USA
2. Egypt
3. Belgium
4. Germany
37
25
8
5
Competition from
Egypt, China, and
Honduras.
The availability of fresh
and processed
sweetpotato products
continues to grow. Strong
demand for variety and
quality.
Wine
(HS2204)
Total Imports:
$1,586
From USA: $27
1. France
2. Italy
3. Germany
4. Spain
5. Chile
11. USA
30
16
14
10
6
1
France, Italy,
Germany, and
Spain have well
known, good
quality wines at
competitive prices
and are popular
holiday
destinations.
Limited commercial
availability of domestic
wines in the Netherlands.
Distilled spirits
(Product group)
Total imports:
$1,414
From USA: $129
1. The U.K.
2. Belgium
3. Germany
4. USA
21
17
17
9
Competition from
good quality
products produced
in neighboring
counties,
dominated by
Belgium and
Germany.
Strong demand for
whiskies with funky
labels, innovative tastes
and that have a story to
tell.

8
Seafood products
(Product group)
Total imports:
$5,515
From USA: $118
1. Iceland
2. Norway
3. Germany
4. Belgium
5. Denmark
14. USA
14
8
7
7
6
2
Iceland and
Norway are the
leading supplier of
cod and salmon,
respectively while
Germany
dominates Dutch
imports of pelagic
fish. The USA
dominates the
supply of Alaska
Pollack, scallops,
and wild salmon.
For shrimp &
prawns, cod, and
lobster, the USA
competes with
other non-EU
exporters.
The Netherlands is an
international trader in and
processor of seafood
products, serving
foodservice markets and
retail throughout Europe.
The Dutch increasingly
depend on imports for
Alaska Pollack, scallops,
wild salmon, shrimp &
prawns, cod, and lobster.
Beef and beef
products
(Product group)
Total imports:
$2,662
From USA: $183
1. Germany
2. Belgium
3. Ireland
4.
Argentina
8. USA
15
10
10
8
7
Germany and
Belgium sell lower
quality and price
competitive beef.
The USA exports
high quality and
grain fed beef,
known for its
consistency and
taste, to the high-
end foodservice
industry and retail
outlets.
There is not enough
Dutch beef of high quality
available. Ireland,
Argentina, Uruguay,
Brazil, and the USA all
profit from this deficit.
Condiments and
sauces
(Product group)
Total imports:
$678
From USA: $18
1. Germany
2. Belgium
3. Thailand
4. Poland
11. USA
17
14
8
8
3
Germany, Belgium,
and Poland benefit
from proximity and
being in the EU
market.
Demand for unique and
good quality products.
Walnuts
(HS080231)
Total imports: $14
From USA: $5
1. USA
2. Chile
3. France
4. Germany
36
33
13
13
Competition from
Chile and France.
Growing demand from
the snack industry.
Walnuts benefit from
their healthy reputation.
Food Preparations
(HS210690)
Total Imports:
1. Germany
2. USA
3. Belgium
17
14
14
Due to proximity,
neighboring
countries are the
Food preparations are
produced and used
throughout the EU.

9
$2,100
From USA: $294
4. U.K.
5. France
8
6
leading suppliers of
flavored or colored
sugar, isoglucose,
lactose, and
glucose and
maltodextrine
syrups.
Odoriferous
Substances
(HS330210)
Total Imports:
$585
From USA: $105
1. Ireland
2. Germany
3. USA
4. The U.K.
40
18
18
7
Odoriferous
Substances are
compounds
(natural and
synthetic) with
odors used in the
manufacture of
various non-food
and food products
and are locally
available.
U.S. suppliers are often at
a price disadvantage
compared to EU suppliers
mainly due to time,
shipping costs, and taxes.
Peptones and
Derivatives
(HS350400)
Total Imports:
$550
From USA: $99
1. USA
2. Germany
3. Belgium
4. France
18
17
15
11
Peptones are used
by producers of
food supplements
and are locally
available.
U.S. suppliers are often at
a price disadvantage
compared to EU
suppliers, mainly due to
time, shipping costs, and
taxes.
Snack food
(Product group)
Total imports:
$2,204
From USA: $46
1. Germany
2. Belgium
3. France
4. U.K.
10. USA
27
26
8
5
2
1, 2, and 3 are
close to the market
and offer good
quality products.
Demand for branded,
good quality, and unique
products that have a story
to tell.
Chewing Gum &
Candy
(Product group)
Total imports: $489
From USA: $16
1. Belgium
2. Germany
3. Spain
4. Poland
8. USA
26
22
6
6
3
1, 2, 3, and 4 are
close to the market
and offer good
quality products.
Driven by social media
there is local demand for
extra sour and extra spicy
candy and the United
States is popular.
Sugar
Confectionary
(HS170490)
Total Imports:
$458
From USA: $16
1.Belgium
2.Germany
3. Spain
4. Italy
8. USA
26
23
6
6
3
1, 2, 3, and 4 are
close to the market
and offer good
quality products.
U.S. confectionary
is known for its
unique flavors,
strong brands, and
fun packaging.
Moreover, they are
popular on social
media
Driven by social media
there is local demand for
extra sour and extra spicy
candy and the United
States is popular.

10
Bakery Goods
(Product group)
Total imports:
$2,978
From USA: 44
1.Belgium
2. Germany
3. France
4. Italy
5. U.K.
12. USA
25
24
7
7
5
1
Competition from
neighboring
countries
Growing demand for
pastry containing
chocolate or
confectionary
Source: Error! Hyperlink reference not valid.
SECTION V. AGRICULTURAL AND FOOD IMPORTS
Agricultural & Food Import Statistics
Dutch imports of U.S. agricultural and food products can be downloaded from the following website
https://apps.fas.usda.gov/gats/BicoReport.aspx?type=country. Please make the following selection:
Product Type: exports; Market Year: calendar year; Report Type: year-to-date; Country: Netherlands;
Product: agricultural & related products and Download: word.
Table 4 in this report provides an overview of the best high value consumer-oriented products prospects.
SECTION VI. KEY CONTACTS AND FURTHER INFORMATION
If you are a U.S. interested party and have questions or comments regarding this report, need assistance
exporting to the Netherlands, a list of Dutch wholesalers and distributors, or you are looking for the
Foreign Buyers Lists (FBL) of various consumer-oriented products and seafood products, please contact
the Foreign Agricultural Service in The Hague, the Netherlands:
U.S. Department of Agriculture’s Foreign Agricultural Service (FAS)
Marcel Pinckaers
John Adams Park 1, 2244 BZ, Wassenaar, the Netherlands
Phone: +31 (0)70 3102 305, [email protected], Error! Hyperlink reference not valid.
This FAS office also covers the countries in the Nordic markets and has Exporter Guides for the
following countries: Denmark, Finland, Iceland, Norway, and Sweden. These Exporter Guides can be
found on their respective country pages on the following website: https://gain.fas.usda.gov/#/search.
Additional information about promotional events taking place in Europe, U.S. trade associations active
in this market, delicious recipes with U.S. ingredients, articles highlighting U.S. food and agricultural
products, and other information can be found on Error! Hyperlink reference not valid..
Attachments:
No Attachments
