Notes
Lecture 1 – Introduction to Health Promotion
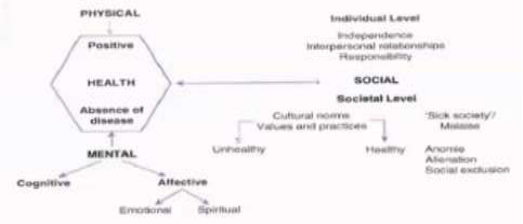
What is Health?
• “A state of complete physical, mental and social well‐being and not merely the absence of
disease or infirmity”
• “Enjoyment of the highest attainable standard of health is one of the fundamental rights of
every human being without distinction of race, religion, political belief, economic or social
condition.”
• Ottawa Charter – resource for everyday life not just the object of living
• Alma Ata – means of achieving a ‘socially and economically productive life’
• The Helsinki Statement – doesn’t state WHO’s health definition but notes needs for policies
in the health sector
Salutogenesis
• 1996 Antonovsky – concern re dichotomous classification of people
o Those who had succumbed to disease and those who haven’t
• Salutary – health enhancing rather than pathogenic – disease causing
Health and Empowerment
• Empowerment: synonymous with + health, means of attaining this, means to achieve health
equity, linked to feelings of control and a sense of meaningfulness
A Working Model of Health
• Wellbeing is the + term used for
health – viewed as opposite to
disease
• Wellbeing and disease often co-exist
Core Components of Individual Wellness
• Physical – healthy eating, physical exercise and getting adequate rest
• Intellectual – lifelong learning, applying knowledge gained and sharing it with others
• Environmental – feeling and being in a safe, clean and healthy environment
• Spiritual – having meaning and purpose
• Social – developing a sense of connection, belonging and having a positive support system
• Emotional – ability to express feelings, manage stress and adjust to change
• Financial – having a sense of control and knowledge of personal finances
• Occupational – participating in activities that provide meaning and purpose
What is Health Promotion
• Represents a comprehensive social and political process, embracing not only actions at
strengthening the skills and capabilities of individuals but also action directed towards
changing social, environmental and economic conditions, so as to alleviate their impact on
public and individual health.
• Community participation is essential to sustain health promotion action
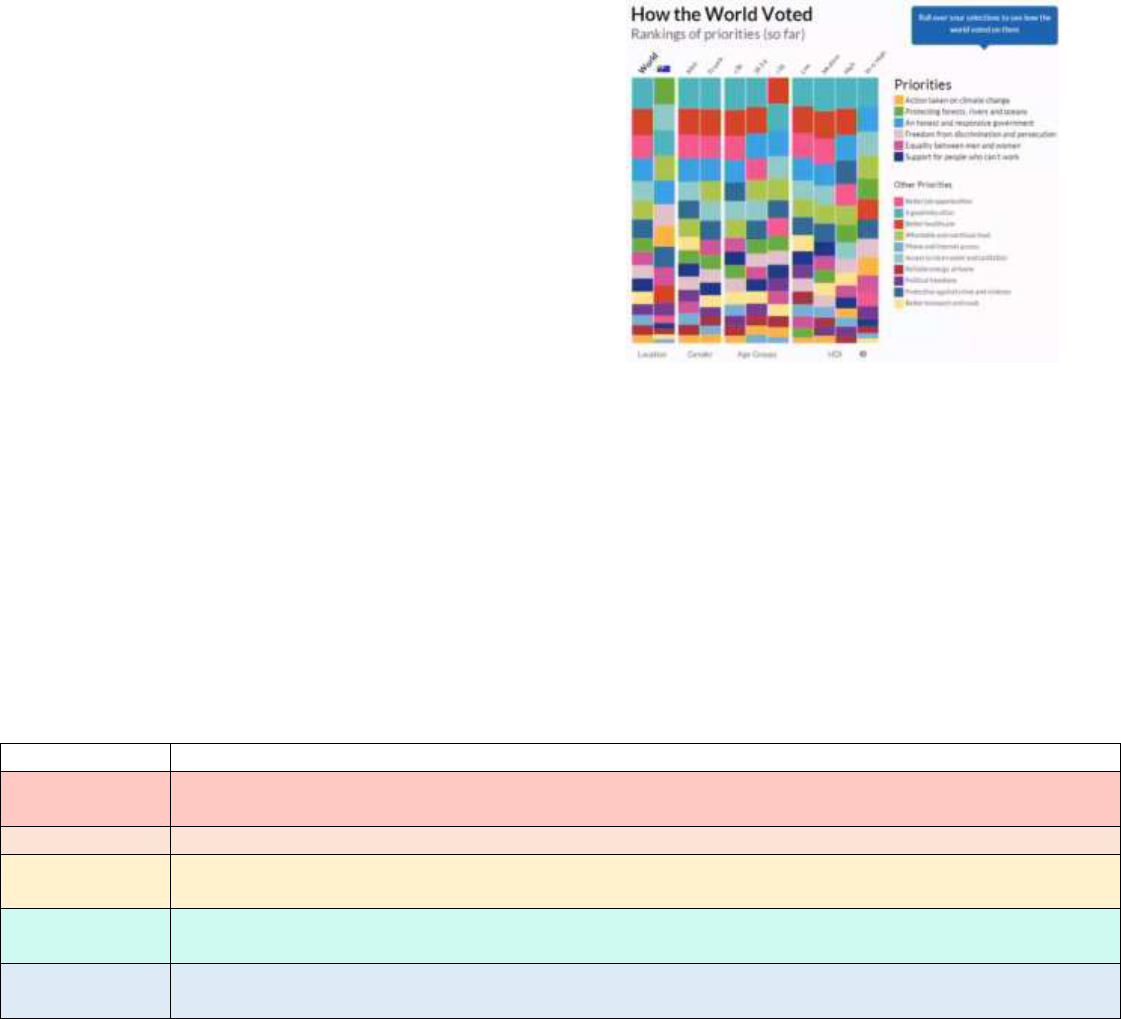
Health Priorities
• World – good education, healthcare, jobs,
good government, sanitation, food, reducing
crime, gender equality, freedom from
discrimination
• Australia – protecting nature, education,
sanitation, food, government, climate change,
equality, better health care
Settings of Health Promotion
• “Health is created and lived by people within the settings of their everyday life; where they
learn, work, play and love” – Ottawa Charter 1986
• Includes: schools, community, work, health care, city and rural
Social Determinants of Health
• Income/SES, education/ literacy, social support networks, employment, social environments,
physical environments, health practices, child development, genetics, health services,
gender, culture
Lecture 2 – Health Promotion Charters and Milestones
History of Health Promotion
Era
Events
Ancient Greece
Medical and philosophical documents from 4th and 6th century - Greeks developed the physiocratic
school of thought
19
th
Century
Public health measures – mostly European & British initiatives, e.g. Roman public baths
1950s
Emphasis on technology and disease specific campaigns e.g. smallpox), new drug breakthroughs and
Soviet withdrawal from United Nations, US officials reluctant to emphasise a social model of health
1960s
Established community-based health programs (CBHP) to meet the needs of disadvantaged, health
education and disease prevention
1970s
International health planners began to advocate for CBHP approach - Mahler, WHO Director-General,
proposed Health for all by the Year 2000 in 1976
Health for All By 2000 – 1977
• WHA 1977 decided that the main social target of the WHO and governments that all people
by 2000 should attain a level of health that allows them to lead socially and economically
productive lives
• Removal of obstacles – elimination of malnutrition, ignorance, contaminated drinking
water, unhygienic housing and lack of medical resources

Alma Ata Declaration 1978
• Brought health promotion concepts to a global arena, reaffirms definition of health as a
fundamental human right – attainment of highest possible health for all is the main goal
• Health inequities are unacceptable, primary care focused – government responsibility to
provide adequate care
• Urgent action needed by all governments and communities to promote world health –
informed future thinking e.g. holistic health and health as a major social goal
1984 WHO Document
• Upstream approach, involves whole population – responsibility for health, variety of macro
scale approaches, public participation, role of HCP for advocacy
• Issues: over emphasis on individual responsibility
Charters
Charter
Outcomes
Ottawa Charter (1986)
1
st
International health conference of health promotion, designed to achieve HFA 2000+, not
only individual focused but act to create socio-political, health and legislative environments
that supports + changes. Strategies – enabling – downstream, individuals achieving fullest
health potential, mediating – GO & NGO and industry to achieve coordinated action,
midstream, advocating – upstream, conditions favourable to health; Actions – build public
health policy, reorient health services, strengthen community action, create supportive
environments & develop personal skills
Adelaide Conference (1988)
Healthy public policy – health choice = easy choice, accountability for health underprivilege,
alliance development, commitment to global PH – Action areas: supporting women’s health,
nutrition, tobacco, alcohol & creating supportive environments → needs advocates
Sundsvall Conference (1991)
Importance of social environments that the influences of social norms & culture on behaviour
– policy and decision makers, community activists and individuals
Jakarta Declaration (1997)
Draws upon a variety of sources to address SDH’s in the 21
st
Century – Priorities: promote
social responsibility, ↑ investments for health development, expand health partnerships,
increase community capacity and empowerment, secure HP infrastructure
Mexico Ministerial
Statement (2000)
Promotion of SDH – Actions: HP as priority, active participation of all sectors, support prep of
country wide plans for HP, establish global networks, advocate UN agencies to be accountable
for their health impact & inform the director of WHO
Bangkok Charter (2005)
Builds upon OC – affirms that policies and partnerships to empower communities and health
equity must be at the centre of national development. Actions: advocate for health, invest in
sustainable policies to address SDH, build capacity for HP practice, legislate to ensure equally
opportunity for health, partner and build alliances to create sustainable actions. Make HP:
central to global development agenda, governmental responsibility, community focus,
requirement for good corporate practice
Nairobi (2009)
1
st
conference in Africa, empowering – emphasis on NCD’s in low SES countries
Helsinki (2013)
Health in all policies – gov has a responsibility for the health of their people fulfilled by the
provision of adequate health and social measures, provided a framework for country action
Shanghai (2016)
Healthy cities declaration: addressing pollution, GBV, child development, smoke-free cities –
agreement to embed health in policy, promotes community engagement through schools and
work to advance health

Ottawa Charter example – Sun protection strategy
• Build healthy public policy – “No hat, no play” policies, advocating to establish conditions
favourable to health
• Reorienting health systems – community health nurses to include sun protection in their
work, Dep. of Sport & Rec to prioritise sun protection for outdoor sport
• Strengthen community action – working with school groups to lobby the Dep. of Education
for the inclusion of ‘shade structures’ in the design of new schools
• Create supportive environments – increase school shading via tree planting, utilise portable
marquees at swimming carnivals
• Develop personal skills – educating sun protection behaviours through group programs
WHO Health Promotion Glossary
Term
Definition
Disease Prevention
Prevent occurrence of disease and reduce its consequences – primary prevention focuses on
preventing initial occurrence, secondary and tertiary seeks to arrest existing disease
Health Education
Opportunities for learning to improve health literacy to improve health
Public Health
Promoting health, preventing disease, and prolonging life via organised efforts of society
Primary Health Care
Essential HC made accessible at a $ a country and community can afford
WHO New Health Promotion Terms
Term
Definition
Burden of Disease
Measurement of the gap between a population’s current health and the optimal state where all
people attain full life expectancy without suffering major ill-health. Loss of health in
populations is measured in DALYs
Capacity Building
Development of knowledge, skills and leadership to enable effective health promotion
improving health at 3 levels: knowledge advancement, the expansion of support for HP in
organizations and the development of partnerships for health in communities
Evidence Based HP
Use of information derived from research to identify causes and to health needs and the most
effective HP actions to address these in given contexts and populations
Global Health
Refers to the transnational impacts of globalization upon SDH and health problems which are
the beyond the control of individual nations
Health Impact Assessment
Combination of procedures, methods and tools by which a policy or program may be judged
concerning its effects on the health of the population
Needs Assessment
A systematic procedure for determining the nature and of health needs in a population, the
causes and to those needs and the human and community resources which are available to
respond to these
Self-Efficacy
Refers to beliefs that individuals hold about their capability to carry out action in a way that will
influence the events that affect their lives
Social Marketing
Application of commercial marketing technologies to the analysis, PME of programs designed
to influence the behaviour of target audiences to improve the welfare of everyone
Sustainable HP Actions
Those that can maintain their benefits for populations beyond their initial stage of
implementation. Sustainable actions can continue to be delivered within the limits of resources
and participation by stakeholders
Wellness
Optimal state of health of individuals and groups - 2 concerns: the realization of the fullest
potential and the fulfilment of one’s role expectations in the family and other setting

Lecture 3 – Health Promotion Concepts & Strategies
Approaches to Promoting Health
Biomedical
Behavioural
Socio-Environmental
Focus
Individuals with unhealthy
lifestyles
Individuals & group conditions
Communities and living
environments
Definition of
Health
Absence of disease & disability
Practice of healthy behaviours
e.g. healthy eating
Strong relationships, feeling of
ability to achieve goals and control
Definition of
Problems
Disease categories &
physiological risk factors e.g.
cancer
Behavioural risk factors e.g.
smoking & alcohol abuse
Socio-cultural risks e.g. poverty,
psychosocial risks e.g. isolation,
equity is key
Main strategies
Illness care, screening,
immunisation, medical
management
Mass media behaviour changes,
social marketing, advocacy
Encouraging community
empowerment, political action &
advocacy
Success criteria
↓ in morbidity, mortality &
physiological risk
Behaviour change, ↓ in risk
factors for disease
↑ individual control, stronger social
networks, ↓ in inequities
5 Levels of the SEM
• Intrapersonal – individual characteristics that influence behaviour – knowledge & skills
• Interpersonal – processes and groups providing identity and support
• Organisational – rules, regulations & policies constraining or promote behaviours
• Community – community norms and regulations
• Public Policy – policies and laws that regulate or support healthy practices
3 Pillars of Harm Minimisation
National Drug Strategy 2017 – 2026
• First Australian long-term framework for reducing and preventing harms of D&A
• Principles of partnership, coordination and collab, national direction and implementation,
evidence-informed responses – Nation Tobacco Strategy sits under this framework
Nine Priority Areas for Tobacco Control
• Protect public health policy, strengthen mass media anti-smoking campaigns, continue to ↓
affordability of tobacco, build partnerships to ↓ smoking % in ATSI people
• Strengthen efforts of smoking reduction in high prevalence populations, eliminate remaining
advertising, further regulation of the contents, reduce exceptions to smoke-free workplaces
• Provide greater access to a range of evidence-based cessation services to support quitting
Health Impacts of Smoking
• 8.3% of smokers had an excellent health rating compared to 22% never smokers
Demand Reduction – preventing
the uptake of alcohol/tobacco
and reducing its misuse
Supply Reduction – preventing/
stopping the supply of illegal
drugs
Harm Reduction – reducing the
adverse health & SE impacts of
drug use in the community

• More treated for mental illness 28% vs 12% - most preventable cause of ill health in Aus
• Risk factor for: CHD, stroke, PVD, cancer (16 types)
Smoking Trends
• Declining rates: 21% in 2004-05 vs 13.8% in 2017-18, teens 5% in 2013 v 2% in 2016
• Daily smoking low SES – 20% in 2013 vs 18% in 2016 – majority are 40-49 yo
• Missing data – why people quit, prevalence in homeless, relationship on household smokers
• Ads used to encourage smoking vs anti-smoking ads and Quitline → behavioural approach
Historical Australian Achievements
• Ad bans, harm reduction – nicotine testing, pack warnings, mass reach campaigns in 70’s,
civil disobedience – graffitied billboards, smokeless tobacco – banned in 1986
• Small packs banned, tax, replacement of sponsorship, clean indoor air – smoke-free
environments, graphic packet warnings – plain packaging, e-cig warnings
5 different Approaches to Health Promotion
Aims
Methods
Evaluation
Preventative
Medical
↓ morbidity & mortality,
freedom from disease, tri-level,
uses epi & top down, ignores +
health & SDH
Screening – cholesterol, cancer;
immunisation – smallpox, polio;
relies on – experts, resources
Links to study aims - ↓ in disease
% and associated mortality
Behavioural
Encourages individuals to adopt
healthy behaviours – health as
the responsibility of individuals
Individual focused, education,
persuasion; expert led – top down,
targets risk factors e.g. smoking
Long term behaviour change,
difficult to isolate change as
attributable to a HP intervention
Educational
Provide education, develop
decision making skills,
assumption that ↑ knowledge =
behaviour change
Cognitive – info; affective –
attitudes; behavioural – skills
↑ in knowledge – does it result
in behaviour change – critique of
health education pedagogy &
andragogy
Empowerment
Bottom-up, people identify
their own concerns, self &
community empowerment
Client centred, advocacy, self-care,
community development
Long term, difficult to determine
reason for change, need to
include qualitative methods
Social Change
Bring changes in all
environments to enjoy better
health, health choice = easy
choice, societal change
Top-down, organisational, shaping
health environment through
advocacy, $ measures, creating
supportive environments
Legislation, organisational or
regulatory changes
Minkler’s 10 Commitments for Community Health Education
• Start where the people are, build on community strengths, honour thy community, foster
high level of community participation, laughter = medicine and good health education
• Health education is also political, don’t tolerate bad ‘isms’, think globally act locally, foster all
empowerment, work for social justice
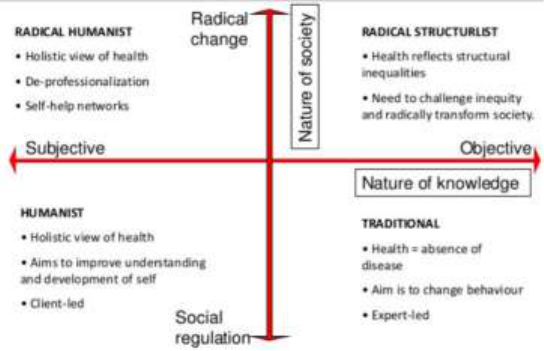
4 Paradigms of Health Promotion & Beatte’s Health Promotion Model
Lecture 4 – Health Promotion Settings & Strategies
Health Behaviour
• Health Behaviour – belief that to be healthy for the purpose of preventing health problems
• Illness Behaviour – feels ill for the purpose of defining that illness and seeking relief from it
• Commonly used definition – “systematically organised knowledge applicable in a variety of
circumstances devised to explain the nature of behaviour of a specified set of phenomena
that could be used as the basis for action”
Health Promotion Theory
• Factors influencing phenomenon of interest and their relationships, conditions in which they
do or don’t occur – how, when and why of relationship
• Not all HP programs are = successful, roadmap for studying problems and developing
appropriate interventions, explains health behaviour and how to change them
• HPPME Cycle – problem definition → solution generation → resource mobilisation →
implementation → impact assessment → intermediate assessment → outcome assessment
• Most success when SDH are understood, needs of target population are addressed, context
has been considered
• Programs that use theory explains needs of target population and understands its problems,
evidence informed methods used to monitor program, explains how to change health status
• Origins – most HP theories come from social sciences, HP is a new science and the use of
theory hasn’t been as rigorously tested vs other sciences
Intrapersonal Theories
• Classical Conditioning – oldest model of behaviour change, associative learning – a neutral
stimulus elicits a response originally elicited by another stimulus
o Ivan Pavlov and his dogs – dogs were conditioned to salivate when bell was rung at
the same time as feed – when bell rung even with no food the dogs would salivate
o Implications – people are highly responsive to cues in their environment, effective
self-help includes changing the environments and reactions to it
• Operant Conditioning – probability that a response will occur is based on the consequences
of that response, applying and removing + and – stimuli to ↑ or ↓ behaviours
o + and – reinforcement – increases the behaviour e.g. laughing at jokes, punishment
by application and withdrawal ↓ the behaviour
Settings Approach
• Emerged in the 80’s, seeks to make systematic change to whole environment, builds concern
for health into the fabric of the system
• Definition: “Where people shape the environment create or solve problems relating to
health. Identified as having boundaries, a range of people and an organisational structure”
• Endorsed in Jakarta and Nairobi, European HFA policy – “by 2015 people in the region
should have greater opportunities to live in health environments at home and elsewhere”
Key Questions for Working in Settings
• Access – accessible target group, no. of people reached, ease of reaching them
• Philosophy & purpose – does the institution have a philosophy or goal
• Commitment – how committed is the institution to the philosophy of its aims
• Credible – credibility of institution and public response to them
• Competence – do health educators have the knowledge and skills to promote learning
Settings
• Introduce interventions to create healthy working and living environments
• Develop health policies, implement health into evaluation procedures to build evidence of
how health can make the system perform better
Healthy Cities
• Launched by WHO in 1988 to operationalise the Ottawa Charter – originally a small project,
there are 1400 healthy cities in Europe
• Engaged Local Govt. through political commitment, institutional change, capacity-building,
partnership-based planning and innovative projects
• Healthy setting – not straight forward discrete entity, who is ‘left out’ of a settings
approach, privileges some settings over others
• Avoid ↑ the health gap in society by addressing marginalised groups & consider more
challenging settings
• Chicago – purchases property to use as community gardens, NYC rooftop gardens
Australian Healthy Cities – Key Themes
• Managing population and economic growth, climate change adaptation, managing CD
outbreaks, PH management - immunisation, bio security and food safety
• Waste reuse Technologies, what the future looks like, managing natural resources, city
design - encourage physical activity and healthy cities
• Disaster management - public welfare - managing legislation and policy
• Onkaparinga – encourages community participation, supports community groups,
environmental involvement, lobbying for new services
• Illawarra – promotes to improve health and quality of life of community
Prisons – New Setting

• Socially excluded and ↑ % of ill health, barriers – HP involves free choice, boredom ↑ risk
behaviours, toxic prison culture, potential – access to prisoners, risk takes and impact family
• Ecological framework – need to connect to settings and beyond to promote health
Tutorial
Diffusion of Innovation
• Everett Rogers 1962 – explains how and why new ideas spread – 5 groups
1. Innovators – learn and adopt an innovation, risk takers, introduce innovations to the
larger population by sharing experiences
2. Early adopters – respected as opinion leaders, plays a key role in ‘crossing the
chasm’ – innovation adoption bridges gap between trendsetters & majority
3. Early majority – takes time to decide, observant, will only adopt if benefits are
perceived and is the new status quo
4. Late majority – resistant to change, responsive to peer pressure, requires testing
and wide usage before trying
5. Laggards – highly resistant to change, hard to reach due to minimal media, wait until
completely mainstream or don’t
Lecture 5 – Health Promotion Theories & Models
Transtheoretical Model
Stage
Definition
Precontemplation
Old behaviour, include unmotivated persons, behaviour change is not considered
Contemplation
Awareness of existing issue, behaviour change is being considered
Preparation
Good candidates for patient education programs, taking smalls steps towards behaviour change
Action
Begun to modify their behaviour, initial modification of behaviour
Maintenance
Likely to revert to old behaviour, behaviour is stabilised and becoming more routine
Termination
Point reached of 0 temptation and 100% self-efficacy
Health Belief Model
Concept
Definition
Potential Change Strategies
Perceived
Susceptibility
Belief regarding the chance of getting a
condition
Define population at risk and tailor information on
an individual’s behaviours, help them develop an
accurate perception of their own risk
Perceived Severity
Belief of seriousness a condition and its
consequences
Specify consequences of the risk and the conditions
Perceived Benefits
Belief in the efficacy of the advised action to
↓ risk of impact
Define action to take, clarify the positive effects to
be expected
Perceived Barriers
Beliefs about the psychological costs of
taking action
Offer reassurance, incentives, and assistance,
correct misinformation
Cues to Action
Strategies to activate one’s “readiness”
Provide info, promote awareness, media campaigns
- advice from others, illness in family/friend
Self-efficacy
Confidence in ability to take action
Provide training, in performing, use progressive goal
setting, give verbal reinforcement, reduce anxiety
Social Cognitive Theory

Concept
Definition
Implications
Reciprocal
determinism
Person, behaviour, and the environment in
which the behaviour is performed
Multiple avenues to behavioural change – skill,
environmental and personal change
Outcome
expectations
Anticipatory outcomes of a behaviour
Model + outcomes of healthful behaviour
Self-efficacy
Person’s confidence in performing a particular
behaviour and overcoming its barriers
Approach behaviour change in small steps to
ensure success; seek specificity about change
Collective Efficacy
Beliefs about the group’s ability to perform
concerted actions that bring desired outcomes
Parent groups who organise and advocate other
changes to ↓ teenage alcohol abuse
Observational
Learning
Behavioural acquisition by watching the
actions and outcomes of others’ behaviour
Credible role models of the targeted behaviour
Incentive
Motivation
Use and misuse of rewards and punishments
to modify behaviour
Laws prosecuting teenage smokers have
unwanted effects, taxes can deter tobacco use
Facilitation
Tools, resources or environmental changes
that make new behaviours easier to perform
Distributing condoms at no $, business assistance
to help women escape prostitution
Self-Regulation
Controlling through self-monitoring, goal
setting and enlistment of social support
Computerised self-management training for
asthma patients.
Moral Disagreement
Thinking about acceptable harmful behaviours
by disengaging moral standards
Dehumanisation and of responsibility influence
aggression that harm public health
Summary of Theories and Models
Approach
Theories or Models
T&M that explain health behaviour and change by focusing
on the individual
HBM, SCT, transtheoretical model and theories of reasoned
action and planned behaviour
Theories that explain change in terms of communities and
communal action for health
Community mobilisation and diffusion of innovation theory
Theories that guide the use of communication strategies to
bring about behaviour change to promote health
Health literacy model, behaviour change theory and social
marketing theory
T&M that explain how to influence change within
organisations and create health-supportive practices
Organisational change theories, intersectoral action models
T&M that explain the development and implementation of
healthy public policy
HIA, evidence-based policy making to promote health
Bobo Doll Experiment
• Albert Bandura 1961 – filmed female student being aggressive to an inflatable doll
• Film was shown to kindergartners mimicked the aggression- modelling & imitation.
• Importance: no reinforcement etc, which went against establish behavioural theories
Lecture 6 – Assessing Dietary Intake & Validity/Reliability
Why are we Interested in what People Eat?
• Identifying nutrient risks, monitoring food trends, policy development
• Evaluating of nutrition promotion, studying diet-disease relationship
• Decadal plan for the science of nutrition – considers SDH and policy level
What is dietary Methodology?
• Study of the tools used to measure a person’s dietary intake - dietary analysis
• Common types – FFQ, 24-hr recall, diet history, FR → never 100% accurate

Dietary Assessment Tools
Tool
Definition
Advantages
Disadvantages
FFQ
Retrospective, questionnaire of usual intake,
based on defined food groupings, based on
defined time
High response %, fast and
easy, can be self-
administered, food patterns
Limited no. of foods, low
accuracy, memory reliant,
burdensome
24-hr recall
Recall of food & bev intake in last 24-hrs, uses
descriptors, Automated Pass Method: quick
list, forgotten foods, time & occasion, detail
cycle, final probe – can be self-reported
Fast, $, short term, snapshot
of intake, may limit reactivity
Omits occasional foods,
memory reliant
Diet history
Retrospective, usual intake, 1 week to 1month
intake, performed by skilled dietitian, quick
Not literacy dependant,
covers more time
Memory reliant, interviewer
skills, time-consuming
Food Record
Prospective, actual intake, estimated or
weighed, gold standard in research
Actual intake, accurate in
WFR, non-reliant on memory
Wrong measurements, time-
consuming, intake variations
Selecting a Dietary Assessment Tool
• Purpose – what is being measured, precise detail, short term or long term
• Participant – life stage, memory, literacy; researcher – time and resources
• Population – FFQ, 24-hr recall, 3-WFR; Case study – diet history, WFR
Tutorial
Validity
• Accuracy – the ability of an instrument to measure what it is intended to measure
• Content Validity – important aspects of interest intended to measure
o Face validity – are untrained individuals happy with the content validity
o Curricular validity – are trained professionals happy with the content validity
• Construct validity – measure the theoretical construct it is intended to measure
• Criterion validity – comparison to the “gold standard”, e.g. doubly labelled water
• Relative validity – comparison to another tool, e.g. 7-day WFR
Reliability
• Reproducibility – ability to provide consistent results under different conditions
• Test-retest – same result on two separate occasions
• Inter-rater – Do different people rate the same performance
Lecture 7 – Energy Expenditure & Food Composition Databases
What is Energy Expenditure?
• Energy an individual requires to sustain life, digest food, and perform physical activity
• Reasons: core to the nutrition profession – dietary prescription:
o Individual level – disease states, weight management, athletes, life stages
o Group level – policies – food Industry, product development
Components of Energy Expenditure
Components
Description

Basal Metabolic Rate (BMR)
Sum total of minimal activity of all tissue cells of body under steady-state conditions: EE
after 12 h fast while at rest in thermoneutral environment, awake, without disease.
Resting energy expenditure (REE) is used: taken after 30 mins rest, REE ~ 65-75% EE, REE
reflects fat free mass: sex, age weight
Thermal Effect of Activity
2nd largest contributor and the most variable, ~20-35% of daily EE – proportional to type
of activity, includes exercise and involuntary activity
Thermic Effect of Food (TEF)
Ingestion of food causes an ↑ in EE over several hrs, TEF ~ 7 – 10% 24hEE: Changes in EE
in response to food eg E used for – nutrient absorption and metabolism, dietary induced
thermogenesis (DIT): longer term effects of diet on EE eg ↑ BMR by overfeeding
Thermic Effect of Injury or
Disease (TED)
‘Hypermetabolic states’ of relevance in clinical practice, TED – certain ‘trauma’ may ↑
metabolic rate, tumours and burns to skin: physiological stress ↑ with surgery, burns,
trauma, often expressed as BMR x injury factor (IF)
Other Influences on EE
• Thermogenic stimuli: caffeine, smoking, drugs, psychological stress, menstruation,
hypo/hyperthyroidism, body size, genetics
Direct Calorimetry to Express EE
• Measures heat produced: all E liberated by a person during oxidation will eventually be
released as heat, which is measured directly
• Procedure – Subject confined to insulated chamber or water-cooled garment
o Continuous measurement of heat produced eg 24 h
• Expensive, difficult, rarely used in humans
Indirect Calorimetry to Express EE
• Energy metabolism depends on O
2
utilisation (VO
2
) and CO
2
production (VCO
2
)
• EE: vol of expired air and difference in O
2
and CO
2
concentrations in inspired and expired air
• Urinary N is measured (protein metabolism) → substrate utilisation can also be calculated –
Eg. fat oxidation
Examples of Indirect Techniques
Technique
Description
Ventilated Hood (BMR, REE)
Measures in and outgoing air; conditions – gold standard: accurate estimate of resting EE
based on measurement of O
2
and CO
2
, awake and at rest, fasted, 22-24°C , airtight hood,
allows expired air to be collected without mask or mouthpiece = $$$$, limited portability
BodyGem (BMR, REE)
Measures O
2
consumed, client holds unit while breathing through mouthpiece, digital
readout of REE in kcals/d – quick & easy
Respiration Chamber
Excellent environment to study human energy balance, study subjects in a controlled
environment. Exact measurement of food intake, metabolic cost of activities can be
measured, response in EE and/TEA to certain diets - $$$, not commonly available
Doubly Labelled Water (DLW)
• Non-Calorimetric measurement - uses 2 non-radioactive isotopes of water to estimate
production of CO
2
• Increasing isotopes present in water → collects urine for 10 – 14 days → isotopes measured
in urine →
18
O is lost via body water and CO
2
,
2
H is lost via body water

o
18
O (body water and CO
2
) -
2
H (body water) = CO
2
production
• Advantages – accurate, free living, measures EE in a wide range of groups, info on EE for 4 -
20 days
• Disadvantages – no estimate of fuel utilisation, $$$$
• Used for validation of techniques to assess dietary intake and physical activity
How and why do we estimate EE
• Not always possible to measure, EE = energy intake in weight maintenance
o People do not always truthfully report what they eat, may want to change weight
o May not be able to communicate, looking at a group level
• Regression equation including weight ± height, age, sex or other factors
• Equations are developed by measuring BMR and factors that may predict it
• Using least squares regression, an equation is developed based on a straight line: y = b + mx
Equations
Equation
Description
Advantage
Disadvantages
Harris Benedict (1919)
Showed both Wt and Ht
were independent predictors
Simple & popular, widely
used with N Am clinicians
Historical 1919 dataset, mainly
young & lean, BMI 21.5kg/m2,
overestimates REE (10 - 15%),
constant was 10 x higher in F than
M (278 vs 2741)
Mifflin St-Jeor
Used commonly in weight
loss clinical trials
Subjects normal, overweight
and obese, able to estimate
within 10% for 82% of cases,
endorsed by American
Dietetic Association
May not be suitable for leaner
individuals
Schofield
Reviewed previous literature
on BMR and produced
predictive equations for both
sexes for range of ages from
1-3 y to > 60 y
International standard,
requires only wt, age,
gender, can allow for disease
states, recommended by
British Dietetic Association
Mostly male subjects, mainly
European & N Am subjects
(army), relevancy??
Oxford
Based on Schofield –
included data from tropical
regions
Includes younger and older
subjects, more rigorous
selection criteria
-
Other Equations
• Needs: older adults, culturally diverse, overweight and obese, changes in workforce
• Need to check the equation is valid in population
• General equations not valid in diseases where body composition abnormal – athletes
Australian Food Composition Databases
Databases
Description
NUTTAB 1995 & 2010
Mainly analytical data for Australian foods, generic foods and staples, limited range of
nutrients, minimum imputed or imported data. NUTTAB 2010 - new data: fatty acids, trans
FA’s, game meat; 245 nutrients per food, some older data removed

AUSNUT 2011-13
Based on NUTTAB, expanded to include branded food matches, complete set of nutrients
for each food: avoid underestimates of intake, missing values imputed; includes extra
nutrients eg iodine, caffeine, LCFA’s
Aus Food Comp Database
Considered to be a reference database, 1,534 foods (old data largely removed), only small
portion of data from other sources: recipe calculations, food labels, imputing – Up to 256
nutrients per food
New Data
• Public Food Key – replaces food ID from previous databases, remain consistent across
databases, matching file for alignment with older data
• New food data – update existing data for highly consumed foods, foods not previously
included, inclusion of industry data, inclusion of trans fat data, new food info
• Recipe file updates – recipe key, ingredient key, now contains weight change data, retention
factor ID
• Moving from /100g – data shown as per 100g and in common measures, some liquid food
shown in g rather than mL
Indigenous Food Data
• Most analytical data derived in 90s, formed separate file for NUTTAB 2010
• To provide core nutrient data → increased borrowed/calculated data
o Not included in Release 1
• Nos. come from: composition of Australian Foods (COFA), unpublished data commissioned
by FSANZ, scientific literature, industry data • British, NZ and US food composition tables
• 7 indigenous foods on food details file
Sampling and Variability
• Can’t analyse some foods – sampling should be: representative, avoid convenience samples,
cover a range of products and selection strategy required
• Food of biological origin – seasonal differences, soil composition, climate, natural variation
• Manufactured food – storage conditions, manufacturing processes, recipe formulations,
combining of food items
• Food is sampled as a recipe – ↑ variability from amount of ingredients added, cooking
times/techniques, composite dishes – variation may occur in insects & wild caught animals
• Unchanged – reference quantity of foods in a database: globally recognised
o Some databases may additionally show per serve values
o Nutrient definitions – INFOODS tag names = standardised system to ID nutrients
used in a database
• Cheaper calculations – Variability nutrients need to be prioritised, $ are per nutrient and all
need to be analysed in triplicate → honeypot ants don’t represent all insects
Atwater Factors
• Atwater Factors = metabolisable energy per g of macronutrient
o metabolisable energy = gross energy – losses in faeces + urine

• Energy for a food is calculated by – analysis of water and macro content (P, F, CHO) in food,
multiplying macronutrient content of food in g by the appropriate factor
• Fibre: proportion is fermented in colon to SCFAs which are absorbed & oxidised for energy
o Overall, fibre provides half the energy of CHO ie ~8 kJ/g
o Energy from fibre was not always included in current AU databases
• Calculation: {(P x 17) + (F x 37) + (CHO x 16)} / 100g
Knowing which data to use
• NUTTAB – reference database, analytical data, variable nutrients, incomplete data
• AUSNUT – survey data base, complete data, variable nutrients, based on NUTTAB
• Vary – timeliness, food inclusions, info specificity, completeness – limited insect data, only 7
indigenous food types
Uses of Food Composition Data
Use
Description
Core food group development
Modelled as: fruit, green veg, poultry, starch, etc. – based on composition
Dietary Modelling
Research – basis for participants to be consuming, may be personalised
Recipe (composite foods)
Broken into ingredients and apply factors to determine final composition
Addressing User Concerns
• Users don’t recall food composition, user based on resources, data accuracy and reliability
• Common confusion – database use, framework, food classification, data derivation
• Drawn to food labels – variations in nutrient comp, limited nutrients included, food subs can
impact comp, no composite food info, based on an average of data accumulations
Reporting Outcomes
• Terms – presumed 0 values, trace values “T”; missing values – incomplete dataset
• Outcomes – is the databased used for food or nutrient analyses, don’t oversimplify,
understand data used, report databases AND software
• Considerations – limitations used, shifting food supply, UX, data availability, quality
assurance, end user – research vs layperson
• Limitations – variability in the comp of food items, food items included, range of nutrients
covered
Can’t Find Food
• Choose another food item that is nutritionally similar – macros, find info about the nutrient
content and enter use data – eg. enter Foodworks as new food
• Ensure data is from a credible source, try to use other names for a food – avoid brand name
• Overseas data – currency; quality – defined foods, nutrient definitions, geographic similarity
Quality Considerations
• Database – Human error, not absolute values, analytical methods, expression changes
• Method of application – bias, raw vs cooked foods, fortification; matching of foods – high
quality = exact match, database expansion, manual vs electronic, age of data

Lecture 8 – Standards & Recommendations
Nutrient References Values (NRVs)
• Quantitative, released in 2006, more nutrients (34), multiple values for each nutrient,
detailed evidence-based documents provided
• Development: evidence from published research, N Am reviews, population intakes
• Updated review: sodium, iodine, fluoride, methodological framework including systematic
literature reviews
• Developing NRVs: Is there a deficiency disease? At what intake does deficiency occur? How
much of the nutrient is normally lost from the body and needed for growth? Etc….
• Standardised body weights may be too low
Types of NRVs
NRVs
Description
EAR
Daily nutrient level estimated to meet requirements of half the healthy individuals in a particular life stage or
gender group, determined from research evidence; uses – probability that individual intake is inadequate
RDI
Average intake level sufficient to meet the nutritional requirements of nearly all healthy individuals of a certain
sex/age & recommendations for these groups; uses – if RDI is met = unlikely inadequacy
AI
RDI cannot be determined, average intake level from observed estimates of intake by a group of apparently
healthy people assumed to be adequate; uses – usual intake at or above = low prevalence of inadequacy
UL
Highest average daily nutrient intake level likely to pose no adverse health, as intakes go above UL, risk of
adverse effects ↑; uses – determine if individual is at risk of adverse effects
EER
Average daily energy intake that is predicted to maintain energy balance in a healthy adult of defined age,
gender, etc. and level of physical activity, consistent with good health
Other NRVs
• AMDR – estimate of range of intake for each macronutrient which allows for an adequate
intake of all other nutrients whilst maximising general health outcome
• SDT – average daily intake that may help in prevention of chronic disease
Translating NRVs and other evidence
• NRVs tell us about nutrients – but what about foods? How do is scientific evidence
translated on nutrients and foods?
• Link to Aus Dietary Guidelines and AGHE
Development of the DGs and AGTHE
• Systematic literature reviews, over 50,000 studies, dietary modelling, translated NRVs into
intake patterns, determined amount and type of food groups needed to meet requirements
• Based on: NRVs, DG systematic review, national intake data, “real-life” intake
AGTHE – Foundation and Total Diets
• Recommend number of serves of to meet needs, organised by gender/age groups, consider
physical activity and height
o Foundation diets: number of serves to meet nutrient needs for smallest and least
active person in group
o Total diets: account for increased needs (activity, height, age)
• Steps – food group and value of a serve → foundation diet based on sex/age → additional E
required based on ht, wt and age → total diet based on sex/age (additional serves)
Standards and Recommendations: Use in Real-life
• NRVs – assessing population intakes of at-risk nutrients → fortification programs, health
claims eg. “good source of calcium”
• AGTHE – consumer education and nutrition promotion programs
• Dietary guidelines – consumer education and diet quality
Lecture 9 – Dietary Assessment Methods – Measurement Error & Trends
Sources of Error
• Error is apparent in all forms of dietary assessment
• Common – reactivity, recall, social desirability, lack of coverage of frequently consumed
foods, food composition database error; sources of error differ between tools
Measurement Error
• “There will always be error in dietary assessments. The challenge is the understand,
estimate, and make use of the error structure during analysis” (Beaton 1997)
• Types: Random and Bias
Bias
• A type of measurement error - systematic error
• Can lead to incorrect conclusions, components: intake-related, person-specific
• Cannot remove all bias, but can understand and reduce
Reducing Bias
• Validity and reliability
• Standardisation of the process – use a tested proforma (case report form), multiple pass
method: quick list, forgotten foods, time & occasion, detail cycle, final probe
• Quality assurance processes – implement a quality assurance process, double data entry,
source data verification, full audit
• Limitations of method – 24hr recall – only gives snapshot, repeating over 2 non-consecutive
days allows conversion to usual intake, gold standard when repeated
Days of Reporting Affects Estimation of Adequacy Intake
• Only capture an unusual eating event for an individual ≠normal intake
• Distribution of food consumption amounts using 1 much broader
• Potential over/under-estimate typical consumption, exaggerated reported extremes
Food Balance Sheets
• FAO in 1949 - food availability and consumption across countries
• Some changes to consumption data may be an artefact of changes to data collection
• Includes: Wheat and products, poultry meat, rice, veg products, seafood (total), etc.
• Consumption of foodstuffs – estimate nutrient availability, examine trends, compare intakes
– does not say individual intake
Lecture 10 – Advances in Dietary Assessment Methods & Body Composition
Automated Methods
• FFQ – online, visual, multiple images
• 24 h recall – US research has automated process, Aus version: ASA24
o Lists food and bev consumed at each meal, eating occasion, time, categories
o Meal-based format, compared structured vs unstructured approach, preference of
structured meal-based approach, aided memory
o Details – food reported linked to food comp data base, 2100 questions collect data;
form, presentation and amount eaten recorded, photos of intake
o USDA 5 step MPM – quick list, forgotten foods list, time and occasion, detail cycle,
final review
• Diet History – Missing interviewer, self-reported,
• Food Record – using phone to take photos, automatically detected and calculated
Image Recognition for Diet Assessment
• The most useful parameters are colour and texture of the food
• Veg can be separated from other foods on a plate, e.g. meats, the textural information was
useful for muscle meats
mHealth in Nutrition
• Started with text and rapidly growing – 1000’s of health apps
• Food tracking ↑ popularity, credibility is essential, accuracy and security
Camera Technology for Dietary Assessment
• E button – pinned to person to record intake, possible privacy and angle issues
• Advantages – easy to complete, high compliance, high UX, minimal eating influence
• Disadvantages – wrong angle, item separation, forgetfulness, away from home, larger pics
Anthropometry
• Definition – measurement of body size, weight and proportions
• Uses – marker of nutritional status eg. obesity caused by over-nutrition, effectiveness of
intervention eg. weight and BMI, private practice eg. patient feedback
• Techniques – weight, BMI, growth charts, % body fat, skin fold, stature, somatotypes
Body Composition
• Body comp – proportions of tissues e.g fat, muscle bone; or elements in the body
o Fat mass (FM): lipids in adipose tissue and other tissues – homogenous 0% K,
density 0.90g/ cm
3
o Fat-free mass (FFM): muscle + body water + bone + other fat free tissues – 72-74%
water, 100% K, density 1.10g/ cm
3
Methods of Body Composition Assessment A: Criterion Methods

Method
Description
Advantages
Disadvantages
Cadaver
Direct analysis eg. CAS - compared with
thickness and adipose tissue; skin, skeletal
muscle and bone weighed in air and water
Accurate, good for
research, validity
Person is dead –
assumptions of body comp
Underwater
Weighing (UWW)
Estimates %BF from body density, weighed in
air then submerged, based on water displaced
by the body when fully submerged, density then
BF is calculated
Gold standard to
determine validity, can
be used in obese
people
Remain submerged long
enough to obtain accurate
measurement, unsuitable
for some, assumes
constant density of FFM
BodPod
Newer alternative to UWW to measure % BF –
same principles but uses air vs water, measures
body volume via change in pressure
Fast, easy, less
stressful
Not as accurate, $$$
Total Body Water
(TBW)
Assumptions: water comprises 50% F or 60% M
of weight of adult, all water in body is found in
FFM, average water content of FFM of 73.2%;
multiple body fluid samples are taken
High accuracy and
precision (1-2%),
ethical
$$ & prep time, variation in
equilibrium time and
degree of hydration
DEXA
Assess BMD to diagnose osteoporosis;
determines Fat Mass & FFM, dual beams
provide relative attenuation – measure of bone
& tissue
Quick, easy, accurate,
widely used
$$$, not yet gold standard,
doesn’t distinguish visceral
vs subcutaneous fat
MRI
Person placed in strong magnetic field, H atoms
in FM & FFM, used in obesity research & injury
Accurate, no ionising
radiation, fast, HD,
separates fat types
$3M, not possible to
measure extremely obese
subjects
CT scan
X-ray equipment obtains 3D images of body
structures
Accurate – also to
determine VAT, fast
Higher radiation, size,
manual interpretation
In-vivo NAA
Direct elemental analysis – mostly total body N
or total body Ca
-
-
Total body
Potassium (TBK)
> 90% body K is in FFM (intracellular cation)
-
Some radiation exposure
Methods of Body Composition Assessment B: Field Methods
Method
Description
Advantages
Disadvantages
Near infra-red
interactance (NIR)
When body is exposed to infrared light →
transmits light – ↑ light absorbed, ↑ FM
$, safe, easy, non-
invasive, limited error
Single site, overestimates
%BF in lean subjects
Bioelectrical
impedance
analysis (BIA)
Body conducts electricity e.g. aq tissues,
opposition = impedance, current =
impendence – 2 electrodes on hand & foot
Rapid, safe, $, used
widely, skill
independent
Assumes normal hydration,
estimates FFM, abdominal
– only 10% resistance
Skinfolds
Measure thickness of adipose tissue –
calibrated callipers, permanent marker –
landmarks required for accuracy
$
Technique, variation,
adipose tissue
compression, ethics
Considerations and Technique Selection
• Consent, minimal clothing, personal space, gender considerations, well-being
• Investigate literature, cost, valid for group, clinic – validated field technique
Tutorial

Ready Reckoners
• Average figures for selected nutrients in major food groups – fast
o List foods from 24hr recall/DH into template
o Use values for protein, fat, CHO from 1 value ready reckoner and add to template
o If food doesn’t match groups use the fat hierarchy and anomalies lists
o Optional: Calculate total macro intake – x Atwater Factors to get energy
Lecture 11 – Biomarkers
What are biomarkers
• “Characteristics that are objectively measured and evaluated as indicators of normal
biological and pathological processes responses to an intervention”
• “Any biological specimen that is an indicator of nutritional status with respect to intake of
metabolism of dietary constituents…”
• Types – urinary nitrogen, potassium, sodium, vit c, red blood cell LC n-3 PUFA
Uses of Biomarkers in Nutritional Assessment
• Objective measure of intake, food comp data can be limited, provides nutrient info
• Explores diet disease relationship, assessing dietary guidelines compliance and change
• Can detect nutrient deficits, validates other assessment tools
• Limitations - $$$, invasive, participant burden, practicality, not all foods can be assessed via
biomarkers, not all dietary constituents identified
Types of Biomarkers
Biomarker
Description
Recovery
Direct relationship between intake and biomarker levels – doubly labelled water; 24 hr urinary
nitrogen – biomarker for protein intake, common, 8 days of collection required to assess usual
protein intake, completeness of samples are essential – must be full 24hrs
Concentration
correlated with dietary intake, affected by metabolism, personal characteristics, and lifestyle factors;
plasma carotenoids – variety of phytochemicals are found in plant foods, α-carotene, β-carotene
commonly measured, variety in absorption and metabolism = challenges, conducted in adults
Predictive
Do not completely reflect dietary intake, can be used to predict it – 24hr urinary sucrose and fructose
– dose-dependent relationship with dietary intake, very low recovery, objective biomarker valuable
Biomarkers of Nutritional Status and Dietary Intake – NHMS
Biomarker
Description
Australian Status
Urinary Sodium
Excreted in the urine, measurement by dietary tools are
limited, minimal losses through sweat and urine, 24hr
measurement – compliance issues, tests for
compliance, spot urine – single and untimed, ↓
participant burden, converted to 24hr urine
No guidelines for using conversion equations
for Australian data – results not reported (spot
urine)
Urinary Iodine
Required for synthesis of thyroid hormones, WHO –
iodine deficiency leading cause of mental retardation
can ↓ by 13 points, 90% is excreted in the urine, 24hr
sample in individuals and spot urine in large population
2003-2004 Iodine Study – mild deficiency in
NSW and VIC, only optimal in WA and QLD –
1998 – 2007 in pregnant women showed
inadequacy, ↓ from 90’s – caseation of

fortification programs, ↓ household salt
consumption, previously used for sanitation
by dairy industry, 2009+ mandatory
fortification, 2011-13 AHS - ↑ MUIC vs 2003-
04, 62% of women had a UIC <150µg/L
Folate
Important for women of childbearing age → prevention
of neural tube defects – additional intake
recommended, fortification of wheat flour from 2009
Serum folate and Red Cell Folate (RCF) –
serum = recent folate, RCF = longer term,
sufficient RCF ≥906 nmol/L, less that 1% of
women were insufficient
Iron
High prevalence of iron deficiency worldwide, intake or
absorption iron ≠ iron requirements or losses – iron-
deficiency anaemia; ferritin – detects depleted stores,
can be affected by infection; sTfR - ↑ soluble
transferrin receptor when iron stores are ↓;
haemoglobin – transports O around the body, detects
anaemia
4.5% aged 18 years and over at risk of
anaemia - females: 6.4%, males: 2.5%
Vitamin D
Fat soluble, need for absorption of Ca & P, deficiency –
rickets & osteopenia; high risk – elderly, chronic
disease, dark skin, fair skin (cancer risk), obese, indoor
workers, serum concentration of 25-OHD measured a
variety of ways
Liquid Chromatography Mass Spectrometry
(LCMS) – ≥50 nmol/L is adequate, 25% of
Aussie adults were deficient, 5% took supps,
↑ deficiency % in winter, ↑ sedentary = ↑
deficient
Using Biomarkers to Validate Dietary Intakes – Considerations
• Temporal relationships with dietary intake, reflect intake over same period as dietary tool,
currency
• Within-subject variation, more likely with plasma than erythrocytes or adipose tissue,
influenced by time of day, exercise, medication
• Biological confounding, variations – genetics, diseases, medication, endogenous pathways,
environment, nutritional status
• Sample collection, transport and storage, appropriate resources needed
Lecture 12 – Physical Activity & Guidelines
Physical Activity Definitions
• Physical Activity – any bodily movement produced by skeletal muscles that results in energy
expenditure
• Exercise – specific type of physical activity that is planned, structured and repetitive; done to
maintain or improve physical fitness
• Physical fitness – set of attributes, either health or performance related, that measures the
ability to perform physical activities
Physical Activity
• Physical activity can affect our weight health and well-being
• Other reasons: sporting performance positional-related information, weight management
• Benefits – prevents CVD, premmie death, T2DM, colon cancer, high BP, fractures
• Obesity has ↑ in Aus from 1995 – 2011, 62% of Aus adults are overweight or obese

• Reasons to measure – estimate the true effect size, specify which dimension of physical
activity is of most importance, make cross-cultural comparisons, plan interventions
Self-Report Measures
• Questionnaires – individuals are questioned on details of activities over defined timeframe,
vary in detail and burden
o Advantages – $, easy to administer, provides prevalence estimates of PA
o Disadvantages – bias, children suitability, literacy, poor objective
• Activity Diaries – participants record types of activity, duration, details of activities
o Advantages – can monitor intensity, variety, time spent over 24hr periods –
accurate for EE
o Disadvantages – recall bias, subject burden, misclassification, misses “bursts” of
activity
Movement Sensors
Sensors
Description
Advantages
Disadvantages
Pedometer
Worn on ankle or waistband, steps counted in
response to vertical acceleration, basic mechanism:
spring balanced horizontal pendulum – measures
walking and stride length
Small, simple
collection, $
Varied accuracy, limited
activity types measured
Accelerometer
Direct measure of body movement, body is
accelerated in relation to the muscular forces
responsible, acceleration can be measured in 3
directions
Objective
measurement of
PA, accurate, small,
more info
$$$, upper body activity,
activity types
undistinguished
Heart Monitor
Linear relationship between heart % and EE during
steady state workloads with large muscle groups, HR is
related to oxygen consumption, detects intensity
changes
$, easy, can be
used in water, high
intensity PA info
Calibration required,
error level, influenced by
other factors
Programs
• 10,000 steps – reasonable limit for health adults, too much for elderly or ill, too little for kids
• Global Corporate Challenges – encouraging office works to up step count
National Recommendation – Activity and Sedentary Guidelines
Age Group
Activity Guidelines
Sedentary Guidelines
Birth - 1
Supervised floor based safe play in safe – 30
mins tummy time
Should not spend any time watching television or
using other electronic media
Toddlers – 1-2 yo
Should spend at least 180 mins/day doing
variety of activities, spread throughout the day
Screen time not recommended, screen time no
more than 1 hour in 24-hour period (2 years)
Pre-schoolers – 3-5 yo
60 mins of activity should be energetic
Not restrained more than 1 hour at a time
Children – 5-17 yo
Should accumulate at least 60 mins of
moderate to vigorous intensity physical activity
each day, activities to strengthen muscle and
bone on at least three days/w
Limit electronic media for entertainment to no
more than two hrs/day, break up long periods of
sitting
Adults – 18-64 yo
Be active on most, days every week, accumulate
150 to 300 minutes of moderate intensity
Minimise the amount of time spent in prolonged
sitting, break up long periods of sitting often

physical activity or 75 to 150 minutes of
vigorous intensity physical activity, do muscle
strengthening activities on at least 2 days/w
Elderly – 65+
At least 30 mins of moderate intensity physical
activity on most days, range of physical
activities, older people can still do vigorous PA
-
Australian Health Survey 2011-2013
• Vigorous – activity undertaken for fitness, recreation or sport that caused a large increase in
the respondent's heart rate or breathing
• Moderate – not already reported as vigorous physical activity
• 3 levels – inactive, insufficiently active and sufficiently active
Guidelines
Age Group
Physical Activity 2011 – 2012
Sedentary Time 2011 – 2012
Children – 2-4 yo
Spent an average 6 hrs and 12 mins per day
engaged in PA, 84% averaged 3hrs+ per day, 72%
were physically active for 3 hrs+ on all 7 days
prior to the interview
Child/Adolescent 5-17yo
Average of 91 mins of PA/day, 60% averaging 1
hour/day, 19% did 60 mins/day on all seven days
prior to interview, 48% met recommendation on
at least five of seven days
Sedentary time surpassed PA time
Adults – 18+
Average of 33 minutes per day doing PA 60% of
adults doing <30 mins per day, <20% doing 1hr+
per day on average, 43% met the "sufficiently
active" threshold
Sedentary activity = average 39 hrs per
week for adults, TV watching =
sedentary activity, differences between
occupations
