
J lltlth l!N 1
CANADIAN HEALTH
INSURANCE
Lessons for the
United States
Ill II 118 II II
144039
,
._------.-
‘!
CAO/EEKI)-w-!10


GAllIll ~$iz?t&z&Lwmf&
,
. .
Human Resources Division
B-244081
June 4,199l
The Honorable John Conyers, Jr.
Chairman, Committee on Government Operations
House of Representatives
Dear Mr. Chairman:
This report, prepared at the Committee’s request, reviews Canada’s universal, publicly
funded insurance system. The report describes the policies used in this system, consequences
for both health care spending and access, and implications for the United States.
We are sending copies of this report to interested congressional committees and are making
copies available to others on request.
This report was prepared under the direction of Mark V. Nadel, Associate Director, National
and Public Health Issues, who may be reached on (202) 276-6196 if you or your staff have
any questions. Other major contributors to this report are listed in appendix II.
Sincerely yours,
Lawrence H. Thompson
Assistant Comptroller General

Executive Summary
Purpose
Recent polls indicate widespread dissatisfaction with the way the
United States finances and controls the cost of health care. Health
spending consumes a steadily rising share of our national income-
almost 12 percent of gross national product in 1989, headed to 16 per-
cent by the end of the decade. Yet many Americans who lack health
insurance face severe difficulty gaining access to health care. This situa-
tion has revived national debate over the way we finance health care.
Meanwhile, other industrialized nations assure that everyone has access
to the health care system, have health status indicators that equal or
exceed those of the United States, and accomplish these goals while
spending less than the United States. This contrast between the U.S. and
foreign experience suggests that the way other nations finance health
B”J
services may contain useful ideas that might be adapted to the U.S.
system. Some have looked to Canada, where the health program has
broad popular support and all residents are covered by the program, but
per capita spending is significantly less than in the United States. Yet
the Canadian program has some features in common with the United
States. Canadians choose their own private physicians, those physicians
are compensated on a fee-for-service basis, and most hospitals are pri-
vate, nonprofit institutions.
The Chairman, House Committee on Government Operations, asked
GAO
to assess whether the Canadian health care system had useful lessons
for the United States. He asked
GAO
to review salient features of the
Canadian system and analyze the likely effects on cost and access of
adopting elements of a Canadian-style system.
Background
Canada’s publicly funded health care system consists of
10 separate
provincial plans sharing certain features. Health insurance is universal,
covering all medically necessary hospital and physician services. Thus
coverage does not change dramatically or disappear when a person
changes jobs, as can happen in the United States.
The Canadian system is administered in each province by a public
agency, which is responsible both for reimbursing providers and for
health planning. The provincial governments are the single payers of
physicians and hospitals and make the key decisions on health
financing. Those governments are thus responsible, both politically and
financially, for the health care system. In this role, provincial govern-
ments determine overall increases in hospital budgets and physician fees
and regulate the acquisition of expensive equipment and services. This
Page 2
GAO/HItDQl-90
Chnadhn Health Insurame

Executive Summaxy
contrasts with the U.S. system, in which hospitals and physicians are
reimbursed by numerous payers (federal and state governments, private
insurers, businesses, and individual consumers) using widely differing
procedures and coverage, and no one has responsibility for the condition
of the system as a whole.
An added feature of the Canadian system is that there are no deduct-
ibles or copayments for covered services, so Canadians spend out of
pocket (or purchase private insurance) only for services that are not
covered by their provincial plan-such as routine adult dental care, cos-
metic surgery, and hospital room amenities.
Results in Brief
If the universal coverage and single-payer features of the Canadian
system were applied in the United States, the savings in administrative
costs alone would be more than enough to finance insurance coverage
for the millions of Americans who are currently uninsured. There would
be enough left over to permit a reduction, or possibly even the elimina-
tion, of copayments and deductibles, if that were deemed appropriate.
If the single payer also had the authority and responsibility to oversee
the system as a whole, as in Canada, it could potentially constrain the
growth in long-run health care costs. Measured either on a per capita
basis or as a share of gross national product, health care costs have
risen at a dramatically slower pace in Canada than in the United States.
The difference reflects Canada’s low administrative costs, controls on
hospital budgets and on the acquisition of high-technology equipment,
and fee controls for physician services.
Canadians have few problems with access to primary care services.
There are more physicians per person in Canada than in the United
States, and Canadians use more physician services per person than do
US. citizens. Yet the cost of physician services per person in Canada
was one-third less than in the United States.
The Canadian method of controlling hospital costs has limited the use of
expensive, high-technology diagnostic and surgical procedures. As a
result, waiting lists or queues have developed for some specialty care
services, such as cardiac bypass surgery, lens implants, and magnetic
resonance imaging. Emergency cases, however, are treated immediately,
bypassing the waiting lists.
Page 3
GAO/HRBQl-90 Canadian Health Insurance

Executive Summaw
A reformed U.S. system is not likely to look exactly like the Canadian
system, in part because the institutions that deliver and finance health
care in the two countries have evolved quite differently. But particular
elements of the Canadian system are worthy of consideration, including
universal access, a uniform payment system, and expenditure controls,
Principal Findings
Universal Access, Single
Payer, and No Cost
Sharing Are Key Features
of the Canadian System
Coverage, administration, and the use of copayments and deductibles
are the principal areas in which the U.S. and Canadian systems differ. In
other respects, such as the general use of fee-for-service physician reim-
bursement and the predominance of private, nonprofit hospitals, the
two systems are quite similar.
. In Canada, the Canada Health Act covers all residents in all provinces
for necessary physician and hospital care. Private health insurance that
duplicates services covered by the provincial plans is prohibited. In the
United States, coverage depends primarily on whether health insurance
is provided by an employer or through public programs serving the poor
and the elderly. Since some U.S. employers do not provide health insur-
ance benefits, there is a potentially significant impediment to moving
from one job to another in the United States that is not found in Canada.
. In Canada, health insurance is administered in each province by a single
public agency. In the United States, insurance programs are adminis-
tered by numerous private companies and public agencies. The Cana-
dian arrangement of concentrating financial responsibility in a single
payer permits much more efficient administration and allows for
greater control over health expenditures. In 1989, Canadian spending on
health was $670 per person less than in the United States; the differ-
ences primarily reflected savings on administrative costs and on physi-
cian and hospital reimbursement.
9 In Canada, direct patient payments to providers for covered services are
banned, and there are no copayments or deductibles. In the United
States, copayments and deductibles are common, and it is not unusual
for health care providers to bill the patient for charges in excess of the
standard insurance reimbursement. The Canadian arrangement elimi-
nates any financial barrier to access.
Page 4
GAO/HRDQl-99 Canadian Health Insurance

Executive Summary
Canada More Effective at
Canada has been much more successful than the United States in con-
Cost Containment
taining health care expenditures. In 1971, when Canada fully imple-
mented its system for financing medical services, the two countries
spent about the same share of gross national product on health care. In
1989, the U.S. share was 11.6 percent, whereas Canada’s was 8.9 per-
cent. The differences reflect lower Canadian spending on insurance
administration and on physician and hospital reimbursement.
Spending on Insurance
Canada’s publicly financed single payer system eliminates the costs
associated with marketing competitive health insurance policies, billing
for and collecting premiums, and evaluating insurance risks. As a result,
in 1987, the latest year for which comparable data are available,
Canada’s per capita spending on insurance administration was only one-
fifth that of the United States.
Spending on Physicians
In 1987, Canada spent 34 percent less per capita on physician services
than did the United States, reflecting the use of negotiated fee schedules
and lower practice expenses.
l
In Canada, physician professional associations in each province set
reimbursement rates for each service. Increases in these rates are nego-
tiated annually with the provincial government, which can use its power
as the single payer to restrain growth in costs. Between 1971 and 1986,
after adjusting for inflation, Canadian physician fees decreased 18 per-
cent, while those of U.S. physicians were rising 22 percent.
l
But lower physician fees do not necessarily mean substantially lower
net incomes under the single payer system. Canadian physicians need
not maintain an extensive office staff for insurance record keeping,
direct billing of patients, or collecting bad debts, as is needed by a U.S.
physician. In 1987, Canadian physicians spent an average of 36 percent
of their gross income on professional expenses, compared to 48 percent
for U.S. physicians. The Canadian system of negotiated fees permits
these savings to be captured for the taxpayer. In addition, malpractice
insurance premiums for U.S. physicians average 10 times those of their
Canadian counterparts, though this probably reflects differences in the
tort systems, rather than in the health insurance systems.
Spending on*Hospitals
The combination of lower hospital administrative costs and the use of
budget controls limiting equipment, facilities, and labor keeps Canadian
Page 6
GAO/HRD-91-90 Canadian Health Insurance

Executive Summary
hospital expenses down. In 1987, Canada spent 18 percent less per
person for hospital services than did the United States.
l
As with physicians, the single payer, universal coverage system permits
Canadian hospitals to have far lower administrative costs than do their
U.S. counterparts. A Canadian hospital has virtually no billing depart-
ment and a minimal accounting structure to assign costs and charges to
patients and physicians. This probably means, however, that Canadian
hospitals have substantially less detailed information on the cost of par-
ticular services than is available in a well-administered U.S. hospital.
. Canada’s chief means of controlling hospital expenditures are its system
of global (lump-sum) budgeting and its limits on the acquisition of high
technology. In Ontario, the Ministry of Health negotiates with individual
hospitals their annual operating budgets, which automatically capture
for the taxpayer the savings in administrative costs. The government
also decides which hospitals will acquire expensive high-technology
equipment and which will provide expensive specialized services.
Canadians Have Good
Access to Primary Care,
but May Wait for Some
High-Technology Services
In Canada, there are no financial barriers to health care, and there is an
ample supply of physicians. Residents of Canada make more physician
visits and have longer hospital stays than do their U.S. counterparts.
However, tight hospital operating budgets and restraints on the diffu-
sion of new medical technology mean that Canadians encounter limits on
access to some high-technology services.
Patients with immediate or life-threatening needs rarely wait for ser-
vices, but waiting lists for elective surgery and diagnostic procedures
may be several months long. In October 1990, about 1,000 Ontario
patients were on waiting lists for cardiovascular surgery. There was no
wait for emergency patients, but “urgent” patients waited up to 1 month
while elective patients might wait up to 6 months. To some degree, hos-
pital capacity in the United States is a safety valve if Canadian waiting
lists become a problem, but such “border jumping,” at least in Ontario, is
not extensive.
Potential Administrative
Sayings Would Offset
Costs of Universal
Coverage *
If the United States were to shift to a system of universal coverage and
a single payer, as in Canada, the savings in administrative costs would
be more than enough to offset the expense of universal coverage.
GAO
estimates that, in the short run:
Page 6
GAO/HRD-91-90
Canadian Health
Insurance

Executive Summary
Savings in insurance overhead would be $34 billion.
Savings in hospital and physician administrative costs could be another
$33 billion. However, the United States might deem it appropriate for
management purposes to retain some of the more detailed statistical and
financial data that are now collected in U.S. hospitals. This might reduce
the savings somewhat.
The cost of serving the newly insured would be about $18 billion.
The cost of providing additional services to those currently insured-
stemming from the elimination of copayments and deductibles-could
be about $46 billion.
However, the United States may want to retain some level of cost
sharing to control utilization and constrain total health expenditures.
In the long run, effective limitations on provider payments through
global budgeting and negotiated physician fees, as well as controls on
expensive technology, could significantly constrain the future growth of
U.S. health spending, leading to substantial further cost savings.
Conclusions
The situation in the United States today differs in several important
respects from that in Canada at the time its health insurance program
was implemented. The expansion of the private health insurance
industry, the diffusion of medical technology, and the development of
alternative service delivery arrangements make circumstances in the
United States today different from those in Canada when it adopted its
system.
Some elements of the Canadian system are worthy of consideration in a
reformed U.S. system, however, because they might solve recognized
problems. These might include Canada’s universal access, uniform pay-
ment system, and expenditure controls.
But a reformed U.S. system should also retain and build upon the unique
strengths of the existing structure of US. health care. The strong U.S.
research establishment, the continuing development of medical tech-
nology, and the capacity to evolve new and potentially more efficient
service delivery mechanisms, such as health maintenance organizations,
are characteristics of the U.S. system that should be preserved, even as
we search for models elsewhere that would help us overcome our recog-
nized problems.
Page 7
GAO/HBDQl-99 Canadian Health Insurmce

Contents
Executive Sumrnary
2
Chapter 1
12
Introduction
Canada May Be an Instructive Model for U.S. Reform
12
Objectives, Scope, and Methodology
18
Chapter 2
20
Structure of the
Canadian Insurance Coverage Does Not Depend on
21
Canadian System
Income or Health Status
Canada’s System Is Administered by a Single Payer in
26
Creates Differences in
Each Province
Access and Cost
Control
Chapter 3
Single Payer Structure
Single Payer Lowers Insurance Overhead
With Province-Wide
Fee Controls and Other Policies Limit Physician
Policies Helps Control
Expenditures
Global Budgeting and Technology Management Constrain
National Health
Hospital Spending
Spending
28
29
33
42
Chapter 4
Access Consequences
Access to Primary Care Is Unconstrained
52
52
53
of Universal Coverage
Queues Have Developed for Specialized Services
With Spending
Controls in Ontario
Page 8
GAO/IiRIkQl-90 Canadian Health Insurance

contents
Chapter 5
Potential Savings in
Administrative
Administrative Savings Would Offset Costs in the Short
Run
62
63
Expenses Could offset
Substantial Savings Could Accrue in the Long Run
67
Structural Differences and Implementation Issues Would
69
Costs of Providing
Affect Costs
Universal Access in
the United States
Chapter 6
Conclusions
71
Appendixes
Appendix I: Health Implications of Expanding Access to
Care
74
Appendix II: Major Contributors to This Report
85
Tables
Table 3.1: Health Expenditures Per Capita, by Sector
(1987)
29
Table 3,2: Professional Liability Premiums for Self-
Employed Physicians (1987)
Table 4.1: Queuing for Specialty Care Services in Ontario
(Oct. 1990)
41
55
Table 5.1: Estimated Savings and Costs of Adopting a
Canadian-Style System in 1991
Table I. 1: Percent Increase in Annual Use of Medical
Services Under Free Care Over Use Under Cost-
Sharing Plans
63
78
Figures
Figure 1.1: Total Health Care: Real Expenditures Per
Capita (1971-89)
Figure 1.2: Total Health Expenditures as a Share of GNP
(1971-89)
15
Figure 2.1: Survey Respondents Who Did Not Receive
Needed Medical Care (1988)
22
Figure 2.2: Sources of Health Insurance for Individuals
Under Age 65 (1988)
24
Figure 3.1: Insurance Overhead: Real Expenditures Per
Capita (197 l-87)
32
Page 9
GAO/HRDBl-90 Canadian Health Insurance

Figure 3.2: Physicians’ Services: Real Expenditures Per
Capita (1971-87)
34
Figure 3.3: Indexes of Per Capita Utilization and
Inflation-Adjusted Physicians’ Fees in Canada
(1971-85)
36
Figure 3.4: Average Net Incomes of Self-Employed
Physicians by Specialty (1986)
Figure 3.5: Professional Expenses as a Percentage of
Gross Income for Selected Specialties (1986)
Figure 3.6: Hospital Care: Real Expenditures Per Capita
(1971-87)
39
40
43
Figure 3.7: Availability of Selected Medical Technologies
Figure 5.1: Potential Savings of Constraining Health
Expenditure Growth to GNP Growth Rate
(1995-2000)
50
69
Abbreviations
CT
computed tomography
DRG
diagnosis related group
GAO
General Accounting Office
GNP
gross national product
HIAA
Health Insurance Association of America
HMO
health maintenance organization
HMSA
Health Manpower Shortage Area
MRI
magnetic resonance imaging
OHIP
Ontario Health Insurance Plan
PNHP
Physicians for a National Health Program
Page 10
GAO/HRDBl-BO Canadian Health Insurance

Page 11
GAO/HUDBl-BO
fhmdlan Health lnmuance

Chapter 1
Introduction
Concern over inadequate access to health care for many Americans and
continually rising costs for health care are generating renewed interest
in restructuring the U.S. health care system. Most other industrialized
countries provide universal health insurance while spending less per
capita on health services than the United States. The Congress is inter-
ested in whether the health care systems in these countries offer any
lessons that could help the United States expand access to care while
stemming the rate of growth in health care costs. The Chairman, House
Committee on Government Operations, requested that we compare the
organization of the Canadian and U.S. health care systems and assess
the implications for the United States of adopting a Canadian-style
program.
Canada May Be an
The Canadian system, really a network of 10 provincial and 2 territorial
Instructive Model for
systems, is frequently presented as a possible model in US. health care
reform. Provincial governments operate plans that provide universal
U.S. Reform
access, cover nearly all physician and hospital services, provide portable
benefits, and are publicly administered on a nonprofit basis. The federal
government funds about 40 percent of the provinces’ costs. For the
province to qualify for maximum federal support, providers must accept
the provincial plan reimbursement as payment in full. There are no
upper limits on the provision of care provided as long as it is deemed
medically necessary. Canada prohibits private health insurance, except
for items not covered by the provincial plans.
The two nations have certain common features that make Canada’s
experience relevant for the United States. Although it is not identical to
the United States, Canada probably comes closer to sharing certain U.S.
characteristics than any other industrialized country. First, it does not
have a socialized system of delivering medical care. Rather, most health
resources in Canada are in the private sector. It is a system whereby a
third party pays private providers. Second, most physicians are inde-
pendent and earn their incomes by fee-for-service. Ninety-five percent
of Canadian doctors work for themselves, not for the government.
Finally, 90 percent of hospitals are private, nonprofit corporations,
exceptions being federally owned and operated veterans’ hospitals and
provincial psychiatric hospitals.
Page 12 GAO/HRD-91-90 Canadian Health insurance

t
chapter
1
Introduction
Canada Constrains
A comparison of real health care expenditures in the two countries
Aggregate Health
shows that Canada spends less per capita and a smaller share of its eco-
Expenditures Better Than
nomic output on health care. Canada’s relative success in containing
the U.S.
costs is evidenced by its slower rate of growth in health care expendi-
tures since 197 1, the year publicly funded health insurance was imple-
mented in all provinces, As a result, health care expenditures per capita
and as a proportion of gross national product
(GNP)
remain significantly
less than in the United States. This gap is due to differences in how the
two countries finance and deliver health care as well as socio-
demographic differences.
Canada spent roughly one-fourth less per capita on health care in 1989
(the latest year for which comparable data are available). The average
per capita expenditure was $1,570 in Canada compared to $2,196 in the
United States (in 1987 dollars). Between 1971 and 1989, Canada’s
average annual growth rate in real per capita health expenditures was
lower than the comparable US. rate. Real per capita expenditures on
health care grew by 3.7 percent per year in Canada compared to 4.5
percent in the United States. As shown in figure 1.1, the difference in
spending, after adjusting for inflation, grew from $167 per person in
1971 to $626 in 1989.
Page 13 GAO/HRDBl-BO
Canadian Health Insurance

ChJlpteF
1
Intxoductlon
Figure 1 .l: Total Health Care: Real Expenditures Per Capita (1971-89)
2200 1a67U.s.ooll~n
197l lQ?2 1m
1974
1975 1978; lQ77 1978 1979 1980 1981 1882 1983
1984 lw5 1988
1987 1988 1989
- UnitedStates
---- Canada
Notes: Expenditures were converted to 1987 constant dollars by dividing health care spending by the
gross domestic product implicit price deflators for the United States and Canada. The Organization for
Economic Cooperation and Development’s purchasing power parity for 1987, $1.24 CAN = $1.00 U.S.,
was used to convert Canadian to U.S. dollars.
In 1989, Canada’s health spending share of
GNP
was 2.7 percentage
points below that of the United States. In 1971, health care consumed
about the same share of economic output in both countries (7.4 percent
in Canada and 7.5 percent in the United States). However, between
1971
and 1989 the two shares diverged; health expenditures as a share of
GNP
grew at a l-l-percent annual average rate in Canada compared with a
2.5-percent rate in the United States. In 1989, Canada’s health spending
share of
GNP
was 8.9 percent compared to 11.6 percent in the United
States. (See fig. 1.2.)
Page 14 GAO/HRD-91-90 Canadian Health Insurance

Figure 1.2: Total Health Expendlturer a8
a
Share of QNP
(1971-89)
12 Pam.w
10
.I -------
-- ,
--.
---’
C.“.---....L...-
~.I------.........
. .- .,.
a
.’
/’
**-•
-. _
_ --
-------- ..lll,,,L. *
C............-----....-
**..----*
6
4
2
0
.- _
197l
lQ7Q lQ7Q
1974 1272
1076 lwr 1972
1979 1880
1981 1982 1989 1984 lQ85
1Qm 1987
1988 1989
- UnitedStates
-1-g Canada
This analysis of the Canadian and U.S. record of cost control has been
subject to criticism. A recent study by the Health Insurance Association
of America
(HIAA)
suggests that comparisons of the two nations’ health
spending as a proportion of
GNP
exaggerates Canada’s success in con-
taining health expenditures.’
HIAA
argues that faster
GNP
growth, not
slower health spending, explains why health’s share of
GNP
has stayed
lower in Canada. They contend that it is more appropriate to look at
changes in per capita spending as an indicator of the effectiveness of
health care cost controls.
Canada’s faster real economic growth provides better support for the
opposite conclusion to this argument.
HIAA’S
comparative analysis does
not consider the potential impact of faster
GNP
growth on health care
‘E. Neusehler, “Canadian Health Care: The Implications of public Health Insurance,” Health Incur-
ante Association of America Research Bulletin, June 1990.
Page 15 GAO/W&D-9180 Canadian Health Insurance

chaptm 1
Introduction
spending.2 If U.S. income had grown as fast as Canada’s, health spending
would have increased more and per capita spending would have been
even higher than the current U.S. levels. Indeed, a recent international
comparison of health expenditures indicates that for the United States,
health expenditures tend to grow at a faster rate than income. This sug-
gests that not only would per capita health spending increase, but the
share of
GNP
spent on health care would also rise. Canada’s ability to
restrain health care spending despite rapid economic growth may be
attributed to how it finances and allocates health care services3
Health Status Indicators
Are Comparable
Health indicators do not differ substantially between the United States
and Canada even though the proportions of
GNP
allocated to health in
both countries vary. The health of Canadians, as measured by standard
(if crude) indicators, is as good as or better than that of U.S. residents4
The average life expectancy of Canadian men and women is longer than
in the United States. In 1986, life expectancy at birth was 73.1 years for
a Canadian man compared to 71.3 years for an American man, and 79.9
years for a Canadian woman compared to 78.3 years for an American
woman. In both countries the leading causes of death were heart dis-
ease, malignant tumors, respiratory disorders, cerebrovascular diseases,
and accidents.
The infant mortality rate’in Canada also is lower than that of the United
States. In 1987, the infant mortality rate in Canada was 7.3 deaths per
1,000 live births, compared to the U.S. rate of 10.1. Another children’s
health status indicator is the proportion of infants born with low birth
weights; these infants are at greater risk of dying or developing long-
term disabilities. In the mid-1980s, in the United States, 6.8 percent of
all births were low birth weight, compared to 6.7 percent in Canada.
2Health expenditures tend to increase faster than income growth in the United States. Income growth
generates increased spending on health care in Canada, but health expenditures tend to grow at a
slower rate than income. See G.J. Schieber and J.P. Poullier. “Overview of International Comoarlsons
of Health Care Expenditures,” Health Care Financing Review, Annual Supplement 1989, pp. i-7.
3A.J. Culyer, Health Care Expenditures in Canada: Myth and Reality; Past and Future (Canadian Tax
Foundation Paper No. 82), 1988.
4Although aggregate data are comparable, there is a significant difference when comparing these
indicators for U.S. whites and blacks. Relative to all Canadians, U.S. whites have similar or low
mortality rates for several leading causes of death. However, U.S. whites have a shorter life P
tancy and higher infant mortality rate than all Canadians. At the same time, U.S. blacks bar
higher mortality rates for almost all leading causes of death, higher infant mortality rates.
shorter life expectancy than either U.S. whites or the average Canadian. Data from Canar
status indicators are not readily available by race.
Page 16
GAO/IIRD91-90 Canadian Hr

Life expectancy, cause-specific mortality, and infant mortality data may
be poor indicators of the relative quality of the two health delivery sys-
tems. A more discriminating measure of quality would be a comparison
of incidence rates for sentinel health events.6 Such data, however, were
not readily available on a comparable basis.
Health status is influenced by many other factors. A 1979 study by the
Department of Health, Education, and Welfare estimated that only 10
percent of premature deaths in developed countries are attributable to
inadequate health services. The rest are due to unhealthy lifestyles (50
percent), environmental factors (20 percent), and human biological fac-
tors (20 percent). Thus, broadening access to health care may not be
enough to raise the health status of all Americans. It is likely, however,
to improve the health of those who currently lack access to health care
services.
Critics of Canada Cite
Rationing Problem
Health experts have identified a number of weaknesses in the way the
Canadian health care system is manageda US. critics of the Canadian
system widely cite rationing of medical technology as an unacceptable
weakness. For services that are in tight supply, such as cardiac bypass
surgery, lens implants, and magnetic resonance imaging
(MRI),
patients
are placed on waiting lists to receive care according to the urgency of
treatment. Such rationing of services results from government con-
straints on hospital budgets and the number of facilities used for
specified high-technology services. Some health experts argue that con-
straints on the availability of innovative technologies conflict with
quality-of-care concerns. (See ch. 4.)
Some Canadian patients who experience delays in obtaining specialized
medical services cross the border to seek care in the United States. In
this way, the United States acts as a “safety valve” for Canada. If the
United States implemented the Canadian-style system of stringent con-
trols on technology acquisition, there would be no similar backup system
for U.S. citizens.
“Sentinel health events are medical conditions or stages of conditions that indicate a lack of access to
quality primary care. These events include, for example, cases of measles, mumps, or polio in chil-
dren, and advanced breast cancer, uncontrolled diabetes, or uncontrolled hypertension in adults.
‘M. Rachlis and C. Kushner, Second Opiion: What’s Wrong With Canada’s Health Care System and
How To Fix It (Toronto: Harper and Collins), 1989.
Page 17
*
I
3 “,,@
GAO/HRD-91-90
Chnadim Health Insurance

Chnptm 1
Introduction
Objectives, Scope, and
At the request of the Chairman, House Committee on Government Oper-
Methodology
ations, we examined Canada’s two decades of experience under uni-
versal, publicly funded health insurance and sought implications of that
experience for U.S. health care reform. Specifically, we sought to
answer the following questions:
. What are the major similarities and differences between the health care
systems of the United States and Canada?
l
What policies has Canada used to control costs in the physician and hos-
pital sectors?
l
As a consequence of the structure and policies implemented in the Cana-
dian health care system, are there serious limitations on access to high-
technology and specialized services?
l
If the United States adopted certain features of a Canadian-style
system, how would national health spending change?
. What are the access and health implications for the United States of
adopting a system with universal, first-dollar coverage?
Scope
Our review includes data from Canada as a whole and from the province
of Ontario.7 Since each of the 10 provincial programs has some unique
features, we often found data available only at the provincial level. For
our analysis of access issues, we confined our data collection efforts to
Ontario, recognizing that there may be significant differences across
provinces. Our cost estimates assume the United States would imple-
ment a publicly funded system modeled after that in Ontario. We did not
review the financing and delivery of long-term care services provided at
institutions other than hospitals.
Methodology
To carry out our objectives, we:
l
Analyzed expenditure patterns in Canada, Ontario, and the United
States using data from Health and Welfare Canada, the Ontario Ministry
of Health, and the U.S. Health Care Financing Administration.
l
Reviewed literature over the last 10 years describing Canadian
approaches to regulating hospital and physician payments.
7We agreed with the Committee that Ontario would serve as a “benchmark” province for such com-
parlaon~~. Ontario accounts for 37 percent of the Canadian population, 38 percent of national health
expenditures, and 38 percent of Canadian physicians.
Page 18 GAO/HRD-Bl-90
Canadian Health Insurance

chapter 1
lntrudu&on
l
Interviewed Canadian hospital administrators and physicians, provin-
cial officials, and professional health care groups and U.S. health policy
experts.
. Surveyed selected Ontario hospitals providing high-technology and spe-
cialized services.
. Consulted an advisory panel composed of U.S. and Canadian govern-
ment and academic health care experts.
We conducted our review from January through December 1990 in
accordance with generally accepted government auditing standards.
Page 19
GAO/HltD-91-W) caNuHanHealthInsurance

Chapter 2
Structure of the Canadiayl System Creates
; Differences in Access and Cost Control
The Canadian system provides health insurance coverage to all
residents regardless of financial or health status. Unlike in the United
States, where access is often limited by an individual’s insurance cov-
erage, access in Canada is limited province-wide by annual health care
budgets. By maintaining a single payer for all medical services, the
Canadian system has the leverage and institutional incentives to reduce
administrative costs and control overall expenditure growth. But as a
consequence of these controls, some health care services may not be
available or accessible due to limits on expensive technologies and ser-
vices. (See ch. 4.)
The Canadian approach to health insurance proceeds from a base of
national standards that are implemented through a network of provin-
cial plans. As a condition of federal funding, provincial plans must
implement
. universal coverage for all legal residents,
. comprehensive coverage of all medically required services,
. reasonable access to insured services with no deductibles, copayments,
or extra billing,’
l
portability between jobs and residences, and
. public administration on a nonprofit basis.
Provinces set their own plan policies and finance the plans according to
their budgets. For the most part, plan benefits are similar across
provinces.
Under this arrangement, most features of the Canadian health financing
system are different from those of the U.S. system. These include uni-
formity of benefits, streamlined administration of insurance plans, pro-
hibition against cost sharing, lump-sum budget reimbursement of
hospitals, and government’s active role in constraining health costs
across entire health sectors.
‘No extra billing means providers may not charge a fee in addition to that which is reimbursed by the
insurance plan. Canada further discourages private payment by requiring physicians who bill
patients directly to leave the provincial health plans altogether. A doctor can choose not to partici-
pate. However, few doctors could survive in full-time private practice since free care is always avail-
able. Thus, nearly all participate. A patient can patronize any doctor privately, but few are willing to
pay fees rather than go where care is free.
Page 20
GAO/HRD-91-99 Canadian Health Insurance

Chapter 2
Strncture of the Cnnadb syetem create9
Dif’ferencee in Access and Coat Control
Canadian Insurance
In both Canada and the United States, health care is limited by financial
Coverage Does Not
resources. However, each country approaches access to health care ser-
vices in a different way. In Canada, financial constraints are applied to
Depend on Income or
the entire system, but not directly to an individual‘s utilization. In the
Health Status
United States, financial constraints are placed directly on individuals’
utilization-ability to pay is an important factor in obtaining access and
amount of care-not on the system as a whole.
Canadian health policy reflects the ideal that all citizens have equal
access to medical care regardless of their ability to pay. Under this ideal,
people who can afford to pay do not purchase medical care that is better
or more readily available than that obtained by people who are less well
off. Instead, financial constraints on health care in Canada are applied
through provincial budgets, for example, by limiting expenditures on
technology. (See ch. 4.) The effects of these constraints apply, in prin-
ciple, equally to all residents.
In the United States, access to health care is determined largely by indi-
vidual insurance status or ability to pay, which is usually determined by
whether and where people are employed. In addition, federal and state
programs help reduce the effect of individual financial constraints
through Medicaid, Medicare, and state assistance programs. Neverthe-
less, over 32 million Americans under age 66 lack either public or pri-
vate health insurance coverage. These uninsured Americans must either
pay out-of-pocket or rely on public hospitals, clinics offering free or sub-
sidized care, and other forms of charity care. Financial constraints on
health care in the United States are applied by the different payers for
health care, thus creating an ad hoc collection of cost-control policies
that vary by insurance carrier.
Barriers to health care are less evident in Canada than in the United
States. For many Americans, such financial barriers as lack of insur-
ance, inadequate coverage, and cost-sharing requirements limit their
access to health services. In a 1988 survey2 of US. and Canadian adults,
7.6 percent of Americans surveyed-representing about 18 million
people-reported that they failed to receive needed medical care for
financial reasons, compared to less than 1 percent of Canadians. The
proportion that did not receive needed medical care for nonfinancial
reasons (such as inability to get appointments or lack of transportation)
was also higher in the United States than in Canada. (See fig. 2.1.)
2R.J. Blendon, “Three Systems: A Comparative Survey,” Health Management Quarterly, First Quarter
1989, pp. 2-10.
Page 21
GAO/H&D91-90 Canadian Health Insurance

Chapter 2
StlUetureOftlli?cMdion
System Credfs
Diffemncm in Aamw and Cost control
Flgure 2.1: Survey Rerpondentr Who Did
Not Receive Needed Medlcal Care (1988) 8
I
United States
Canada
Source: Slendon, “Three Systems,” pp. 2-10, Exhibit 9.
Coverage in Canada Is
Universal
In Canada, universal health insurance covers the entire population.
Each provincial health plan must offer health coverage to all legal pro-
vincial residents. Thus, Canadians are not excluded on the basis of
income or health status3
Coverage in Canada is “portable.” It is not linked to employment,
patient residence, or provider location. A resident’s home province will
pay for health expenses incurred in other provinces and, to some extent,
outside the country. Portability enhances job mobility: since health
insurance coverage is not linked to employment, people need not stay in
a job simply because it offers a needed health benefits package.
3While all social classes use the same facilities and get similar care, wealthier patients are able to
afford more amenities, such aa private rooms instead of standard wards, and to seek care in the
United States.
Page 22
GAO/HRD-91-99 Canadian Health
Insurance

chapter 2
s-orthecsnadirn System Ckent.4~
Diilereneecl in Acceea and Coot control
Provincial health plans provide unlimited insurance coverage for all
medically necessary services. These include hospital inpatient care (at
standard ward level), hospital outpatient care, and physician services,
Hospital admissions are the prerogative of the physician and patient
without interference by the insurer (the government). There are no
restrictions placed on a patient’s choice of physician.4 Other covered
benefits vary by province and may include outpatient prescription
drugs for the elderly and poor, preventive services, and routine dental
care for children.
For both hospital and physician services, government reimbursement
represents payment in full. Individuals do not pay deductibles or copay-
ments for covered services. Provincial plans vary in the range of bene-
fits provided and the extent to which they reimburse charges. People
may still incur out-of-pocket expenses for services not included in the
provincial plans, such as routine adult dental care and cosmetic surgery,
and additional charges for a private or semiprivate hospital room. Indi-
viduals often obtain private health insurance coverage through their
employer to defray the cost of such services.
Coverage in the United
States Is Uneven
In the United States, residents have varying degrees of health insurance
coverage-from comprehensive to none at all. In 1988,86 percent of
Americans under age 66 had some health insurance, either public or pri-
vate. (See fig. 2.2.) Private health plans cover almost three-quarters of
the under 66 population. A variety of public programs provide health
insurance or direct health care to the elderly, the disabled, military per-
sonnel and their dependents, veterans, federal civilian employees, native
Americans, and the poor.
41n some provinces, there are financial disincentives to discourage patients from using specialists
without referrals. The disincentives are directed to physicians rather than patients.
Page 23
GAO/IiRDBl-99 C%nadlm Health Insurance
Chapter 2
Structure of the Canadb System Creates
DlfYerences in Access and Cost Control
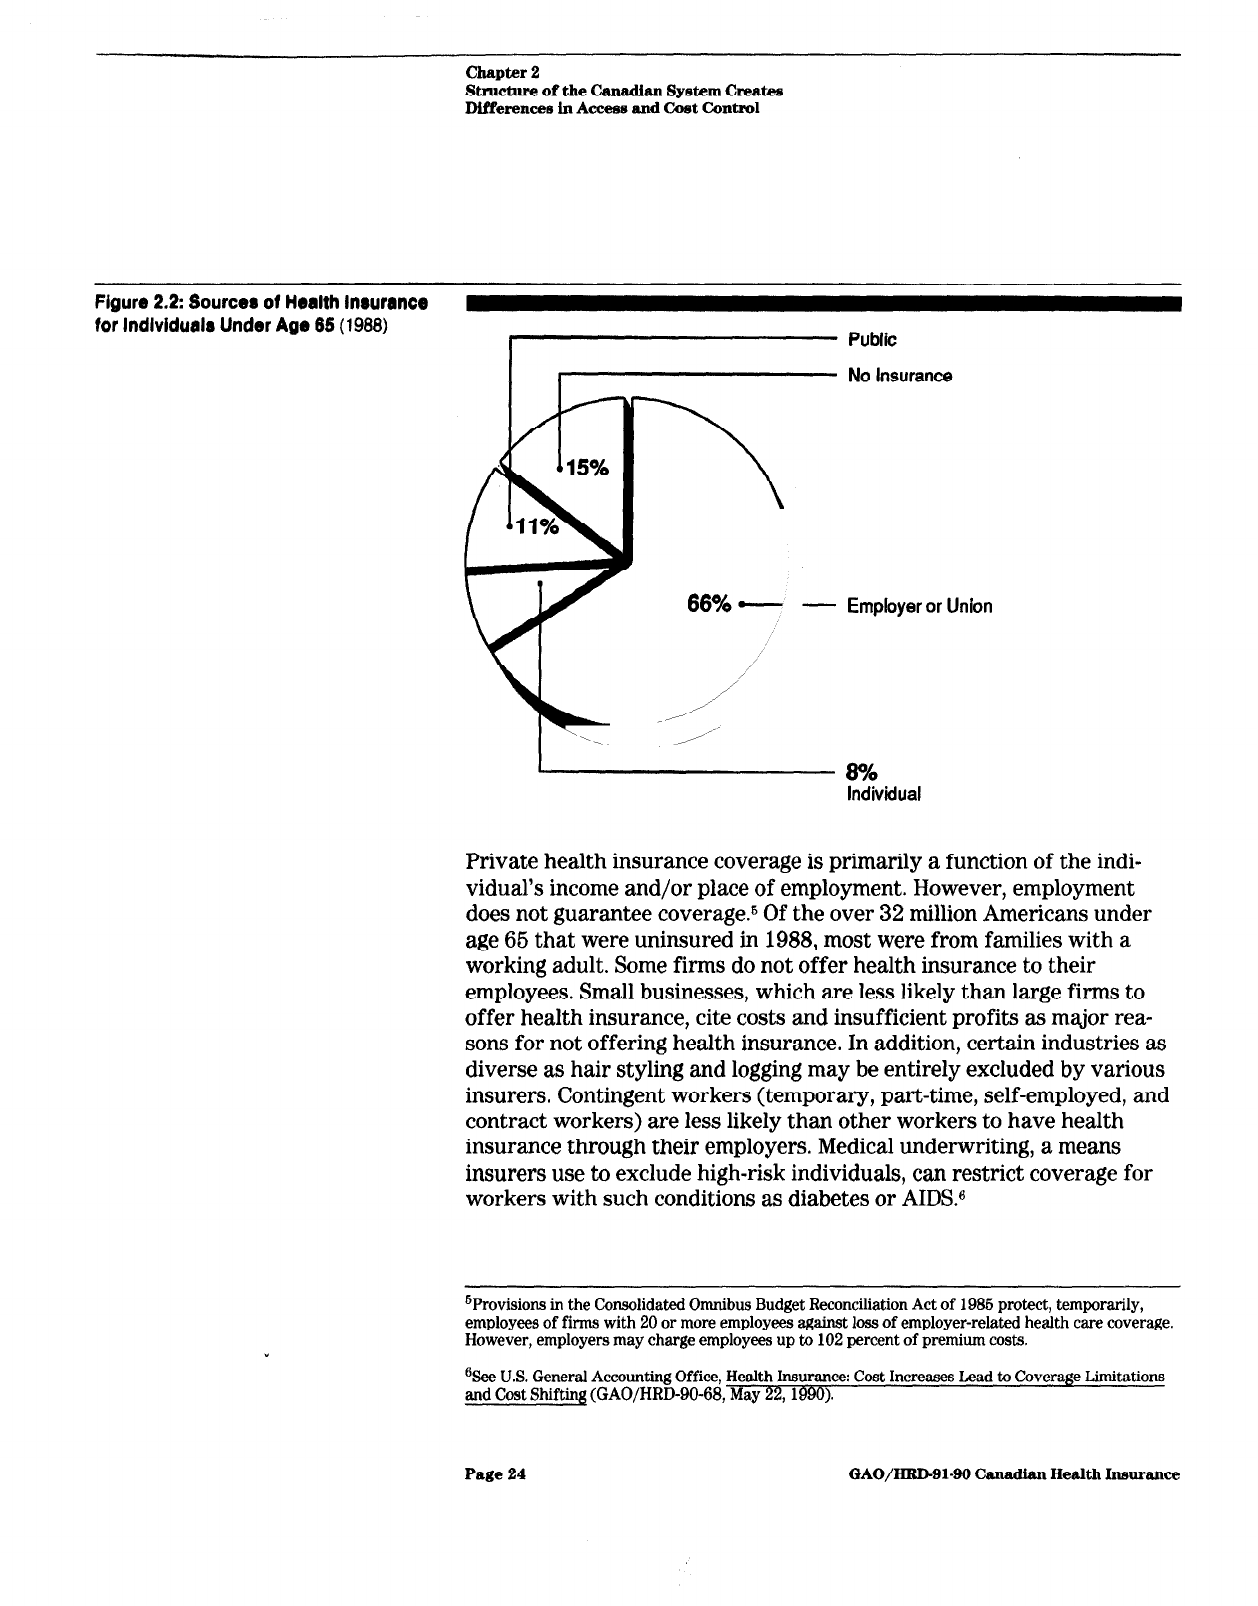
Figure 2.2: Sourcer of Health Inwrance
for lndlvidualr Under Age 65 (1988)
- Employer or Union
Private health insurance coverage is primarily a function of the indi-
vidual’s income and/or place of employment. However, employment
does not guarantee coverage.6 Of the over 32 million Americans under
age 66 that were uninsured in 1988, most were from families with a
working adult. Some firms do not offer health insurance to their
employees. Small businesses, which are less likely than large firms to
offer health insurance, cite costs and insufficient profits as major rea-
sons for not offering health insurance. In addition, certain industries as
diverse as hair styling and logging may be entirely excluded by various
insurers. Contingent workers (temporary, part-time, self-employed, and
contract workers) are less likely than other workers to have health
insurance through their employers. Medical underwriting, a means
insurers use to exclude high-risk individuals, can restrict coverage for
workers with such conditions as diabetes or AIDS.6
6Provisions in the Consolidated Omnibus Budget Reconciliation Act of 1986 protect, temporarily,
employees of firms with 20 or more employees against loss of employer-related health care coverage.
However, employers may charge employees up to 102 percent of premium costs.
%ee U.S. General Accounting Office, Health Insurance: Cost Increases Lead to Coverage Limitations
and Cost Shifting (GAO/HRD-90-68, May 22,199O).
Page 24 GAO/HID-91-99 Canadian Health Insurance

chapter 2
S~ctinre of
the
cauuman System CreaW
Differencea in Access and Cost Control
The extent of benefits varies widely among insurers. Most insurance
sold by private companies is regulated primarily by the states, and thus
must provide state-mandated minimum benefits. Self-insured employer
plans, which do not fall under the jurisdiction of state insurance laws,
cover about half of insured workers.7 Medicare provides reimbursement
for a standard set of benefits for all beneficiaries. Medicaid, the joint
federal and state health insurance program, also has a federally man-
dated core package of benefits, to which the states may add benefits.
Most insurance plans require copayments, including coinsurance,
deductibles, or both. In addition, insurance companies may have limits
on their total liability. Medicare requires copayments or deductibles and
allows extra billing by providers.8
In addition to cost sharing, health insurers use other approaches
designed to control costs, which result in limits on access to care. Under
managed care, for example, insurers’ strategies for deterring unneces-
sary care have controlled the use of services.O The Medicaid program
also limits access by a variety of means. Some states, for example, limit
the number of inpatient hospital days they will cover or establish low
physician reimbursement rates, which can restrict recipients’ ability to
find participating providers.
The uninsured face financial barriers to health care and receive less
health care than other individualslO They generally use fewer services
and rely more on providers’ willingness to provide uncompensated care.
Some receive services for free or at reduced rates in various settings,
such as private hospital emergency rooms and government-run clinics
and hospitals.
‘Employers that self-insure assume the risk of paying for their employees’ health care costs instead
of purchasing insurance coverage.
‘However, the United States is moving to liiit these charges for Medicare services; in other pro-
grams, it liits which services or beneficiaries may be liable for copayments.
Q’f’echniques include gatekeeping by a primary care physician, prior authorization, second surgical
opinions, utilization review, and capitation payments to the provider with financial disincentives for
hospitalization or referral to specialists. Inconveniences, such as delays for service or required
preauthorizations before using an emergency department, are also barriers to access.
%ee J. Hadley, E. Steinberg, and J. Feder, “Comparison of Uninsured and Privately Insured Hospital
Patients: Condition on Admission, Resource Use, and Outcome,” Journal of the American Medical
Association, Vol. 266, No. 3. Jan. 16, 1991, pp. 374-379.
Page 26
GAO/HRDBl-90 Canadian Health Insurance

Chapter 2
Stracture of the Canadhn
System Create9
Dlfferacea ln Aeceen and Cwt Coniml
Canada’s System Is
Administered
by
a
In Canada, the same entity in each province is responsible for adminis-
tration, regulation, and financing. Thus a single entity is responsible, in
Single Payer in Each
fiscal as well as political terms, for the performance of the system. In
the United States, responsibility for administering, controlling, and
Province
funding the health care system is diffuse. The United States has a plu-
ralistic system of financing that involves private insurers, employers,
and federal, state, and local governments in reimbursing health care
services.
The Canadian government-
federal
and provincial-is almost the
exclusive source of payment for medical care covered under the provin-
cial health plans. In 1987, public payments accounted for 74 percent of
the nation’s total expenditure for health care services. Private insurance
and individuals made up the balance of the health expenditures for
purchase of services not covered by the plans. In contrast, U.S. private
payers-insurance companies and individuals-provided 67 percent of
the funds used to purchase health care services in 1987.
Provincial Management
With Shared Federal-
Provincial Financing
Each provincial plan is financed jointly by the provincial and federal
governments. To receive a federal subsidy, provinces “enroll” in the
national health program by enacting provincial health insurance plans
meeting the set of five conditions outlined on page 20. The provincial
governments receive block grants to administer their plans (the federal
share of public expenditures on health averages about 40 percent). The
provincial governments use various combinations of general revenue,
premiums, and taxes to finance the program.
Following federal guidelines, provincial health plans are administered
by public agencies on a nonprofit basis. Provincial authorities decide
(1) how much money will be spent on health, (2) whether to insure ser-
vices beyond those of the national policy, and (3) how it will finance the
provincial share of the plan’s costs.
The leading constraint on spending derives from the single funding
source structure of the Canadian system. The provincial government is
the sole source of funds for the hospital and physician budget sectors.
Providers have no other source of income if they are dissatisfied with
government reimbursements unless they opt completely out of the
system. This provincial monopoly over payments serves as the founda-
tion for cost control over these sectors of the Canadian health budget.
Page 26
GAO/HUD-9180 Canadian Health Insnrance

chapter 2
Strnctnre of the Cunadi~ System Creat4s
Dlffemncea in Acmw and Cost Control
With the government as payer, patients do not take part in the reim-
bursement of hospital and physician services. The government pays hos-
pitals with lump-sum payments, which account for most of hospitals’
operating revenues. It also approves expenditures for capital improve-
ments, new equipment, and expansion. The government reimburses
physicians according to a schedule of fixed rates that are set by the pro-
vincial medical association and are constrained by the total percentage
increase in the fee base negotiated between the government and the
association.
U.S. Health Care System
Lacks Central Control
In the United States, multiple entities-some federal, some state, and
some private-have a role in financing, administering, and reimbursing
the health care system. The lack of a single entity managing the system
results in piecemeal measures to control costs. On the other hand, the
decentralized competitive system offers the possibility of greater con-
sumer choice concerning the level and nature of health care benefits for
some Americans. It has also led to the development of innovative
approaches to health care delivery, like
HMOS
and managed care.
With a variety of reimbursement systems, U.S. providers are often paid
different amounts for the same services, depending on the consumer’s
insurance carrier.” Hospitals are paid prospectively on a fixed amount
per case by Medicare or on a fixed percentage of charges, on a per diem
rate, or in full by other insurers. Others, such as Department of Veterans
Affairs hospitals, are funded on a fixed budget. Reimbursement
methods for U.S. physicians include salary, fee-for-service, and a fixed,
per-patient amount (capitation).
Under the US. multiple payer system, reimbursement rates often vary
among payers, with some payers being more “generous” than others (in
some states, for example, Medicaid is regarded as having low reimburse-
ment rates). As a result, providers may increase charges to other
sources to compensate for low reimbursement. Individual insurers try to
limit their own costs, usually without coordination with other payers,
“Medicare influences private sector payers because of its size. Some policies it adopts have been
adopted by other payen, such as Blue Cross/Blue Shield.
Page 27
GAO/HRDQl-99 Canadian Health Insurance

Chapter 3
Single Payer Structure With Province-Wide
Policies Helps Control National Heakh Spending
With its single payer arrangement for financing and administering its
health care system, Canada has been more successful than the United
States in constraining costs in the insurance, physician, and hospital
components of its health care budget. A single payer lowers the cost of
administering both private and public health insurance and helps reduce
the administrative costs borne by hospitals, physicians, and patients. It
also has the political incentives and ability to restrain overall health
expenditures.
Within the single payer framework, Canada has been partially suc-
cessful in limiting spending growth for physician services by controlling
physician fees. Canada has also contained hospital costs by allocating to
individual hospitals lump-sum budgets, called “global budgets,” and by
setting constraints on the acquisition and use of high-technology equip-
ment and services.
Most of the difference between U.S. and Canadian per capita health care
spending comes from the insurance, physician, and hospital sectors. In
1987 (the latest year for which comparable sectoral data are available),
Canada spent $448, or 23 percent, less per capita on health care. Insur-
ance overhead (the cost of administering public and private insurance
programs), payments for physician services, and payments to hospitals
accounted for 78 percent of the total per capita spending difference
between the two countries. Except for two sectors, public health and
drugs and appliances, Canadian per capita expenditures were below the
U.S. level. (See table 3.1.)
Page 28
GAO/HRlb91-99 Canadian Health Insurance

Single Payer Stmcture With Province-Wide
Pollciea Helps Control Natlonal
Health Spending
Table 3.1: Health Expenditures Per
Capita, by Sector (1987)
In 1987 U.S. dollars
Sector
U.S.
2’E%
Canada Difference difference
Hospitals and constructiona $802
$659
$144
32
Physicians’ services
369 241 128 29
Insurance overheadb
95 18 77 17
Other c)rofessionalsc
84 20 64 14
Dentists’ services 108 82
26 6
Research
36 13 23 5
Other health care
49 42 7 2
Other institutionsd
158 156 2 1
Public health
58 67 -9 -2
Drugs and appliances
Total0
196
209 -13 -3
$1,955
$1,507 $440 100
Y.J.S. data include new construction at hospitals and nursing homes; Canadian data include capital
expenditures on construction, repair, and machinery at hospitals, clinics, and homes for special care.
bRepresents the difference between premiums collected and benefits paid by insurers but does not
include provider billing and collection expenses.
‘Represents all health care practitioners except physicians and dentists; includes private-duty nurses,
chiropractors, podiatrists, optometrists, osteopaths, and physiotherapists.
dU S data represent nursing home care: Canadian data include homes for the aged, institutions for the
handicapped, and nursing homes.
‘Sum of percentages may not equal 100 due to rounding.
Source: Canadian data from Health and Welfare Canada; U.S. data from Health Care Financing Adminis-
tration, Office of the Actuary.
Single Payer Lowers
Insurance Overhead
The Canadian single payer system is much less costly to administer as a
result of the arrangements for paying benefits. Having a universal single
payer system lowers the costs of insurance administration by stream-
lining reimbursement and eliminating expenses associated with selling
multiple policies, billing and collecting premiums, and evaluating risk.
Having a single payer also lowers costs for providers by eliminating the
burden of completing numerous, complex claim forms and meeting other
administrative requirements.
Insurance administration was the source of nearly one-fifth of the dif-
ference between Canadian and US. health care spending in 1987. In the
United States, administrative costs for public insurance programs and
Page 29 GAO/HRD-91-w) Canadian Health Insurance
Chapter 3
Single Payer Structure With Province-Wih
Polldee Helpa Control National
HeaIth Spending
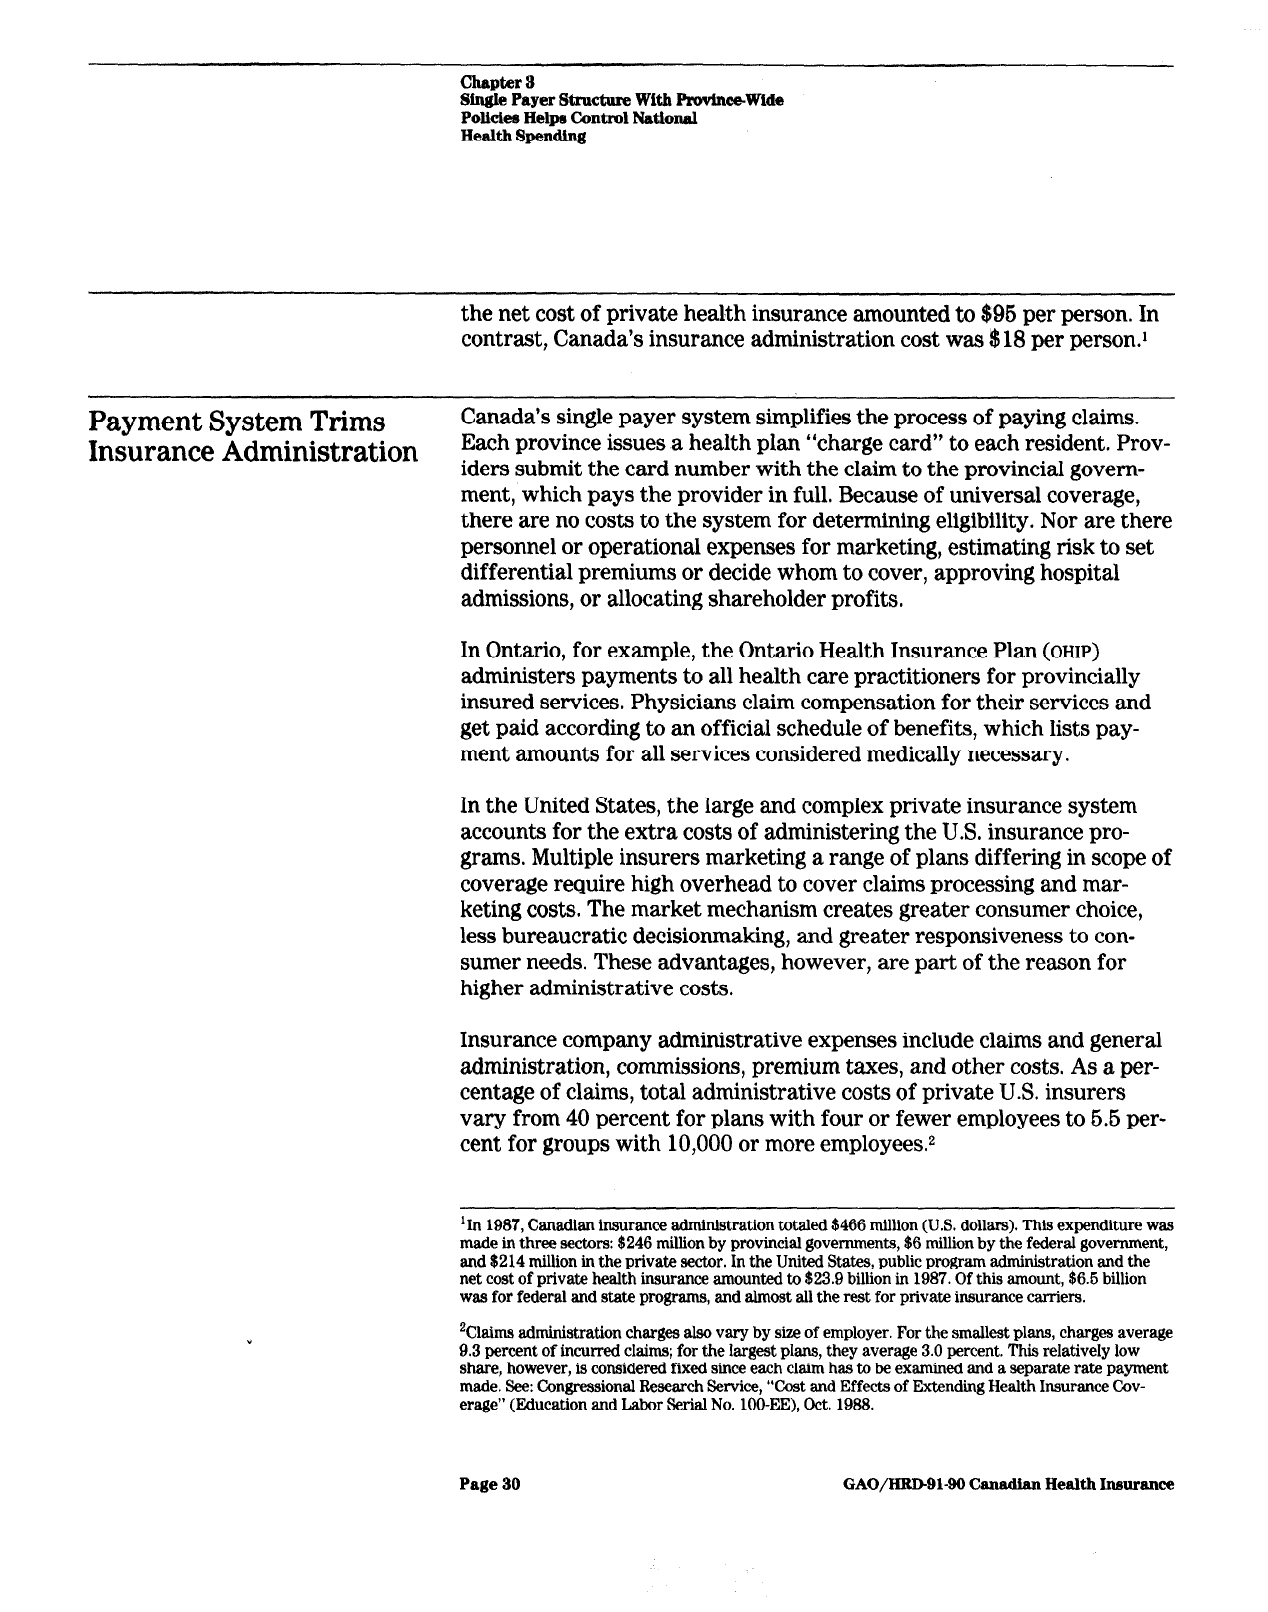
the net cost of private health insurance amounted to $96 per person. In
contrast, Canada’s insurance administration cost was $18 per person.1
Payment System Trims
Canada’s single payer system simplifies the process of paying claims.
Insurance Administration
Each province issues a health plan “charge card” to each resident. Prov-
iders submit the card number with the claim to the provincial govern-
ment, which pays the provider in full. Because of universal coverage,
there are no costs to the system for determining eligibility. Nor are there
personnel or operational expenses for marketing, estimating risk to set
differential premiums or decide whom to cover, approving hospital
admissions, or allocating shareholder profits.
In Ontario, for example, the Ontario Health Insurance Plan
(OHIP)
administers payments to all health care practitioners for provincially
insured services. Physicians claim compensation for their services and
get paid according to an official schedule of benefits, which lists pay-
ment amounts for all services considered medically necessary.
In the United States, the large and complex private insurance system
accounts for the extra costs of administering the U.S. insurance pro-
grams. Multiple insurers marketing a range of plans differing in scope of
coverage require high overhead to cover claims processing and mar-
keting costs. The market mechanism creates greater consumer choice,
less bureaucratic decisionmaking, and greater responsiveness to con-
sumer needs. These advantages, however, are part of the reason for
higher administrative costs.
Insurance company administrative expenses include claims and general
administration, commissions, premium taxes, and other costs. As a per-
centage of claims, total administrative costs of private U.S. insurers
vary from 40 percent for plans with four or fewer employees to 6.6 per-
cent for groups with 10,000 or more employees.2
‘In 1987, Canadian insurance administration totaled $466 million (U.S. dollars). This expenditure was
made in three sectors: $246 million by provincial governments, $6 million by the federal government,
and $214 million in the private sector. In the United States, public program administration and the
net cost of private health insurance amounted to $23.9 billion in 1987. Of this amount, $6.6 billion
was for federal and state programs, and almost all the rest for private insurance carriers.
2Claims administration charges also vary by size of employer. For the smallest plans, charges average
9.3 percent of incurred claims; for the largest plans, they average 3.0 percent. This relatively low
share, however, is considered fixed since each claim has to be examined and a separate rate payment
made. See: Congressional Research Service, “Cost and Effects of Extending Health Insurance Cov-
erage” (Education and Labor Serial No. lOO-EE), Oct. 19%
Page 30 GAO/HRD91-99 Chnadhn Health Insurance

slngm Payer Stmwtum With ProvinwWide
PoUcha Helpa corrtrol National
Iiealdlspsndine
In both Canada and the United States, the overhead expense of health
insurance is far less for government programs than for private health
insurance. Public programs in both countries benefit from economies of
scale (public programs are generally much larger) and the absence of
marketing costs. For 1987, overhead expenses for Canada’s public
health insurance programs were about 1 percent of total program costs,
and for U.S. public programs, about 3 percent.3 These figures contrast
with about 11 to 12 percent for overhead costs of private insurance
plans in both countries.
Insurance administration in Canada is a smaller component than in the
United States and has remained small since the introduction of
government-funded hospital and medical care insurance. In 1987, the
average administrative costs of public and private insurance programs
in the United States represented 4.9 percent of total health expendi-
tures. In Canada, the overhead share of public and private insurance
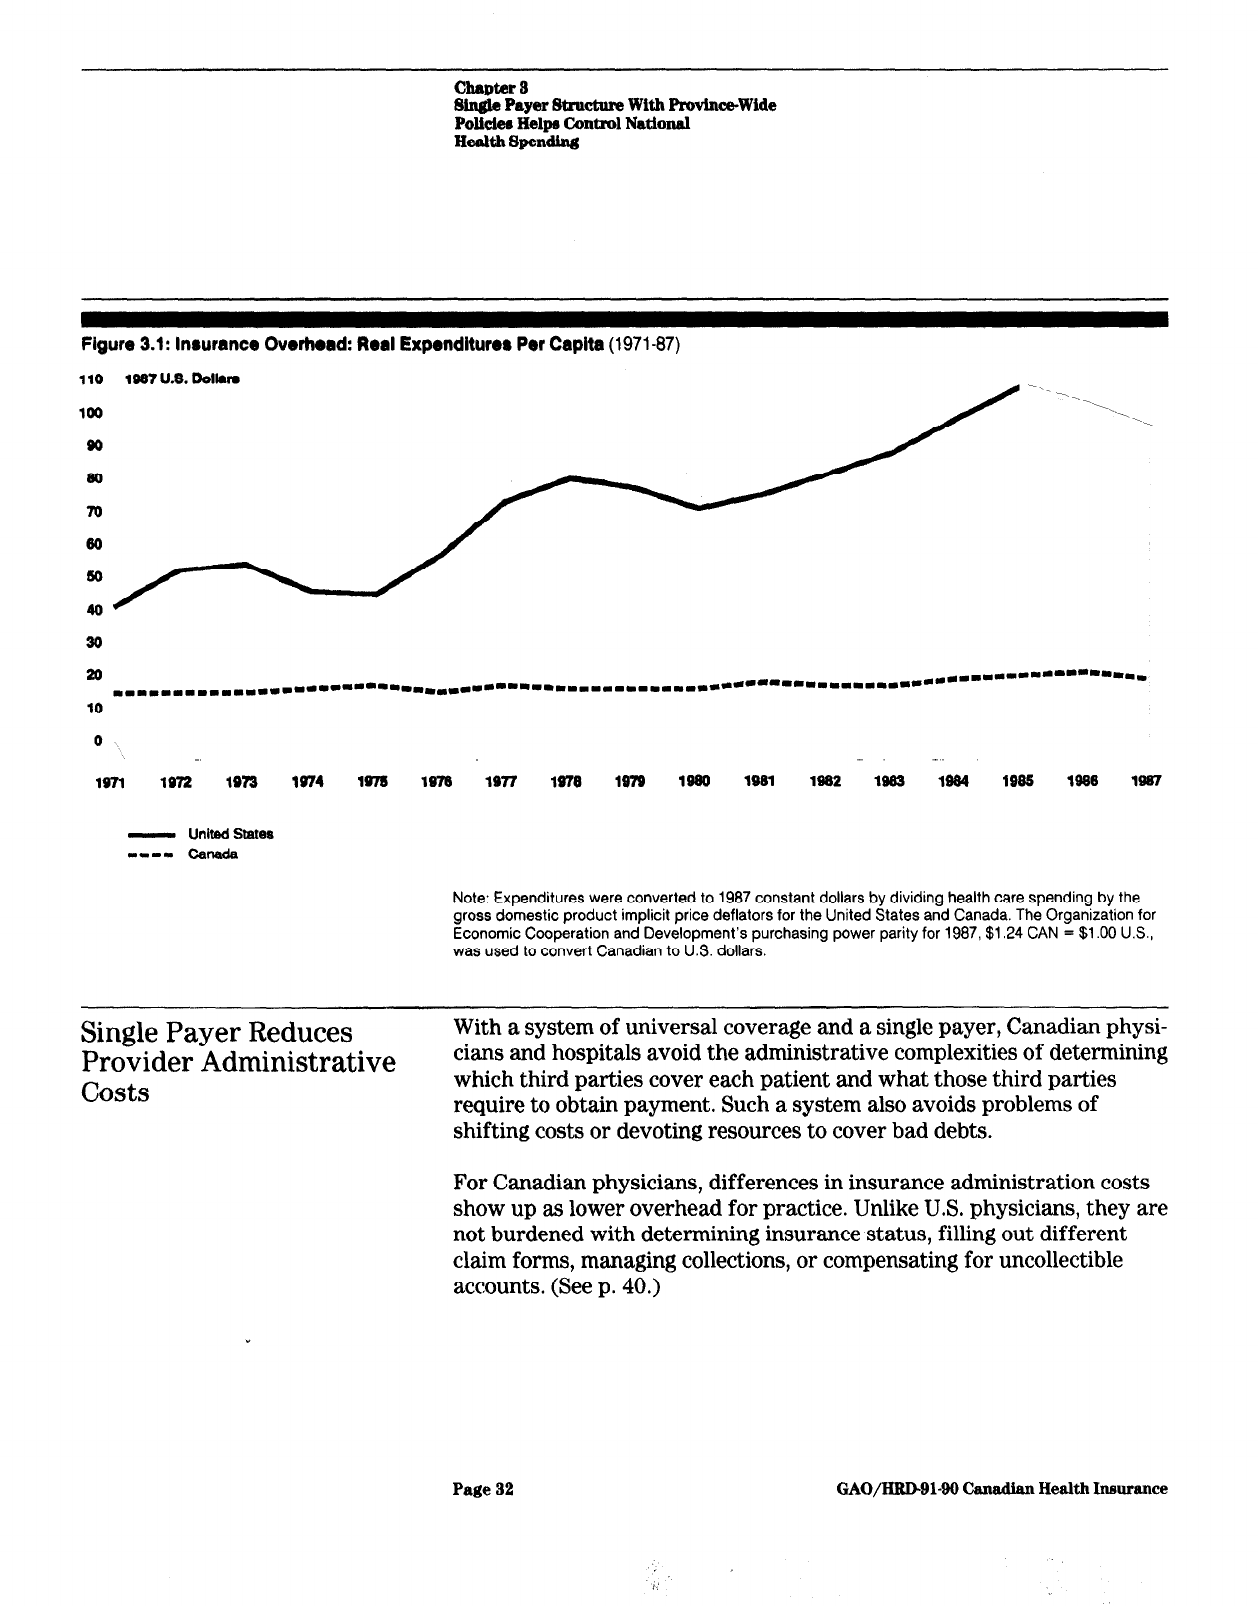
plans is only 1.2 percent. As shown in figure 3.1, real per capita expend-
itures for insurance administration in Canada have remained nearly
constant. Since 1971, this sector of the U.S. health economy has grown
at an average rate of 6.2 percent per year. By 1987, U.S. spending on
insurance overhead had increased to five times that of Canada.
3U.S. public programs incur more utilization review-type expenses and have higher eligibility deter-
mination costs that may help explain the higher U.S. percentage.
Page 31
GAO/HltD91-99 Canadian Health Insurance
chaptar 8
Single Payer Structure With ProvlneWide
Pollciem Help Control Natlonal
Health Spending
Figure 3.1: lnrurance Overhead: Real Expenditure8 Per Capita
(1971-87)
- Unitfd State8
m-1. c&la&
Note: Expenditures were converted to 1987 constant dollars by dividing health care spending by the
gross domestic product implicit price deflators for the United States and Canada. The Organization for
Economic Cooperation and Development’s purchasing power parity for 1987, $1.24 CAN = $1 .OO U.S.,
was used to convert Canadian to US. dollars.
Single Payer Reduces
Provider Administrative
ll#.,&,
c/US
LS
With a system of universal coverage and a single payer, Canadian physi-
cians and hospitals avoid the administrative complexities of determining
which third parties cover each patient and what those third parties
require to obtain payment. Such a system also avoids problems of
shifting costs or devoting resources to cover bad debts.
For Canadian physicians, differences in insurance administration costs
show up as lower overhead for practice. Unlike U.S. physicians, they are
not burdened with determining insurance status, filling out different
claim forms, managing collections, or compensating for uncollectible
accounts. (See p. 40.)
Page 32
GAO/HRDBl-99 Canadian Health Inmrance
I’

chapter 3
Single Payer Structure With Province-Wide
Polici~ Help6 Control National
Health Spending
Hospital administration and accounting costs are also lower in Canada
because hospitals need fewer administrative personnel. A Canadian hos-
pital has virtually no billing department and a minimal accounting struc-
ture to attribute costs and charges to individual patients and physicians.
(see p. 47.)
In the United States, provider overhead includes the accounting costs of
complying with the requirements for many insurers’ documentation as
well as dealing with eligibility determinations, direct billing of patients,
and collections. One study estimated that, when provider overhead is
included, administration costs may account for more than half the dif-
ference in cost between the Canadian and U.S. systems.4
While Canada’s reduced administrative requirements may lower costs,
they also reduces the potential to manage costs as effectively. For
example, Canadian hospitals have been described by physicians as
having underdeveloped information systems. Unlike the U.S. reimburse-
ment system, the global budgeting approach provides hospitals fewer
incentives for careful tracking of costs per patient day or costs per case.
Fee Controls and
Other Policies Limit
Physician
Expenditures
Canada has more active physicians per person and uses more physician
services per capita than the United States, but it spends less for physi-
cian services per person. The difference in expenditure levels is attrib-
uted primarily to provincial governments’ control over fees.6 However,
Canada’s potential savings from constrained growth in fees are eroded
somewhat by increased use of physicians’ services. Physician supply
policies that affect the professional specialty mix also maintain rela-
tively lower spending for physician services. Finally, the universal cov-
erage, single payer structure lowers physicians’ expenses for
administration.
4S. Woolhandler and D.U. Himmelstein, “The Deteriorating Administrative Efficiency of the U.S.
Health Care System,” New England Journal of Medicine, Vol.
324,
No. 18, May 2,1991, pp. 1263-
1268.
6V.R. Fuchs and J.S. Hahn, “How Does Canada Do It: A Comparison of Expenditures for Physicians’
Services in the United States and Canada,” New England
Journal
of Medicine, Vol. 323, No. 13, Sept.
27,1900,
pp. 884-890.
Page 33
GAO/HRD-91-90 t?amdan Health Insuran~
chapters
Single Payer Strum With Prmince-Wide
Polideo Helps Control National
Health Spending
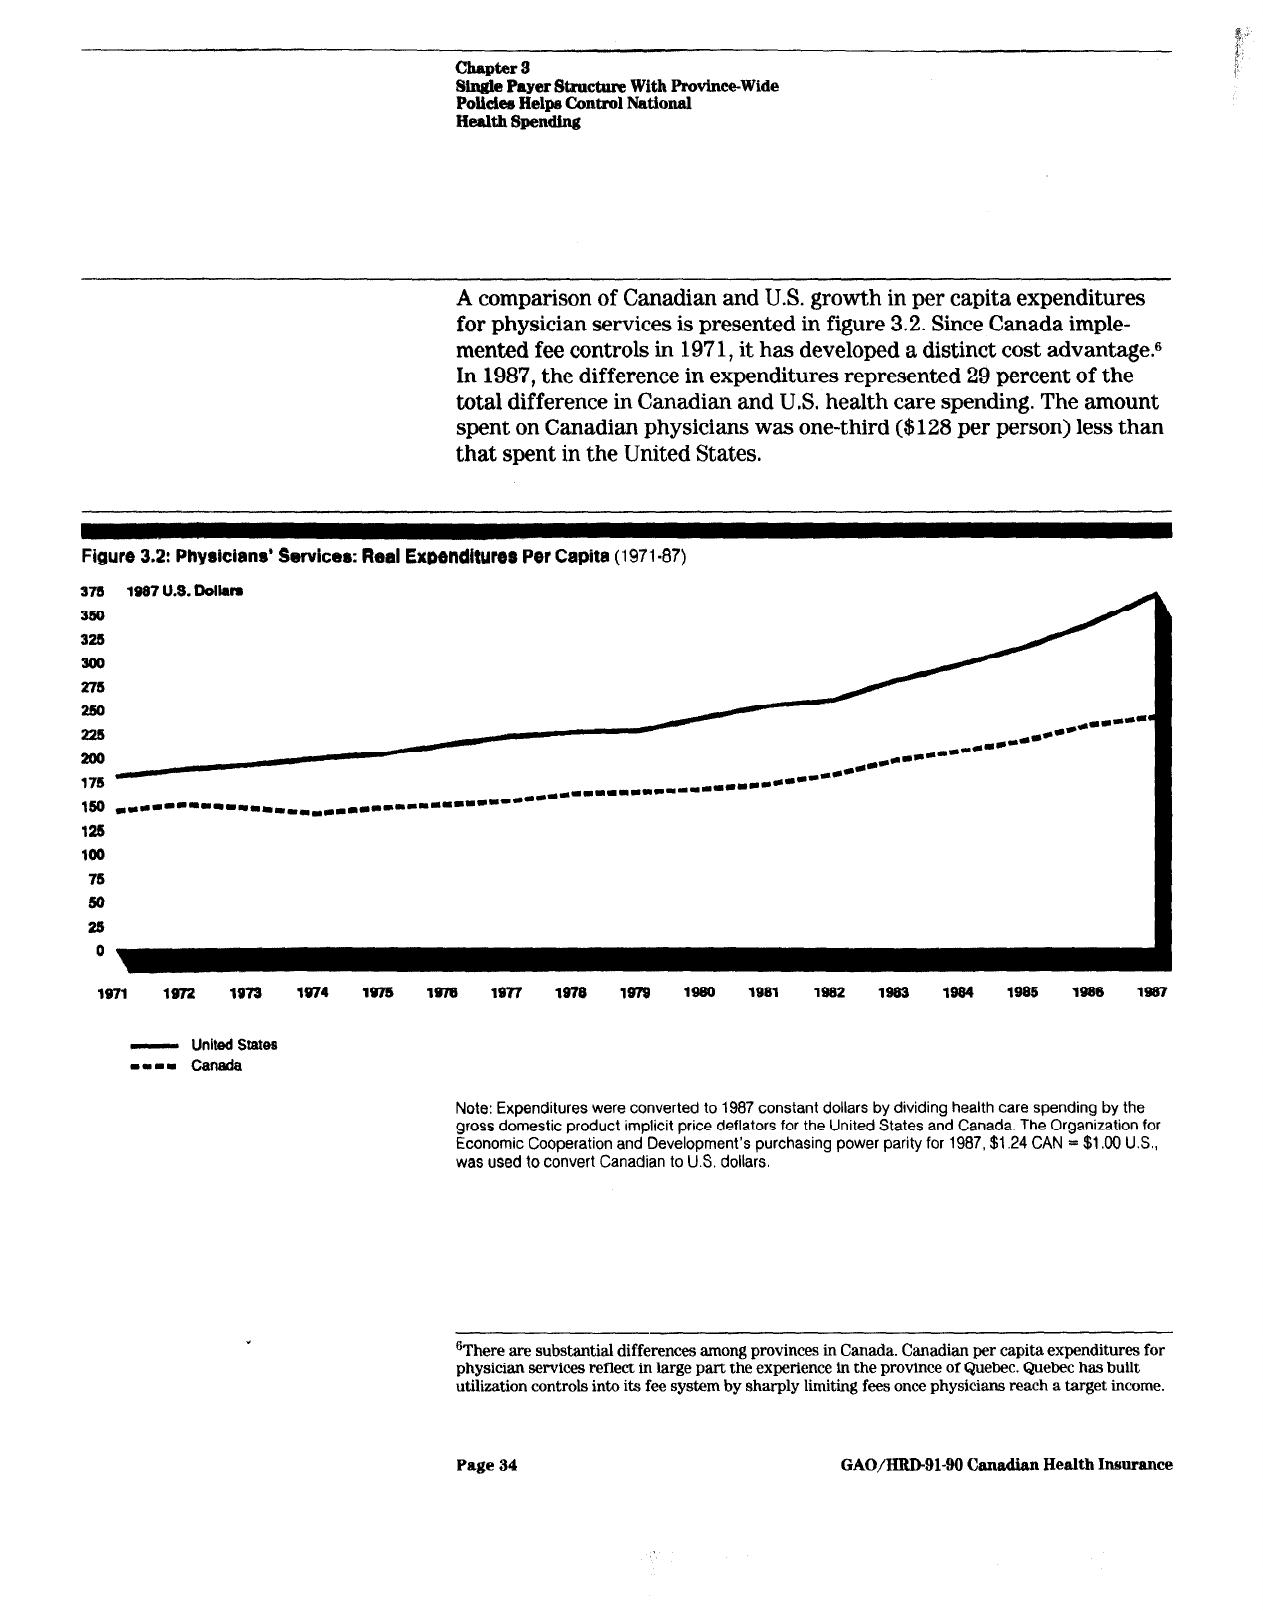
A comparison of Canadian and U.S. growth in per capita expenditures
for physician services is presented in figure 3.2. Since Canada imple-
mented fee controls in 197 1, it has developed a distinct cost advantagem6
In 1987, the difference in expenditures represented 29 percent of the
total difference in Canadian and U.S. health care spending. The amount
spent on Canadian physicians was one-third ($128 per person) less than
that spent in the United States.
Figure 3.2: Physicians’ Services: Real Expenditures Per Capita
(1971.87)
378 378
1997 U.S. Dolkm 1997 U.S. Dolkm
SW SW
325 325
300 300
375 375
250 250
238 238
**..----- *am-- **..----- *am--
.-- ****---* .-- ****---*
**.*.---- **.*.----
180 180
*L--*-----II.~~~*L*****~*~*~***- *L--*-----II.~~~*L*****~*~*~***-
******I.*I.*aL~~-*----- ******I.*I.*aL~~-*-----
12S 12S
100 100
76 76
80 80
28 28
0 0
1671 1972 1973
1974 1975 1975
1977 1970 1979 lseo
1991 1952 1933 1964
1995
1996 1997
- United States
-0-m Can&a
Note: Expenditures were converted to 1987 constant dollars by dividing health care spending by the
gross domestic product implicit price deflators for the United States and Canada. The Organization for
Economic Cooperation and Development’s purchasing power parity for 1987, $1.24 CAN = $1.00 U.S.,
was used to convert Canadian to U.S. dollars.
gThere are substantial differences among provinces in Canada. Canadian per capita expenditures for
physician services reflect in large part the experience in the province of Quebec. Quebec has built
utilization controls into its fee system by sharply limiting fees once physicians reach a target income.
Page 34
GAO/H&D91-90 Canadian Health Insurance

chapter 8
Single Payer Stroctnre With ProvlnceWlde
Policiee Helps Control National
Health Spemding
Controlling Physician Fees
Canada’s ability to limit growth in per capita spending on physician ser-
Has Been Reasonably
vices is largely the result of constraints on physician fees. Through
Effective in Restraining
negotiations with provincial medical associations, provincial govern-
Overall Physician
ments use their power as the single buyer of medical services, called
Expenditures
monopsony power, to hold down prices paid to physicians. Since physi-
cians’ ability to bill patients directly was effectively eliminated in 1984,
government payment represents payment in full.
Fees for most specific physician services are much lower in Canada than
in the United States. A comparison7 of 1986 Ontario fees for selected
procedures with 1986 mean Medicare charges shows that Ontario fees
were consistently well below the average Medicare fee.g For example,
the Ontario fee for a coronary artery bypass was 25 percent of the Medi-
care charge. Similarly, the Ontario fee for cataract removal with inser-
tion of intraocular lens was 24 percent of the Medicare charge,
Fee schedule negotiations in Canada have succeeded not only in control-
ling physician fees but also in reducing them in real dollar terms.” A
comparative analysis of inflation-adjusted fees shows a decrease of 18
percent between 1971 and 1985 in Canada. (See fig. 3.3.) In contrast,
U.S. fees increased by 22 percent over the same period.
Utilization Increases
Reduce Some Gains From
Fee Controls
Although fee controls are crucial to containing physician expenditures,
they give physicians incentives to increase the volume of services they
provide. Physicians have responded, in both Canada and the United
States, to fixed and constrained fee schedules by increasing the volume
of services they provide. Provincial governments now recognize that the
method of reimbursing physicians must control both price and quantity
increases.
7W C Hsiao and others, “Results and Policy Implications of the Resource-Based Relative-Value
Study,” New England Journal of Medicine, Vol. 319, No. 13, Sept. 29,19@3, pp. SSl-SSS.
*This does not reflect the fact that U.S. physicians can charge the patient fees above the Medicare fee
schedule, which is not permitted in Canada.
‘The fee schedule establishes a price for each medical service covered by public insurance. After the
medical association and the provincial government negotiate the overall increase in the fee schedule,
the association decides how to allocate the increase to different specialties and services.
Page 35
GAO/HID-91-90
Cam&an Health Insurance

Chapter 3
Single Payer Structure With Province-Wide
Polidee Helpa Control National
Health Spending
The ban on extra billing, an increase in physician supply (which has
lowered the number of patients per physician), and limitations on hos-
pital resources have put greater financial pressures on physicians.1o
Increasing utilization is the primary option left for physicians to raise
income levels beyond the rate of increase in fees, Figure 3.3 shows that
while inflation-adjusted fee levels declined during the 197Os, utilization
per capita steadily increased. These utilization increases were not
enough, however, to eradicate the constraining effects of fee limitations.
Figure 3.3: Indexes of Per Capita Utilization and Inflation-Adjusted Physicians’ Fees in Canada
(1971-85)
190 IndaodUlillzmtlon,Phploianm'hr(10FI .lW)
20
0 ._ ._ - ..-- - - - . ,. - ._ -
._- .
197-l 1972 lB73 1974 lw5 1976 1977 1978 1979 1960 1981 1902 1983 1984 1985
- Utilization
---- Physldans'Feea
Source: M.L. Barer. R.G. Evans, and R.J. Labelle, “Fee Controls as Cost Control: Tales From the Frozen
North,” Milbank Quarterly, Vol. 66, No. 1, pp. l-64, Table A3.
Canadian data indicate that the number of physician services has risen
more rapidly than the number of physicians. In the 2 years after
Ontario’s ban on extra billing, services per physician grew by nearly 2.5
‘%ontrols on hospital expenditures impinge on individual physicians by limiting the complementary
resources that are available to them. The number of hospital beds per physician has declined substan-
tially. This has resulted in more restrictions beiig placed on hospital admitting privileges, leading to a
commensurate reduction in physicians’ earning potential.
Page 36
GAO/HLuIsl-90 Canadian Health Insurance
Chapter 3
Single Payer Stmcture With Province-Wide
Polich Helps Control National
Health Spending
percent each year; in the previous 7 years, the average annual increase
had been a little over 1 percent.
The Canadian provinces recognize the need to place constraints on phy-
sician utilization in order to fully realize the benefits of fee control.ll The
Ontario Ministry of Health, for example, has attempted to constrain
increases in the fee schedules when significant growth in physician utili-
zation above target levels cannot be explained by demographic changes.
To provide incentives for efficiency improvement as well as expenditure
control, the Ministry is considering alternative remuneration systems to
fee-for-service, such as managed care models.
In each province, utilization review committees have been established to
control overbilling and fraud (and possibly control unnecessary ser-
vices). They monitor practitioners to identify patterns of practice that
deviate radically from their peers. The committee can request physi-
cians with aberrant claims to provide an explanation of their billings. If
necessary, they can impose on physicians a formal review and discipli-
nary action. However, because they lack the mandate and resources to
do more than identify outliers, the committees are not considered very
effective. In Ontario, for example, less than 10 percent of doctors with
unusual billing practices were referred for further investigation during
1990.
Physician Supply
Relatively Fewer
Specialists
Ample,
Canada’s fee controls have apparently had little or no effect on the
availability of physicians, The active physician-to-population ratio is
slightly higher in Canada than in the United States. However, the dis-
parity with respect to general and family practitioners is particularly
large, with Canada having nearly four times the number of doctors per
person.
Despite the constraints on fees and extra billing, medicine remains an
attractive profession in Canada. l2 The number of physicians emigrating
from Canada annually decreased from 663 in 1978 to 386 in 1986. (This
may have been due, in part, to more stringent U.S. immigration policies.)
In 1988-89 there were an average of 4 applicants for each first year
IrJ. Lomas and others, “Paying Physicians in Canada: Minding Our Ps and Qs,” Health Affairs, Spring
1989, pp. 80-102.
1zSee J.K. Iglehart, “Canada’s Health Care System Faces Its Problems,” New England Journal of
Medicine, Vol. 322, No. 8, Feb. 22, 1990, pp. 6624568.
Page 37 GAO/HRDQl-90 Canadian Health Insurance

chapter 8
Single Payer Stxucture With Province-Wide
Polida~ Helpr Control National
Health Spendhg
opening in Canadian medical schools. This compares with a U.S average
of 1.6 applicants per first year opening.
Like the United States, Canada’s increase in physicians has been greater
than its increase in the population. Between 1970 and 1988, the number
of practicing physicians nearly doubled; the population per practicing
physician declined from 837 to 526. The government’s concern is with
physician surpluses, rather than shortages.
However, a substantial and growing difference exists in the mix of phy-
sician specialties in the two countries. This is due, in part, to provincial
policies to control postgraduate training. For example, Ontario has a
“guideline” policy that the physician supply ratio should be 66 percent
general practitioners to 46 percent specialists. One approach to maintain
this mix is to control the availability of specialty residency positions in
medical schools.
Unlike the United States, Canada has maintained roughly equal numbers
of generalists and specialists. The proportion of Canadian physicians
engaged in general or family practice increased from 60.8 percent in
1970 to 62.6 percent in 1988. In contrast, the proportion of U.S. physi-
cians engaged in general or family practice decreased from 19 percent in
1970 to about 13.3 percent in 1988. If general internists and general
pediatricians are included, the United States has 33.8 percent primary
care providers.
The 1987 average net income of physicians in Canada was $82,740
(US.), compared with $132,300 earned by U.S. physicians in private
practice. Some of the difference in average net incomes can be explained
by the more specialty-rich mix of physicians in the United States.
Ontario physicians are the highest paid in Canada. Their average net
professional earnings were $96,450 (U.S.) in 1987. As shown in figure
3.4, the range of average net incomes of physicians in different special-
ties is broader in the United States than in Ontario. For surgical and
procedural specialties, U.S. practitioners earn substantially more.
Page 96 GAO/HRDQl-90 Canadian Health Insurance
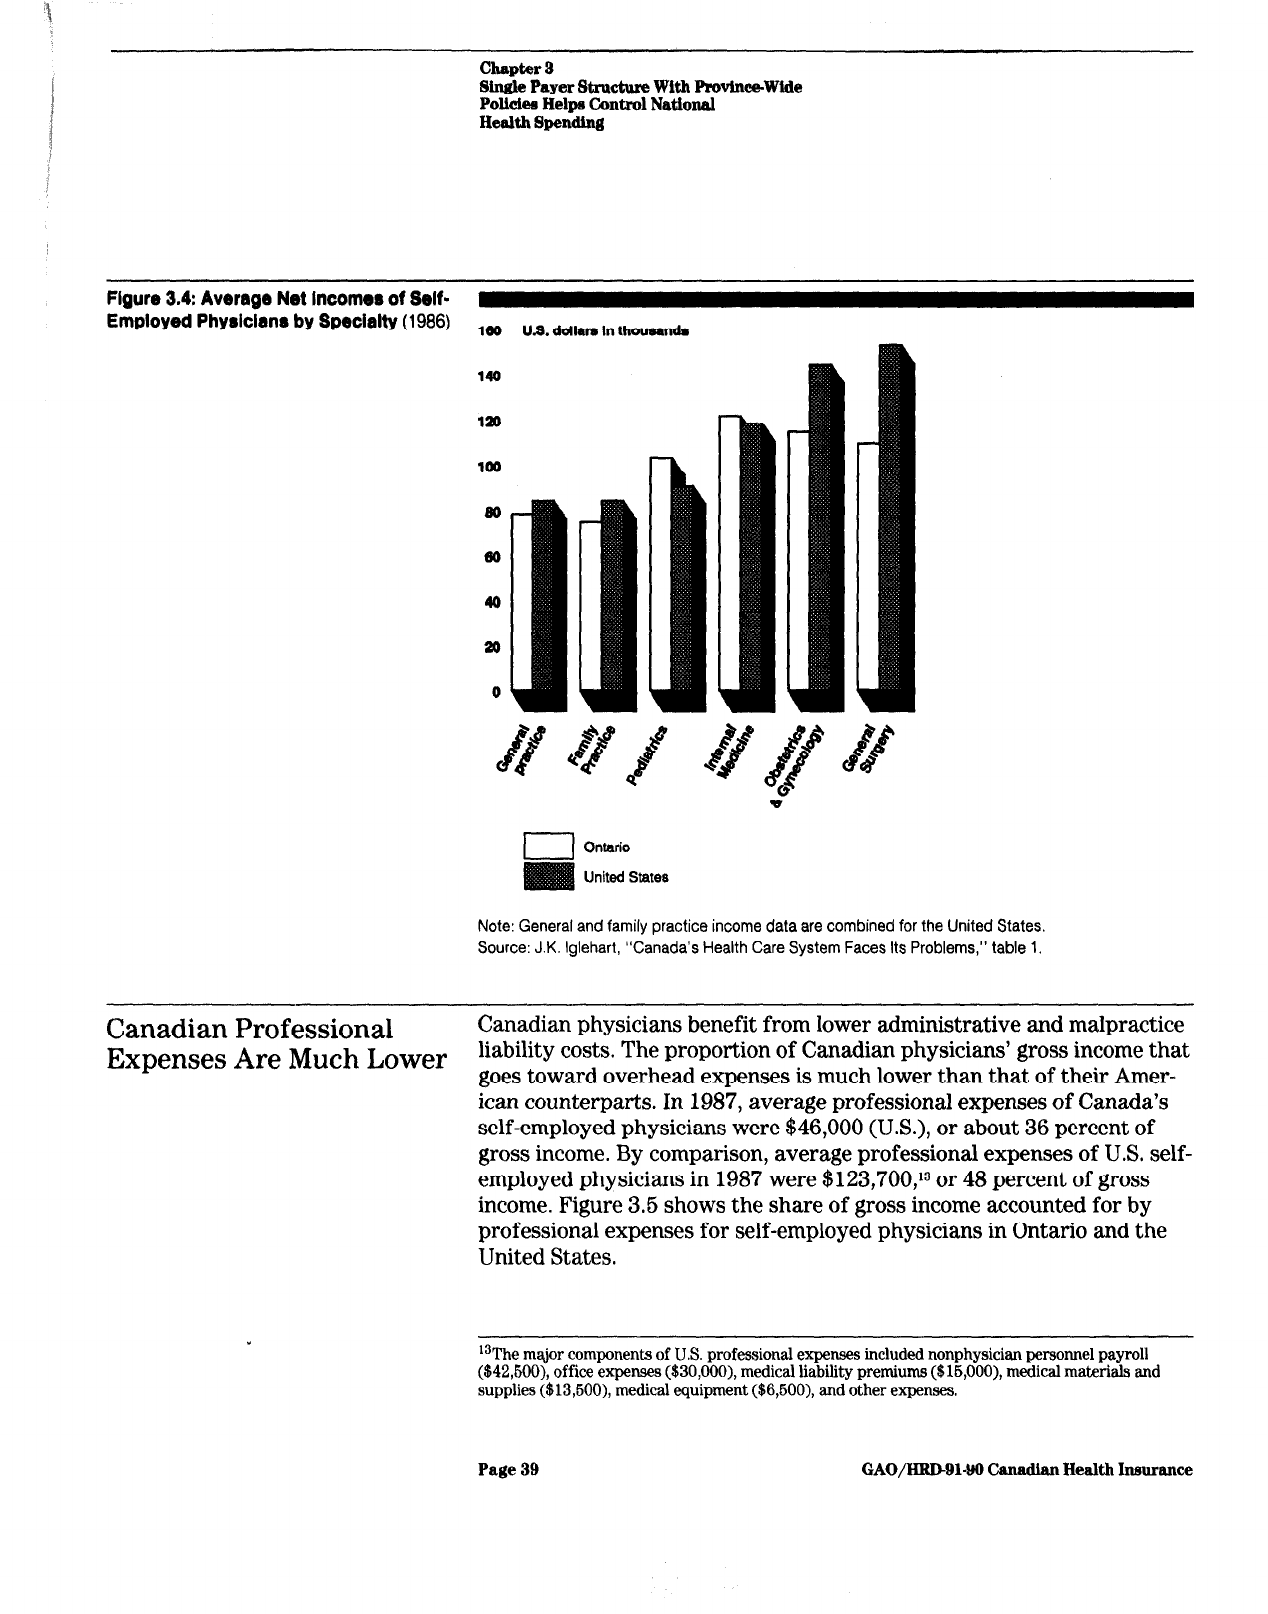
chapter 9
Single Payer St~cture With Ptwinee-Wide
PolIdea Helpa Control National
Health Spending
FIQUW
3.4:
Average Net Income8 of Self-
Employed Physician8 by Specialty (1986)
ldo U.S. ddlara In thousands
I
I Ontario
I
United States
Note: General and family practice income data are combined for the United States.
Source: J.K. Iglehart, “Canada’s Health Care System Faces Its Problems,” table 1.
Canadian
Expenses
Professional
Canadian physicians benefit from lower administrative and malpractice
Are Much Lower
liability costs. The proportion of Canadian physicians’ gross income that
goes toward overhead expenses is much lower than that of their Amer-
ican counterparts. In 1987, average professional expenses of Canada’s
self-employed physicians were $46,000 (U.S.), or about 36 percent of
gross income. By comparison, average professional expenses of U.S. self-
employed physicians in 1987 were $123,700,13 or 48 percent of gross
income. Figure 3.5 shows the share of gross income accounted for by
professional expenses for self-employed physicians in Ontario and the
United States.
13The major
components
of U.S. professional expenses included nonphysician personnel payroll
($42,600), office expenses ($30,000), medical liability premiums ($16,000), medical materials and
supplies ($13,600), medical equipment ($6,600), and other expenses.
Page 39 GAO/HRDQl-99 t3udian Health Insurance

chapter 3
Single Payer Structure With Provtnce-Wlde
Policlem Helps Control National
Health Spending
Figure 3.6~ Prokrrlonal Expenwr aa a
Percentage of Qrorcr income for
Selected Specialtie
(1986)
00
00
I
Ontario
United States
Note: General and family practice data are combined for the United States
Source; Calculated from data presented in J.K. Iglehart. “Canada’s Health Care System Faces Its
Problems.” table 1.
As noted above, U.S. physicians face significant administrative demands
from health insurers. They must bill various public and private third-
party payers and often the patient as well. The need to file multiple
forms, resolve disputed claims, and wait for delayed payment imposes
additional costs. In Canada, physicians submit claims for all their
patients to a single payer in each province and usually receive prompt
and complete payment. Administration in Ontario is simplified by using
a standard claim card and a limited number of service codes. As a result,
the amount of staff and physician time spent on billing is negligible.
A large part of U.S. professional expenses is devoted to billing activities,
including a share of the payroll cost of office staff, the cost of outside
billing services, and the value of the physician’s time spent on claims. A
Page 40
GAO/HRDBl-90 Canadian Health Insurance

chapter g
Single Payer Structure With ProvinwWide
Polidea Helps Control National
Health Spendlng
recent studyI estimates the cost of physician overhead and billing
expenses in the United States at $106 to $203 per capita. By contrast,
the universal coverage, single payer reimbursement system lowers the
overhead cost of practicing medicine in Canada. Under that system, the
study estimates the cost of physician billing and overhead expenses at
$41 to $80 per capita in 1987.
Malpractice premiums are another factor contributing to the differential
in expenditure on physician services. A comparison of average profes-
sional liability premiums in 1987 is shown in table 3.2. The data indicate
that, on average, premiums paid by self-employed Canadian physicians
were less than one-tenth those paid by U.S. physicians.
Table 3.2: Professional Liability
Premiums for Self-Employed Physicians
(1967)
In U.S. dollars
Canadian Mean U.S.
premiums
twemiums
All physicians (average) $1,470 $15,000
General/family practice
645 8,900
Internal medicine 1.090 8.400
Pediatrics 1,090
7,100
Surgery
4,235-6,655 24,500
Obstetrics 6,655
35,300
One reason for differences in malpractice liability may be attributable to
Canada’s universal insurance coverage and broad benefits, which
obviate the need to sue to recover future medical expenses. Such costs in
the United States may constitute one-quarter of the damages awarded in
tort suits. Other reasons are attributable to different national attitudes
toward litigation and differences in tort laws.
Although difficult to quantify, the United States by comparative stan-
dards is a more litigious society than Canada. One study shows that
Canadian physicians are only one-fifth as likely to be sued for malprac-
tice as American physicians.
l6 This may be attributable in part to the
fact that in Canada a large proportion of the winning side’s court costs
are the responsibility of the loser and that cases taken on contingency
are limited (even prohibited in Ontario).
14S. Woolhandler and D.U. Himmelstein, “The Deteriorating Administrative Efficiency of the U.S.
Health Care System.”
16P.C Coyte, D.N. Dewees, and M.J. Trebilcock, “Medical Malpractice-The Canadian Experience,”
New &gland Journal of Medicine, Vol. 324, No. 2, Jan. 10, 1991, pp. 89-93.
Page 41
GAO/HRDBlQO Canndian Health Insurance

chapter a
Single Payer Structure With ProvinceWide
Policiee Helps Control National
Health Spending
Other legal differences between the two countries include the use of
juries, which tend to be more generous than judges toward plaintiffs,
and compensation of plaintiff, lawyer, and court costs. In Canada, juries
are used infrequently, punitive damages are rarely awarded, and there
are judicial caps on awards for pain and suffering.
Global Budgeting and
In Canada, policies designed to limit the escalation of hospital spending
Technology
succeeded by lowering the intensity of services provided. These policies
entail the use of global budgets and management of medical technology.
Management
Together with the universal access, single payer structure that reduces
Constrain Hospital
administrative requirements, hospital budgetary and capital controls
Spending
account for 32 percent of the difference in per capita health spending
between Canada and the United States.
Figure 3.6 shows the widening gap between US. and Canadian hospital
expenditures. Since 197 1, Canada has been more successful in con-
straining real growth in hospital costs. From 1971 to 1980, real hospital
spending per capita grew at 2.3 percent annually on average, less than
half the U.S. rate. This reflected in large measure a constant level of
resources for each hospital day. Canadian hospital expenditure growth
more closely paralleled the US. experience in the 198Os, reflecting to
some extent reduced growth rates achieved in the United States and
some readjustment to greater service intensity in Canada.
Page 42
GAO/HRDL)l-90 Canadian Health Insurance

Chapter 3
Single Payer Structure With Provinc~Wide
Polk&a Help6 control National
He&h Spending
Figure 3.0: Horpital Care: Real Expenditure8 Per Capita
(1971-87)
899 1087 U.S. Doll-
299
190
- United States
-1-1 Canada
Note: Expenditures were converted to 1987 constant dollars by dividing health care spending by the
gross domestic product implicit price deflators for the United States and Canada. The Organization for
Economic Cooperation and Development’s purchasing power parity for 1987, $1.24 CAN = $1 .OO U.S.,
was used to convert Canadian to U.S. dollars.
There is an important difference between the two countries in their
approaches to hospital cost containment. Canadian provinces have a
centralized, overtly political decision-making process, whereas the
United States has a largely decentralized, institution-centered process.
Because responsibility for controlling hospital resources in Canada rests
with the provincial government, health care issues generate intense
political debate. Negotiating issues of underfunding, shortages, and
waiting lists are an important part of the process by which providers
obtain their share of public resources. In the United States, hospitals are
more apt to turn to market mechanisms to deal with resource problems.
Hospitals Are Financed
Through Gl”obal Budgets
Among the cost-containment measures used to control hospital
spending, the prospective global budgeting system may be the most
important. In 1969, prospective global budgeting replaced line-by-line
budgeting as Ontario’s system for financing hospital operating
Page 43
GAO/HRD91-90 Canadian Health Insnrance

Chapter 8
Single Payer Structure With Province-Wide
Pollciee Helps Control National
Health Spending
Caps on Operating Revenues
expenses.16 Each hospital receives a fixed sum for the year, usually an
increment over last year’s budget adjusted for the current expenditure
trend in the provincial budget. Although actual hospital expenditures
are monitored periodically, no detailed accounting is required by the
province,
Through control over capital and operating funds, the Ministry of
Health controls hospital expansions and increases in number of hospital
beds. Ontario has bed allocation guidelines in place that are used to
assess the need for increased bed capacity and the equitable distribution
of inpatient beds. For the allocation of acute care beds, Ontario has a
current target of 3.5 beds per 1,000 population in southern Ontario and
4.0 beds per 1,000 in northern Ontario.
Operating budgets are funded almost entirely by the Ministry of Health
in each province.
17 In Ontario, the Ministry annually increases the alloca-
tion to each hospital by a common base percentage to adjust for infla-
tion. Additional allocations may be made to (1) small acute care
hospitals to recognize smaller economies of scale, (2) hospitals that
experience an increase in inpatient and/or outpatient workload, (3) hos-
pitals that experience growth in patient volume for special services, and
(4) hospitals approved for new or expanded programs. In addition, the
Ministry has been phasing in case-mix adjusters to reflect the type of
care patients receive.
Hospital administrators divide the Ministry’s lump-sum allocations
according to internal priorities. Over 70 percent of hospital operating
budgets go to labor. Other operating expenses, such as medical supplies,
drugs, food, and utilities, account for the remainder.
Impact on Hospital Management
Prospective global budgeting has advantages over other reimbursement
systems. Its predictability and flexibility allow hospital administrators
more autonomy in making allocation decisions. In principle, a benefit of
global budgeting is that hospitals should become more cost-conscious
‘%perating budgets include no allowance for capital expenditures. Hospitals must apply separately
for the approval and funding of new capital acquisition.
171n Ontario, the Ministry’s allocation accounted for about 81 percent of each hospitals funding in
198687. Although patient copayments and deductibles are prohibited, hospitals may tap other
sources for additional operating funds. These range from philanthropic support to parking fees to
differential charges for private versus semiprivate rooms.
Page 44
GAO/HRD-91-99 Canadian Health Insurance

chapter 3
Single Payer Structure With Province-Wide
Polkiea Helps Control National
Health Spending
and efficient since they must fund all expenditures from the given pro-
spective budgeLLs At the same time, however, global budgeting induces
some hospital practices that may be undesirable.
On the positive side, global budgeting encourages hospitals to cut costs
and use funds efficiently. For example, to avoid unnecessary use of
costly resources for individual patients, hospitals emphasize outpatient
rather than inpatient care. lg Shifting services to outpatient facilities also
benefits the hospital in that certain services can be billed to the Min-
istry, generating additional reimbursement. Other cost-saving measures
include bulk purchasing of drugs and other items, contracting out
“hotel” services (such as laundry and meal services), and merging
departments with similar or complementary functions (such as obstetric
and pediatric departments) within hospitals.
On the negative side, global budgeting can prompt hospitals to pare
expenditures to an unacceptable level. To stretch limited dollars, hospi-
tals have incentives to admit, and retain as long as possible, low-cost
patients. As a result, hospitals may fill acute care beds with low-cost,
long-term patients. These patients have daily medical requirements that
are well below average in cost. The patients are typically over 65 years
of age, and their lengths of stay exceed 60 days. Such patients are often
referred to as “bed-blockers,” because they prevent physicians from
using acute care beds to treat short-term patientszO The Ontario Min-
istry of Health and health care providers estimate that bed-blockers
occupy about 15 percent of acute care beds.
Another negative effect under global budgeting is that hospital adminis-
trators’ discretion over decision-making, while largely beneficial, limits
the Ministry’s authority to control the use of hospital resources. Since
the Ministry does not monitor expenditures on a case-by-case basis, the
government cannot directly prevent unnecessary admissions or exces-
sive lengths of stay or other adverse patterns of use of beds in acute
care hospitals. In addition, the government has minimal control over the
lsOntario modified its hospital budgeting process in 1982 to give hospitals incentives to be more effi-
cient. Under what is called the Business-Oriented New Development plan, hospitals are responsible
for deficits and are allowed to keep surpluses. Hospitals facing deficits may close beds and cut back
on services to stay within their fiscal constraints.
‘“Between 1977 and 1986, the proportion of hospital activity accounted for by ambulatory care rose
from 19 to 29 percent of patientdays in Ontario.
20R.ecently, the Ministry has developed several initiatives to reduce hospital stays by bed-blockers,
includiig an emphasis on community-based care, long-term care reform, and changes in fiscal
incentives.
Page 45
GAO/HRD-91-90 Canadian Health Insurance
.

chapter 3
Single Payer Structure With ProvhmWide
Polides Helps Control National
Health Spending
diffusion of “low technology”-
low start-up cost, high-volume proce-
dures.21 Furthermore, hospitals have little incentive to develop detailed
information systems, since budgets are not based on individual patient
costs.
Finally, the Ontario Ministry of Health finds it difficult, if not impos-
sible, to close hospitals, despite estimates of a systemwide surplus of
beds. The political ramifications are extensive, and thus, no public hos-
pital has been closed in the last 6 years. Instead, as hospitals submit
capital requests for hospital beds, the Ministry considers a range of
alternatives to inpatient services, including ambulatory and community-
based programs, Approximately one-third of Ontario hospitals are cur-
rently going through this “replanning” process.
A recent review of the hospital funding system identified some of these
problems with global budgeting, but it recommended retaining and
making adjustments to the system.22 A health advisory committee
reporting to the Premier of Ontario found that global budgeting (1) dis-
couraged bottom-up responsibility for controlling costs and encouraged
a growth mentality, (2) failed to address inequities in hospital budgets,
and (3) focused on management efficiency rather than health outcomes.
The committee recommended retaining global budgeting as the core
funding method, but with modifications to account for case-mix differ-
ences in hospital workloads.
Impact on Service Intensity Canada’s hospital expenditures per capita were 18 percent below the
U.S. level in 1987, primarily because of lower costs per patient-day.
Compared to their U.S. counterparts, Canadian hospitals have more
admissions and longer stays. A study of Ontario data for 1986 indicates
that hospital costs per patient-day (for people over 66) were about one-
third of the average U.S. cost.23 This savings is attributable primarily to
“A.L. Linton and C. D. Naylor: “Organized Medicine and the Assessment of Technology: Lessons
From Ontario,” New England Journal of Medicine, Vol. 323, No. 21, Nov. 22, 1990, pp. 1463-1467.
a2”From Vision to Action,” Report of the Health Care System Committee, Premier’s Council on Health
Strategy, May 1989.
23These hospitals had similar admission rates and case mix, but far longer stays (14 days in Ontario
compared to 8 days in the United States). See J. Newhouse, G. Anderson, and L. Roos, “Hospital
Spending in the United States and Canada: A Comparison,” Health Affairs, Winter 1988, pp. 6-16.
Page 46
GAO/HRD91-90 Canadian Health Insnrance

chapter 8
Single Payer Structure With Province-Wide
Pollden Help Control National
Health Spending
Ontario hospitals’ lower service intensity-that is, the use of less labor,
supplies, procedures, and equipment.”
Service intensity per hospital-day has escalated more slowly in Ontario
than in the United States. For the period 1980437, wages and other costs
rose about as fast, but growth in the use of hospital resources per
patient-day was minimal. The increased inflation-adjusted costs of hos-
pital care attributable to growth in resources per patient-day was 19
percent in Ontario compared to 80 percent in the United States.26
Several factors may account for lower service intensity in Canada.2” For
example, hospitals use fewer nurses, drugs, operating rooms,
MRI,
and
other resources per day of inpatient care. In the United States, the mix
of hospital activities favors intensive, high-technology services, whereas
in Canada it favors long-term chronic care. High-technology capacities
available per capita have tended to increase less rapidly in Canada.
In addition, hospital administrative costs are lower. Some portion of the
cost difference is accounted for by the greater administrative require-
ments of the American hospital system. The complex payment system in
the United States requires hospitals to maintain a larger administrative
staff to bill patients and insurers, determine eligibility, and deal with
utilization review mechanisms. One study estimates that hospital admin-
istration costs $162 per person in the United States, compared to $50
per person in Canada-z7
As noted earlier, the Canadian system may achieve lower administrative
costs in part because it forgoes data collection needed for planning and
efficiency improvements. Hospital managers benefit from the reduction
in reporting and in detailed oversight by government. But the Ministry
lacks a mechanism to learn whether people are being underserved or
24A.S Detsky and others, “Containing Ontario’s Hospital Costs Under Universal Insurance in the
1980~& What Was the Record?” Canadian Medical Association Journal, Vol. 142, No. 6, 1990, pp. 666-
672.
26From 1972 to 1979-80, growth in hospital inputs generated only a 1.7~percent increase in Ontario’s
hospital expenditures compared to a 23.2~percent increase in the period 197930 to 1986-87. Most of
the real growth in hospital cost was attributed to increases in wages in the 1980s.
26R.G. Evans and others, “Controllmg Health Expenditures-The Canadian Reality,” New England
Journal of Medicine, Vol320, No. 9, Mar. 2,1989, pp. 671-677.
27S. Woolhandler and D.U. Himmelstein, “The Deteriorating Administrative Efficiency of the U.S.
Health Care System.”
Page 47 GAO/IiRD91-90 Canadian Health Insurance

Chapter 3
Single Payer Structure With Province-Wide
Policies Helps Control National
Health Spending
overserved, because it does not receive detailed bills about individual
patients.
High Technology Is
Tightly Controlled
Regulation and Funding of
Technology
Another method used in Canada to contain hospital expenditures is to
control the diffusion of medical technology. Control of high technology
and the new treatments associated with them not only conserves pro-
gram resources but also limits operating costs arising from added ser-
vice capacity. Many of the new health care technologies require
expensive capital equipment and the hiring of technical labor, both of
which can increase costs greatly. (See ch. 4 for a discussion of conse-
quences of these policies.)
In Ontario, the Ministry of Health controls hospital high technology by
requiring approval for acquisition of certain equipment and specialty
services. If government approval is given, the hospital may receive
funds to cover some of the costs of the new service in addition to any
increase in the base budget. Hospitals making purchases that are not
approved by the Ministry do not (officially at least) receive operating
funds for the equipment or services. Because most of the hospital’s oper-
ating funds come from the Ministry, hospitals have a strong financial
incentive to obtain approval before making major expansions or
purchases of expensive technology, unless funds can be reallocated from
internal sources.
As a result of this policy, Canada has fewer items of high-technology
equipment and specialty services per person than does the United
States. Moreover, there are concerns that the centralized planning and
approval process is open to broad political controversy and that it limits
the system’s responsiveness and flexibility.
Through control over capital and operating funds, the Ministry of
Health limits the distribution of high-technology services among hospi-
tals.28 Certain types of equipment, such as computed tomography
(CT)
scanners,
MRIS,
and lithotripters, require Ministry approval in order to
receive operating funds from the Ministry. Also, hospitals must obtain
2sThrough the 1989 Independent Health Facilities Act, the Ministry also regulates facilities
that
pro-
vide outpatient services. Examples of these services include cataract surgery, radiology and ultra-
sound,
and
laser treatments. Outpatient service facilities must be licensed by the Ministry and are
subject
to its quality assurance requirements and inspections.
Page 48
GAO/HRD91-90 Canadian Health Insurance

Chapter 3
Slngle Payer Structure With Province-Wide
Pokier Helps Control National
Health Spending
Less High-Technology Equipment
and Services
Ministry approval of any significant volume change in specialty ser-
vices, such as cardiac surgery, transplantation, and dialysis, in order to
receive additional operating funds.2g
For financial reasons, it is important for hospitals to receive approval
from the Ministry of Health. Although the Ministry does not usually pro-
vide grants for the acquisition of high-technology equipment,30 it does
provide a portion of the operating funds for approved equipment. If an
institution invests in a new program without prior government
approval, all capital and operating costs must be financed out of its
existing global budget.
Hospitals receive funding for specialized services, such as cardiovas-
cular units, from the global operating budget and from additional Min-
istry of Health funds, called “life support funding.” Zife support funds
cover marginal costs for special services not covered through growth
funding. These funds are available for specified programs, including
dialysis, pacemakers, open-heart surgery, chemotherapy, and neonatal
care.
A consequence of limiting physician specialties and restraining the dif-
fusion of high technology is the reduced availability of certain treat-
ments and procedures. (See fig. 3.7.) For each of the six technologies
shown, Canada has substantially fewer units per person than the United
States. It is not clear from these data, however, whether the United
States has an overabundance of equipment, Canada a scarcity, or both.
“‘The Ministry obtains advice on capital expenditures from a variety of sources, including the local
planning
and advisory bodies, called District Health Councils. The Ministry may also consult experts,
Ministry program coordinators, and health science centers (centers that provide specialty care,
teaching, and research).
30Hospitals generate funds for equipment acquisition from a variety of sources. These include philan-
thropy, surpluses from the operating budget, and funds from ancillary services, such as parking fees.
Hospitals may also use depreciation allowances included in the hospitals global operating budget.
However the process of centralized approval prevents hospitals from obtaining capital from private
markets.
Page 49 GAO/HRD91-90 Canadian Health Insurance

Chapter 9
Single Payer Stxucture With ProvinmWide
POU&IJ Helpn Control Natdonal
Health Spemling
Figure
3.7: Availablllty oi Selected
Medlcal Technologkm
5.S
Unlts per million pomom
5.0
495
4.0
8.6
8.0
2.6
2.0
1.5
1.0
0.1
0
1 ] Canada
United States
Source: D. A. Rublee, “Medical Technology in Canada, Germany, and the U.S.,” Health Affairs, Fall
1989, pp. 178-181, Exhibit 1.
The relative effectiveness of the health care systems that have less
high-technology and specialty services compared to those with high
levels is uncertain. Studies suggest that there are significant benefits to
concentrating certain high-technology, complicated procedures. Outcome
data for certain specialized procedures, such as coronary artery bypass
graft surgery, indicate that mortality rates are lower in centers that per-
form a high volume of these procedures than in low-volume centers31
In fact, having more technology does not necessarily reflect how inten-
sively or appropriately it is used. For example, for some cardiovascular
31See
H.S. Luft, J. P. Bunker, and AC.
Enthoven,
“Should Operations Be Regionalized: The Empirical
Relation
Between
Surgical Volume and Mortality,” New England Journal of Medicine, Vol. 301, No.
26, Dec. 20, 1979,
pp.
1364-1369, and M. McGregor and G. Pelletier, “Planning of Specialized Health
Facilities,” New England Journal of Medicine, Vol. 299, No. 4, July 27,1978, pp. 179-181.
Page 60
GAO/HRB91-90 Canadian Health Insurance

chaptm 8
Single Payer Structure With Province-Wide
Polklea Helps Control National
Health Spending
procedures, population-based utilization rates in Manitoba and Ontario
are comparable to those in the United States; for other procedures, rates
are much lower.32 In fact, in the United States utilization rates vary
widely for different geographic areas. One study found a threefold vari-
ation between the lowest and highest rates of coronary artery bypass
procedures among Medicare beneficiaries in different locations.33 Never-
theless, Canada’s lower rates for certain procedures do not conclusively
represent underservicing, nor do U.S. rates conclusively reflect over-
provision of services.
Effect of Political Influence
in
the
Political influence is an important part of the process of allocating
Allocation of Technology
resources. Ontario’s Ministry of Health, for example, has been criticized
for not applying consistent, rational criteria to technology management.
In response to adverse publicity, the Ministry has injected funds into the
system on an ad hoc basis. The growing conflict over the availability of
technology is seen in the media accounts that report obstacles to the
system’s access to care.
The health care system’s vulnerability to politics is due in part to the
government’s direct role in financing and managing the system and the
public popularity of the health care program. As a result, Ontario’s
health plan is a highly visible program, and any perceived problems,
especially with access to care, are immediately and extensively reported
in the press. For example, negative publicity about waiting times for
cardiovascular surgery resulted in the Ministry providing additional
funds to expand and initiate a new cardiovascular facility.
Just as the government may use the popularity of the health care
system to get votes, providers also use political leverage to acquire
otherwise unauthorized equipment or services. Providers may, for
example, purchase equipment and depend on publicity to force the Min-
istry of Health to retroactively reimburse them.34
32A comparison of discharge rates for U.S. patients 66 years old and over to those in Manitoba and
Ontario showed that the U.S. rate was twice as high for coronary artery bypass surgery and 20
percent higher for valvular surgery. However, the U.S. discharge rates were approximately 10 per-
cent lower than Manitoba and Ontario for major reconstructive surgery and permanent pacemakers.
See G. M. Anderson, J.P. Newhouse, and L.L. Roos, “Hospital Care for Elderly Patients With Diseases
of the Circulatory System: A Comparison of Hospital Use in the United States and Canada,” New
England Journal of Medicine, Vol. 321, No. 21, Nov. 23, 1989, pp. 1443-8.
33M R Chassin and others, “Variations in the Use of Medical and Surgical Services by the Medicare
Population,” New England Journal of Medicine, Vol. 314, No. 6, Jan. 30, 1986, pp. 286-90.
34See R. Deber, G. Thompson, and P. Leatt, “Technology Acquisition in Canada,” International
Journal of Technology Assessment in Health Care, Vol. 4,1988, pp. 186-206.
Page 51
GAO/HRD-9180 Canadian Health Insurance

Chapter 4
Access Consequences of Universal Coverage
With Spending Controls in Ontario
With universal coverage and an ample supply of general practitioners,
access to primary care in Ontario is generally available on demand.
However, as a consequence of global budgeting for hospitals and direct
controls on the diffusion of certain high-technology services and equip-
ment, access to some specialty care services is limited. This in turn has
resulted in shortages and deferred care. For these services, Canadians
attempt to ration care according to the severity of the case; that is, those
identified to be in greatest need receive care first. This approach to
rationing differs from that of the United States, which rations not only
on the basis of insurer or provider decisions but also on the basis of
ability to pay.
In Canada, provincial governments make implicit rationing decisions
using global budgetary constraints and explicit rationing decisions using
controls on high-technology services. A Toronto hospital division head
characterizes the Canadian approach to rationing as enabling the
government1
“...to contain costs while largely evading direct responsibility for any curtailment of
services....[This] allows the government to argue that physicians and hospitals must
be held accountable for the use-and abuse-of health care dollars.”
Waiting lines, or “queues,”
have developed primarily for selected expen-
sive surgical procedures and diagnostic equipment that emerged in the
1970s and 19809, such as
MRIS,
cardiac bypass surgery, lithotripsy, lens
implants, and hip replacements. For these services, physicians must
ration care on the basis of medical need rather than providing it to all
who may benefit. Ontario health care providers contend that queuing is
the result of the provincial government’s attempts to control health
expenditures. The Ministry believes that queues are a natural result of
the “rationalization” of health care-“
getting the right patient to the
right service at the right time,”
Access to Primary
Primary care is easily accessible to Ontario residents. Patients visit their
Care Is Unconstrained
family physician or other general practitioner with no evidence of
queues or lengthy waiting times for appointments. For example, nearly
all expectant mothers in the province receive prenatal care. In the
United States, 76 percent of women who had live births in 1988 received
prenatal care starting in the first trimester, 18 percent began prenatal
‘AS. Detsky and others, “Containing Ontario’s Hospital Costs Under Universal Insurance in the
1980s: What Was the Record?” Canadian Medical Association Journal, Vol. 142, No. 6, 1990, pp. 666.
672.
Page 52
GAO/HRB91-90 Canadian Health Insurance

chapter
4
Accem Consequences of Universal Coverage
With Spending Controlm In Ontario
services in the second trimester, and 6 percent started prenatal care
during the third trimester or received none at all.
Ontario residents achieved unimpeded access to primary health care in
part from the concentration of health care resources on the point at
which patients enter the health care system. The mix of physicians in
Ontario-half general practitioners and half specialists-suggests that
the Ministry’s concern for adequate primary care for the entire popula-
tion outweighs the concern for specialty care for a small population.
Queues Have
Developed for
Specialized Services
The issue of waiting lines has been highly publicized in both the Ontario
and the American press. Cases of Ontario residents seeking specialized
care in the United States and cases of individuals dying on queue have
generated considerable media attention. However, systematic informa-
tion on the nature and extent of the queuing problem in Ontario and
other Canadian provinces is limited.
To examine the extent of the queuing problem, we contacted sites where
high-technology equipment and specialized services are available and
queues may develop. Technology is concentrated at Ontario’s 26
teaching hospitals located in the densely populated areas of the prov-
ince.2 At these institutions, we interviewed the directors of eight spe-
cialty care programs: CT scanners,
MRIS,
lithotripsy, cardiovascular,
ophthalmologic, and orthopedic surgery, specialized physical rehabilita-
tion, and autologous bone marrow transplants.3
How Queues Are Managed
In Ontario, queues for specialty services are not centrally managed. For
the most part, individual physicians determine the priority for patients
needing specialty surgical procedures.4 Hospital based “gatekeepers”
manage waiting lists for hospital-based high-technology equipment.
2Teachmg hospitals conduct medical research, initiate the use of new techniques, and evaluate the
benefits and risks of these technologies, which can then be applied to other centers.
30rgan transplant programs were excluded because it would be difficult to separate queues due to
shortage of organ donors from other causes, such as a shortage of technology. Other programs where
queues have been reported, such as radiation therapy, could not be investigated because information
was not provided by program directors. However, media accounts report that in 1989, because of a
shortage of technicians, the Princess Margaret Hospital in Toronto stopped accepting new patients
referred for radiation therapy until it could reduce waiting times to a medically acceptable period.
4The Ministry of Health, in partnership with hospitals, has recently initiated a central registry to help
manage queues for cardiovascular services in the metro-Toronto area.
Page 63
GAO/HBDsl-99 Canadian Health Insurance

Chapter 4
ACOMJS Cawequences of Universal Coverage
Wlth Spending Cantrole in Ontario
While no formal criteria for ranking patients are in place, practitioners
stratify patients, putting those at presumed higher risk at the head of
the queue. Patients are categorized by their physicians as emergent,
urgent, or elective. Because no standard definitions exist, these classifi-
cations vary by medical service and by physician. In general, emergent
cases involve life-threatening conditions and require immediate diag-
nostic or surgical services. Urgent cases usually involve serious medical
conditions for which the patient is monitored and treated while in the
hospital. Elective cases refer to medical conditions for which the patient
needs to be treated but is not in imminent danger. Patients classified as
urgent or elective are monitored for changes in their condition while
waiting for scheduled openings and may receive alternative therapies.
Extent of Queuing for
Selected Services
The length of wait and the number of people waiting in queue varied
across medical services. In general, the specialty services we examined
did not have queues for emergent cases but had queues for urgent and
elective patients. Patients with non-life-threatening conditions typically
did not have priority status, and their numbers and waiting time in
queue were relatively larger and longer.
Queues also varied widely by facility. Among the reasons cited by hos-
pital directors for this variation include (1) geographic location of the
service, (2) patient preference for a particular hospital or physician, and
(3) capacity and sharing arrangements among hospitals. Table 4.1
shows the number of specialty care programs reporting queues and the
range among hospitals in terms of the number of patients and length of
time waiting. Because neither the Ministry, hospitals, nor physicians
systematically collect data on patients waiting in queue, we were not
able to independently verify the information providers reported to us.
Page 64
GAO/IiRDSl-99
tYJamdhHcalthlnsura.nce
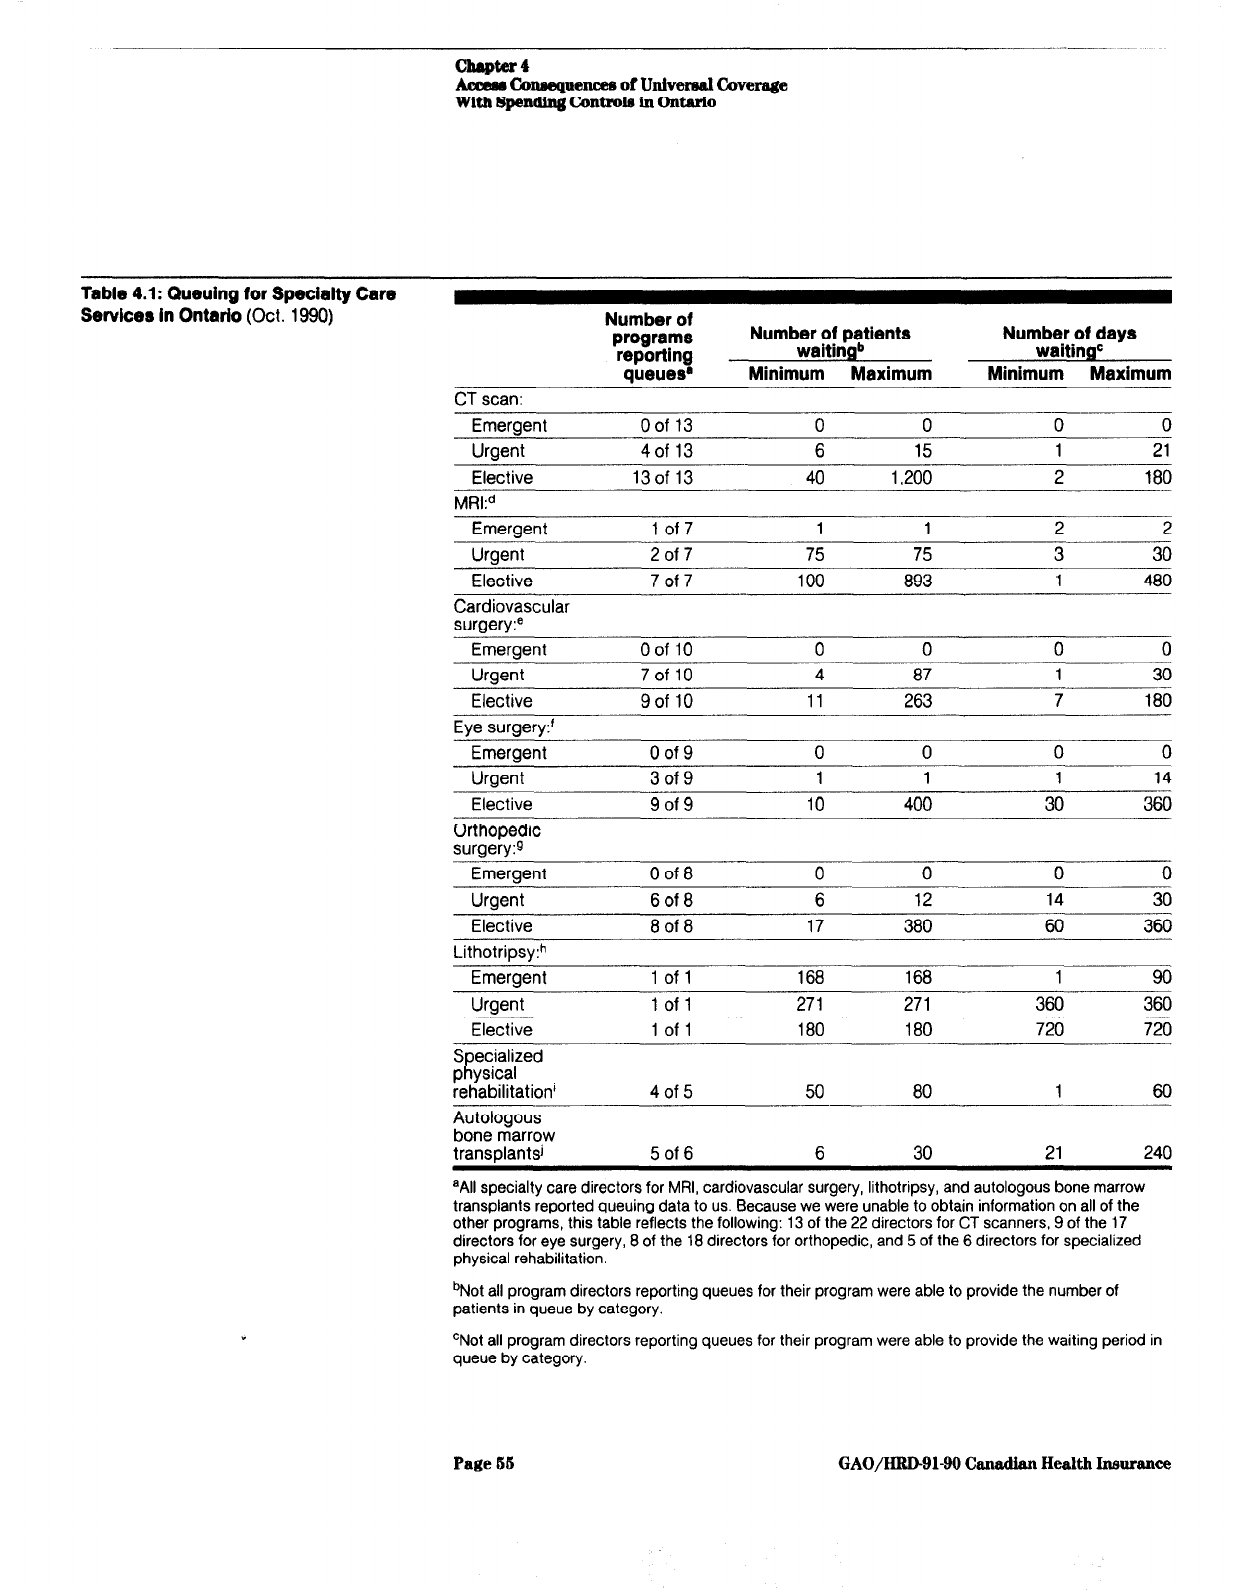
Aamm Co~uencea of Univers61 Covemge
With Spemling C4mtrole ln Ontario
Table 4.1: Queuing for Specialty Care
Servlcer in Ontario (Oct.
1990)
Number of
programs
reporting
Queues@
Numb;s;;npttients
Q
Minimum Maximum
Number of days
waitingC
Minimum Maximum
CT scan:
Emergent Oof 13 0 0 0 0
Uraent 4of 13 6 15 1 21
Elective
13of 13 40 1,200
2
180
MRkd
Emergent 1 of7 1 1 2 2
-..-
Uraent 2 of 7 75 75 3 30
Elective
7 of 7 100 893
1
480
Cardiovascular
surgery?
Emeraent
%of 10 0 0 0 0
Urgent
Elective
Eve suraerv:’
7oflO 4 87 1 30
9of 10 11 263 7 180
Emergent 0 of 9 0 0 0 0
Urgent 3 of 9 1 1 1 14
Elective 9 of 9 10 400 30 360
Orthopedic
surgery:9
Emergent
Urgent
Elective
0 of 8 0 0 0 0
6 of 8 6 12 14 30
8 of 8 17 380 60 360
Emergent 1 of 1 168 168 1 90
Urgent 1 of 1 271 271 360 360
Elective 1 of 1 180 180 720 720
Specialized
physical
rehabilitation’
Autologous
bone marrow
transDlantsi
4 of 5 50 80 1 60
5 of 6 6 30 21 240
aAll specialty care directors for MRI, cardiovascular surgery, lithotripsy, and autologous bone marrow
transplants reported queuing data to us. Because we were unable to obtain information on all of the
other programs, this table reflects the following: 13 of the 22 directors for CT scanners, 9 of the 17
directors for eye surgery, 8 of the 18 directors for orthopedic, and 5 of the 6 directors for specialized
physical rehabilitation.
bNot all program directors reporting queues for their program were able to provide the number of
patients in queue by category.
‘Not all program directors reporting queues for their program were able to provide the waiting period in
queue by category.
Page 55 GAO/HRD-91-90 Canadian Health Insurance

chapter
4
Aceeas Consequences of Untvemd Cover8ge
With Spendtng C2mtrole In Ontario
“Alternative procedures are available for patients in queue for MRI.
‘Consists primarily of coronary bypass surgery and valve replacement
‘Consists primarily of lens implants, including those associated with the removal of cataracts.
QConsists primarily of hip and joint replacements,
hLithotripsy is a medical technique that uses sound waves to break up kidney and gall bladder stones.
A second lithotripsy unit was approved by the Ministry of Health and began operation in late August
1990, Our review does not include information from this site because at the time of our review this unit
had been in operation for only 5 weeks. An alternative treatment, surgery, is available for patients in
queue for lithotripsy.
‘For specialized physical rehabilitation, patients are generally stabilized after injury and placed in one
queue for ongoing treatment.
JAutologous bone marrow transplants involve removing, treating, and replacing the patient’s own bone
marrow. Patients with a better than 15percent chance of survival are generally put in a single queue
and ranked using specific criteria.
One specialty care program with long waiting lists was cardiovascular
surgery.6 Program directors reported 1,029 patients waiting in queue.
While no queue existed for emergent cases, 124 patients were in the
urgent queue and 906 patients were in the elective queue. Waiting times
ranged from 1 to 30 days for the urgent queue and from 7 to 180 days
for the elective queue.
The longest line for emergent care was for lithotripsy treatment: 168
patients waiting from 1 to 90 days. In part this was due to the availa-
bility of only one lithotripsy machine in the province that, because it
was not very powerful, often required patients to be treated several
times. As it became increasingly difficult to manage the queue and mon-
itor the growing number of patients,6 the Ministry of Health approved a
second lithotripsy unit. This additional machine should result in a signif-
icant reduction in the queue that existed at the previously sole facility.
The diagnostic technologies with limited access are
MRIS
and
CT
scanners.
All program directors for
MRI
units reported queues for elective cases.
The number of patients waiting in queue ranged from 100 to 893. The
length of wait in queue ranged from 1 to 480 days. Similarly, all
CT
scan
program directors reported queues for elective cases.7 The number of
61n metro-Toronto, the total number of open-heart procedures declined between 1986 and 1988; the
number of people waiting for bypass surgery rose from 444 in 1986 to 723 in 1988, as of January
1989,848 people were waiting. In 1984 the average waiting times were 2 to 3 weeks, during 1989
they ranged from 3 to 9 months.
6According to the gatekeeper for the lithotripsy machine, patients categorized as elective were often
reclassified as urgent or emergent, operated on, or referred to the United States for treatment.
‘There are 22 CT scans located in teaching hospitals throughout Ontario. Although CT scans are also
located at community hospitals, we did not attempt to measure queuing for them.
Page 66
GAO/HRD91-99 Canadian Health Insurance

chapter 4
Acme8 Connequencea of Univerrd Coverage
With Spending Controle in Ontario
patients waiting in queue for an elective
CT
scan ranged from 40 to
1,200. The length of wait ranged from 2 to 180 days.
We also found long waits for cataracts/lens implants and hip replace-
ments. Patients with cataracts, which are primarily elective cases,
waited from 30 to 360 days for eye surgery. For orthopedic surgery,
such as hip replacements, urgent patients waited from 14 to 30 days,
while elective patients waited from 60 to 360 days.
Although no queues exist for treatment of life-threatening conditions,
such as kidney failure and neonatal care for high-risk deliveries,
capacity is limited for treatment of these conditions. According to sev-
eral kidney specialists, limited capacity for kidney dialysis means that
patients often receive less frequent and sometimes less than optimal
treatment. Similarly, specialty care directors for neonatal services
reported that, because of limited resources in their departments,
patients are often transferred to other hospitals.
Causes of ’ Queuing at
Teaching Hospitals
Queues are the result of hospitals’ attempts to deal with the constraints
imposed by global budgeting and technology controls. As discussed in
chapter 3, hospitals receive most of their operating revenues from global
budgets, and the acquisition of high technology is restricted by the pro-
vincial government. Because funding is limited, the amount of medical
and nonmedical personnel, equipment and supplies, and other hospital
resources is also limited. Hospital administrators must decide how their
operating funds will be allocated and still provide a wide range of spe-
cialty services, while department heads compete for hospital resources.
Diagnostic services, such as
CT
scans and
MRIS,
are examples of how
Ontario’s constraints on both the acquisition and operating costs of
equipment affect access. For
CT
scanners, the Ministry has developed a
set of guidelines for assigning appropriate placements of
CT
scanners
throughout the province. Further, the Ministry provides sufficient funds
to cover operating costs for only part of the day (usually 8 hours). Hos-
pitals are required to obtain a financial commitment from sources
outside their global budget in order to use the equipment more
intensively”
sToronto General Hospital typically runs its MRI two shifts per day. The operating deficit generated
by the second shift is funded partly through excess revenues generated by occasional paying patients
from the United States and other countries.
Page 57
GAO/HRD9140
Canadian Health insurance

Chapter 4
Acasr Cauequencer, of Univemal Coverage
With Spending Controla in Onbrlo
Cardiac surgeries are limited by the number of hospitals equipped for
open heart surgery and operating room time. The Ministry of Health
limits the number of heart surgery wards and gives those hospitals
funding to perform a specified number of heart operations. Thus, a car-
diac surgeon who has the capacity to do 4 to 6 heart operations weekly
may be limited by the hospital to only 3 to 4 operations per week.
The availability of hospital beds also determines the volume of health
care services provided. Some intensive care beds are set aside in antici-
pation of emergency cases. When emergent cases exceed the allocated
number of intensive care beds, queues develop. Departments must
account for limited access to intensive care beds when ranking and
scheduling their patients for diagnosis and treatment. High occupancy
rates and long stays at specialty hospitals may restrict hospital
admissions.
Labor shortages in hospitals have also contributed to queuing. These
include shortages of nurses, operating room technicians, and other
skilled hospital personnel. For example, at some hospitals, a shortage of
trained nurses has caused bed closures. The nursing shortage at hospi-
tals in metropolitan areas, such as Toronto, has been attributed to low
salaries and high stress-related duty.9
According to the Ontario Ministry of Health and several hospital offi-
cials, queues at teaching hospitals are due in part to an increasingly
older patient population that places growing demands on hospitals for
more costly, specialized services. Also, as the average age increases,
patients require longer stays in intensive care and acute care beds,
which contributes to queues.
Finally, the Ministry is hesitant to develop or increase capacity for spe-
cial services with small treatment populations. Often the Ministry will
not increase capacity until the volume of patients needing the medical
service becomes sufficient to warrant development or expansion of the
service. The Ministry studies the application of treatment alternatives
before approving new or increased capacity for special services. A Min-
istry official stated that U.S. facilities are often used until new special
services are developed in the province.
%ince the time of our review, the nursing shortage has been substantially reduced, according to hos-
pital officials.
Page 58
GAO/HRD91-90 Canadian Health Insurance

Chapter 4
Acc4m tAmaequeneee of Univereal Coverage
With Spe~ndlng Controb in Ontarlo
Patients’ Health May
Deteriorate While Wai
for Treatment
The health consequences of waiting for services is an issue of some
king
debate among American and Canadian health policy experts. Critics
claim that queuing is jeopardizing Canadians’ health. Others hold that,
despite publicity about waiting lists, there is little data to suggest that
the overall quality of health care has been compromised.
Despite a high level of satisfaction with their overall system,lO a recent
poll shows that only 32 percent of Canadians are “very satisfied” with
their access to elective surgery and 48 percent were “very satisfied”
with the availability of high-technology tests, procedures and equip-
ment. In both of these areas, Americans polled showed a higher propor-
tion of “very satisfied” responses (50 percent “very satisfied” with
access to elective surgery and 68 percent “very satisfied” with access to
high-technology services).ll
Specialty care directors we contacted reported some negative health
effects resulting as patients wait in queue. Most patients experience
pain and discomfort, and some may develop psychological problems.
Cancellations of procedures for elective patients waiting in queue cause
anxiety and frustration.
The condition of some patients may worsen, making surgery more risky.
If patients seriously deteriorate while waiting in queue, they may
undergo alternative therapies. A urologist told us that because of the
long queue for lithotripsy treatment, many doctors perform surgery to
remove kidney stones, putting the patient at higher risk than with a
lithotripsy procedure.
In addition to effects on health, hospital specialty care directors
reported negative economic consequences for patients waiting in queues.
Often patients experience a financial setback, such as decreased income
or loss of a job. For example, an orthopedic surgeon said that many of
his patients are unable to work because they are physically immobile
while they wait for a hip or other joint replacement. Also, according to
several hospital administrators and physician directors, additional
treatment costs are incurred while patients wait in queue. Patients are
i”Opinion polls show that Canadians are more satisfied with their health care system than Ameri-
cans. A 1988 survey of citizens of Canada and the United States found that 67 percent of Canadians
were very satisfied with the health care services they used in the last year. In contrast, only 36
percent of Americans responded that they were very satisfied. More than half of the Canadians felt
their system worked well and only minor changes were needed to make it work better, compared to
10 percent in the United States. See: R.J. Blendon, “Three Systems: A Comparative Survey.”
“Louis Harris and Associates, “Comparing Health Systems,” November 1990.
Page 59
GAO/H&D-91-90 Canadian Health Insurame

Chapter 4
Access Consequencea of Universal Coverage
With Spending Ckmtrola in Ontario
often given additional diagnostic tests, medication, or other modes of
treatment until they receive the service they need, This increases the
total cost of treatment. For example, the substitution of surgery for
lithotripsy results in higher costs.
Few Ontario Residents
The abundant U.S. capacity for the services rationed in Canada is used
Seek Treatment in the U.S.
by provincial governments to help manage their queues and by some
individuals to avoid Canadian queues.12 Some Canadian physicians refer
their patients in queues to U.S. hospitals that have the medical expertise
and equipment. (According to Canadian health officials, some Ameri-
cans cross the border to Canada to obtain specialized services that are
not readily available in the United States or to receive lower cost health
care.) Many facilities in the United States are aggressively marketing
medical services, such as cardiac care and addiction treatment, to
Canadians. Ontario residents seeking health services in the United
States often go to hospitals along the U.S./Ontario border, including
those in Buffalo, Cleveland, and Detroit.
Recent data show, however, that there is very little border-jumping. The
Pepper Commission13 and the American Medical Association14 recently
conducted informal surveys of American hospital administrators
expecting high numbers of Canadian patients. Both groups concluded
that few Canadians seek care at American medical centers. Canadians
accounted for less than 1 percent of total admissions in each of the nine
border hospitals surveyed by the Association. The Pepper Commission
identified Buffalo General hospital, with about 3 percent Canadian
admissions, as having the largest share of Canadian patients.
The Ontario Ministry of Health estimated that, in 1990, it spent roughly
$100 million (US.) for medical services provided in the United States to
provincial residents seeking to avoid queues. This represented about 1
percent of the total provincial health care budget. For many rationed
services, the Ontario health plan approves payment for treatment in the
United States. By arrangement with the Ministry, some U.S. hospitals
have agreed to accept lower payment for services provided to patients
from Ontario. The Ministry pays 76 percent of the U.S. hospital charges
“In addition, some Canadians seek treatment in U.S. institutions because they find themselves in
need of treatment while vacationing in the United States or for confidentiality ressons.
13The Pepper Commission, A Call for Action, Supplement to the Final Report, Sept. 1990, pp. 226-6.
14D.A. Rublee, “A Survey of Western Canada’s Use of the U.S. Health Care System,” American Med-
ical Association, Center for Health Policy Research, Sept. 1989.
Page 60 GAO/HRDOl-90 Canadian Health Insurance
chapter 4
Accem Conoequencea of Univereal Caverage
With Spending Contmle in Ontario
and the same fees it would have paid to physicians had the service been
provided in Ontario. U.S. hospitals absorb the remaining hospital
charges and are responsible for making up the difference between the
fees paid to the physician by the Ministry and the fees normally charged
by the physician.
The Ontario policy to pay for treatment at U.S. facilities reflects the
Ministry’s position that purchasing U.S. health care services for Cana-
dian citizens is more efficient than incremental investments in Canadian
hospitals. However, some Ontario physicians believe that the amount of
money paid to hospitals and physicians in the United States could be
more efficiently spent on expanding capacity for cardiac surgery and
other medical services in Ontario.
Page 61 GAO/HRD-91-99
Chadlan Health lnmrance
. .
‘,
I

Potential Savings in Administrative Expenses
Could Offset Costs of providing Universal
Access in
the
United
States
If the United States adopted certain key financing features of the Cana-
dian health care system- namely, universal insurance coverage with no
deductibles or copayments and a single public payer-these features
would generate both costs and savings. Universal insurance would gen-
erate additional costs associated with providing full coverage to the 32
million uninsured Americans. The elimination of all deductibles and
copayments would yield larger but more uncertain cost increases associ-
ated with increased utilization of health care. However, the streamlining
of insurance administration under a universal coverage, uniform pay-
ment system would generate sufficient savings to cover the costs of
expanded access and could potentially offset the more uncertain costs
associated with elimination of all cost-sharing requirements.
We derived “ballpark” cost estimates using data from Ontario’s health
insurance plan. There is uncertainty surrounding even these simple esti-
mates. In general, we have attempted to synthesize existing data and
make a relatively conservative estimate of potential costs and savings in
the insurance, physician, and hospital sectors,
Moreover, we recognize that the United States would likely modify any
reforms adopted from Canada to be consistent with U.S. political institu-
tions and to accommodate the existing health care structure.1 Such mod-
ifications could have significant effects on the system’s costs and
savings. (See ch. 6.)
Setting up a Canadian-style system in the United States would require
legislation similar to the Canada Health Act to establish universal access
to a broad range of insured health services and empower government to
control budgets for the hospital and physician sectors of the health
economy. In the United States, who (federal, state, other) would admin-
ister the system? What would be the role of private insurers? How
would sector-wide spending controls be implemented for investor-owned
health facilities? These and other unknowns will have important effects
on U.S. health spending reform, but considering them in our calculations
was beyond the scope of our review.
Instead we developed estimates reflecting changes that would occur in
aspects of U.S. reimbursement, coverage, and benefits if elements of the
Ontario health insurance program were fully replicated. Our estimates,
therefore, are intended to be “working numbers” to serve as a starting
‘See T.R. Marmor and J.L. Mashaw, “Canada’s Health Insurance and Ours: The Real Lessons, the Big
Choices,” The American Prospect, Fall 1990, pp. 18-29.
Page 62
GAO/IiRDBl-90 Canadian Health Insurmce

Chapter 6
Potential f3mingm in Adminbtrative Expansea
Could Offeet Costs of Providing Universal
Access ln the
United St&es
point for expenditure reform discussions. In fact, no attempt was made
to calculate the cost or length of a transition period for implementation.
Administrative
To estimate the short-term effects of the United
States’ adopting fea-
Savings Would Offset
tures of a Canadian-style system, we calculated the sum of (1) the sav-
ings achieved from streamlining the administrative process, (2) the cost
Costs in the Short Run
of providing universal health insurance, which would increase the utili-
zation of health services by the formerly uninsured, and (3) the cost of
eliminating deductibles and copayments, which would increase the utili-
zation of services by the formerly insured.
We expect that both the savings and the added costs would be concen-
trated in the insurance, physician, and hospital sectors. Savings
achieved from reductions in administrative expenses could more than
offset the added costs of increased utilization. As shown in table 5.1,
introducing universal coverage and eliminating cost-sharing payments
could increase expenditures by about $64 billion. However, nearly $67
billion in estimated savings in administrative expenses could offset the
added costs, The net impact, after transition and for the first year of full
implementation, would be to reduce national health spending by about
$3 billion, or roughly 0.4 percent of the 1991 health expenditures pro-
jected for the United States2
Table 5.1: Estimated Savings and Costs
of Adopting a Canadian-Style System in
Dollars in billions
1691
Insurance
Physicians
Hospitals
Total
Total savings
S(33.9)
S(14.8)
S(18.2)
S(66.9)
Total added costs: 1.8 27.2 34.9 63.9
Newly insured 0.9 7.1 10.2 18.2
Currentlv insured 0.9 20.1 24.7 45.7
Net change
fI(32.1)
$12.4 $16.7
tg3.0)
Assumptions
Estimation
Used in Cost
We used three key assumptions in deriving our estimate of effects on
national health spending. First, the United States would fully adopt
major elements of a Canadian-style system as currently implemented in
Ontario. Second, some cost-saving factors and all cost-inducing factors
I
2U.S. health care expenditures for 1991 are expected to be $706.9 billion. Nearly two-thirds of this
total is accounted for by insurance overhead, payments to hospitals, and payments to physicians-
amounting to $34.6 billion, $277.2 billion, and $137.6 billion, respectively.
Page 63
GAO/HRD91-90 Canadian Health Insurance

chapter 6
Potential Saving6 in
Administrative Ezxpem
Could OPfaet Caste of Providing Universal
Access in the United Stdea
would have their full effect in the first year of complete implementation.
Third, potential transition costs were not included. Without carefully
specifying how a Canadian-style system would be implemented in the
United States, it is not possible to estimate either the length of time or
the costs of transition. Costs to be incurred during this transition would
come from building the administrative machinery to implement global
budgeting, physician fee controls, and other policies.
For this analysis, we did not account for a number of effects that are
indirect and secondary to health financing. For example, we did not
attempt to calculate indirect savings that could be achieved from cov-
ering preventive care (such as prenatal exams, mammograms, and com-
prehensive childhood immunizations) or changes in spending for drugs,
long-term care, dental, or other services. Nor did we address the signifi-
cant shifts in the distribution of payments among government, private
employers, and consumers that a conversion to a single payer would
generate.
Finally, we did not consider differences between the United States and
Canada that are external to their health systems
that
would neverthe-
less affect health costs. For example, lower malpractice insurance
expenses in Canada may reflect differences in tort laws and attitudes
toward litigation as well as differences in health financing systems.
Savings in Administrative
Savings would derive from reductions in administrative costs, which
costs
would involve no diminution in health services delivered. Savings would
be realized only if the public payer succeeded in lowering payments to
hospitals and physicians rather than letting them retain the savings in
administrative expenses. As discussed in chapter 3, health insurers’
overhead costs and providers’ administrative costs are substantially
lower in Canada than in the United States. A universal access system
administered by a nonprofit agency would reduce costs by eliminating
the
need to determine coverage, eligibility, and risk status and by elimi-
nating marketing costs. The simplified payment process would also
lower the billing and clerical costs that U.S. hospitals and physicians
now bear. As a result, expenditures for the insurance, physician, and
Page 64 GAO/HRDI)l-99
Canadian Health Insurance

chapter 5
Potmthl Savinga in Adndnbtratlve Expenee8
could 0ffm.t Coets of -ding Universal
Aceem in the United Statea
Insurance Overhead
Physician Costs
hospital sectors under a Canadian-style system would be lowered by
about $67 billion3
If the United States lowered its insurance overhead to Ontario’s level,
the potential savings in health care expenditures would be $34 billion
per year. As discussed in chapter 3, the share of health expenditures
accounted for by insurance overhead-payments to insurance compa-
nies not used for payment of benefits, such as marketing cost and eligi-
bility determination- represents a substantial portion of the difference
in per capita spending in the two countries. The overhead component of
health insurance premiums accounted for close to 6 percent of the total
health expenditures in the United States (in 1989) as compared to just
over 1 percent in Ontario. Canada’s lower spending is attributable to its
simplified reimbursement system using a single payer and to the limited
role for private insurers to provide supplemental rather than basic
coverage.
If U.S. physicians could reduce their billing costs to the level of their
Ontario counterparts, the potential savings would average about
$26,000 per physician4 For the nation, the annual savings could be up to
$16 billion provided that the savings are reflected in lowered physician
fee schedules. These savings would stem from reductions in practice
costs (excluding any changes in malpractice premiums that could occur)
and would not lower the net incomes of physicians.
We estimated the administrative costs borne by US. physicians that are
additional to those of Ontario’s physicians as the sum of (1) the differ-
ence in spending on nonphysician salaries and benefits, (2) the amount
3Short-run estimates of administrative cost savings have also been made by Physicians for a National
Health Program (PNHP) and Lewin/ICF. PNHP estimates insurance overhead savings at $27 billion
compared to a Lewin/ICF estimate of $22 billion. Savings in physician administrative costs are esti-
mated to be $9 billion by PNHP and about $1 billion by Lewin/ICF. In the PNHP analysis, savings ln
hospital administration costs are estimated at $31 billion, assuming that the full difference in admin-
istrative costs can be attributed to differences in the way Canadian and U.S. health care systems are
organized. Lewin/ICF defines hospital administrative costs much more narrowly and estimates a $11
billion savings. Our estimate falls between the two. See K. Grumbach and others, “Liberal Benefits,
Conservative Spending: The Physicians for a National Health Program Proposal,” Journal of the
American Medical Association, Vol. 266, No. 19, May 16,1991, pp. 2649-2664, and Lewin/ICF,
National Health Spending Under Alternative Universal Access Proposals (prepared for AFLCIO by
S L.ewin and J. Sheik), Oct. 26, 1990. * .
41n the physician services category, our data mainly reflect spending for services provided by self-
employed physicians, since salaries paid by hospitals to physicians are accounted for in the hospital
care category. Payments for services provided by salaried physicians ln health maintenance organiza-
tions (HMOs) are included in the physician category, but only 2 percent of U.S. physicians are sala-
ried by HMOs. We thus calculate the potential savings on billing expenses, which are relevant to self-
employed physicians only, against the entire amount of payments to the physician category.
Page 65
GAO/HRD-91-99 Canadian Health Insurance

chapter s
Potmtlal Savin& In Adminl8trative JZxpmmm
Could OfBet Costa of Providing UnIverml
Acmes In the United Staterr
Hospital Costs
spent on specific billing services, and (3) the difference in the value of
physicians’ time spent by filing insurance forms and providing required
second opinions.6
If the United States reduced its hospital administrative costs to the level
in Ontario, it could save about $18 billion in the first full year. We esti-
mate that in 1988 U.S. hospitals spent 16 percent of total revenues on
administration, including general accounting, patient accounts, admit-
ting, medical records, purchasing and stores, and data processing. By
contrast, Ontario hospitals, which receive an annual global budget from
the provincial government and bill only for amenities, spent 9 percent of
revenues on similar administrative functions.
Much of the difference in hospital administrative costs has been attrib-
uted to the complex, cumbersome reimbursement system that confronts
U.S. hospitals. The U.S. payment system requires hospitals to maintain a
large administrative and financial apparatus to determine coverage,
charge patients and insurers, and resolve billing disputes. Global
budgeting is the mechanism that enables the single payer in Canada to
capture these savings.
Added Cost of Increased
Utilization
Adoption of universal insurance coverage without cost sharing in the
United States would likely increase health care spending. The increase
would result from greater access to health care for the uninsured and
greater use of health care services for all Americans. With access to a
broader range of services, utilization by the uninsured would likely
increase substantially. With virtually no cost-sharing requirements, use
of health care services by both the newly insured and the currently
insured would also likely increase.6 Taken together, we estimate that
these two factors could raise US. health care expenditures under a
Canadian-style system by about $64 billion.
r?n
1988
the American Medical Association surveyed 3,000 physicians involved with Medicare and
Blue Shield insurance programs to ascertain how much time they and their staff spend on admlnistra-
tive activities. It found that (1) a physician spends an average of six minutes per claim, (2) the physi-
cian’s staff spends an average of 1 hour per claim, and (3) about 14 percent of physicians have used
an outside billing service at a cost of about $8 per claim. See: American Medical Association, Center
for Health Policy Research, “The Administrative Burden of Health Insurance on Physicians,” SMS
-
Report, Vol. 3, No. 2, 1989.
gThe effects of this increased utilization on health are difficult to assess, but appear to be positive.
App. I reviews several studies of changes in populations’ utilization patterns after introduction of
“free” care and provides a discussion of the potential effects of improved access on health status.
Page 06 GAO/HRD9lSO Canadian Health Insurance

Ciubptur 5
Potential Savingll in Adndnbtrative ICxpem
could Offset Chats of Providing Universal
Access In the United States
Providing expanded health care to the uninsured would account for
about one-fifth of the total cost of increased utilization. Currently, the
unin.sured spend about 40 percent less than those insured for hospital
and physician services. The additional cost of bringing the uninsured up
to the level of health care provided to the insured under the current
system would increase annual U.S. health expenditures by about $12 bil-
lion, or 2 percent of current national health expenditures. This estimate
represents the additional cost of providing an average level of health
care to the uninsured US. population if they were covered by a typical
insurance plan7
The largest and most uncertain factor contributing to costs is the poten-
tial effect of eliminating deductibles and copayments. We estimate the
cost to be about $52 billion. Costs depend on the extent to which elimi-
nating the individual’s responsibility for copayments and deductibles
would induce greater utilization of hospital and physician services. In
developing our estimate, we assume that utilization of hospital care
would increase by 10 percent, use of physician services would increase
by 17 percent,” and administrative costs would increase proportionately.
Substantial Savings
Could Accrue in the
Long Run
In the long run, operating under a Canadian-style health care system
could help control the growth in health care spending. Global budgeting,
physician fee controls, and constraints on the diffusion of high-
technology equipment within the context of a uniform payment system
provide a basis for exerting some control on the growth of health
expenditures in future years. In Canada, these policies were used to
keep the share of
GNP
spent on health care stable at about 7.4 percent
from 1971 to 1981. After an abrupt rise in 1982, the share has stabilized
at about 8.8 percent.
The United States has experienced a continually rising share of its
GNP
going to health care. Aggregate mechanisms to control the rate of
‘A typical health plan was assumed to cover physician care, hospital inpatient and outpatient care,
and prescription drugs. It included a $200 deductible, 20-percent coinsurance, and a $3,000 cap on
out-of-pocket expenses. The study also assumed that utilization by newly insured individuals would
increase to the level of insured individuals of similar age, sex, income, and health status characteris-
tics. See Lewin/ICF, The Health Care Financing System and the Uninsured (prepared for HCFA by
J. Needleman and others), Apr. 4, IQQO.
‘The Rand Health Insurance Experiment estimated a lo-percent increase in utilization of hospital
services, As noted in app. I, estimates of the utilization response to free care on physicians’ services
range from 3 (the average Canadian experience) to 31 percent (the Rand analysis). For our estimate,
we took the midpoint of these two figures.
Page 67
GAO/HRD-91-90 Canadian Health Insurance

Chapter 6
Potential Saving8 in Admtnbtrative Expenma
could Offmt CM&I of Providing Uxdvereal
Acceee in the United Statea
spending growth have not been tried here. Canada and several other
countries have had more success in controlling aggregate expenditures,
The Canadian system provides one approach that the United States
could adopt to more effectively control the share of resources devoted to
health care. Were the United States able to constrain the growth in
health care costs so that the health care share of
GNP
stabilized, the
future savings are potentially large.
The Health Care Financing Administration estimates that U.S. health
spending will increase by 9 percent annually, 2.6 percentage points
higher than
GNP?
By 2000, under current policies, health care spending
as a share of
GNP
is expected to rise from 11.6 percent (as of 1989) to
16.0 percent.
Figure 6.1 illustrates the potential cost savings that could result if the
United States were successful in keeping the rate of health expenditure
growth at the rate of
GNP
growth beginning in 1996. The extent to which
full adoption of a Canadian-style system in the United States would
yield such results depends not only on the feasibility of implementation,
but also the willingness to maintain the controls necessary to restrain
spending throughout the time period.
@Health Care Financing Administration, Division of National Cost Estimates, Office of the Actuary,
“National Health Expenditures, 1986-2000,” Health Care Financing Review, Summer 1987, Vol. 8,
No. 4,
pp. l-36.
Page 08 GAO/H&DBl-90 Canadian Health Inmrance
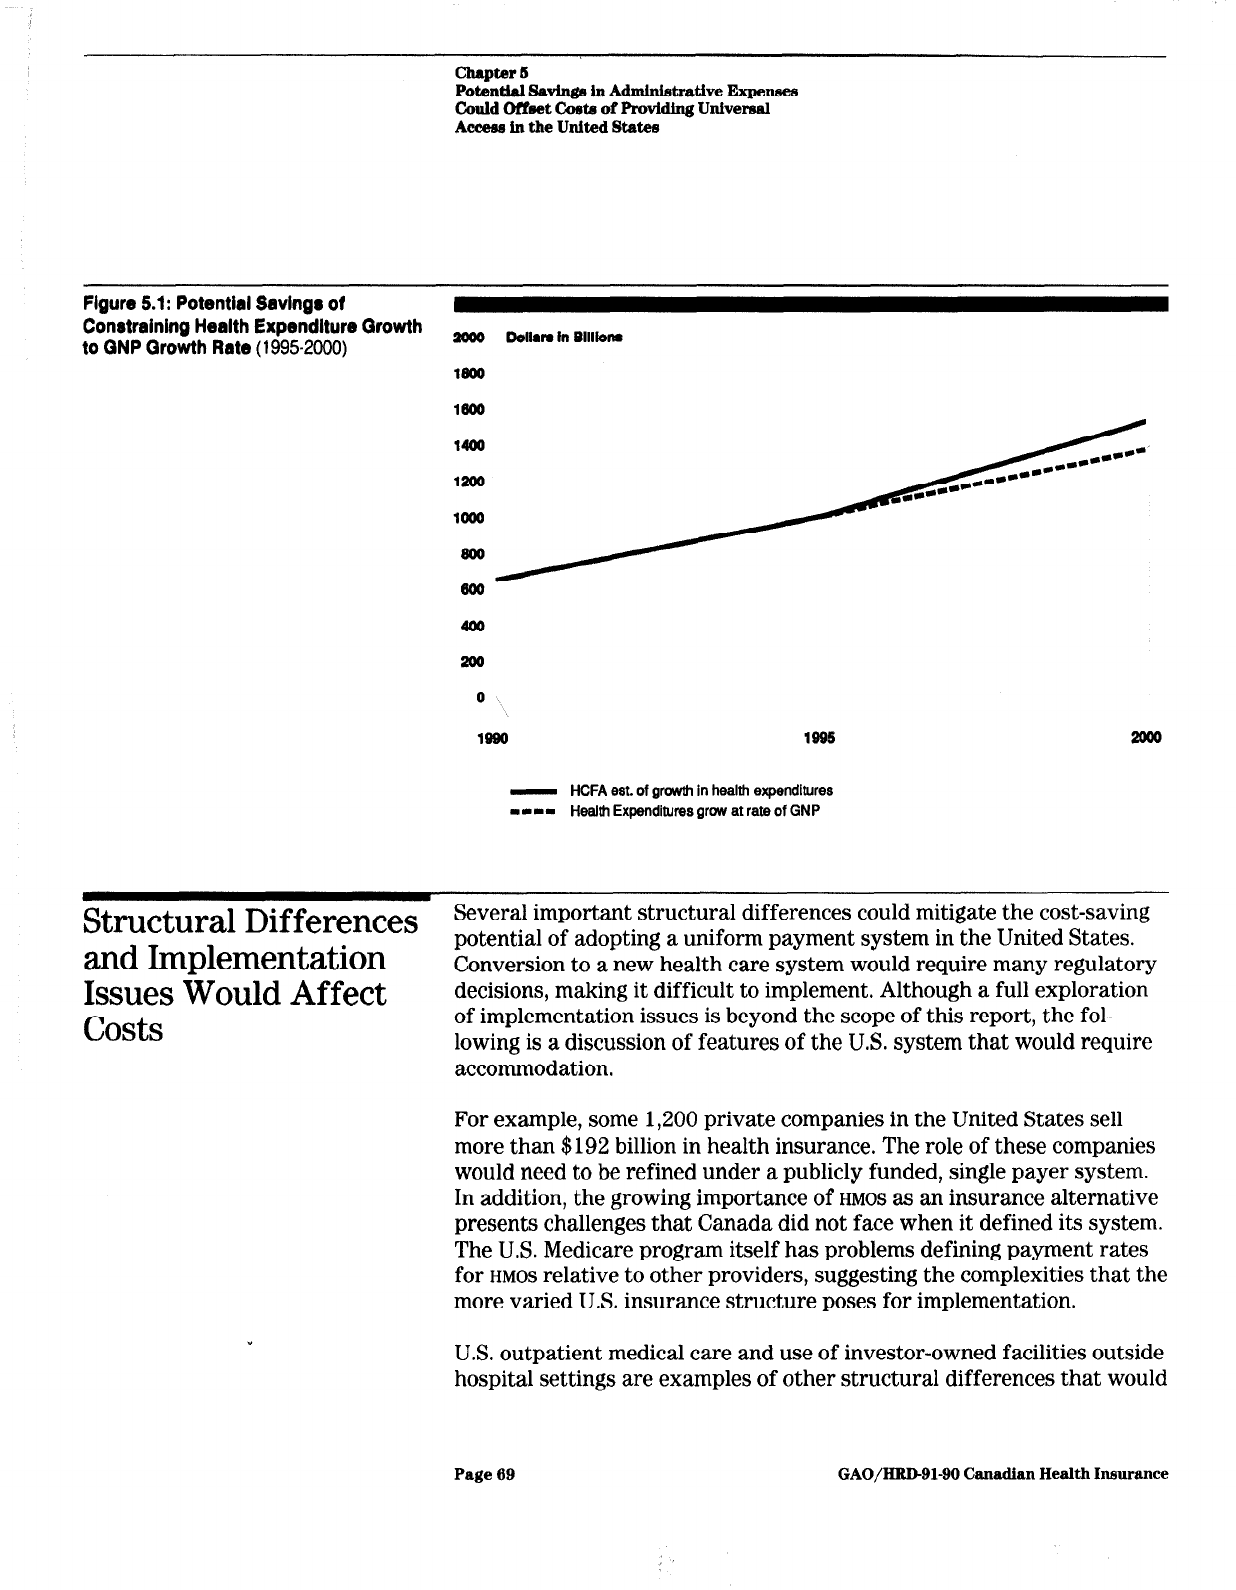
Chapter 6
Potential SavInga in Adndnletratlve Expenses
Could Offmet Crete of Providing Universal
Aceeaa ln the United Statee
Figure 5.1: Potential Savings of
Constraining Health Expendlture Growth
to QNP Growth Rate (19952000)
#loo Do,,rn in B,,,lonr
- HCFA est. of growth in health expenditures
-1-1 Health Expenditures grow at rate of GNP
Structural Differences
Several important structural differences could mitigate the cost-saving
and Implementation
Issues Would Affect
costs
potential of adopting a uniform payment system in the United States.
Conversion to a new health care system would require many regulatory
decisions, making it difficult to implement. Although a full exploration
of implementation issues is beyond the scope of this report, the fol-
lowing is a discussion of features of the U.S. system that would require
accommodation.
For example, some 1,200 private companies in the United States sell
more than $192 billion in health insurance. The role of these companies
would need to be refined under a publicly funded, single payer system.
In addition, the growing importance of
HMOS
as an insurance alternative
presents challenges that Canada did not face when it defined its system.
The U.S. Medicare program itself has problems defining payment rates
for
HMOS
relative to other providers, suggesting the complexities that the
more varied U.S. insurance structure poses for implementation.
US. outpatient medical care and use of investor-owned facilities outside
hospital settings are examples of other structural differences that would
Page 69
GAO/HRD-91-90 Canadian Health Insurance

Chapter 6
Potmthl Savinga in AdminbtratIve Expenaw
could Offset Co& of Providing Universal
Acceee in the United State0
require special cost control measures. Canada has been able to control
the diffusion of
MRIS
and other high-cost equipment by limiting approval
to hospitals, which are governed by global budgets. The United States
would have to develop additional measures to control high-technology
equipment costs outside hospitals.
The preponderance of medical doctors in the United States who are clas-
sified as nonprimary care specialists has escalated the costs of physician
services. As a result, to contain physician expenditures as is done in
Ontario, the United States would establish reimbursement rules
whereby physicians are paid uniform rates whether the service is per-
formed by generalists or specialists.
In implementing health financing reforms, the United States would
likely make many modifications to the Canadian system that could
result in costs or savings. For example, to avoid queues, the United
States could forgo some cost savings by permitting greater latitude in
diffusion of new technologies. To accommodate individuals willing to
pay for services outside the public system, it could allow for a privately
funded health care delivery sector. To contain utilization, the United
States could choose to retain deductibles and copayments for higher
income residents. Whatever the change, as the system is modified to
meet the expectations of the U.S. population, the cost estimates of
adopting such a system would change significantly.
Page 70
GAO/HUD91-90 Canadian Health insurance

Chapter 6
Conclusions
Canada’s comprehensive health care reforms have resulted in universal
access to health care while maintaining control over the growth of
health care costs relative to the United States. Canada’s 20-year experi-
ence with national health insurance can provide some insights for health
care reform in the United States. Both the strengths and weaknesses of
Canada’s system can provide invaluable lessons for any attempt at com-
prehensive reform in the United States.
The Canadian experience clearly demonstrates that it is possible to
move to universal access without any major effects on the net costs of
health care. Indeed, the short-term administrative savings alone are
more than adequate to cover any reasonable cost estimate of extending
health care to everyone. The second area where Canada’s relative per-
formance has been clearly better is in the control of the nation’s
resources devoted to health care. The United States has been experi-
menting with a number of piecemeal cost-containment efforts that in the
aggregate have not been as successful as the Canadian approach in con-
straining the share of
GNP
going toward health care. The relative success
of Canada’s comprehensive reforms suggests the need for the United
States to consider a more integrated approach.
It is not, however, clear that the United States could or should replicate
the Canadian system in every dimension. Canadian elimination of
deductibles and copayments for all necessary medical care is an example
of a policy that should be carefully evaluated within the American con-
text. The potential costs of eliminating cost sharing are the largest, most
volatile, and most uncertain factor affecting costs of movement toward
a Canadian style system. If the United States adopted universal cov-
erage, we should consider retaining some form of cost sharing, except
for low-income persons, to hold down the costs of implementing compre-
hensive reform. These cost savings could than be used to provide some
leeway for the United States to improve upon the Canadian system and
make it more acceptable to U.S. citizens.
Retaining some degree of cost sharing may also make it easier to inte-
grate
HMOS
and other forms of managed or coordinated care into a
national system. In several states
HMOS
represent a large share of the
total health insurance market, and it may be important to develop a
mechanism to build on the existing health infrastructure in these states.
While Canada has substantially streamlined administrative costs and
burdens for physicians and hospitals, it may, at the same time, not have
invested sufficient resources in the management information systems
Page 71
GAO/HRD91-99 Canadian Health Insurance

Chapter 8
Conclueiom3
needed to improve service efficiency. The United States may want to
retain and build upon information systems that have been incorporated
into our health care system. For example, the
DRG
system for hospital
prospective payment gives hospitals the incentive to develop cost-based
management information systems to determine whether a hospital is
operating efficiently. Canada’s global hospital budgeting provides little
incentive to monitor individual cases and may have led to some ineffi-
cient hospital use in terms of hospital stays that are unnecessary or too
lengthy. The United States may want to retain elements of its DRGbased
reimbursement system as a mechanism for constraining hospital cost
growth.
The effects of constraints on the development and diffusion of new med-
ical technologies is one weakness of the Canadian system that is prob-
ably most troubling to Americans. With our strong medical research
establishment, the United States needs a more flexible approach to the
acquisition of high-technology and other resources to avoid development
of future queues for high-technology procedures and to provide incen-
tives for further development of such technologies. The United States
would likely want a more flexible approach than Canada’s global hos-
pital budget process to prevent queuing for high-technology medical
procedures. Still, the United States would likely not want to abandon
opportunities to capture savings in this area. One approach could be to
integrate decisions to open and close hospitals as well as those to expand
new technologies into a separate capital budget process. A unique U.S.
approach would also have to account for the recent growth in expensive
medical technologies outside the hospital setting.
Canada demonstrates that comprehensive health care reform can be an
effective tool for controlling health care costs while providing universal
access to high-quality care. But, even the Canadians have looked to the
United States to find ways to improve their system. The potential for
integrating
HMOS
or patient-based management information systems into
the Canadian framework are two examples where they see some merit
in the US. approach. The United States needs to develop a comprehen-
sive approach to health care reform that builds on lessons learned from
Canada and other countries while also integrating the unique strengths
and needs of the American health care system.
The US. approach should borrow those concepts from Canada that
work, like universal access, a uniform payment system, and some type
of expenditure controls. But it should also build on the strengths of the
current U.S. system by encouraging greater emphasis on managed care
Page 72
GAO/HRD91-90 Canadian Health Insurance

and retaining its superior management information systems. Through
this approach the United States may be able to develop new solutions
compatible with unique American needs.
Y
Page 78
GAO/HBD91-99 Canadian Health Insurance
Appendix I
Health Implications of Expandin$ Access
to
Care
.
Adopting a Canadian-style health care’system ,in the United States
would likely result in improved access to health care for the uninsured
and greater utilization of health care services by most Americans. For
some lower income and uninsured individuals, a system of universal
coverage with no financial barriers to care would provide access to some
services for the first time. For the many insured individuals facing sub-
stantial copayments and deductibles for hospital and physician services,
a Canadian-style system with virtually no cost-sharing requirements
would increase utilization.
The effect of expanded use of services on health status is difficult to
assess but appears to be positive. Studies suggest that the poor, who are
less likely to have adequate health insurance coverage, may achieve
some gains in health status, such as improved control of hypertension
and healthier newborns. Similarly, it is not clear what effect, if any,
increased utilization would have on the health status of those currently
insured. Studies of utilization associated with free care suggest that
demand for both necessary and unnecessary medical care would
increase. For those already insured, services consumed may increase,
but the resulting effect on health status may be negligible. It is impor-
tant to note that health status is affected by many factors besides health
care. The removal of financial barriers to care, by itself, would not nec-
essarily improve health status. Thus,
adian-style health program
may not be enough to equalize health
Although the U.S. supply of physicians, hospital beds, and high tech-
nology could meet an increased demand for care, the availability of phy-
sicians and hospital beds in some geographic areas could continue to be
a problem. Nevertheless, a Canadian-style system would not likely
create queues or rationing of existing medical services. Rather, the issue
for Americans would be the potential effect on development and diffu-
sion of future medical technologies under a more regulated system.
Expanded Access May
The group most significantly and most favorably affected would be the
Improve the Health of
millions of Americans currently uninsured or underinsured. Under a
f
ree care system, their access to health care and demand for health ser-
the Uninsured
vices would probably rise substantially.
Page 74
GAO/HID-91-90
Canadhn Health Insurance

The Newly Insured Will
Increase Their Use of
Health Services
In general, the uninsured use fewer health care services than the insured
population. In 1986, the uninsured contacted a physician two-thirds as
frequently as the insured and spent three-fourths as many days in the
hospital. In addition, the location of physician contacts differs; the unin-
sured reported that a greater percentage of their contacts with physi-
cians took place in emergency rooms and hospital outpatient
departments.
Utilization rates of specific procedures and treatments also vary
depending on insurance status. For example, one study found that
insured patients were more likely to receive certain cardiac procedures
than were patients on Medicaid or uninsured patients.’ Patients on Medi-
caid, in turn, were equally likely to receive two of the three cardiac pro-
cedures studied, and less likely than uninsured patients to receive a
third.
A study by Lewin/ICF projected increases in utilization if the uninsured
were covered by a “typical” insurance plan with cost-sharing require-
ments.2 A “typical” health plan would cover physician care, hospital
inpatient and outpatient care, and prescription drugs with a $200
deductible and 20-percent coinsurance (out-of-pocket payment by the
user). The authors assume that newly insured persons would increase
their utilization to the levels of comparable persons already insured. The
study estimated that utilization by the newly insured would increase 37
percent for physicians visits, 38 percent for hospital outpatient visits,
and 46 percent for hospital inpatient admissions.
‘M. Wenneker, J. Weissman, and A. Epstein, “The Association of Payer With Utilization of Cardiac
Procedures in Massachusetts,” Journal of the American Medical Association, Vol. 264, No. 10, Sept.
12, 1990, pp. 12651260.
‘The Health Care Financing System and the Uninsured.
Page 75
GAO/HRD91-90 Canadian Health Inmrance

Appendix I
Health ImpUcationa of Ihpanding Acceaa
toclue
Health Improvement
Expected for the Newly
Insured
The formerly uninsured could be expected to have some improvement in
health status as a result of free care. This is particularly the case with
easily diagnosable and treatable conditions, such as hypertension. In the
Rand Health Insurance Experiment, for example, low-income enrollees
receiving free care evidenced improved control of blood pressure.3
Studies by Lurie and associates compared the health status of recipients
terminated from California’s Medicaid program (Medical) to those not
terminated.4 Patients were asked to assess their general health at their
final visit before being terminated from Medical (to determine baseline
values), and at 6 months and 1 year after termination. At both 6-month
and l-year intervals, the general health of the group terminated from
Medical had declined significantly, while there was no significant
change in the comparison group. For example, blood pressure control
was significantly worse in the terminated group compared with the com-
parison group.
Expanded access to health care may also result in increased use of pre-
natal care, thus improving the health status of both mother and infant.
Early and continuing prenatal care plays an important role in
preventing low birth weight and poor pregnancy outcomes. A
GAO
study6
found that 63 percent of Medicaid recipients and uninsured women
interviewed received insufficient prenatal care. A major reason that
uninsured mothers in this study did not receive regular prenatal care
(which would help alleviate some of these problems) was their lack of
3The Rand Health Insurance Experiment examined utilization of medical care services and health
outcomes under different cost-sharing requirements. In the experiment, which ran between 1974 and
1982, U.S. families were enrolled in 1 of 14 health insurance plans for up to 6 years. However, family
members over age 61 and the disabled who were eligible for Medicare were excluded. The plans
varied in coinsurance rates (from 0 to 100 percent) and maximum annual fiiancial liabilities (up to 16
percent of family income, or $1,000, whichever was less). Plans were grouped into four categories:
(1) plans providing free care; (2) individual deductible plans where the enrollee paid 96 percent of
expenses up to $160 per person ($460 for a family); (3) plans requiring coinsurance of 26 or 60 per-
cent, with caps on enrollee out-of-pocket expenditures of the lower of either 6,10, or 16 percent of
income or $1,000 and (4) “catastrophic” plans where enrollees paid 96 percent of health costs up to
caps of 6,10, or 16 percent of income or $1,000, whichever was less.
%tudy subjects were patients at the University of California at Los Angeles Medical Ambulatory
Care Center during the year preceding withdrawal of their MediCal benefits. Subjects in the compar-
ison group were also patients at the center, but their benefits were not discontinued because they
were blind, disabled, or in families with dependent children. The comparison group was socio-
demographically similar, but slightly older and more ill than the study subjects. N. Lurie and others,
“Termination from MediCal-Does It Affect Health?” New England Journal of Medicine, Vol. 311,
No. 7, Aug. 16,19S4, pp. 480-484. Also N. Lurie and others, “Termination of Medi-Cal Benefits-A
Follow-up Study One Year Later,” New England Journal of Medicine, Vol. 314, No. 19, May 8, 1986,
pp. 1266-1268.
‘U.S. General Accounting Office, Prenatal Care: Medicaid Recipients and Uninsured Women Obtain
Insufficient Care (GAO/HRD$7-137, Sept. 30,1987).
Page 76
GAO/HIlD-91-90 Canadh Health Insurance

Iieakh Ymplicationa of Expanding Acceee
tocare
health insurance. With universal health insurance, access to care would
be assured, and health needs more likely to be met before serious
problems develop.
Utilization by Those
For Americans who are currently insured, a Canadian-style system will
CUrrently
Insured
‘will
also encourage greater use of health care services. The elimination of
deductibles and copayments can be expected to increase demand for
Also Increase
both physician and hospital services.
Free Care Expected to
Roth Canadian and U.S. studies have found that people who received
Result in Substantial Rise
free care made substantially more use of health services than those who
in Use of Physicians,
paid all or part of the cost themselves. The magnitude of the increases in
Smaller Rise in Hospital
--
utilization under a Canadian-style system is likely to differ for hospital
and physician services. In both cases, free care affected the number of
Use
medical contacts, rather than the charge per service.
Table I. 1 presents data from the Rand Health Insurance Experiment. It
compares several measures of utilization under free care to two insur-
ance plans with features American plans often have: a plan with coin-
surance and a plan with a deductible. Total per capita expenditures by
families on the free plan were 18 and 23 percent higher than expendi-
tures by those on plans with cost sharing. Although hospital admissions
on the free plan are 22 and 11 percent higher than on the cost-sharing
plans, inpatient expenses were only 10 percent higher.
Page 77
GAO/HUD-91-90 Canadian Health Insurance

Appendix I
Health Impllcatlo~~ of Expanding Acceem
tocare
Table 1.1: Percent Increase In Annual Use
of Medical Services Under Free Care
Over Use Under Cost-Sharing Plans
Figures in percent
2b-percent
Individual
coinsurance0 deductibleb
Health care costs
Outpatient expenses
lngatient expenses
31
45
10 IO
Total expenses
18
23
Health care use
Face-to-face visitsC
37 51
Admissions
22
11
% the 25.percent coinsurance plan, the enrollee paid 25 percent coinsurance with a cap on enrollee
out-of-pocket expenditures set at the lower of either 5, 10, or 15 percent of income or at most $1,000
annually.
bin the individual deductible plans, the enrollee paid 95 percent of expenses up to $150 per person, or
$450 per family, annually.
CFace-to-face visits are contacts with physicians or other health providers, excluding visits for any radi-
ology, anesthesiology, or pathology services.
Source: W.G. Manning and others, “Health Insurance and the Demand for Medical Care: Evidence From
a Randomized Experiment,” The American Economic Review, Vol. 77, No. 3, June 1987, pp. 251-277
(calculated from table 2).
The Rand data also indicate that free care affected use of physician ser-
vices more than use of hospital services. Significant differences between
free care and cost-sharing plans showed up in the number of physician
visits and outpatient expenses, For example, face-to-face visits by fami-
lies on the free care plan were 37 and 51 percent greater.
By comparison, data from the first six Canadian provinces to implement
universal, publicly funded insurance for physician services indicate that
the percentage changes in utilization of physician services ranged from
0.9 to 5.2 percent and averaged 3 percent.6 The relative unresponsive-
ness of the physician service utilization rate to price changes in Canada
may be due to the fact that changes in the health care system came
gradually. Between 1961 and 1971, all provinces had universal public
insurance covering hospital services but had not yet implemented cov-
erage of physician services. This may have created incentives for both
physicians and patients to substitute hospital care for physician ser-
vices whenever possible. Some care ordinarily deliverable at physicians’
offices might have been provided at hospitals. Thus, by the time all
medical care was publicly insured in 1971, the level of unmet needs for
‘M. L&lair, “The Canadian Health Care System,” in S. Andreopoulos, ed. National Health Insurance:
Can We
Learn
From Canada? (New York: John Wiley and Sons, 1976), pp. 4348.
Page
78
GAO/HRIMl-90 Canadian Health Insurance

Appendix I
Health Implications of J3xpandhg Access
tQC&UV
Canadians might have been lower than that of the free care participants
of the Rand experiment.
Increase in Utilization by
Studies suggest that the removal of copayments would have a larger
the Insured May Vary by
impact on utilization by low-income people than utilization by high-
Income
income people. The introduction of user fees in Saskatchewan in 1968
demonstrated that copayments have a greater impact on the utilization
by the poor than by the rich.7 After introduction of copayments for phy-
sician services, demand over the entire population decreased by 6 to 7
percent. However, there was a much larger decrease by the poor.
Demand for care decreased about 18 percent for individuals in the
bottom fifth of the income distribution.
A study in Montreal found that reducing patient costs had a differential
impact on utilization of physician services by the rich and poor.* Public
insurance resulted in an increase in the volume of physician services
provided for the poor and in a decrease in volume for the rich. Individ-
uals with the lowest family income increased their visits by 18 percent;
those in the highest income group reduced theirs by 9 percent. The
authors hypothesized that one reason utilization by the rich decreased
was that after the introduction of public insurance, waiting time
replaced money as the major cost incurred by the patient in acquiring
care. Another explanation may be that doctors began queuing patients
according to clinical need rather than ability to pay.
In contrast, the Rand study found that different income groups have
relatively similar responses. In three of the four sites of the study, fami-
lies in the lowest third of the income distribution responded the same as
those in the highest third. However, in the Rand experiment the poor
faced less cost sharing on average. Cost sharing was linked to income: as
a result, the poor were more likely to meet the out-of-pocket caps and
‘R G E%eck,“The Effects of Co-payment on the Poor,” Journal of Human Resources, Vol. 81, No. 2,
March/April 1973, pp. 129-142.
8P. Enterline and others, “The Distribution of Medical Services Before and After Wee’ Medical
Care-The Quebec Experience,” New England Journal of Medicine, Vol. 289, No. 22, Nov. 29, 1973,
pp. 11741178.
Page 79
GAO/HRD91-90 Chmdiaa Health Infaurance

Appendix I
Health Implications of Expanding Access
tocare
thus not face additional cost sharing. The author@ conclude that cost
sharing unrelated to income would have a greater impact on
the
poor.Lo
Free Care May Not Change
It is not clear whether the health status of the currently insured popula-
the Health Status of the
tion would change under a Canadian-style system. Data from the Rand
Currently Insured
experiment suggest
that
except for a few conditions, free care does not
change the health of average enrollees. Within the group receiving free
care, vision improved for individuals with poor vision, and blood pres-
sure improved for low-income people with high blood pressure.” How-
ever, no significant effects were observed on eight other measures of
health status and health habits.
Results from the Rand experiment suggest that implementation of a
Canadian-style system will likely increase the use of both effective and
rarely effective medical care.
l2 While free care increased the utilization
of effective and rarely effective care for poor and nonpoor adults, there
was a differential impact on utilization by poor and nonpoor children.
Utilization of highly effective care increased as the level of cost sharing
decreased among poor children but not among the nonpoor. Cost sharing
significantly reduced utilization of rarely effective health care for both
poor and nonpoor children, but had a greater effect on poor children.
Utilization of Preventive
Services Will Depend on
Reimbursement System
It is unclear whether universal health insurance will promote use of
more preventive health services. Again, there is limited information
available to project future utilization, with conflicting results from
various studies. In the Rand experiment, free care had no effect on such
health habits as smoking, weight, or cholesterol levels. However, in Mon-
treal, after introduction of universal medical insurance, the proportion
‘J. Newhouse and others, “Some Interim Results From a Controlled Trial of Cost Sharing in Health
Insurance,” New England Journal of Medicine, Vol. 306, No. 26, Dec. 17, 1981, pp. 1601-7.
loThe Rand study participants included a smaller income range than typically present in the United
States. (People with incomes over $64,000 (1982 value), 3 percent of those initially contacted, were
excluded.) Also, income levels were grouped into only three levels, thus potentially obscuring the
impact on the poor.
“The improvement in blood pressure in the free care group was due to additional contacts with
physicians, leading to more opportunity to detect and treat hypertension that was not under care at
the beginning of the study.
12The effectiveness of medical care refers to the degree to which medical contact for a specific condi-
tion may be useful. For example, contact for heart failure can be highly effective in improving a
patient’s condition. However, for some conditions, such as obesity, medical contact may be rarely
effective and have little direct value. “Effect of Cost-Sharing on Use of Medically Effective and Less
Effective Care,” Medical Care, Vol. 24, No. 9, Sept. 1986, Supplement, pp. S31-S38.
Page 80 GAO/HRD-91-90 Canadian Health Insurance
,
AppendSx I
IieaIth I~~~pkatlona of Expanding A-
tocare
of women receiving their first prenatal care visit before the third month
increased from 41 to 66 percent overall, with the largest increases in
lower income families. The proportion of women seen in postnatal visits
increased also, again with the largest increase seen in lower income
groups.
Some experts feel that the reimbursement system will determine
whether utilization of preventive services will change under universal
health insurance. Some physicians may provide more preventive care in
order to get more reimbursement. However, simply making preventive
care available (at no financial charge) does not necessarily ensure that
people will use it.
Under New System,
An important consideration in measuring access implications is whether
Resource Supply
enough health care resources are available to meet the new demand gen-
erated under a Canadian-style program. Under such a program, the
Appears Adequate to
health care delivery system will face increased demand for services.
Meet Demand Growth
Data on the health care delivery system indicate that, in the short run,
increased demand could be met by the existing supply. However,
problems with the distribution of health resources may continue.
Supply of Physicians
Appears Adequate, but
Distribution May Still Be
a Problem
In the aggregate, the present and projected supply of physicians in the
United States appears to be adequate to meet a growth in demand for
health care services. The ratio of active physicians per 100,000 persons
grew from about 149 in 1970 to about 211 in 1988. Physician supply is
expected to continue growing, resulting in estimates of a physician sur-
plus ranging from 71,600 to 137,200 by the year 2000.13
By region and urban-rural area, however, the distribution of physicians
varies greatly,‘4 with shortages occurring in some rural and urban
r3Estimates of physician supply are from the Bureau of Health Professions and the revised Graduate
Medical Education National Advisory Committee, respectively. For other analyses, showing no sur-
plus, see W.B. Schwartz and D.N. Mendelson, “No Evidence of an Emerging Physician Surplus,
Journal of the American Medical Association, Vol. 263, No. 4, January 26, IQQO, pp. 667-660.
14The number of physicians per 10,000 population was over two times higher in metropolitan areas
than in nonmetropolitan areas-225 and 9.7, respectively (1933 data).
Page 81 GAO/HRDBl-90 Canadhn Health Insurance

Appendix I
Health Implkatiom of Expandbg
Access
tocare
areasI (It is unclear whether this difference in distribution results in
inadequate access to care.)
In addition, the mix of physicians in the United States favors specialist
care. The proportion of physicians in general and family practice has
been decreasing over time. In 1988, 13 percent of professionally active
physicians were employed in general and family practice compared to
19 percent in 1970. The American Medical Association projects that the
supply of these physicians will not keep pace with the increased
demand for their services. If general internists and general pediatricians
are included, about 34 percent of American physicians are currently
providing primary care.
Under universal access, non-primary-care practitioners may be called
upon to provide primary-care services. Some physicians trained in non-
primary-care specialties can, and do, provide primary care. This trend
may continue under a national health insurance program.
Increased Use of Hospitals
Hospital occupancy rates suggest that the supply of hospital beds would
Could Be Met With Current
be ample to meet a demand increase anticipated to result from adopting
Availability of Beds
a Canadian-style system. In 1989, the average hospital occupancy rate
in the United States was about 66 percent. As with physicians, however,
shortages of beds could occur in a few urban areas and a few rural
areas.
In addition, a Canadian-style health system could help stabilize some
hospitals financially threatened by large uncompensated care burdens.
Many rural hospitals as well as urban facilities must make up this rev-
enue loss either by cost shifting (increasing charges to paying patients
or subsidizing nonprofitable services with profitable ones) or through
private or public subsidies. Under a Canadian-style health system, facili-
ties that might otherwise close due to financial pressures could remain
lbThe federal government uses practitioner-to-population ratios as one measure in determining areas
with inadequate access to care, termed Health Manpower Shortage Areas (HMSAs). At the end of
1988, almost 34 million people lived in designated primary care HMSAs-about 17 million in urban
HMSAs and about 16.6 million in rural HMSAs. While more people live in urban HMSAs than rural
ones, a greater proportion of rural residents than urban residents lived in HMSAs (29.0 and 9.2 per-
cent, respectively, in 1988). (Health Manpower Shortage Areas are now referred to as Health Profes-
sional Shortage Areas.)
Page 82
GAO/HRD-91-99 Canadian Health Insurance
Appendix I
Hedth Implicationm of Expnnding Access
txbcare
open.‘” (This assumes that government would commit to sufficient
funding to keep them open.)
High-Tech
Resources
Sufficient
Demand
.nology
Would Be
to Meet New
Under a Canadian-style system, the United States would have an ade-
quate supply of high-technology equipment and services to meet an
anticipated demand increase. Assuming that provider practice patterns
remained the same, queues for existing technology would not develop in
the short run. For example, the United States has about eight times as
many
MRIS
and almost six times as many lithotripsy units per capita as
does Canada, where there are queues for this equipment.
In fact, in the United States, overuse and inappropriate use of high-
technology services is an oft-cited problem. A 1988 study showed that
not all patients undergoing bypass surgery in the United States actually
need it.17 For the 386 cases from 1979,1980, and 1982, it found that 14
percent of bypass surgeries were performed for inappropriate reasons.
Mammography machines are an example of high-technology equipment
of which the United States may have an excess supply. The number of
mammography machines installed in the United States is estimated to
have grown to almost four times the number needed. At lower-than-
optimal utilization rates, the cost per test is higher than that associated
with low-cost screening programs and therefore may impede access to
services. Quality also becomes a concern, because high-volume facilities
are more likely to adhere to quality standards.16
Given the United States’ current ample capacity, the conversion to a
Canadian-style program is more likely to affect the introduction and dif-
fusion of future health care technologies. If the United States replicated
the Canadian experience, queues for equipment acquired under a system
that regulated capital acquisitions would develop over time. When
‘“A Canadian-style health system could also help stabilize other facilities, such as trauma centers,
that face financial problems due to uncompensated care. In urban areas, uncompensated care is espe-
cially a problem in treatment of trauma patients. Some trauma centers are closing, limiting access to
emergency services. See U.S. General Accounting Office, Trauma Care: Lifesaving.System-Threatened
by Unreimbursed Costs and Other Factors (GAO/HRD-91-67, May 17,lQQl).
17C.M. Winslow and others, “The Appropriateness of Performing Coronary Artery Bypass Surgery,”
Journal of the American Medical Association, Vol. 260, No. 4, July 22/29,19SS, pp. 606609.
‘sM.L. Brown, L.G. Kessler, and F.G. Rueter, “Is the Supply of Mammography Machines Outstripping
Need and Demand,” Annals of Internal Medicine, Vol. 113, No. 7, Oct. 1, 1990, pp. 647-662. See also
1J.S. General Accounting Office, Screening Mammography: bw-Cost Services Do Not Compromise
Quality (GAO/HRD-90-32, Jan. 10,199O).
Page 83
GAO/HRD-91-90 Canadian Health Insurance

Appendix I
Health Implications of Fhpandhg Access
tocare
Canada introduced its health care system in 1971, for example, the
MRI
and lithotripter were not established medical technologies.
Page 84

Appendix II
Major Contributors to This Report
Human Resources
Division,
Wmhington, DC.
Janet L. Shikles, Director, Health Financing and Policy Issues,
(202) 276-6461
Mark V. Nadel, Associate Director, National and Public Health Issues
Michael Gutowski, Assistant Director
Rosamond Katz, Evaluator-in-Charge
Anita A. Roth, Evaluator
Hannah F. Fein, Technical Writer
Office of the Chief Office of the Chief
Economist, Economist,
Washington, D.C.
Washington, D.C.
Yesook S. Merrill, Senior Economist Yesook S. Merrill, Senior Economist
Detroit Regional Office
Robert R. Readler, Human Resources Manager
Patricia L. Carlucci, Site Senior
Ken M. Miller, Evaluator
(108748)
Page 86
GAO/HRB91-90 Canadian Health Insurance


_.. .__ _. -__.--...-.---.--l-.-.~.--- ..-.- _I__-_~“_L---I1-I,----
-...._._..--. --l-.--. -
The first five copies
of’
each (iA0 report, art’ free. Atlclit~ional tvJI)itAs
are $2 each. Ordtm shttultl be stunt
t.0
t.hth following address,
accom-
panieti by a chtvk or
rnorr~y
order made out
to
t.htb Snpt~rintentlen~
of Ih~~umt~~~t.s, when necc3sary. Orders for 100 or more copies t.0 t,c
mailtvi t.0 8 single address art* discounttd 26 perctvit..
ITS. General Accounting Office
I’.(). 130x 60 15
(hitht~rst~urg!, MI) 20877
Orcit~rs may itlst) t>tb placed by calling (202) 275624 1.

, _ _I - - -- . .._ - L -
._ . ._.
