
Hiroshi Nakaso
Deputy Governor of the Bank of Japan
Monetary Policy Divergence and Global Financial Stability:
From the Perspective of Demand and Supply of Safe Assets
Speech at a Meeting Hosted by
the International Bankers Association of Japan
Bank of Japan
January 20, 2017
1
I. Introduction
In February 2008, the Financial Times ran an article describing the Bank of Japan as "Fortress
Japan." The article noted that the Bank was functioning as a fortress for Japan, shielding the
Japanese financial system from the turmoil in the global financial markets triggered by problems in
the U.S. subprime mortgage loan market. As you know, the Bank′s objective of maintaining
financial system stability is as important as that of maintaining price stability. In order to fulfill this
responsibility, not only is it important to uphold a microprudential perspective, which aims to
understand the risks faced by individual financial institutions and encourages management
responses thereto, but it also is important to formulate and implement policies from a
macroprudential perspective, which aims to analyze and evaluate risks to the financial system as a
whole.
Following the recent global financial crisis, the financial landscape is radically changing, with U.S.
and European banks shrinking their balance sheets and non-banks, such as investment funds,
increasing their significance. At the same time, in the sphere of monetary policy, we are now
experiencing monetary policy divergence, where interest rates have been kept low for long periods
in both Japan and Europe but the United States is entering a rate increase cycle. In order to
maintain financial system stability in such a changing global financial environment, it is necessary
to ensure that there are no hidden vulnerabilities from both the microprudential and
macroprudential perspectives. Today, I would like to approach this issue through the looking glass
of the demand and supply of safe assets.
II. Three Facts Regarding Global Financial Intermediation by Banks
Before going into my main thesis, let me point out three facts regarding global financial
intermediation by banks.
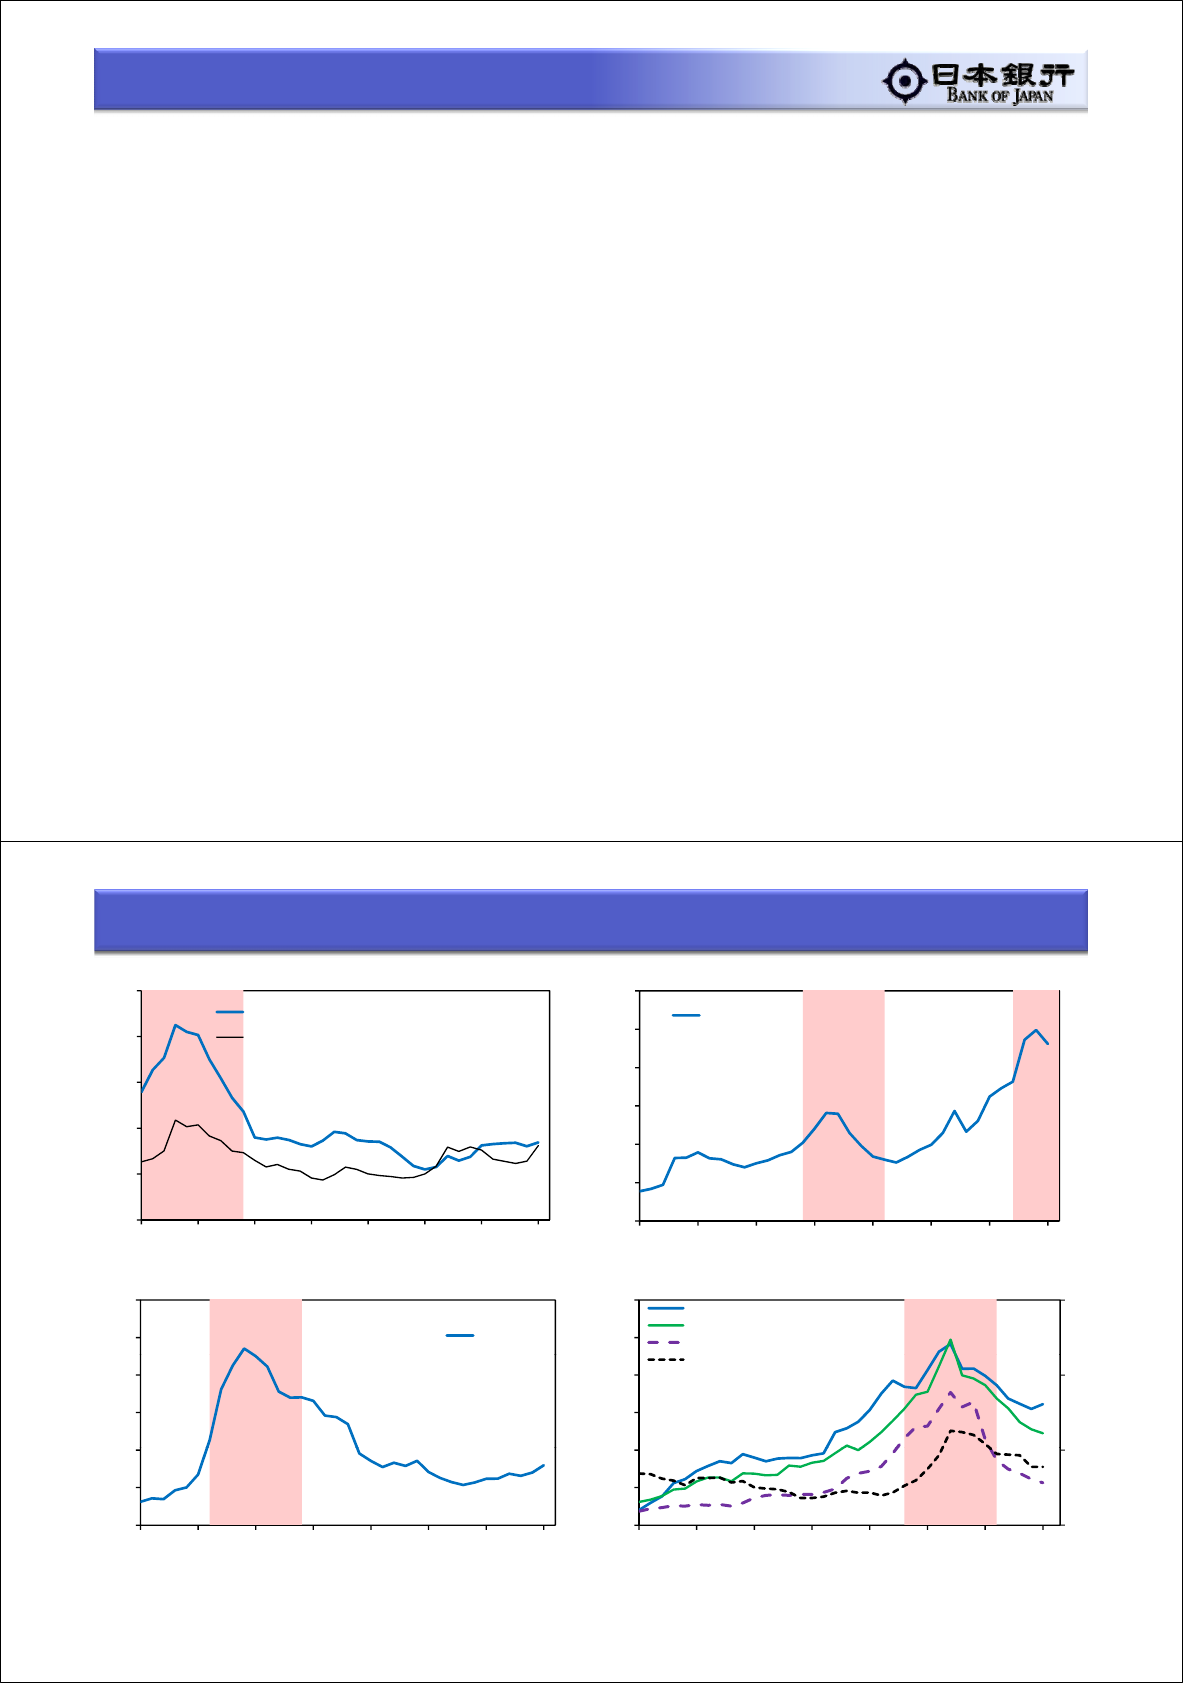
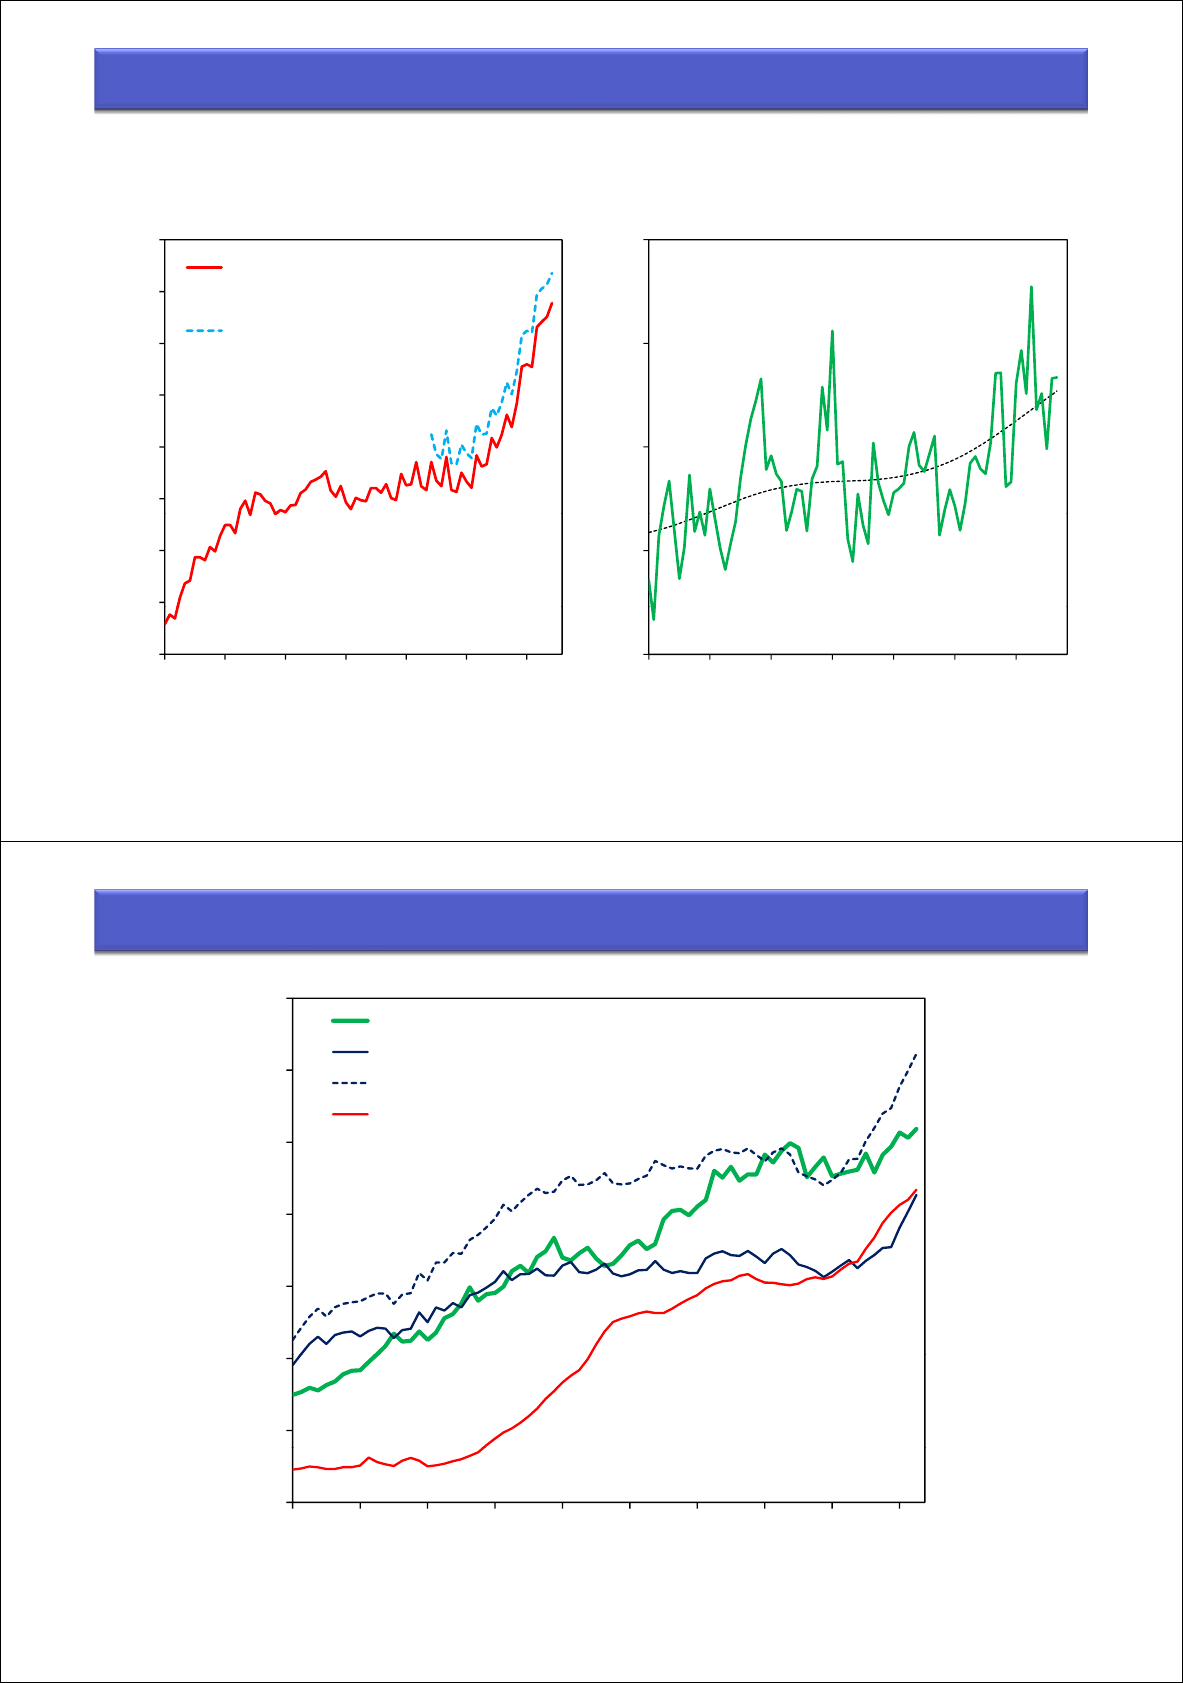
First of all, there is a close connection between fluctuations in banks' cross-border claims and
global economic activity. Looking at banks' cross-border claims by destination, financial cycles
have engulfed one region after another (Chart 1). In the early 1980s, there was the debt crisis
centered on Latin America. Later in the decade, we saw the bubble economy in Japan. In the late
1990s, we had the Asian currency crisis, and the 2000s started with a credit bubble in the United
States and Europe. Most recently, we are worried about debt expansion in emerging Asia. As these
examples show, the rise and fall of economic activity coincides with the rise and fall of banks'

2
cross-border claims.
Secondly, looking at the nationality of banks extending U.S. dollar-denominated foreign claims,
non-U.S. banks overwhelm U.S. banks in terms of market share (Chart 2). Regarding the currency
composition of banks' foreign claims, with the exception of intra-European claims, more of which
are now in euros, a large part of the claims globally is denominated in dollars; yen use is still not
very common.
1
In one respect, this reflects the fact that, with much of global trade and financial
transactions being conducted in dollars, non-U.S. banks are financially supporting cross-border
activities, especially those of national firms.
Lastly, regarding the U.S. dollar funding of non-U.S. banks, the reliance on foreign exchange
swaps (FX swaps) is trending higher (Chart 2). When non-U.S. banks extend credit in dollars, they
have to fund themselves in dollars, and often their on-balance-sheet credit extensions exceed their
funding in dollars. This gap in funding is usually covered by FX swaps, which exchange domestic
currency with dollars. In an FX swap, the parties to the transaction simultaneously conclude the
purchase and sale of two different currencies of equal value on two separate delivery dates in the
opposing direction. For example, a Japanese bank would purchase some dollars against the yen in
the spot market and yen against the same amount of dollars in the forward market, which is in
effect obtaining dollars against yen collateral. The reliance on FX swaps can be approximated by
dividing the dollar funding gap by foreign claims. It can be seen that the ratio is trending higher in
the long term, with instances of sharp dips during periods of market stress.
Putting these facts together, one can conclude that it is important to monitor and analyze carefully
the dollar funding environment of non-U.S. banks as a window onto the stability and potential
vulnerability of the global economy and the international financial system. Looking also at the
foreign claims of non-U.S. banks by nationality, following the recent global financial crisis,
European banks are deleveraging while Japanese banks are enlarging their balance sheets (Chart 3).
This is one reason why I feel there is a need to be vigilant regarding the international financial
intermediation activities of Japanese banks.
III. The Foreign Exchange Swap Market and Monetary Policy Divergence
Let us now focus on the FX swap market, which offers important clues regarding developments in
1
For developments in bank lending by currency, see the following: Avdjiev, S. and E. Takáts, "Monetary
Policy Spillovers and Currency Networks in Cross-border Bank Lending," BIS Working Papers, No.549,
March 2016.
3
global financial markets.
In textbooks on finance, it is said that "covered interest rate parity" will hold. For example, the
effective interest rate when funding U.S. dollars through the FX swap market and the going rate in
the U.S. short-term money market (i.e., LIBOR) should be identical. The basis of this textbook
view is that, if the former is higher than the latter, there is an arbitrage opportunity, which will be
exploited by a bank lending dollars raised in the short-term money market to takers in the FX swap
market, until the opportunity is arbitraged away.
Increases in Dollar Funding Premia in the Foreign Exchange Swap Market
In real life, however, covered interest rate parity does not always hold, contrary to what the
textbooks say. We often see periods where U.S. dollar funding costs through the FX swap market
exceed the funding costs through the U.S. short-term money markets (Chart 4). Of these periods, in
cases like the Japanese financial crisis in the late 1990s, the recent global financial crisis from 2008
onwards, and the euro area debt crisis between 2011 and 2012, the increases in the spreads over
LIBOR, or the dollar funding premia in the FX swap market, seem to have been brought about by
the deterioration in the creditworthiness of banks trying to raise dollar funds. This happens when
(a) banks with shaky credit increasingly rely on funding dollars against home-currency collateral
through the FX swap market as they face growing difficulties in obtaining uncollateralized funding
in the U.S. short-term money market; (b) banks' counterparties, meanwhile, become increasingly
reluctant to lend dollars due to concerns over counterparty credit risk, because those counterparties
will incur replacement costs in case of banks' failure even if there was collateral; and (c) as a result,
tighter conditions prevail in the swap market and dollar funding premia for non-U.S. banks
increase.
Having said this, I should note that the recent increases in the U.S. dollar funding premia in the FX
swap market are occurring without any obvious problems regarding banks' creditworthiness (Chart
4). This should imply that the mechanism for current increases in the dollar funding premia is
different from that of past stress periods. Let me delve a little more into this issue.
Consequences of Monetary Policy Divergence and Regulatory Reforms
With the low interest rate environment persisting in Japan and Europe, the United States initiated
"tapering" and entered a rate increase cycle. Such a divergence in monetary policy outlook
influences the return-seeking behavior of financial institutions and investors. Against the
background of monetary policy divergence between Japan and Europe on the one hand and the

4
United States on the other, the nominal return on U.S. dollar assets is now higher than the return on
yen or euro assets, and financial institutions and investors in Japan and in Europe are increasing
their investments in dollar assets (Chart 5). When banks invest in foreign currency denominated
assets, they generally hedge foreign exchange risk in view of the high capital charges for such risk.
Such FX-hedged investments in dollar assets are economically equivalent to transactions that
purchase dollar assets with dollars obtained through FX swaps with yen or euros as collateral.
Investments in foreign currency bonds by life insurers are less likely to be hedged compared with
banks' investments, but slightly less than 70 percent of investments by Japanese life insurers seem
to be hedged in recent years. The pattern of behavior suggests that recent monetary policy
divergence is encouraging Japanese and European financial institutions to invest in dollar financial
assets and contributing to tighter market conditions in the FX swap market.
Meanwhile, this is not the first time that we have experienced monetary policy divergence between
Japan and the United States. For example, monetary policies also diverged in the middle of the
2000s, with the Bank of Japan continuing its quantitative easing while the Federal Reserve
gradually raised its policy rate, and during this period, Japanese financial institutions increased
their purchases of U.S. Treasury paper and agency securities. The U.S. dollar funding premia,
however, did not visibly increase during this period; i.e., broadly speaking, covered interest rate
parity held (Chart 4). One has to wonder why, in the FX swap market, reactions to monetary policy
divergence between Japan and the United States differ between then and now. Of the several likely
explanations, I would like to point out the effects of regulation on banks that are active in the
global financial market.
2
As I noted earlier, if the U.S. dollar funding rate in the FX swap market is higher than the going
rate in the U.S. short-term money market (i.e., LIBOR), there is an arbitrage opportunity where a
financial institution could definitely profit by swapping dollars obtained in the money market.
Nevertheless, when a financial institution wishes to conduct such a transaction, it would have to
enlarge its balance sheet. Recently introduced financial regulations, such as the leverage ratio,
which have the effect of increasing capital requirements for balance sheet expansion relative to the
more traditional risk-based capital ratio, seem to be dampening arbitrage trading. More specifically,
even when the swap market conditions tighten due to monetary policy divergence between the
Unites States and Japan, U.S. banks and others that used to provide dollars are not prepared to
2
The following paper by Bank of Japan staff analyzes the effects of monetary policy divergence and
regulatory reform on market conditions in the FX swap market from both theoretical and empirical
perspectives: Iida, T., T. Kimura, and N. Sudo, "Regulatory Reforms and the Dollar Funding of Global
Banks: Evidence from the Impact of Monetary Policy Divergence," Bank of Japan Working Paper, 16-E-14,
August 2016.

5
increase the supply of dollar funds because of higher costs for arbitrage trading. This is one of the
reasons why we now see dollar funding premia.
3
Meanwhile, up until the middle of the 2000s,
regulatory constraints were less acute than today, and it was easier for banks to conduct arbitrage
trading, which in turn seemed to result in a more ample supply of dollar funds and little or no
dollar funding premia.
IV. Bank Debt and Financial System Stability
Recent financial regulation reforms are not only affecting the suppliers of U.S. dollars, as we have
just seen, but also the takers of dollars. For the next few minutes, I would like to touch upon U.S.
money market fund (MMF) reform, which affected the dollar funding of global financial
institutions, from the perspective of Japanese banks.
Changes in Debt Composition at Japanese Banks
Even in an environment where arbitrage trading by banks supplying U.S. dollars is constrained, the
dollar funding premia in the FX swap market may decline if non-U.S. financial institutions
(including Japanese banks) can shift their funding from the relatively expensive swap market to the
(uncollateralized) U.S. short-term money market. Considering that there are no serious concerns
regarding the creditworthiness of non-U.S. banks at this juncture, these banks should be able to
increase uncollateralized funding through commercial paper (CP) and certificates of deposit (CDs),
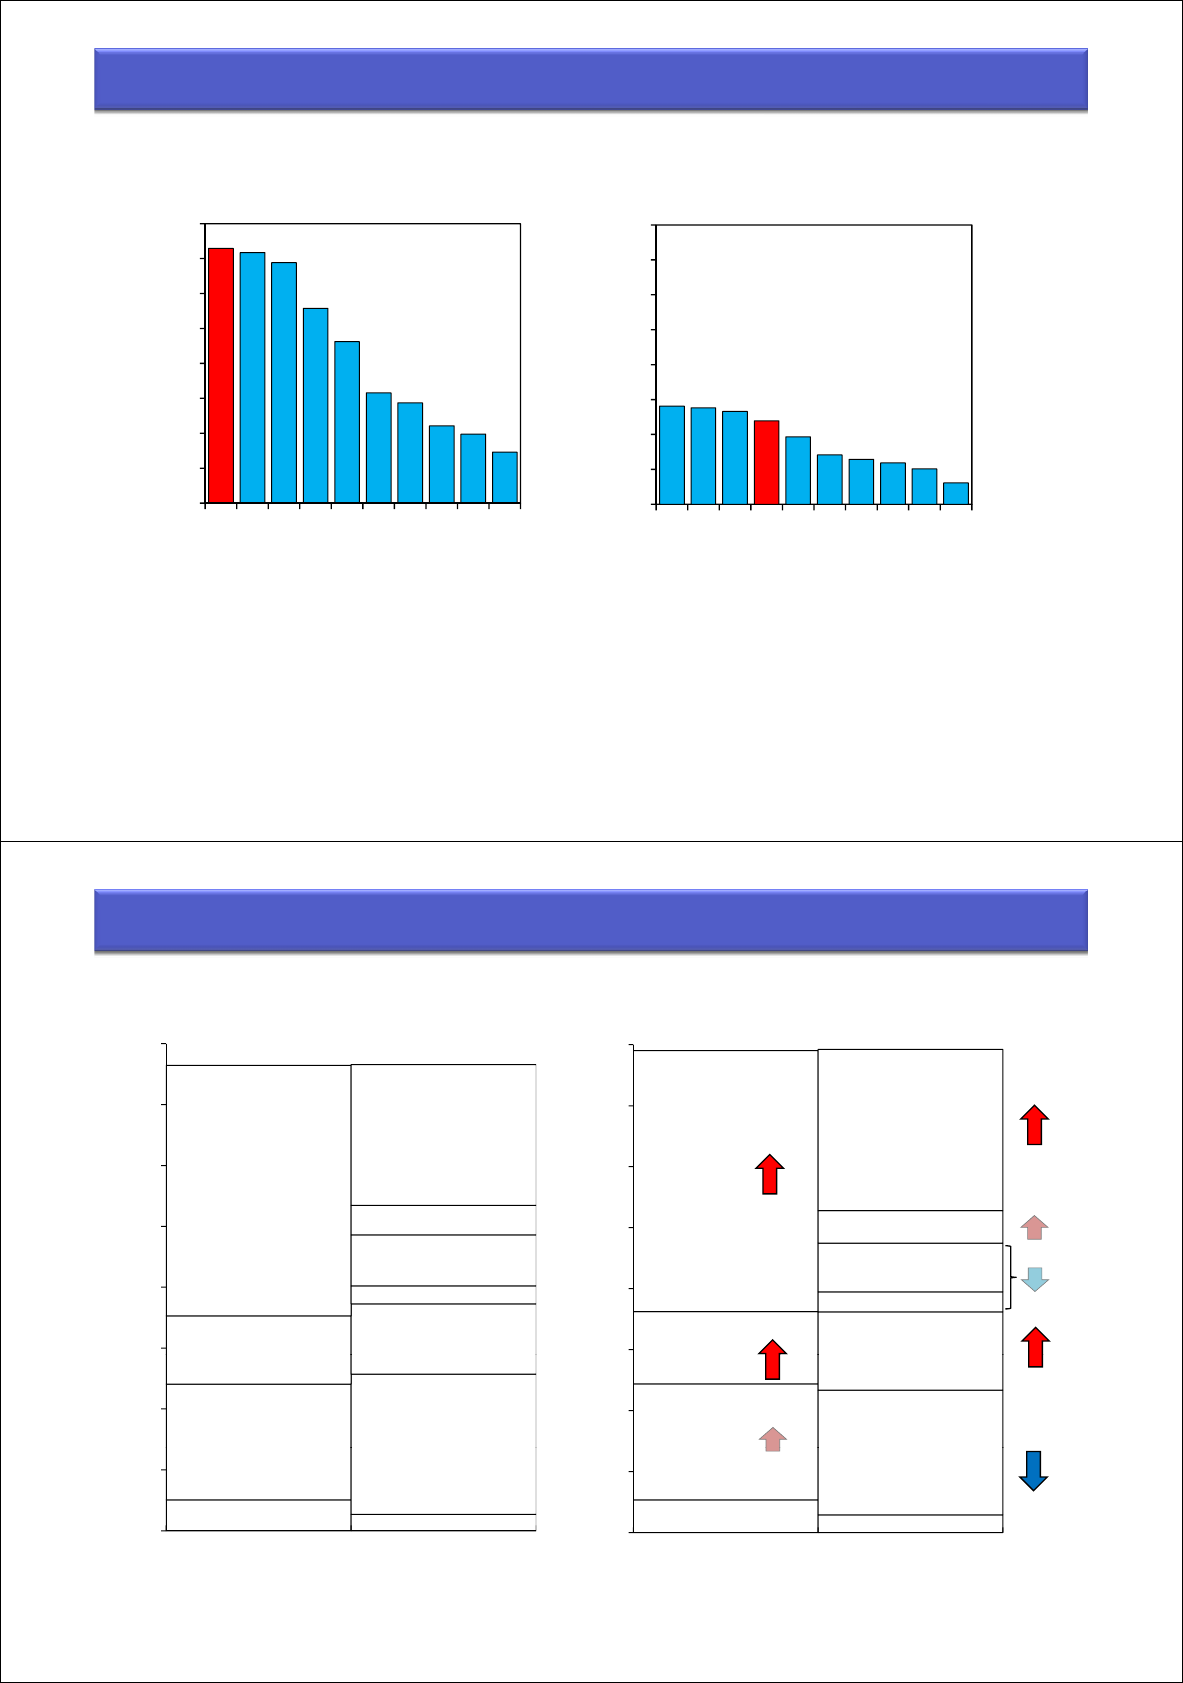
for example. This is not the case, however, because a substantial part of CP and CDs issued by
non-U.S. banks used to be purchased by "prime" MMFs, and their issue had to be compressed
considerably, following the U.S. MMF reform, which came into effect last October (Chart 6). The
reform, introduced under new U.S. SEC rules, requires the adoption of floating net asset value
(NAV) and imposition of redemption fees, and opens the possibility of restricting redemption. This
prompted a huge shift in funds from prime MMFs to "government" MMFs, which invest mostly in
U.S. government securities and are exempt from the new rules. This in turn significantly affected
3
The effects of financial regulation are typically observed in the quarter-end spikes of U.S. dollar funding
costs, as follows: (a) Since around 2013, U.S. banks have deleveraged, due partly to the stricter leverage
ratio in the United States (in which a higher ratio than international rules is required, and is calculated on the
basis of daily averaged assets); (b) non-U.S. banks, European banks in particular, which previously had
increased positions in the U.S. money market, have started to shrink their balance sheets at quarter-ends
since the middle of 2014, partly to hold down the leverage ratio at quarter-ends (in many countries, although
not in the United States, banks report only the leverage ratio at quarter-ends); (c) at quarter-ends, U.S. banks
increase market-making and arbitrage-trading activities in the money market at higher rates, inclusive of
higher costs posed by regulation.

6
the dollar funding of global banks.
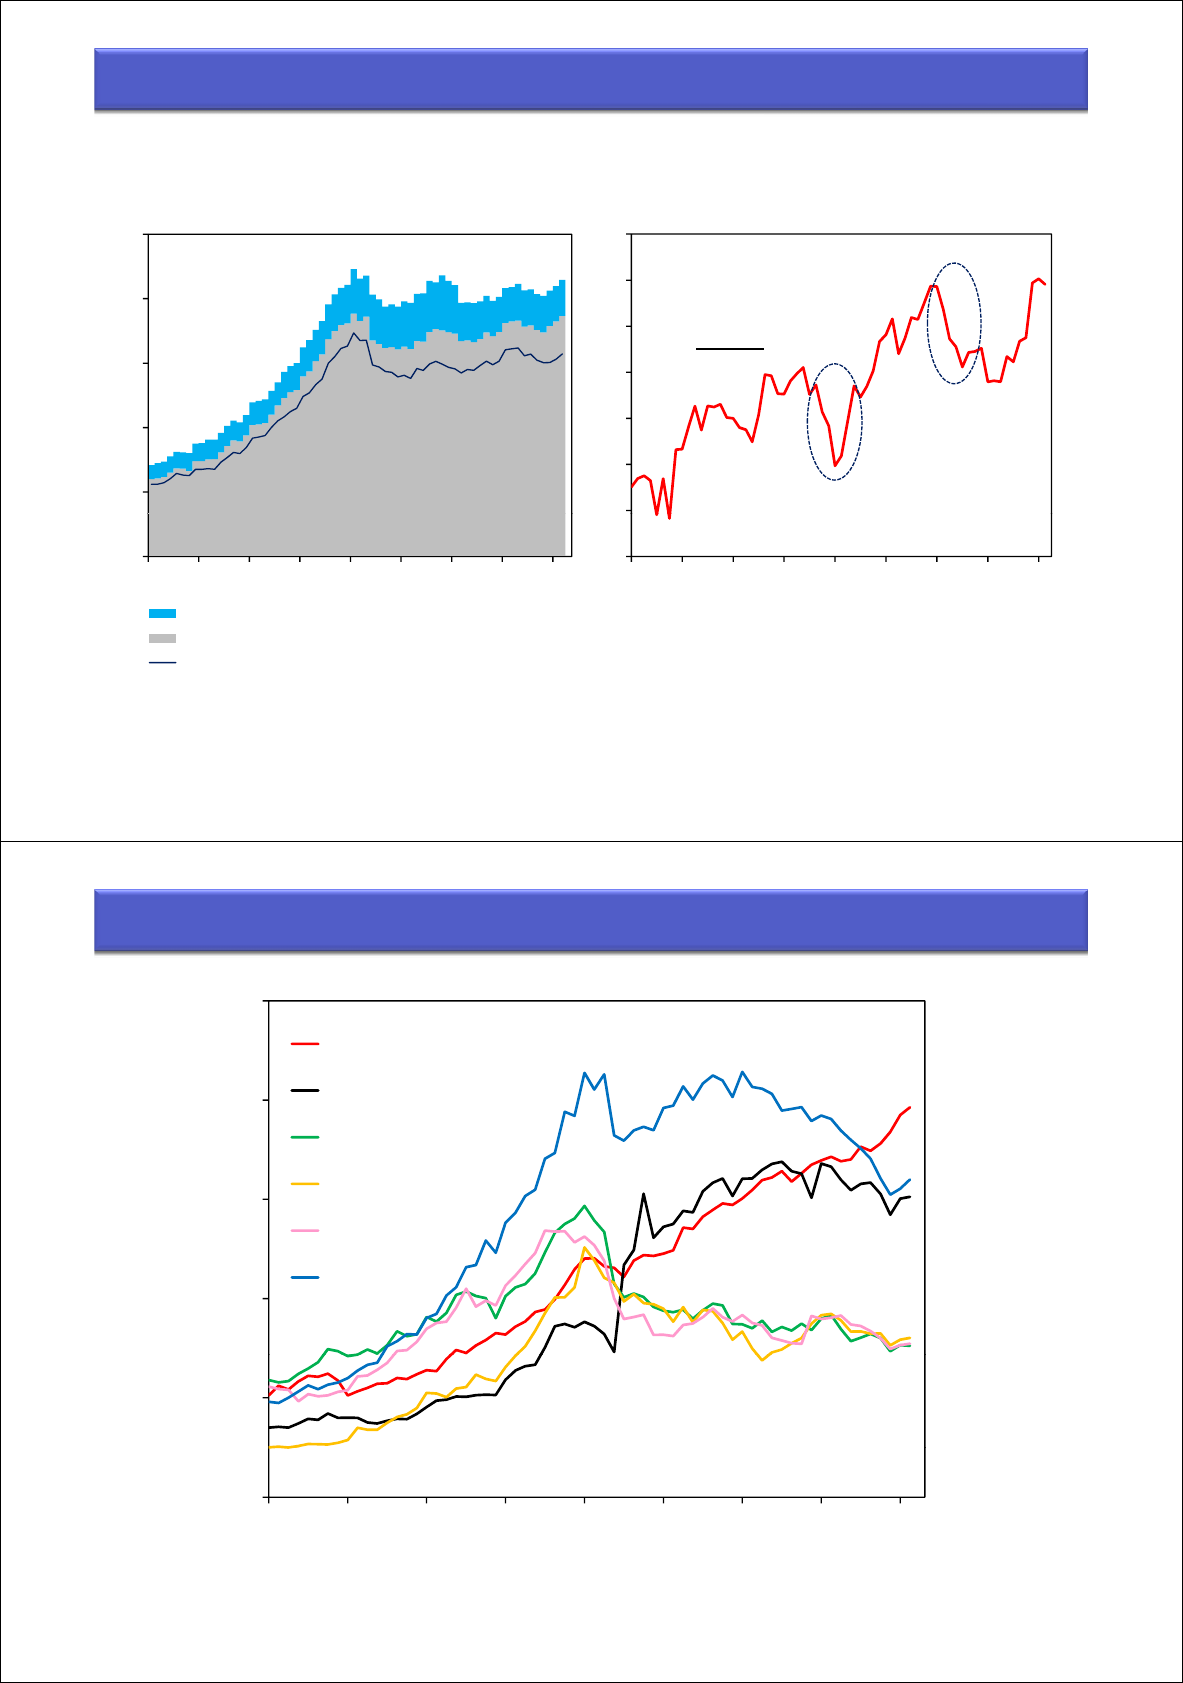
The effects of the MMF reform were not small, but Japanese banks were able to cope, not by
compressing their assets, but by changing the composition of their funding (Chart 7). Looking at
the foreign currency denominated balance sheets of major Japanese banks, for approximately six
months preceding last October, they actually increased their assets, including an increase of 33
billion U.S. dollars in overseas loans.
4
On the liabilities side of the balance sheet, there was a
decrease of 62 billion dollars in CP and CD issues, which was more than compensated for by an
increase of 67 billion dollars in client-related deposits, reflecting banks' efforts to build up stable
funding sources, and an increase of 26 billion dollars in repo funding. These major banks were thus
able to avoid increasing their reliance on relatively expensive funding through the FX swap market.
Bank Debt and Safe Assets
One interesting question here is why major Japanese banks were able to pull off such a significant
change in their balance sheets in such short order. Let me reflect on this from the viewpoint of
balancing supply and demand of U.S. dollar-denominated financial assets at the macro level. The
key phrase is "safe assets."
Financial intermediaries perform an important function of investing in risky assets while issuing
safe debt. Debt issued by private financial institutions, along with securities issued by governments,
constitutes safe assets that are provided to the economy. A prime example of such a function is the
bank deposit. Through the results of recent research on safe assets, we are now aware of two
empirical regularities over long periods.
5
The first point is that the share of safe assets in the whole
universe of financial assets including equities is more or less constant. In other words, the demand
for safe debt has been relatively constant as a fraction of the total assets in the economy. The
second point is that safe debt issued by the government and safe debt issued by private financial
intermediaries are substitutes. These two regularities indicate that fluctuations in the stock or price
of government debt crowd in or crowd out safe debt issued by financial intermediaries so that the
share of safe assets as a whole may be kept constant.
When we attempt to assess the market conditions regarding safe assets in the U.S. financial system,
the rise and fall of the "yield spread," which is the difference between the stock yield and long-term
4
Given that foreign currency-denominated balance sheets of Japanese banks are predominantly based on
U.S. dollars, Chart 7 essentially shows the features of U.S. dollar-denominated balance sheets.
5
See Gorton, G., S. Lewellen, and A. Metrick, 2012 "The Safe-Asset Share." American Economic Review,
102(3): 101-06.

7
government bond yield, is quite illuminating (Chart 8). From the early 1990s to the early 2000s, the
stock yield and the Treasury yield moved almost in tandem and the yield spread remained mostly
around zero; after that, however, we find persistent and very large spreads. The size of the spread is
now beyond a level that can be explained by expected growth in corporate earnings or equity risk
premium.
6
Such persistently wide yield spreads indicate that the demand-supply balance of safe
assets has been much tighter than that of risky assets. An additional demand for safe debt issued by
the U.S. government has probably resulted from the need for emerging market authorities to invest
their foreign exchange reserves or from the need to comply with regulations that require financial
institutions to hold certain amounts of safe assets. With such increase in demand for U.S.
Treasuries, the price of Treasuries will rise (and their yields will fall), and following the recent
global financial crisis, the demand for safe assets from U.S. investors was fulfilled by debt
instruments substitutable for U.S. Treasuries and issued by financial institutions. In particular,
dollar-denominated highly rated paper issued by non-U.S. banks, mainly from Canada and
Australia, was preferred by U.S. investors.
7
In this environment, the U.S. MMF reform, which I mentioned a few minutes ago, had the effect of
further increasing demand for U.S. Treasuries.
8
As funds shifted from prime MMFs, which invest
in CP and CDs, to government MMFs, which invest in U.S. government securities, the yield on
U.S. government securities was pushed down (Chart 9). When Treasury Bill yields fall well below
LIBOR, which is the benchmark yield for debt instruments issued by private banks, the demand for
safe debt issued by banks will increase because substitutable Treasury Bills become relatively
expensive. That is, while prime MMFs have become less attractive as safe assets, an increase in
demand for U.S. government debt without a concomitant increase in supply could also lead to an
increase in safe debt issued by financial intermediaries so that the safe asset share may be kept
constant. Such overall rebalancing of the financial asset portfolio in the U.S. dollar financial
market enabled major Japanese banks to adjust the liability side of their balance sheets and focus
on increasing client-related deposits.
6
See Ichiue, H., T. Kimura, T. Nakamura, and H. Hasebe, "The Supply and Demand of Safe Assets and the
Scarcity Premium for Government Bonds," Bank of Japan Review, 12-J-1, January 2012 (in Japanese only).
7
See Bertaut, C., A. Tabova, and V. Wong, "The Replacement of Safe Assets: Evidence from the U.S. Bond
Portfolio," Board of Governors of the Federal Reserve System, International Finance Discussion Papers,
No.1123, October 2014.
8
The following paper reviews the shift of funds from prime MMFs to government MMFs from the
perspective of the supply and demand for safe assets: U.S. Securities and Exchange Commission, "Demand
and Supply of Safe Assets in the Economy," memo, March 2014.

8
Safe Assets and Financial Vulnerability
At this point, you might wonder why I am deploying as arcane a concept as safe assets in order to
explain the changes in the debt composition of Japanese banks. I have done so because the supply
and demand of safe assets is an important reference point for monitoring and assessing the stability
and potential vulnerabilities of the financial system.
Let us look back at the mid-2000s. At that time, as the yield spread suggests, the demand-supply
balance of U.S. dollar safe assets tightened. In response, U.S. and European investors searching for
yields bought large amounts of highly rated asset-backed securities issued by private financial
intermediaries with the perception that these financial instruments were safe but gave yields that
were only a little better than U.S. Treasuries. In turn, the issue of asset-backed securities, in
particular mortgage-backed securities, rose to meet increased demand from investors. We know
that not everybody lived happily thereafter: when problems surfaced in the U.S. subprime
mortgage sector followed by the global financial crisis, the asset-backed securities lost their status
as safe assets.
9
Furthermore, the increasingly noticeable outflow of wholesale deposits from
European banks, which aggressively invested in securitized instruments, could be explained at least
in part by doubts over the appropriateness of regarding certain bank deposits as safe assets. The
same mechanism seems to have been at work when U.S. MMFs reduced their exposure to CP
issued by European banks during the European debt crisis beginning in 2011.
10
To sum up, debt instruments issued by private financial intermediaries may be regarded as safe
assets substitutable for government securities in tranquil times, but it should be borne in mind that,
when the going gets rough, those instruments could lose their status as safe assets. With this in
mind, the Bank of Japan conducted stress tests on foreign currency liquidity risk at Japanese banks
and published the results thereof in the Financial System Report (most recently in October 2016).
According to those tests, even when the availability of foreign currency funding is impaired, in
addition to elevated funding premia for foreign currencies in times of stress, Japanese banks would
withstand the stress and remain viable. The Bank is also of the view that Japanese banks would be
able to maintain sufficient levels of capital, which is a sine qua non of their debt instruments being
9
In addition to securitized instruments backed by residential mortgages (RMBSs), the period saw
substantial increases in the issuance of collateralized loan obligations (CLOs) backed by loans financing
leveraged buyouts (LBOs), and commercial mortgage-backed securities (CMBSs). In addition, it became
increasingly common to see "re-securitized" instruments called asset-backed securities collateralized debt
obligations (ABS CDOs), which were securitized instruments backed by (primary) securitized products such
as RMBSs. The price of these instruments, even of highly rated ones, fell significantly after the second half
of 2007.
10
See Ivashina, V., D. S. Scharfstein, and J. C. Stein, 2015 "Dollar Funding and the Lending Behaviour of
Global Banks," Quarterly Journal of Economics, vol. 130, pp. 1241-1281.

9
regarded as safe assets, even under a tail-event scenario depicting the recent global financial crisis.
Of course, the Bank encourages individual Japanese banks not to be complacent and pursue
enhanced management of liquidity risk, under the assumption that their issued debt is more or less
"runnable."
11
V. Increasing Importance of Non-Banks in the International Financial System
Up until now, I have focused on global financial intermediation by banks, but after the global
financial crisis, we cannot ignore the increasing importance of non-banks in the international
financial system.
12
For the next few minutes, let me focus on this development and the effects on
and implications for Japan through the looking glass of the FX swap market.
Changes in the Market Structure of Foreign Exchange Swaps
As described earlier, major Japanese banks, which can tap a relatively wide range of funding
markets, are currently refraining from heavily using the FX swap market for their U.S. dollar
funding (Chart 7). Having said that, statistics for Japanese financial institutions as a whole indicate
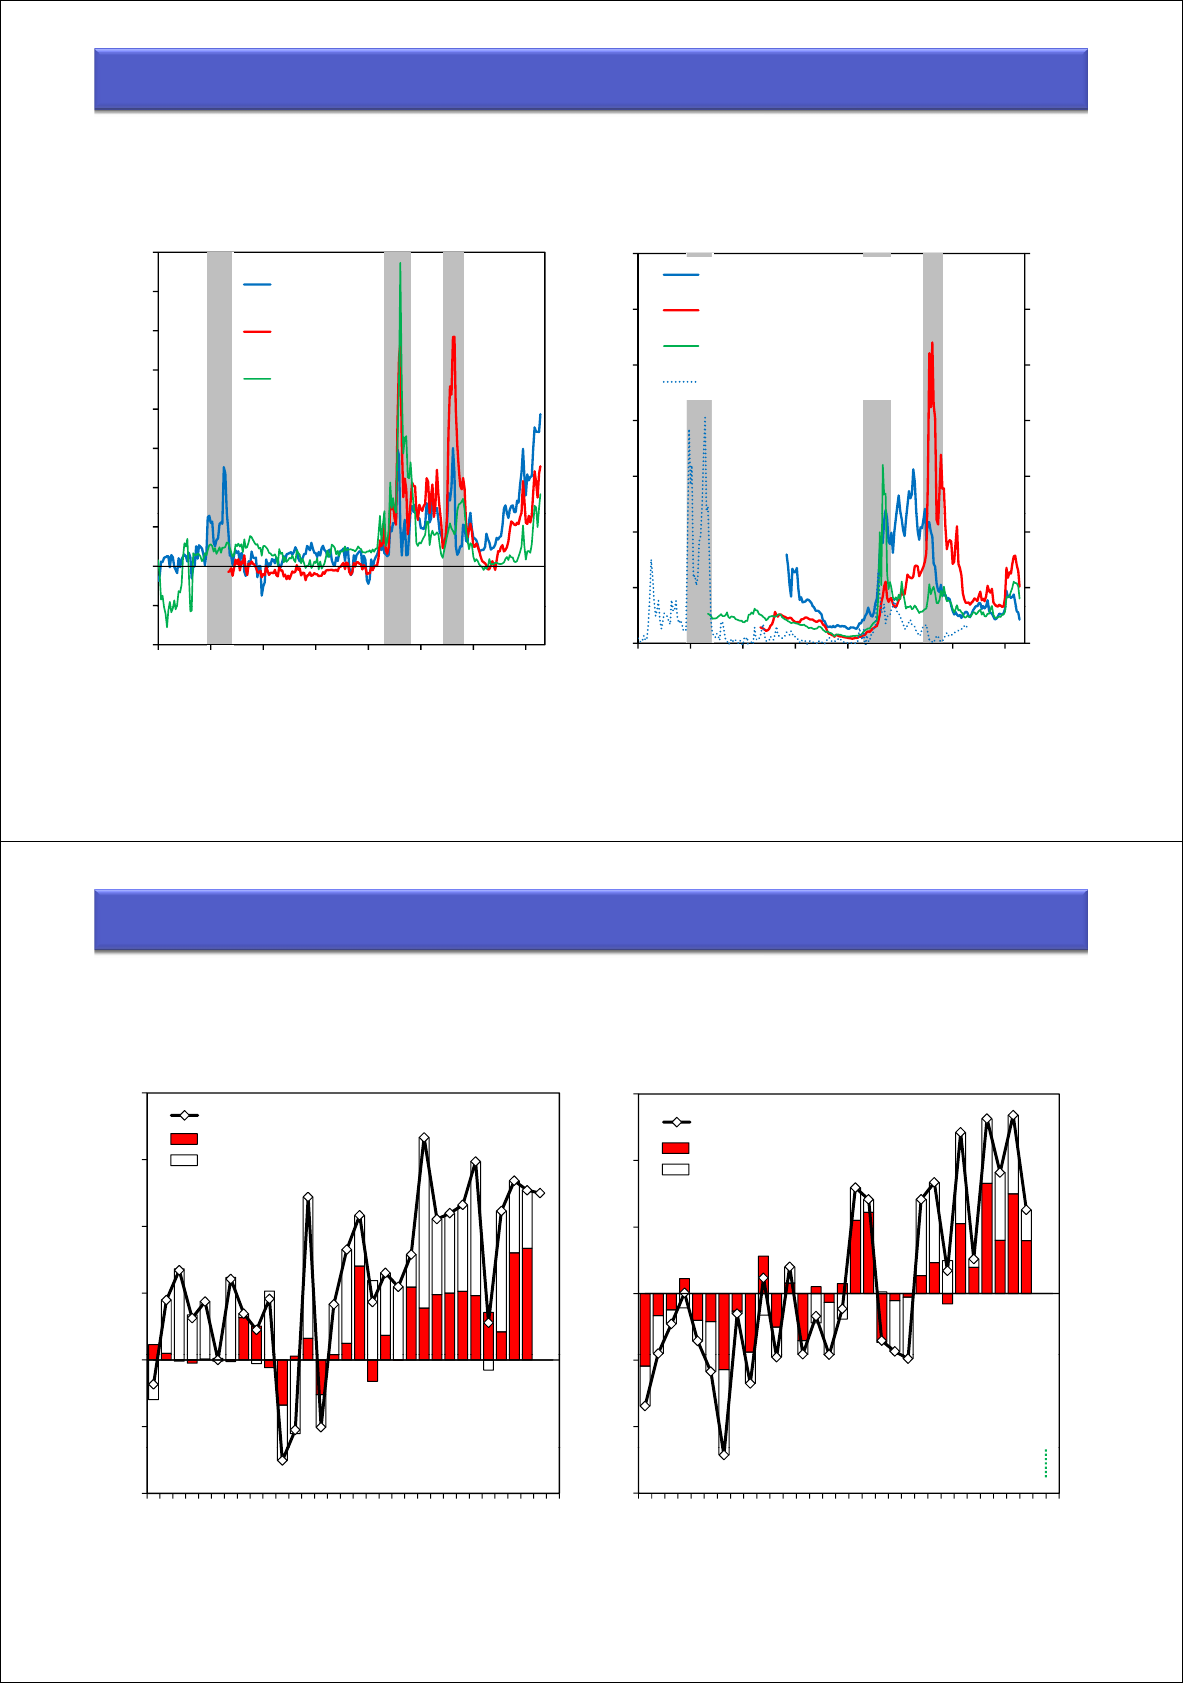
that there are large funding increases in that market (Chart 10). This reflects the increasing demand
for hedging dollar exposures from financial institutions that have limited funding options compared
with major banks. Looking at the statistics on outstanding external securities investments by
financial institutions, non-banks -- such as insurers, pension funds, and investment trusts -- are
increasing their investments as fast as banks (Chart 11). While pension funds are not expected to
hedge their exposures, life insurers seem to be hedging slightly less than 70 percent of their foreign
currency exposures in recent years. Investment trusts also seem to hedge their foreign exchange
risk in response to requests from investors, such as banks or households.
Against this increased hedging demand, as U.S. banks refrain from engaging in arbitrage trading in
response to regulatory requirements, we see increasing relative importance of non-banks -- such as
sovereign wealth funds (SWFs), reserve managers of emerging market economies, and private
investment funds -- as suppliers of U.S. dollars in the FX swap market. The existence of dollar
funding premia in the swap market signifies an opportunity for suppliers of U.S. dollars to obtain
yen funding at a very low rate. As a result, overseas non-banks that have dollars to spare can invest
11
As to runnable debt, see Bao, J., J. David, and S. Han, "The Runnables," FEDS Notes, September 3,
2015.
12
For example, see Financial Stability Board, "Global Shadow Banking Monitoring Report," 2015.

10
in Japanese government securities (JGSs), even if the nominal yields on such paper are zero or
negative, and secure yields as good as or higher than U.S. government securities without taking on
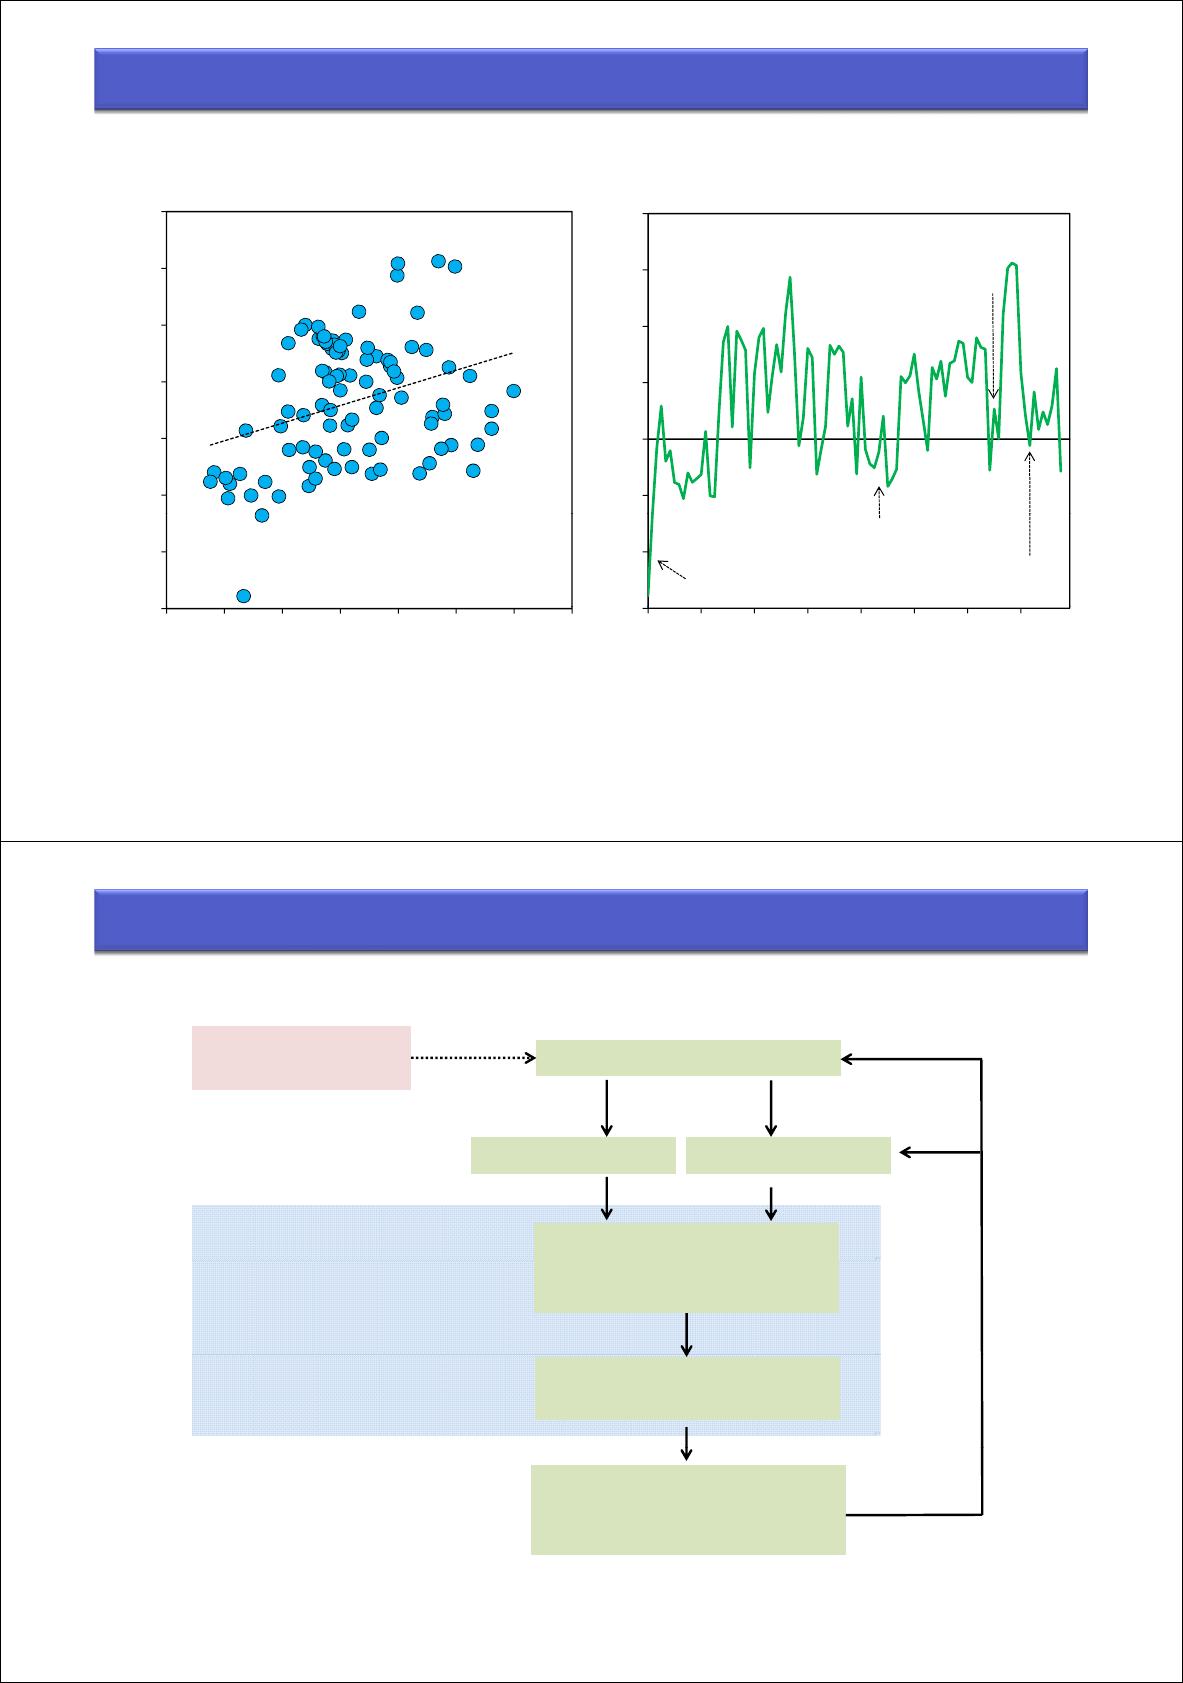
foreign exchange risk. The fact that transaction volumes of FX swaps are positively correlated with
inward bond investments underscores the investment patterns of overseas non-banks regarding
FX-hedged investments in JGSs (Chart 12). In an environment where the demand-supply balance
of dollar safe assets is very tight, FX-hedged investments in JGSs may be viewed by investors as
safe assets substitutable for U.S. government securities.
The Swap Market and the Amplification of Procyclicality in Global Liquidity
One note of caution here is that FX-hedged Japanese government paper is not always a stable
substitute for U.S. government paper just as debt instruments issued by banks. In other words,
overseas non-banks cannot be regarded as stable sources of U.S. dollar funding. In fact, Japanese
inward bond investments statistics tend to decline sharply in times of market stress (Chart 12). That
means that, in times of stress, overseas non-banks have a tendency to reduce their FX-hedged
investments in JGSs and hence their dollar supply in the FX swap market. For example, when
currencies of emerging market economies started to slide after the Chinese stock market crashed in
the middle of 2015, market participants talked of emerging market reserve managers, aware of the
potential need to defend their currencies, refraining from offering dollars in the fixed-term FX
swap market and shifting their dollars into more liquid markets such as U.S. Treasury Bills.
13
Similar observations were heard when currencies of emerging market economies weakened
following the U.S. presidential election in November 2016. In short, while FX-hedged investments
in JGSs are regarded as substitutes for U.S. government securities in tranquil times, this could
easily break down in times of market stress.
Turning to SWFs of oil-producing economies, one often hears market talk that, when oil prices fall
and the country's fiscal position deteriorates, those SWFs tend to reduce their allocation of U.S.
dollars to the FX swap market, reflecting the reduced availability of investable funds. Staff analysis
at the Bank of Japan confirms that there is a positive correlation between fluctuations in oil prices
and transaction volumes in the FX swap market.
14
Such patterns, shown by overseas non-banks, of supplying dollar funds in the FX swap market
could exacerbate the procyclicality of international financial intermediation (Chart 13). For
13
For example, see Arai, F., Y. Makabe, Y. Okawara, and T. Nagano, "Recent Trends in Cross-currency
Basis," Bank of Japan Review, 16-E-7, September 2016.
14
See Iida et al. (2016) in footnote 2.

11
example, when emerging market economies are growing strongly, commodity demand would rise,
leading to increases in commodity prices including oil. Emerging market currencies would also
appreciate. In such an environment, increases in the assets of SWFs of oil-producing economies
would see those SWFs allocating some of the increases for investment in the FX swap market. At
emerging market economies, authorities would intervene to prevent the appreciation of their
currencies, and at least a part of U.S. dollars purchased in those interventions would be invested in
the FX swap market. Consequently, dollar funding premia in the FX swap market would decline
and encourage non-U.S. financial institutions to extend dollar credit. If this results in capital
inflows and increases in investment in emerging market economies, growth in those economies
would accelerate. On the other hand, if growth in emerging market economies were to decline for
one reason or another, the currencies of those economies would depreciate and commodity prices
would decline, reflecting weaker demand. Subsequently, the mechanism I have just described
would go into reverse gear. As SWFs of oil-producing economies and reserve managers of
emerging market economies restrain the supply of dollars in the FX swap market, dollar funding
premia would rise, non-U.S. financial institutions would cut back on their lending and securities
investments in emerging market economies, and growth of emerging market economies
consequently would be further adversely affected. An interest rate increase in the United States
could amplify such procyclicality in intermediation if such an action brings about rapid and
large-scale capital outflow from emerging market economies.
Interdependencies between Non-Banks and Banks
As I noted at the beginning today, fluctuations in external credit extended by non-U.S. banks
significantly affected the global economy (Charts 1 and 2). It also is a fact that, in the past,
non-banks such as SWFs and emerging market reserve managers had influenced the U.S. dollar
funding and credit activities of non-US banks.
15
For example, dollar deposits at European banks
were among the preferred destinations of investments by emerging market authorities, who have
increased their foreign exchange reserves in the 2000s, in view of the lessons learned during their
currency crises of the 1990s. Dollar deposits of European banks also enjoyed inflows of SWF
15
The Latin American Debt Crisis of the early 1980s was heavily influenced by international financial
intermediation stemming from abundant oil revenues. More specifically, following the two oil crises, a large
amount of oil revenues flowed into the oil-producing economies, and the money was lent to Latin American
economies via banks in the developed economies. Meanwhile, during the Japanese bubble economy of the
late 1980s, Japanese banks increased offshore funding and significantly increased lending through "impact
loans," which were outside the lending volume restrictions imposed by the Bank of Japan through "window
guidance." European banks, which were the main lenders to Japanese banks in the offshore market, were
sourcing a substantial part of their funding from the Middle East. As such, the impact loans were indirectly
supported by oil revenues.

12
money, which benefited from high oil prices until the summer of 2008. Subsequently, with the
global financial crisis and euro-area debt crisis, such deposits were withdrawn and contributed to
the deleveraging involving dollar assets at European banks.
16
The interdependencies between non-banks and banks have a history of procyclically amplifying
international financial intermediation in many forms. The developments in the FX swap market
represent only one manifestation of the interdependencies between overseas non-banks and
Japanese financial institutions. In order to maintain the stability of the international financial
system, it is important for the relevant authorities to always monitor and understand such
interdependencies.
VI. Final Words
Let me summarize my key points.
Non-U.S. financial institutions play a very important role in international financial intermediation,
which is dominantly U.S. dollar based. Monetary policy divergence between the U.S. and other
economies is likely to result in an increase of external claims of non-U.S. financial institutions and
hence they would be pressed for increased dollar funding. Given that there seems to be excess
demand for U.S. government securities, which are safe assets, the demand for debt instruments
issued by private financial intermediaries, which are substitutes of U.S. government securities,
would increase in tranquil times. Consequently, non-U.S. financial institutions would be able to
increase their dollar funding without difficulty. Meanwhile, from the viewpoint of investors
holding dollar funds, FX-hedged investments in non-U.S. sovereign securities arising from FX
swap transactions are substitutes of U.S. government securities. Here again, non-U.S. financial
institutions would be able to increase dollar funding through the FX swap market, although costs
could increase. Historically, however, there is evidence that the substitutability of debt instruments
issued by private financial intermediaries and FX-hedged investments in non-U.S. sovereign
securities might be compromised in times of stress, and this could negatively impact dollar funding
liquidity at non-U.S. financial institutions. Considering that the dollar funding of non-U.S.
financial institutions could be influenced by the investment behavior of non-banks -- including
SWFs, emerging market reserve managers, and investment funds -- we need to be mindful of the
16
For more detail, see Nakaso, H., "Financial Crises and Central Banks′ Lender of Last Resort Function,"
Remarks at the Executive Forum Hosted by the World Bank "Impact of the financial crises on central bank
functions," April 2013.
13
possibility of the behavior of banks and non-banks echoing each other under monetary policy
divergence and thus amplifying fluctuations in international financial intermediation and real
economic activity.
In addition, it is important to closely monitor risk-taking activities of non-U.S. financial institutions.
Under monetary policy divergence, U.S. dollar funding premia in the FX swap market could easily
spike higher. As such, the Bank of Japan would continue to monitor the activities of Japanese
banks so as to ensure that they would not, in response to increased funding costs for their dollar
investments, embark on excessive risk taking in terms of both credit risk and liquidity risk.
As much as monetary policy divergence itself is a product of central bank policy actions in each
economy aiming at price stability, it also is the responsibility of central banks to ensure that such
monetary policy actions would not destabilize the international financial system through the
behaviors of financial institutions. Today, the Japanese financial system remains stable. The Bank
of Japan will continue to encourage financial institutions to maintain a strong financial footing,
which prevents risks from materializing, and also strengthen its monitoring and analysis of
developments in the international financial system. The Bank, in coordination with other central
banks, will also enhance schemes to provide foreign currency liquidity to act as a backstop in case
of financial crises. I would like to conclude my observations today by promising you that,
consistent with what is in the Bank of Japan Act, the Bank will continue to discharge its
responsibilities as "Fortress Japan" and maintain financial intermediation functions in Japan.
Thank you very much for your attention.
MonetaryPolicyDiver
g
enceandGlobalFinancialStability:
g
FromthePerspectiveofDemandandSupplyofSafeAssets
January20,2017
Speech at a Meeting Hosted by
Speech
at
a
Meeting
Hosted
by
theInternationalBankersAssociationofJapan
HiroshiNakaso
DeputyGovernoroftheBankofJapan
Cross‐BorderClaimsofBanksintheWorldbyResidenceofCounterparty
Chart1
ratio to
world GDP %
ratio to
world GDP %
2.0
2.5
toDevelopingLatinAmericaandCaribbean
toDevelopingAfricaandMiddleEast
ratio
to
world
GDP
,
%
2.0
2.5
3.0
toDevelopingAsiaandPacific
ratio
to
world
GDP
,
%
1.0
1.5
1.0
1.5
0.0
0.5
1980 85 90 95 2000 05 10 15
CY
0.0
0.5
1980 85 90 95 2000 05 10 15
CY
3
10
12
toUnitedStates(lhs)
toUnitedKingdom(lhs)
toIreland,Italy,Greece,Portugal,Spain(lhs)
l (h)
ratiotoworldGDP,% ratiotoworldGDP,%
5
6
toJapan
ratiotoworldGDP,%
1
2
4
6
8
toDeve
l
opingEurope
(
r
h
s
)
2
3
4
0
1
0
2
4
1980
85
90
95
2000
05
10
15
0
1
2
1980
85
90
95
2000
05
10
15
Notes:1. Latest data as at end-December 2015.
2. Shaded areas indicate major credit cycle phases.
Sources: BIS; IMF.
1980
85
90
95
2000
05
10
15
CY
1980
85
90
95
2000
05
10
15
CY
USD‐DenominatedForeignPositionsofBanks
Chart2
U.S.andnon‐U.S.banks'
USD‐denominatedforeignclaims
Non‐U.S.banks'
cross‐currencyfundingratio
20
USDtrillions
18
%
16
20
14
16
18
A
B
12
10
12
14
Eurozonesovereign
debt crisis
A
‐
B
A
4
8
6
8
10
Global financialcrisis
debt
crisis
0
2000 02 04 06 08 10 12 14 16
CY
4
6
2000 02 04 06 08 10 12 14 16
CY
U.S.banks’USD‐denominatedforeignclaims
Non‐U.S.banks’USD‐denominatedforeignclaims(A)
Non‐U.S.banks’USD‐denominatedforeignliabilities(B)
Notes: 1. Latest data as at en
d
-June 2016.
2. "Non-U.S. banks' USD-denominated foreign claims" and "Non-U.S. banks' USD-denominated foreign liabilities" are calculated as USD-denominated foreign claims and
liabilities of all reporting countries after excluding those of U.S. banks, respectively.
3. "Non-U.S. banks' cross-currency funding ratio" is calculated as "Non-U.S. banks' USD-denominated foreign claims" less "Non-U.S. banks' USD-denominated foreign
liabilities," divided by "Non-U.S. banks' USD-denominated foreign claims."
Source: BIS.
ForeignClaimsbyBankNationality
Chart3
USD
t illi
5
Japanesebanks
USD
t
r
illi
ons
4
U.S.banks
Germanbanks
3
Frenchbanks
Swissbanks
2
U.K.banks
1
0
2000 02 04 06 08 10 12 14 16
CY
Notes: 1. Latest data as at end-June 2016.
2. Euro area claims for German and French banks are excluded.
Source: BIS.
CY
FXSwapImpliedUSDFundingRatesandBanks'Creditworthiness
Chart4
FXswap impliedUSDfundingrates
(DeviationfromUSDLIBOR)
Non‐U.S.banks'defaultprobability
(ExpectedDefault Frequency)
%
%
%
1.2
1.4
6
7
Japanesebanks(lhs)
Euroareabanks(lhs)
%
%
12
1.4
1.6
USD/JPY
EUR/USD
%
08
1.0
4
5
U.K.banks(lhs)
Japanpremium(rhs)
0.8
1.0
1
.
2
EUR/USD
GBP/USD
0.6
0
.
8
3
4
0.4
0.6
0.2
0.4
1
2
‐
02
0.0
0.2
0.00
1995 98 2001 04 07 10 13 16
CY
‐0.4
0
.
2
1995 98 2001 04 07 10 13 16
CY
Notes: 1. Latest data as at November 2016.
2. The shaded areas correspond to Japan's financial crisis (November 1997 through March 1999), the global financial crisis (December 2007 through June 2009), and the Eurozone
sovereign debt crisis (May 2011 through June 2012).
3. Non-U.S. banks' default probability is the average of the EDF (Expected Default Frequency) of G-SIBs that are headquartered in each jurisdiction. "Japan Premium" is calculated
as 3-month USD TIBOR less 3-month USD LIBOR.
Sources: Bloomberg; Moody's; BOJ.
OutwardPortfolioInvestment(EuroAreaandJapan)
Chart5
Euroarea Japan
ll
10
15
Outwardportfolioinvestment
JPY tri
ll
ions
toUnitedStates
to other countries
150
200
Outwardportfolioinvestment
EURbillions
toUnitedStates
toothercountries
5
to
other
countries
100
5
0
FRB
rate hike
▲▲
0
50
‐10
‐
5
FRB
tapering
▲
QQEwithYCC
‐50
0
FRB
tapering
FRB
rate hike
▲▲▲
‐15
2009 10 11 12 13 14 15 16
BOJmonetary easing
▼
▼▼
CY
▼▼
‐100
2009 10 11 12 13 14 15 16
▼
▼▼
▼
▼
▼
▼
ECB monetaryeasing
CY
Notes: 1. Latest data for euro area as at end-September 2016, data for Japan as at end-June 2016.
2. In each chart, ▲/▼ indicates the timing and direction of monetary policy changes since 2013.
Sources: ECB; Ministry of Finance; BOJ.
PrimeMMFHoldingsofBankRelatedSecurities
Chart6
Asatend‐June2016
Asatend‐October2016
160
USDbillions
160
USDbillions
100
120
140
100
120
140
60
80
100
60
80
100
0
20
40
0
20
40
Japan
n
itedStates
Canada
France
Sweden
Australia
e
dKingdom
Germany
N
etherlands
S
witzerland
k
nationality)
Canada
n
itedStates
France
Japan
Sweden
Australia
e
dKingdom
Germany
N
etherlands
S
witzerland
k n ationality)
U
n
Unit
e
N
S
(Ban
k
U
n
Unit
e
N
S
(Ban
Note: Prime MMF holdings of bank related securities are aggregated by country based on the location of banks' global headquarters. "Australia" includes New Zealand.
Source: SEC.
JapaneseMajorBanks'ForeignCurrencyDenominatedBalanceSheet
Chart7
Asatend‐March2016
Asatend‐October2016
1,600
USDbillions
1,600
USDbillions
463
1,200
1,400
Loans
Client‐relateddeposits
530
1200
1,400
Loans
Client‐relateddeposits
+67
823
168
97
1,000
1,200
Loans
Corporate bonds,etc.
Medium‐ to long‐term
856
106
1,000
1
,
200
Corporate bonds,etc.
Mdi
t
l
t
+9
+33
224
231
59
168
600
800
Interbank investments
FXandcurrencyswaps
Repos
Short‐termFXandcurrencyswaps
237
257
66
160
600
800
Interbankinvestments
M
e
di
um‐
t
o
l
ong‐
t
erm
FXandcurrencyswaps
Repos
Short‐term FXandcurrencyswaps
+26
‐1
380
461
224
400
Securities
Interbankfunding
38
1
09
257
400
Securities
Interbankfunding
+26
+1
+13
101
54
380
461
0
200
Others
Others
(ofwhich:CD・CP268)
107
58
38
4
09
0
200
Others
(ofwhich:CD・CP206)
Others
‐62
+1
Note: The charts include major banks classified as internationally active banks.
Source: BOJ.
Assets Liabilities
Assets Liabilities

U.S.YieldSpreads
Chart8
16
18
Stockyield(basedonexpectedearnings)
Stockyield(basedonactualearnings)
Long‐termgovernmentbondyield
%
6
8
Yieldspread(basedonexpectedearnings)
Yieldspread(basedonactualearnings)
%
12
14
4
6
10
12
2
6
8
‐2
0
2
4
‐4
0
1960 65 70 75 80 85 90 95 2000 05 10 15
CY
‐6
1960 65 70 75 80 85 90 95 2000 05 10 15
CY
Notes: 1. Latest data as at end-November 2016.
2. Stock yield = EPS / stock price. "Stock yield (based on expected earnings)" is calculated using EPS (forward twelve months), "Stock yield (based on actual earnings)" is calculated
using EPS (trailing twelve months). Yield spread = Stock yield - Long-term government bond yield.
3. S&P 500 for stock price; U.S. 10-year government bond for long-term government bond yield.
Source: Bloomberg.
TheImpactofU.S.MMFReform
Chart9
MMFassets U.S.short‐termrates
3
USD trillions
0.5
OISspreads,%
GovernmentMMF
PrimeMMF
0.3
0.4
T‐Bill(3M)
LIBOR(3M)
2
0.1
0.2
1
‐0.1
0.0
0
1
3
14 1
5
1
6
20
‐0.3
‐0.2
13
14
15
16
20
Note: Latest data as at end-November 2016.
Source: Bloomberg.
3
5
6
CY
20
13
14
15
16
20
CY
AmountofForeignCurrencyFundingand FXSwapTransactionVolume
Amountofforei
g
ncurrenc
y
fundin
g
Transactionvolume
Chart10
g y
g
viaFXswapsandcurrencyswaps
byJapanesefinancialinstitutions
intheFXswapmarket(USD/JPY)
viaTokyoFXmarketbrokers
1300
USD billions
70
USDbillions
1,200
1
,
300
Majorbanksand
institutionalinvestors,etc.
Including regional financial
70
1,000
1,100
Including
regional
financial
institutions
60
800
900
50
600
700
40
500
600
2010 11 12 13 14 15 16
FY
30
2010 11 12 13 14 15 16
CY
Notes: 1. Latest data as at September 2016.
2.Average transaction volume for each business day (includes outright forwards).
3.Trends are calculated using the two-sided HP filter.
Source: BOJ.
Notes: 1. Estimates by the BOJ. Latest data as at end-September 2016.
2. "Major banks and institutional investors, etc." includes major banks, depository
institutions with a particular focus on market investment, and life insurance
companies.
Sources: Bloomberg; The Life Insurance Association of Japan; Published accounts of
each company; BOJ.
JapaneseFinancialInstitutions'OutwardInvestmentsinForeignSecuritiesChart11
JPY
t illi
120
140
Banks(depositorycorporations)
Insuranceandpensionfunds
JPY
t
r
illi
ons
100
120
Insuranceandpensionfunds(includingpublicpensions)
Securitiesinvestmenttrusts
80
40
60
20
40
0
1998 2000 02 04 06 08 10 12 14 16
CY
Notes: 1. Latest data as at end-September 2016.
2. The amounts are calculated by adding the flow during each period to the stock as at end-December 1997, to adjust for the impact of exchange rate fluctuations.
Source: BOJ.
CY
TransactionVolumeintheFXSwapMarketandBondInvestmentFlows
Chart12
Scatterplot(CY2009‐ CY2016) BondinvestmentflowsintoJapan
4
JPYtrillions
4
2
3
China's stockmarketcrash
Greekdebtissues
2
3
PYtrillions)
1
2
1
2
sintoJapan (J
‐1
0
‐1
0
v
estmentflow
3
‐2
Globalfinancialcrisis
Tapertantrum
Highvolatilityin
globalfinancialmarkets
3
‐2
Bondin
v
‐
3
2009 10 11 12 13 14 15 16
CY
‐
3
30 35 40 45 50 55 60 65
TransactionvolumeintheFX swap market
(USD/JPY,USDbillions)
Notes: 1. Latest data as at October 2016.
2. Figures are 3-month backward moving averages.
3. The transaction volume in the FX swap market (USD/JPY) is the average (via Tokyo FX market brokers) for each business day and includes outright forwards.
Sources: Ministry of Finance; BOJ.
Chart13
GlobalLiquidityAmplificationMechanismthroughtheFXSwapMarket
USmonetarypolicy
(Interest rate hike)
SlowdowninEMeconomies
?
spillover
(Interest
rate
hike)
Declineinoilprices EMCapitaloutflows
spillover
Whilearbitragetradingby
SWFsandFXreservemanagers
d h l f USD i h
bankshasdeclineddueto
regulations,realmoney
investorshaveenlarged
re
d
ucet
h
esupp
l
yo
f
USD
i
nt
h
e
FXswapmarket
theirfootprintintheFX
swapmarket
RiseinFXswapimpliedUSD
fundingrate
Globalbanks(non‐USbanks)
curtailUSD‐denominated
lending to EMs
lending
to
EMs
