Sample Action Research Report 1
Effect of Technology on Enthusiasm for Learning Science
Jane L. Hollis
Lake City Middle School
Lake City, Florida
ABSTRACT
The effect of technology on students’ enthusiasm for learning science (both at school and
away from school) was investigated. Pre- and post-student and parent surveys, student and
parent written comments, and teacher observations were used to record changes in enthusi-
asm for learning science during a six-week study period.
In this study, I investigated how the integration of technology into my middle school
science curriculum would impact my students’ enthusiasm for learning science. Enthusiasm
for learning science can be defined as the students’ eagerness to participate in science activi-
ties in the classroom, as well as away from school. My motivation for focusing on technol-
ogy was twofold. First, I have had an interest in integrating technology into my students’
studies of science for some time. Secondly, the funding for technological equipment and
software recently became available. During the 1993–1994 school year, my school was
awarded a $115,000 incentive grant to purchase equipment and software and to train
teachers in the use of this software and technological equipment. One of the stipulations of
the grant was that the equipment and software must be for student use.
According to Calvert (1994), American education is a system searching for solutions.
Our children drop out, fail to sustain interest in learning, and perform below capacity. Some
have argued that television is the culprit. Others have argued that computers may be the
answer.
Today’s middle school students have grown up in a technological world with television,
electronic toys, video games, VCRs, cellular phones, and more. They are accustomed to
receiving and processing information through multi-sensory sources.
I wanted to bring technology into my classroom and incorporate it into my science
curriculum using multimedia computer presentations. Barbara ten Brink (1993) noted, “. . .
students look to us [teachers] to prepare them for an increasingly technological world.
Fortunately, with videodiscs, we are meeting the challenge by delivering curriculums in
ways that engage, motivate, and thrill our students.” In this study my students had an
opportunity to use assorted multimedia technology as they explored a segment of a middle
school science curriculum.
THEORETICAL FRAMEWORKS
Learning is an extremely complex human process. During my twenty-four years of teaching
I have used many strategies to enhance student learning and to teach new concepts. I am still
not convinced that I thoroughly understand how children learn. Yet, at this point, I do
believe children learn through experiences. They build on past experiences and previous
knowledge to process new concepts. As children redefine old understandings of concepts
and integrate new experiences into their old concepts, they mature in their knowledge and
understanding.
In their early experiences of the world pupils develop ideas which enable them to make
sense of the things that happen around them. They bring these informal ideas into the class-
room, and the aim of science education is to give more explanatory power so that their ideas
can become useful concepts (National Curriculum Council, 1989).
In a discussion in “Discovery, Enquiry, Interaction, Constructive Learning—What’s the
Difference?” Harlen (1993) suggested that there is no single solution to the complex matter
of education. According to Harlen, the objectives of learning are various and so should be
the approaches to teaching. A combination of approaches is often the most effective
education.
As a teacher I cannot assume that I am the giver of knowledge. I can only be confident
in knowing that I am the facilitator of understanding, the presenter of an opportunity to
explore, discover, and compile knowledge. A student’s willingness to learn and his/her
enthusiasm for discovering knowledge and developing understanding will dictate the level
of student learning.
Students need to be actively involved in their education. Interested and enthusiastic
students are more willing learners, and I believe willing learners become active participants
in their own instruction. As children become more actively involved in their learning, they
develop interest and enthusiasm for the content and/or the process that is their conduit for
acquiring new knowledge.
Through this study I hoped to find that multimedia technology would be the conduit
that my students needed to acquire new knowledge, develop new concepts, and express
strong understanding. Through the integration of multimedia computer software I hoped to
tap the enthusiasm of my students towards learning science and make them active
participants in their own instruction.
THE STUDY
I teach eighth grade, comprehensive science (an integrated life, earth/space, and physical
science program) at a middle school in a rural North Florida county. I am a member of a
four-teacher team, along with one math, one history, and one language arts teacher. We
instruct 130 students who make up the academic team (Team E). Although I teach five
science classes a day, I targeted my seventh period class for my research.
This class is made up of thirty-one average and above-average science students. I chose
this last class of the day for purely logistical reasons. With only one computer in my class-
room, I needed to borrow eleven computers daily from neighboring teachers. Seventh period
was the most agreeable period to the other teachers. An extra advantage of using the last
period of the day was that students could return the computers after the final dismissal bell
and not take valuable class time for this task.
My data was generated by comparing these students’ attitudes toward learning science
at the beginning of the school year, during my study, and at the conclusion of the study
period. The students’ attitudes and reactions were documented by the students themselves,
by their parents, and by my own observations. Collecting data from three sources allowed
for triangulation of the findings in this study. Data triangulation helped reduce the
likelihood of error in the findings when similar results are reported from two or more of the
sources. I surveyed all of the class members and their parents at the beginning and the end
of my study.
During the first six weeks of school, I reviewed the scientific method, the metric
system, scientific measurement, and laboratory safety. At this point multimedia technology
was not part of the curriculum. Some hands-on activities were used at this time. The
students worked both individually and in groups. To determine each student’s level of
enthusiasm for learning science, during this time I administered a survey which contained
the following questions: How do you like learning science? How have you liked learning
science so far this year? How enthusiastic are you about exploring science at home?
Students were asked to rate their answers to each question using a scale of 1 to 5. The scale
was represented by (1) a very unenthusiastic response, (2) an unenthusiastic response, (3)
indifference, (4) an enthusiastic response, and (5) a very enthusiastic response.
Additionally, I sent home parent surveys with each student in order to solicit and record
the parents’ opinions concerning their child’s enthusiasm for learning science. The survey
included two questions: How enthusiastic is your child about learning science? How
enthusiastically does your child do science activities at home? I used the same rating scale
for the parents that I used with the students.
At the beginning of the second six weeks I introduced a unit on oceanography.
Oceanography was used as the unit of study primarily because of the number of resource
materials available to the students through the media center. It was during this unit that I
began to integrate technology into my curriculum. As the unit was introduced I asked my
students to look through the oceanography chapters in their textbooks and make a prioritized
list of the eleven subtopics in physical and biological oceanography they would like to
study. Students were grouped according to their interest as much as possible and were
assigned to work in groups of two or three to develop a multimedia presentation that would
be used as an instructional tool for the other students.
During this period I began to introduce them to the multimedia computer program,
HyperStudio (Wagner, 1994). HyperStudio is a program that allows the user to combine
sound, graphics, and animation with text to make creative and entertaining presentations.
The introduction of HyperStudio and the development of the student presentations took six
weeks to complete.
Throughout the study I observed and made notes as to how the students were working
and their reactions to class. These observations were guided by several questions: What
problems are the students encountering as they work on their multimedia presentations? Are
the students having problems with content? Are there problems working in groups? Are they
having problems using the multimedia software? These observations and notes were useful
in making sense of any fluctuations I found in the end-of-study student surveys. I was able
to discern the source of problems so that content difficulties or friction within groups was
not confused with a loss of enthusiasm for technology.
At the end of the oceanography unit I had each group of students share their
presentations with the rest of the class. After the presentations, each group was asked to
comment to the class on how they enjoyed developing their works. I noted these student
comments as they were presented to the class. Each student was also asked to make written,
individual comments to me, responding to the following questions: What problems did you
encounter while you were developing your presentation? What did you learn about your
topic while you were developing your presentations? Did you learn from the other students’
presentations? Would you like to do another presentation on some other topic in science?
Again I surveyed the parents of these students to gain information about their child’s
interest in learning science. I asked the following questions: Is your child talking about
science at home? Is your child eager to share what we are doing and learning in science
class? Do you feel that your child is learning science? Why or why not? How enthusiastic is
your child about learning science? How enthusiastically is your child doing science
activities at home? I again surveyed the students asking the same questions that I had asked
in the beginning survey.
RESULTS
As I watched and listened to my students during the study, it was apparent very early that
they were thoroughly enjoying using computers and developing their presentations. Students
rushed to class, eager to get started on their presentations. There were no tardies to class
during the study period, while there had been fourteen tardies to class in the month before
the study period. Normally these students would ask to pack up their things three to five
minutes before the end-of-the-day bell sounded. During the study period I had to insist that
they stop work, and often they ignored me and worked through the dismissal bell. Several
times a week students would ask to stay after school and work on the computers. One group
worked for an hour and a half after school and would have stayed longer, but I had to go
lock up for the day.
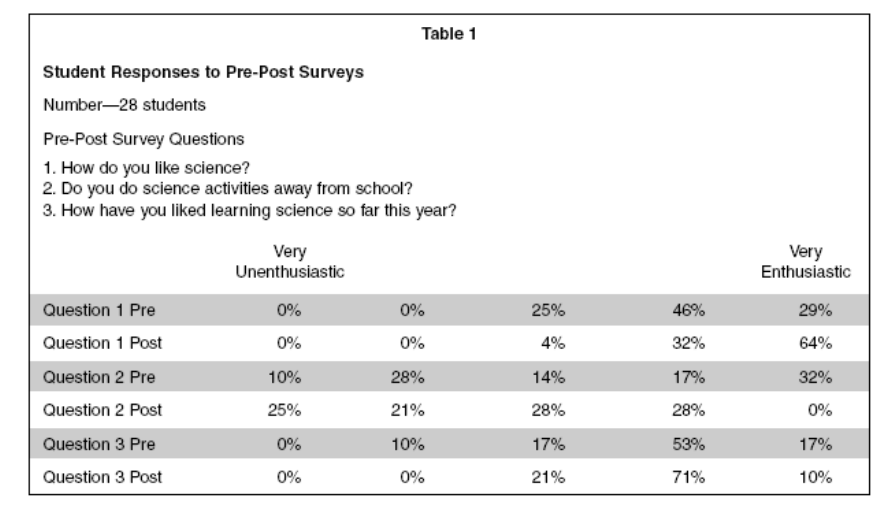
Twenty-eight of the thirty-one members of the class responded to the pre- and post-
study surveys. One member of the class withdrew from school during the study period, and
two students did not return their surveys.
The pre- and post-study attitudinal surveys show an increase in my students’
enthusiasm for learning science (see Table 1 on the following page). In the pre-study survey,
75% of the students were enthusiastic or very enthusiastic about learning science, while the
post-study survey showed 96% of the students enthusiastic or very enthusiastic about
learning science. When the students were asked how enthusiastic they were about doing
science away from school, their responses showed a decrease in enthusiasm for learning
science away from school after the study as compared to pre-study data. On the pre-study
survey, 49% of the students were enthusiastic or very enthusiastic about doing science away
from school, while only 28% of the students were enthusiastic or very enthusiastic on the
post-project survey. Students’ comments on the post-study survey concerning their
diminished enthusiasm for learning science away from school centered around the lack of
availability of computers and software at home. Only eight students had access to a
computer at home, and only one student actually had the HyperStudio computer program to
use at home.
When the students were asked how they had liked learning science so far this year, their
responses again showed an increase in enthusiasm for learning science. On the pre-study
survey, 70% of the students were enthusiastic or very enthusiastic about learning science
during the first half of their eighth grade year, while 81% of the students were enthusiastic
on the post-study survey.
The students were questioned before and after the study about their likes and dislikes
while learning science this year in an attempt to determine the impact that the topic of
oceanography had on their enthusiasm for learning science during the study. The students’
responses all centered around the method of instruction rather than the curriculum. Their
responses made reference to lectures, note taking, group work, projects, lab work, using
computers, etc. Since the students did not mention content in their likes or dislikes, I do not
think the topic used during this study had a significant effect on the results of this study.
The increased enthusiasm of my students was made apparent during the study through
two separate incidents. The first incident occurred during the second week of the study.
Seven of my students missed class one day a week to participate in a gifted program. These
students told the teacher of the gifted program that they did not want to miss class while
they were working on a computer presentation. However, these students were not allowed to
miss gifted class and were very unhappy.
The second incident occurred during the sixth week of the study. The entire student
body was being rewarded with an incentive assembly. They were allowed to watch or
participate in a student versus faculty basketball game instead of attending sixth and seventh
period. Seventeen of my students in the seventh period study group asked for permission to
miss the incentive assembly and spend the two hours in science class working on their
computer presentations.
Enthusiasm for learning science was also reflected in student comments during and
after the study. Some of these comments were as follows:
• “Everyone gets into the topic more when they use HyperStudio.”
• “It’s creative and it is fun.”
• “It’s a lot more fun working on a computer than in a book.”
• “You get to make friends with people and learn what they know. It’s a different
way of teaching and I think it keeps our attention better.”
• “I think anyone could benefit from studying a topic in science by developing a
multimedia presentation.”
• “It is like doing book work but fun.”
• “I enjoyed doing the multimedia presentation. I feel it was very helpful and fun
at the same time but educational.”
• “It was a fun learning experience.”
• “Computers are millions of times more fun than book work.”
• “Using books gets boring, but you can learn by computers at the same time if
working on them.”
• “There is so much you can learn off computers that you just can’t from books.”
• “With books it gets boring after a while, but with computers it’s fun and
exciting. Computers make learning fun.”
• “I find it very interesting to work on computers. It makes me think a lot.”
• “It made me enjoy looking up information for my presentation.”
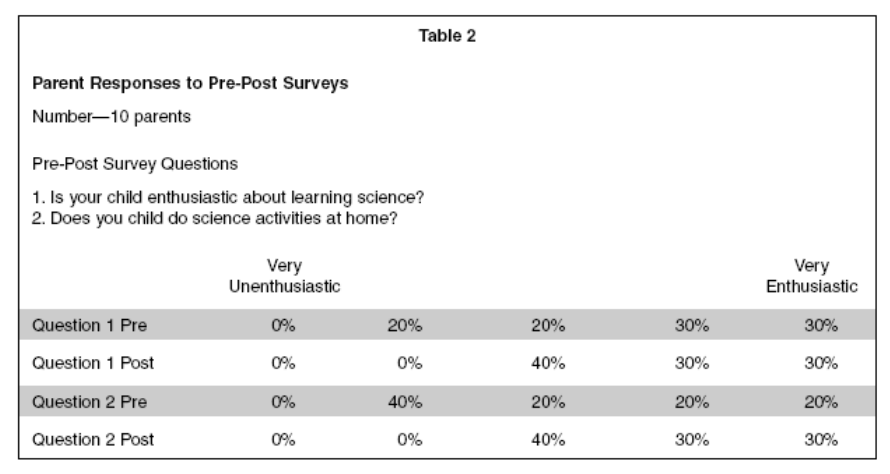
Parents were surveyed before and after the study. The same ten parents completed and
returned both the pre-study and post-study survey. The parent surveys (see Table 2) showed
that 60% of the parents considered their children enthusiastic or very enthusiastic about
learning science both before and after the study. These surveys did show that 20% of the
parents felt that their children were unenthusiastic about learning science before the study,
while none of the parents recorded their child as being unenthusiastic about learning science
after the study. When asked how enthusiastic their child was about doing science activities
at home, 40% of the parents noted that their children were enthusiastic or very enthusiastic
about doing science activities at home on the pre-project survey. On the post-project survey,
60% of the parents reported that their child was enthusiastic or very enthusiastic about doing
science activities at home.
Several parents added comments to their post-project surveys. Their comments were as
follows:
• “I feel the more ‘high tech’ the equipment, the more important the subject will be
to the students. If they think science is ‘cool,’ because the equipment they use is
‘cool,’ then more learning will take place and interest will remain high.”
• “As our society is becoming more computer dependent our students need an
early start.”
• “Hands on is fine, but they need the basics too. We also need to have more
computers in the classroom to be effective.”
• “It seems to generate more enthusiasm for science and learning.”
• “My daughter talked more about science during the use of computers.”
DISCUSSION
My findings show a marked difference in the opinions of the parents as compared to the
opinions of the students. The parents perceived no change in the enthusiasm for learning
science, while the students noted a 21% increase in enthusiasm for learning science. The
parents recorded a 20% increase in enthusiasm for doing science activities away from
school, while the students recorded a 21% decrease in away from school science activities.
The differences between parent results and student results could be a reflection of the
communication gap between parents and students of this age. The parents equated the
increase in conversations about science and planning of presentations that their children
were doing at home with increased enthusiasm. The students on the other hand were
enthusiastic about working with the computers but did not consider their conversations at
home and their planning of presentations actually “doing science activities.” They indicated
instead a frustration about not having more access to computers and software to “do
science” at home.
The results of this study support the notion that the level of enthusiasm for learning
science was increased through the incorporation of computers and multimedia software into
the middle school science curriculum. The integration of technology will be an ongoing
pursuit in my classroom. The enthusiasm it brought to my students has been infectious.
Students and parents of students in my other four classes have asked when they would have
an opportunity to work with computers. Teachers throughout the school have become
interested in integrating technology into their curriculum. Through the insistence of my
coworkers, I have taught two HyperStudio training sessions for twenty-one teachers and
teacher aides from all academic disciplines as well as areas such as special education and
the media center. Seventeen of my study group students volunteered to assist me with these
teacher training sessions.
I believe that multimedia computer technology could enhance all of the core curricula.
In English, it could be used to illustrate creative writing assignments. Social studies classes
could use multimedia to develop geography or history presentations. One of my study group
students used HyperStudio to develop an award-winning math fair project. Adding
enthusiasm to learning in any discipline through the use of technology is limited only by the
ability of a school to provide funding for the equipment, adequate software, and teacher

training. The availability of equipment when doing class projects involving technology is
critical.
This active research study was made possible through the cooperation of my fellow
teachers. By borrowing computers from neighboring classrooms, each group of students that
developed a presentation had a computer to use throughout the study period. Ideally,
computers and software should be made available to students and teachers for check-out and
use at home as well as at school through the school’s media center. The difficulties
encountered in this study (all of which involved the logistics of accessing the equipment
needed) were far outweighed by the academic benefit to my students.
This active research study not only increased my students’ enthusiasm for learning
science, but it also rekindled my excitement for teaching. During the prestudy period, I was
extremely apprehensive and began to question the feasibility of the study. Once I began,
however, I found myself looking forward to the hectic pace and the commotion that resulted
from eleven groups of middle school students using sound, animation, and graphics to
develop multimedia computer presentations.
REFERENCES
Calvert, S. (1994). Children’s attentional involvement and distractibility during educational
computer interactions. Journal of Educational Technology Systems, 22(3), 251–257.
Harlen, W. (1993). The teaching of science. London: David Fulton Publishers.
HyperStudio, Roger Wagner Publishing Co. Inc. El Cajon, CA. 1994.
National Curriculum Council. (1989). Science: Non-statutory guidance. York, England:
NCC.
ten Brink, B. (1993). New frontiers with science videodiscs. Educational Leadership, 50(8),
42–43.
From “Effect of Technology on Enthusiasm for Learning Science” by J. Hollis (1995), in S. Spiegel, A. Collins, & J.
Lappert (Eds.), Action Research: Perspectives from Teachers’ Classrooms. Science FEAT (Science For Early Adolescence
Teachers). Tallahassee, FL: SouthEastern Regional Vision for Education. Retrieved October 20, 2004, from
http://www.enc.org/professional/learn/research/journal/science/document.shtm?input=ENC-002432-2432_ch1
. Reprinted
with permission.
