Required disclosures appear on page 9
Analyst certification appears on page 11
1177 Avenue of the Americas 5
th
Floor
New York, NY 10036
Phone: 212-297-0001
www.sidoti.com
Yatra Online, Inc. (YTRA) is an online travel agency (OTA) company with a primary
focus on the corporate travel market. Although the shares faced a “one-two punch”
from the cancelled Ebix acquisition and the COVID-19 pandemic, the company remains
a leading OTA in India. In March 2019, Ebix (NASDAQ: EBIX, NC) made an offer to acquire
Yatra, and the companies agreed to the deal on July 17, 2019 for an EV of $337.8 million and
a stock price of about $4.90 per share. On June 5, 2020, Yatra terminated the merger
agreement and filed a lawsuit against Ebix, alleging breaches of the agreement. The end of
the failed Ebix deal coincided with the global response to COVID-19, which dramatically
reduced air travel and cut Yatra’s revenue by nearly 90%. However, as travel in India is
gradually recovering, recent share performance likely reflects an overly pessimistic scenario.
Yatra is India’s second or third largest leisure OTA and the largest corporate travel provider.
Although we think travel could be diminished for a few quarters, India is a high growth market
in both the leisure and business travel categories. With an enterprise value of about $34
million today, we think investors should consider the fundamentals of Yatra’s business.
We think Yatra’s position in the corporate travel market is differentiated and enables a
more efficient acquisition of leisure travelers. Through Yatra’s position as the leading
corporate OTA with a bevy of blue-chip companies signed to multi-year contracts, it already
serves some 15 million people including business travelers and their households. Those
households are likely to represent a significant portion of the rising middle class, putting Yatra
in an advantageous position to efficiently maintain its leisure brand and potentially spend less
to acquire leisure customers. India’s corporate travel market grew 12% annually in recent
years, pre-COVID. Yatra is leveraging its position with corporations by extending additional
services, such as deeply integrating expense reporting and offering its library of 100,000+
hotels, access to bulk discounts on products through Amazon. Yatra’s goal is to reduce
reliance on an unpredictable leisure market.
Yatra’s revenue declined in the quarters pre-COVID when the acquisition by Ebix was
pending, but marketing spending declined substantially and supported two quarters
with positive EBIT, suggesting greater efficiencies. YTRA reported a 26% decline in
revenue from 1Q:F20-3Q:F20 compared to 1Q:F19-3Q:F19, while operating expenses
declined 28% and sales and promotion expenses declined 76% over the same period. In
1Q:F20-3Q:F20, EBIT loss was $7.6 million compared to $26.2 million in the prior year
September
29, 2020 | Company Sponsored Research Report
Sidoti & Company, LLC
Member FINRA & SIPC
Initiation of Coverage
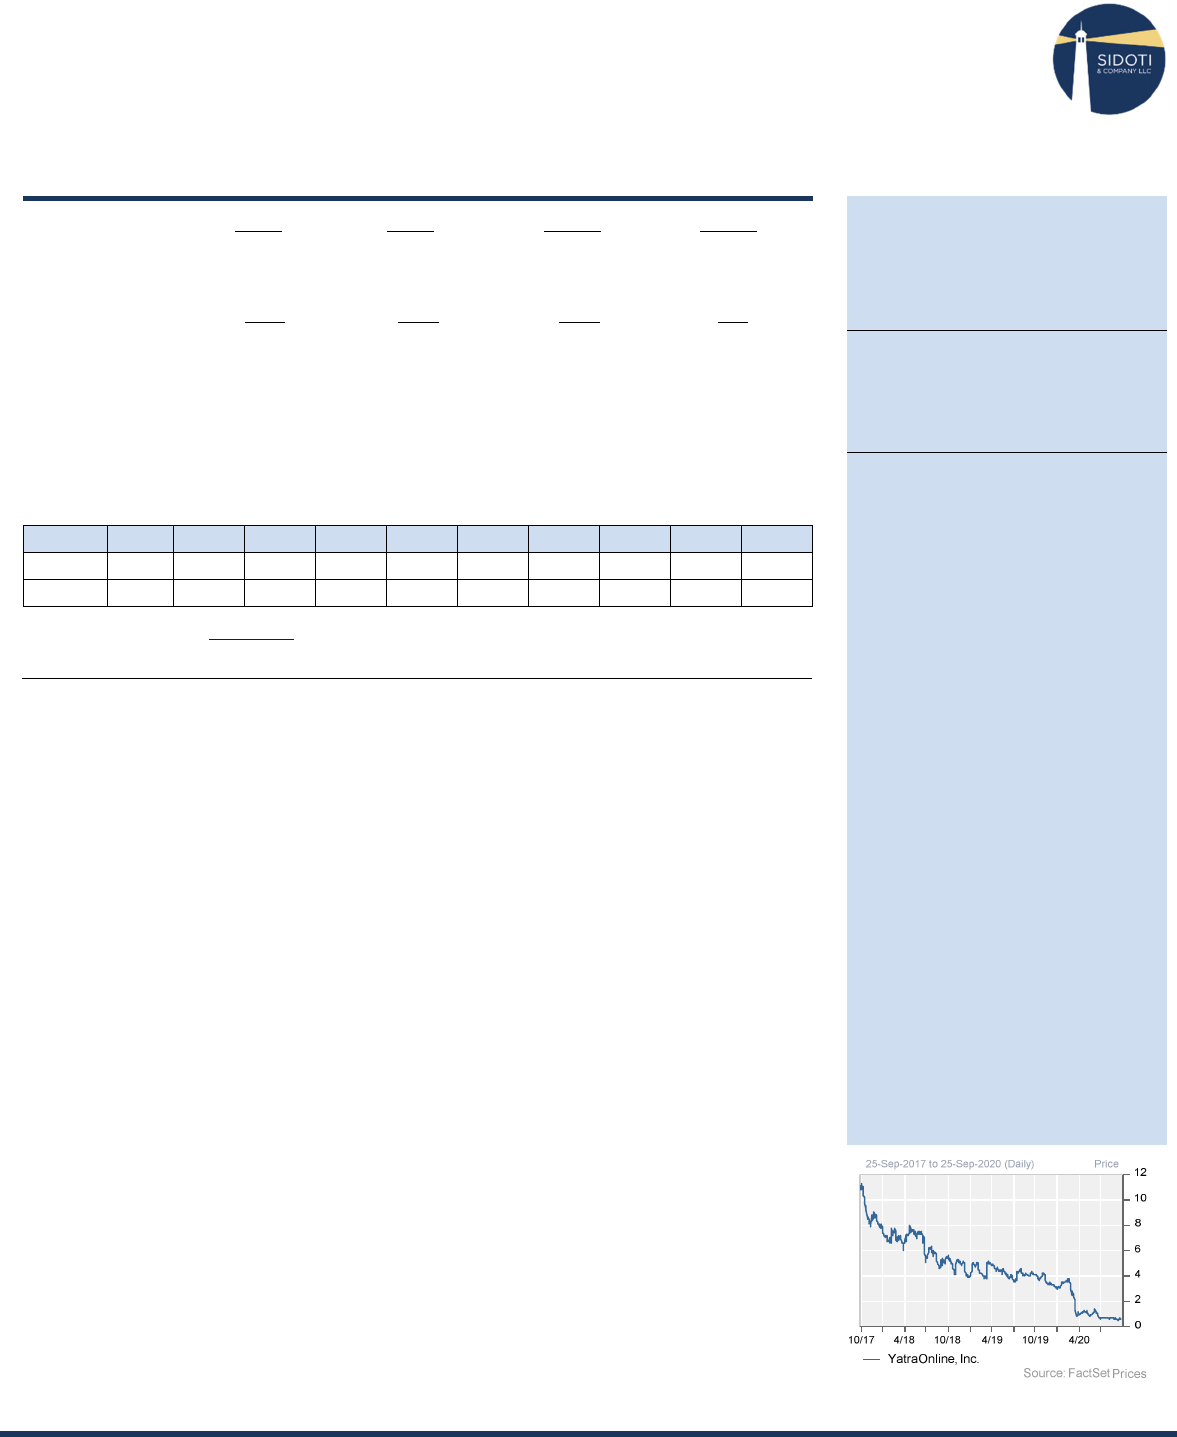
Yatra Online, Inc.
(YTRA)
Initiate Coverage Of Yatra Online, Inc. With A $1.50 Price Target
NR
Price Target: $1.50
Price: $0.70
Risk Rating: H
Matthew Galinko
(212) 894-3338
(mgalinko@sidoti.com)
Key Statistics
Analysts Covering 1
Market Cap (Mil) $40
Enterprise Value* $25
52-Week Range (NASDAQ) 4-1
5-Year EPS CAGR
N/A
Avg. Daily Trading Volume 674,000
Shares Out (Mil) 47.726
Float Shares (Mil) 45.515
Insider Ownership 18%
Institutional Holdings 52%
Annualized Dividend Nil
Dividend Yield N/A
FCF Per Share (F2022E) $0.08
FCF Yield (F2022E) 11.4%
Net Cash Per Share (F2022E) $0.23
Price to Book Value 1.5x
Return on Equity (F2022E)
NM
Total Debt to Capital 25%
Interest Coverage Ratio -12.88
Short Interest % 0.6%
Short Interest Days To Cover 0.7
Russell 2000 1,510
Russell 2000 - Last 12 Months -4.9%
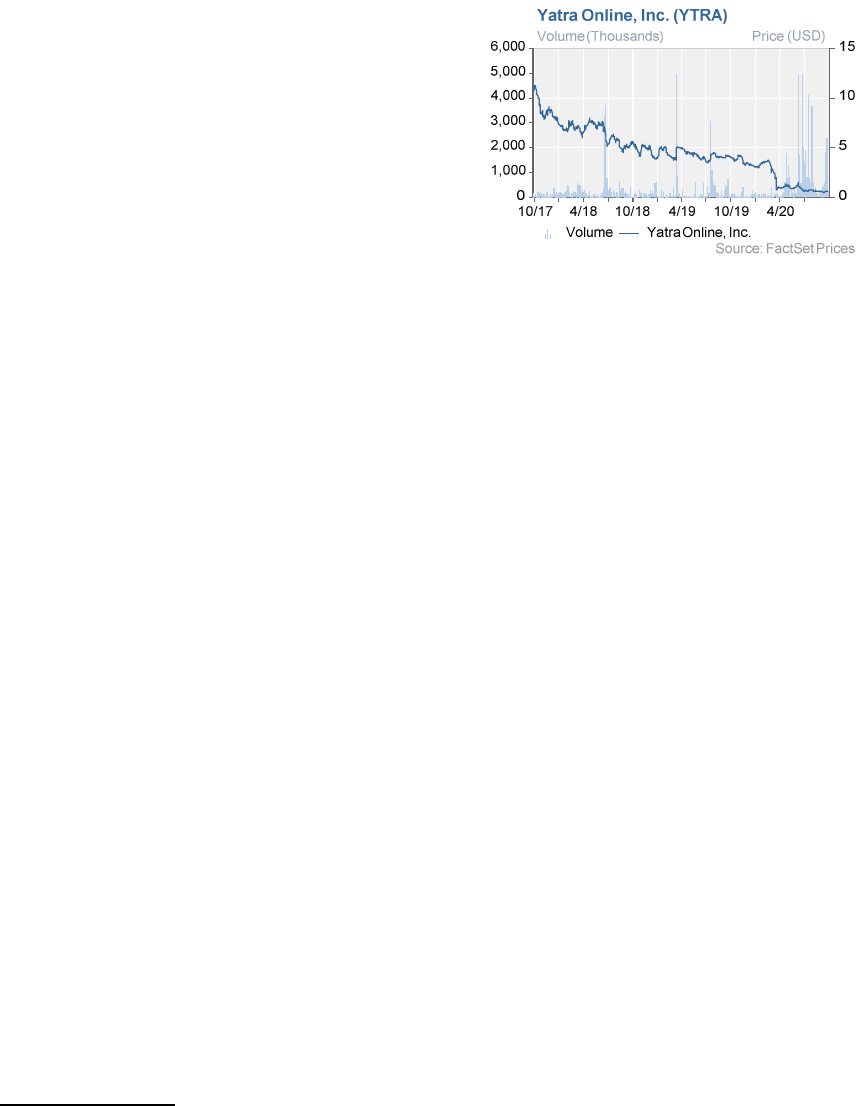
YTRA - Last 12 Months -83.2%
F2019
F2020
F2021E
F2022E
June
($0.23) ($0.13) ($0.13)A ($0.02)
Sep.
(0.13) (0.08) (0.09) (0.03)
Dec.
(0.11) (0.01) (0.05) $0.01
Mar. (0.22) (0.08) (0.04) 0.03
EPS (FY)
($0.68) ($0.29) ($0.30) ($0.01)
EPS (Cal.) ($0.44) ($0.35) ($0.08) N/A
P/E (FY)
NM NM
P/E (Cal.)
NM NM
Note: NR = Not Rated. Risk Ratings: H = Highly risky; M = Moderately risky.
Reported results use the exchange rate provided by company;
estimates use a spot rate at the time of publishing. Fiscal year ends March. C2022 estimates N/A until we provide F2023 estimates. We
calculate EV using F2022E projected net cash given our expectation for cash burn. Sum of quarterly EPS may not equal full-year total due to
rounding and/or changes in share count. NC=Not covered by Sidoti & Company, LLC.
Year
F2013
F2014
F2015
F2016
F2017
F2018
F2019
F2020
F2021E
F2022E
Rev.(Mil.)
N/A N/A N/A $125.8 $144.4 $113.8 $128.8 $79.4 $23.1 $55.5
GAAP EPS
N/A N/A N/A ($0.88) ($3.68) ($1.79) ($0.37) ($0.24) ($0.20) ($0.02)
* We use adjusted revenue that normalizes for revenue recognition changes that began in F2018. IFRS financial reporting.
Description: Yatra Online, Inc. (www.yatra.com) is an online travel agency (OTA) focused on India.
Yatra serves the leisure and corporate
travel markets, aggregating airline, hotel, and other travel options, allowing travelers to book through a single site. Headquarters are in
Gurgaon, India.
YATRA ONLINE, INC.
Sidoti & Company, LLC
2
period. YTRA reported an operating profit just prior to the beginning of COVID’s impact with very little promotional spending.
YTRA has made additional cuts due to COVID, and management expects to bring nearly 70% of pre-COVID revenue back at the
reduced spending levels.
The company stemmed its cash burn with cuts before and during the COVID interruption, and after a June secondary
offering, we estimate YTRA has about two years of cash were it to operate at trough revenue levels. YTRA reported
gross cash and term deposits of $48.6 million and net cash of $39.1 million ($0.64 per share) as of the end of 1Q:F21; the cash
balance as of August 31
st
was $33.7 million, including $7.7 million of restricted cash. The company has access to an untapped
credit facility of $8.3 million. YTRA raised approximately $10 million in a June secondary offering. YTRA reported a cash from
operations outflow of $7.3 million in F2020 ($1.5 million excluding working capital), an improvement from $47.7 million ($15.6
million) year over year. Management disclosed a $1.2 million monthly burn rate after the COVID-restructuring.
We initiate coverage of YTRA shares with a highly risky rating and $1.50 price target. OTA peers trade around 3.3x
EV/Sales, compared to Yatra’s 0.5x. We use about a 1.2x EV/Sales multiple applied to our estimate for F2022 revenue, which is
in line with YTRA’s historical 1.2x on a TTM basis. We assume F2022 to be a more normalized period than F2020 and F2021;
the discount to peers reflects the potential for dilution if the recovery is slower. However, if YTRA reaches profitability, drives
revenue growth, and generates sufficient cash flow to support the business, we think the trading multiple should approach the
peer group average. YTRA’s history of losses and the uncertain air travel recovery from COVID informs our risk rating.
Company Overview
Yatra Online is an online travel company founded in 2006
serving the Indian market, with headquarters in Gurgaon,
India. CEO Druv Shringi and CTO Manish Amin were co-
founders of the company and previously worked in
leadership positions at EBookers Group, a U.K. online
travel site founded in 1998.
Yatra’s website and mobile apps offer an integrated
approach to booking travel. Initially focused on air travel,
Yatra now offers hotels, cabs, buses, trains, cruises, and
assembled packages, among others. Yatra reaches
approximately 100,000 hotels in India, which we think is
the largest inventory in the market. The company began
to pursue the corporate travel market in 2013, which in
F2020 accounted for approximately 50% of bookings.
“Yatra” means travel or trip in Hindi, the most commonly
spoken language in India. Travel site visits and travel
bookings by mobile phones overtook computers in 2015,
and this trend is expected to continue. Today, Yatra’s
traffic mix is approximately 83% mobile versus 17% PC.
Yatra’s name may assist with a favorable ranking in the
Google Play store. Pre-COVID, some 60% of India’s
travel market was booked offline.
Ebix offered to acquire Yatra in March 2019, which
resulted in a merger agreement in July 2019. Ebix
apparently struggled to complete certain SEC filings and
later attempted to change the merger agreement; Yatra
left the merger agreement in June 2020 and filed a
lawsuit against Ebix in Delaware after terms of the
agreement were allegedly breached. We think it is
difficult to assess the likelihood that the case results in
awarded damages; we note that representation is on
contingency.
Yatra exited the Ebix merger agreement into the COVID-
19 pandemic that largely eliminated air travel in the worst
of the lockdown and reduced corporate and leisure
willingness to travel for the time being. The result was a
steep decline in Yatra’s June quarter results, with
bookings of -$2.8 million indicating widespread
cancellations and adjusted revenue of $3.1 million,
although we think that is likely to be the trough. As of
August/September, India is gradually opening air capacity
between regions with low infection rates. As more
regions reach acceptable infection rates, air capacity
should continue to grow. Further, with the assumption
that a vaccine will begin to be circulated in early 2021, we
think travel will continue to rebound more rapidly in the
following quarters and YTRA’s revenue should follow a
similar trajectory.
Yatra went public in 2016 through a reverse merger IPO
in a transaction valued around $253 million. The
company held about 2.9 billion Indian rupees ($43 million
at a then 67.944:1 exchange rate) in cash and
equivalents following the listing. YTRA raised $57 million
in a June 2018 secondary and about $12 million in a June
2020 secondary. There are 35 million warrants
outstanding, representing about 17.3 million shares
expiring in December 2021 with an exercise price of
about $26.
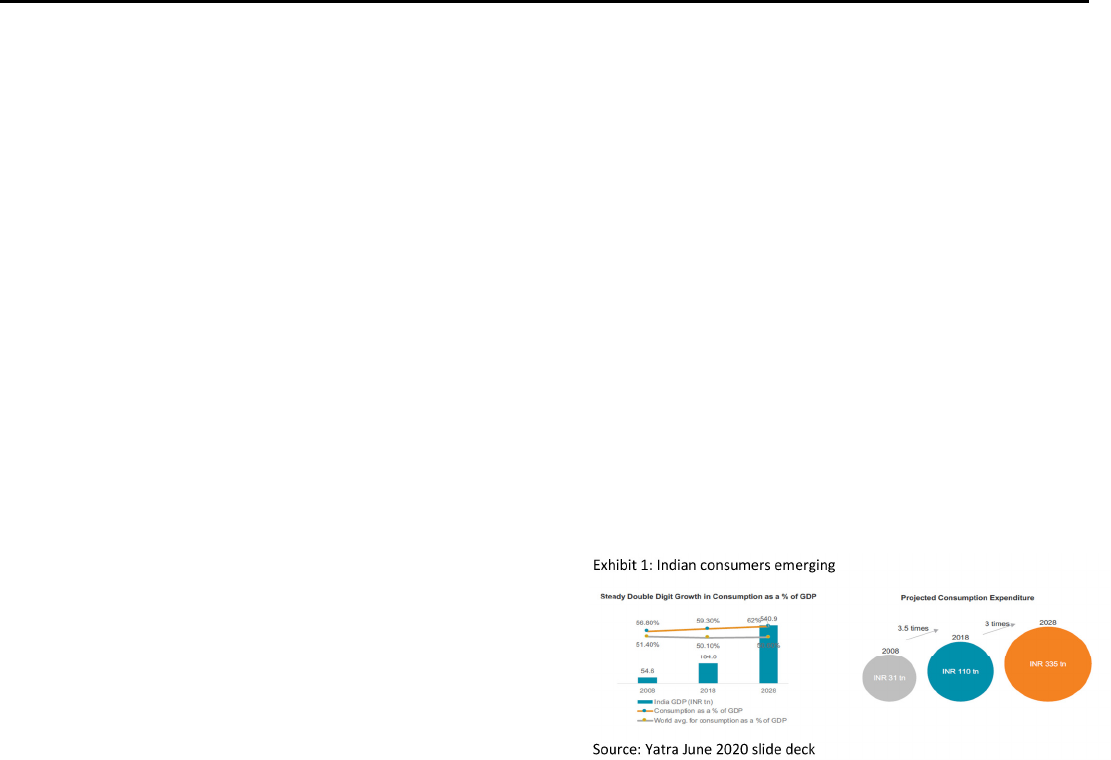
Market Opportunity In Emerging Middle Class
Exhibit 1 shows one of the underpinning elements for an
investment case in Yatra. India’s economy is reaching a
point of development where an emerging middle class
has significant disposable income and spending power.
India and China share a similar population of around 1.4
billion. China’s population is projected to peak in 2030
and India’s in 2060; we think it stands to reason that India
will likely overtake China’s population in the next decade.
YATRA ONLINE, INC.
Sidoti & Company, LLC
3
Both the economies of China and India have undergone
expansion since giving up centralized control, China in
1978 and India in 1990, amid industrialization. India’s
GDP per capita in 2019 was approximately equivalent to
China’s in 2007 adjusting for purchasing power parity
(PPP). China’s GDP per capita adjusted for PPP grew
about 11.6% annually on average from 2007 to 2019.
India’s GDP per capita adjusting for PPP grew 6.6% from
2010 to 2019. Data also shows a steady rise in
consumer spending and disposable income over the last
20 years in both countries; data was sourced from
tradingeconomics.com. FactSet estimates indicate a
return to Real GDP growth of 7.4% in 2021 in India
following the 2020 pandemic impact.
With rising political tension between India and China, and
between the U.S. and China, we think there is likely to be
greater political and economic cooperation between the
U.S. and India over the coming years, which may work to
the benefit of India’s economic growth.
We are not macroeconomists and do not have a nuanced
view or outlook of the Indian economy in the years ahead.
However, we think using China’s development over the
last 20 years as a likely proxy for India’s over the coming
years is a reasonable benchmark. If accurate, we think
India’s middle class will grow dramatically along with
disposable income and demand for luxury items and
experiences.
According to data from Statista.com, air passengers in
China grew by about 16% annually from 2010 through
2019. And according to the International Air Transport
Association (IATA) predicted that India would reach 414
million total air passengers traveling annually by 2037, up
from 158 million in 2017.
Corporate Travel Offers Numerous Growth And
Stability Vectors
Yatra launched a corporate travel strategy in 2013, which
we think was motivated by aggressive marketing by
leisure market competitors and after India’s air travel
market was disrupted by the bankruptcy of a large air
carrier.
By 2019, corporate accounted for approximately half of
Yatra’s bookings and the company claimed several high-
profile customer wins. Contracts typically are for multiple
years and include varying levels of integrations into the
customer’s ERP and other backend systems. Business
rules may be applied to limit corporate travel options to
different roles in the organization. We think the intensity
of integrating YTRA’s technology into customer backend
systems creates stickiness, as work would need to be
replicated if the corporate travel provider were replaced.
Corporate travel typically yields lower commission rates
than leisure travel, but the customer acquisition cost,
which is in the form of an enterprise service contract, is
conceptually amortized over a multi-year contract.
Notably, when the contract is renewed there is no
meaningfully additional or recurring customer acquisition
cost. Customer acquisition in the leisure market is
transactional by contrast. Spending on search engine
marketing is useful for attracting customers actively
searching for travel sites, which usually happens when a
customer plans to book travel. However, leisure travelers
do not tend to be repeat customers, which makes driving
profitable engagements challenging in a highly
competitive market for customer acquisition.
We think that Yatra’s role as a leading travel service
provider to large corporates in India is a strong branding
tool that resonates with the country’s emerging middle
class. Some of the corporate customers allow employees
to accrue points in Yatra’s loyalty program, which are
usable for leisure travel. According to management, the
cost of acquiring a customer through a loyalty program is
half that of search engine marketing. With about 15
million employees, plus household members, represented
in Yatra’s corporate travel business, the potential for
optimized customer acquisition is significant compared to
peers that significantly lag in corporate travel.
Yatra recently announced partnerships that can generate
non-travel booking revenue. In August 2020, YTRA
announced a partnership with Amazon Business. Yatra
will provide its network of hotels (approximately 100,000)
with bulk pricing on Amazon. Amazon’s breadth makes it
a potential “one stop shop” for hospitality customers. We
think Yatra will collect an affiliate fee, essentially a
commission, from sales through the system, that can
traditionally range from 1% to 10% depending on the
product. We think YTRA’s cost for operating this program
is minimal and revenue largely incremental. In July 2020,
Yatra announced a partnership and integration with
Zaggle, an Indian FinTech start-up delivering an expense
reporting solution. Zaggle has approximately 3,500 large
customers. We think it is a lower cost expense reporting
option that may better serve the local market with SaaS
type arrangements, compared to competitors like Concur.
Competition
Yatra’s competition is largely divided by leisure and
corporate travel; we do not know of a competitor that
participates in both markets to the extent of Yatra.
Leisure
MakeMyTrip (NASDAQ: MMYT, NC) is the largest player
in the OTA space, having extended its lead after
acquiring GoIbibo in early 2017. MMYT was founded in
2000 in the U.S., and targets Indians living in the U.S.
seeking travel to India. MMYT went public on NASDAQ
in 2010 and has since completed 11 acquisitions. MMYT
began building a corporate strategy in 2017, and as we
were not able to find an example of the company
discussing corporate in the bookings or revenue mix, we
think MMYT’s corporate business is likely small. At $673
million of adjusted revenue for the year ended March 31,
2019, MMYT generated about 5.7x greater sales than
YTRA prior to COVID. Sales and marketing accounted
for approximately 67% of MMYT’s revenue in F2018,
suggesting aggressive spending on customer acquisition.
We think YTRA’s investment in the corporate market
YATRA ONLINE, INC.
Sidoti & Company, LLC
4
years in advance of MMYT likely provides a significant
advantage in the corporate travel arena.
Bookings Holdings (NASDAQ: BKNG, NC) owns
bookings.com, KAYAK, priceline, agoda, Rentalcars.com,
and OpenTable. These brands are leisure travel focused
and we do not think BKNG has a corporate travel
strategy. BNKG lags MMYT in leisure travel in India.
Expedia Group (NASDAQ: EXPE, NC) operates
Expedia.com, HomeAway, Hotels.com, Hotwire.com,
Orbitz, Travelocity, trivago, Vbro, and CarRentals.com.
The company was founded in 1996 as a division of
Microsoft. The company launched a corporate travel
brand in the U.S. and France, but remains largely
focused on leisure travel.
ClearTrip is a privately held Indian travel company that
has discussed a goal of about $100 million in revenue
from India in F2020. While we think that the majority of
Cleartrip’s revenue is likely leisure, the company also has
a corporate travel strategy; it likely leads Yatra in the
leisure market, making it the second largest leisure OTA
behind MMYT.
Search Engines are an emerging competitor to leisure
OTA. Robust organic traffic is all that is needed, so large
internet search engines can acquire customers and
collect fees for travel bookings at minimal cost. Google
entered the U.S. market in 2011, drawing antitrust
complaints and taking share from market leaders.
Corporate
Carlson Wagonlit Travel, American Express GBT, and
BCD are corporate travel competitors based in the U.S.
and Europe. We think these companies have the ability to
sell global travel services but may not have Yatra’s reach
in India. Thomas Cook India is a multi-service travel
agency with headquarters in Mumbai, India, providing
foreign exchange, leisure bundles, visa and passport
services, among others; this is far from a pure play
corporate travel business.
Terminated Merger Agreement with EBIX
Ebix is an acquisitive public company, attempting over 30
deals since 2010 and completing approximately 5 out of 6
purchases of travel services related companies from
2018-2019. It announced an offer to acquire Yatra in
March 2019, and the companies reached a merger
agreement in July 2019. Yatra shareholders would
receive 0.005 shares of a new class of convertible
preferred stock in Ebix; each preferred share was to be
convertible into 20 shares of Ebix common. At Ebix’s
share price at the time of the deal, it approximated a
$337.8 million enterprise value and $239 million equity
value for Yatra shareholders. The offer represented a
32% premium to Yatra shares.
Yatra terminated the merger agreement with Ebix in June
2020 and filed litigation alleging breach of the agreement.
In a partially redacted legal complaint available for
shareholders on Yatra’s investor relations website, the
company alleges that Ebix was aware of and hid SEC
inquiries into its accounting practices that would preclude
the filing of an S-4 to complete the agreement, from
Yatra. Yatra also alleged that Ebix demanded to
renegotiate the deal after several months but refused to
proceed with good faith toward closing long after the
original merger agreement stipulated.
We do not put an expectation on the outcome of the
lawsuit. However, we do note that the merger agreement
put restrictive covenants on Yatra’s business, during
Ebix’s entrée into the market as a competitor; this is, in
the very least, poor optics.
The COVID Impact And Recovery
COVID-19 continues to challenge India. The government
ordered a 21-day lockdown on March 24, 2020, which
was subsequently extended. The country continues to
progress through a gradual reopening. Air and rail
services were suspended, cutting demand to virtually
nothing in the depth of the lockdown; this was reflected in
YTRA’s 1Q:F21 adjusted revenue of $3.1 million,
compared to $15.5 million sequentially, and $24.8 million
year over year.
Domestic air travel began to resume in July, although it
was limited to regions with lower infection loads.
Management noted approximately 20% of domestic air
travel capacity was back online as of early September.
It is difficult to predict when corporate and leisure travel
will return to prior volumes as there are divergent trends.
It took 22 months for air travel to return to where it was
prior to the 9/11 attacks, but broadband internet was still
in the early days of proliferation and remote work was not
nearly as feasible or accepted. Corporate risk
assessments may take longer to allow business travel to
resume in this era. On the other hand, India’s rapidly
expanding consumer class may opt for leisure travel as
has been the case in other emerging economies.
Recent Results
YTRA reports under the International Financial Reporting
Standard (IFRS) and its primary reporting currency is the Indian
Rupee. The company translates results to the US dollar
quarterly at a spot rate on the last day of the quarter; similarly,
full year reporting is translated to USD at the same spot rate as
the fourth quarter. The sum of reported translated quarters may
not be equivalent to the reported full year translation because
they are not calculated at the same translation rate.
We use adjusted revenue in place of IFRS revenue, in line with
YTRA’s reporting, which creates a more apples to apples
comparison to GAAP revenue reporting for travel companies.
Adjusted revenue treats commission from travel packages as
revenue instead of the gross booking, while also adding back
customer acquisition expenses; there is no difference in
earnings calculated using revenue and adjusted revenue.
YTRA’s fiscal year end is March. The company reported
a 1Q:F21 year-over-year revenue decline of 87% and a
sequential revenue decline of 80%, as domestic and
YATRA ONLINE, INC.
Sidoti & Company, LLC
5
global travel was shut down due to the global pandemic.
Total operating expenses declined to $9.1 million from
$18.4 million sequentially and $38.5 million in the prior-
year period. The company reported about $2.2 million in
one-time charges related to the terminated merger
agreement with Ebix. The 1Q:F21 adjusted EBITDA of
($4.1) million compared to ($3.8) million sequentially and
($3.0) million year over year. The severe demand impact
resulting from the pandemic was unusual, but we think
the cost control measures put in place are encouraging.
Earnings Outlook
We translate our estimates to USD uniformly at a spot
rate, and our estimates may be adjusted in subsequent
reports if the exchange rate changes. If we publish a
report after the end of a quarter but before the quarter is
reported, we will freeze the translation rate just for the to
be reported quarter.
For F2021, we anticipate adjusted revenue of $23.1
million, a decline of 71% compared to F2020 owing to the
impact of COVID-19. We expect sequential growth in
adjusted revenue each quarter, with 1Q:F21 the low point
of the year. Management discussed some 20% of
capacity returning to domestic air travel as of early
September and a slower rebound in international air
travel. Business travel is expected to remain muted. We
model operating expenses of $42.9 million, down 60%,
nearly in line with revenue. We project an adjusted
EBITDA of -$6.5 million, which compares to -$1.6 million
in F2020.
For F2022, we estimate adjusted revenue of $55.5
million, up 140% year over year, but still down from $79.4
million in F2020. Note that F2020 results were
diminished by the Ebix merger agreement before COVID-
19 partially impacted 4Q:F20. We model expenses
rebound 58% year over year to $67 million in F2022, but
still down from $106.7 million in F2020 as we expect
Yatra will maintain elements of its leaner operating
structure. We think that as revenue rebounds, the
company will reach positive adjusted EBITDA in 4Q:F21,
maintained throughout F2022, and positive net income for
the full year F2022. A slower recovery in revenue would
likely result in a slower rebound in spending.
Balance Sheet And Cash Flow
YTRA ended 1Q:F21 with $39 million ($0.64 per share) in
cash and equivalents net of debt (about $48.6 million
gross), and the company disclosed $33 million in cash
and equivalents at the end of August 2020 in an early-
September investor presentation; the change was largely
an earn out payment from a prior acquisition. YTRA’s
debt is comprised primarily of invoice discounting,
essentially funding receivables. The company reduced
fixed costs to about $14.4 million annualized ($1.2 million
per month) to preserve liquidity during the pandemic and
established a breakeven level of an estimated $45 million
in annual revenue. We think Yatra will reach breakeven
revenue in 1Q:F22, assuming our estimates and post-
COVID recovery in travel volumes stand.
We model free cash outflow of $6.8 million ($0.12 per
share) in F2021 and free cash flow of $4.8 million ($0.08
per share) in F2022. We model a cash outflow from
financing activities in F2022 results in a $0.2 million
decline in cash and equivalents, but that YTRA will end
F2022 with about $14.7 million ($0.24 per share) in net
cash.
Risks
The COVID-19 pandemic dramatically reduced air travel,
and the recovery timeline is uncertain, particularly as
infections in India continue to grow. Yatra significantly
reduced costs and India has allowed about 20% of domestic
air capacity to date. With vaccines tentatively expected in
early 2021, we think travel will begin to reset to relatively
normal levels by the end of 2021.
The OTA market in India is highly competitive and the
leisure market is prone to disruption. The most notable
recurring cost to an online travel business is customer
acquisition spending. Companies that can direct traffic at
lower costs, such as a search engine, can pose significant
challenges to standalone companies like Yatra.
YTRA has reported years of cash burn and losses.
However, we think the mix shift toward corporate affords the
company a more sustainable customer acquisition model
that yielded a profit just prior to COVID-19 impacting
revenue. Still, if YTRA does not turn the cash flow corner by
the end of F2022, we cannot rule out a dilutive capital raise.
YTRA received a delisting notice from NASDAQ. With
shares trading below $1.00, the company has an initial
period of until January 25, 2021 to regain compliance.
Given the extraordinary circumstances around COVID-19
and the likely business recovery in the coming quarters, we
speculate that leniency may be justified.
Valuation
YTRA stock currently trades around 0.7x F2022E adjusted
revenue and about 0.5x EV/F2022E adjusted revenue,
assuming net cash of $14 million at the end of F2022. The
shares trade around 0.8x the $50 million revenue level
attainable at the current expense level. In other words, we
think as travel returns to new normal levels, post-pandemic,
YTRA has the capacity to handle about $50 million of
revenue at the current reduced spending level. Peers trade
at a median of 2.2x trailing twelve-month revenue, which
captures part of the COVID impact; historically, peers have
traded at a median of about 4.2x EV/TTM revenue and
YTRA stock has traded at 1.2x EV/TTT revenue. Yatra’s
business faced a difficult sequence between restrictions
imposed by the terminated merger agreement with Ebix
followed by the pandemic, which obscured the business’ real
potential for five quarters. With air travel in India beginning
to return, we think YTRA’s business potential and efficiency
in corporate travel will become more apparent to investors.
We apply a multiple of about 1.2x our F2022E revenue to
arrive at a $1.50 price target. We think the multiple fairly
reflects the selected valuation horizon.

YATRA ONLINE, INC.
Sidoti & Company, LLC
6
Table 1: Yatra Online Income Statement
($ in millions, except per share data)
F2018 June Sept Dec Mar F2019 June Sept Dec Mar F2020 JuneA SeptE DecE MarE F2021E JuneE SeptE DecE MarE F2022E
Adjusted revenue $113.8 $29.8 $28.9 $33.5 $35.3 $128.8 $24.8 $21.5 $22.2 $15.5 $79.4 $3.1 $3.2 $7.1 $9.6 $23.1 $11.0 $12.0 $14.4 $18.0 $55.5
Air ticket revenue
77.0
18.3
18.9
20.8
23.6
82.5
16.6
14.6
14.3
10.1
52.5
2.3
2.4
5.1
6.8
16.5
7.5
8.2
9.8
12.3
37.8
Hotel and package revenue 26.1 7.7 5.9 6.9 6.4 27.2 3.4 2.3 3.0 2.2 10.4 0.2 0.5 1.4 2.0 4.1 2.2 2.5 3.0 3.7 11.3
Total revenue 188.1 41.5 28.3 31.7 32.7 135.3 32.7 24.9 27.6 17.0 96.3 2.5 3.8 8.7 11.8 26.9 13.7 14.9 18.0 22.5 69.1
Rendering of services
180.4
39.4
25.1
27.8
28.4
121.7
28.8
21.4
23.4
14.5
83.1
2.2
3.6
8.1
11.0
25.0
12.4
13.5
16.3
20.3
62.5
Other revenue 7.7 2.0 3.3 3.9 4.2 13.6 3.8 3.5 4.2 2.5 13.2 0.3 0.2 0.6 0.7 1.9 1.3 1.3 1.8 2.2 6.5
Other income 1.4 1.2 0.4 1.5 0.7 3.8 0.4 0.7 0.4 0.7 2.1 0.4 0.1 0.1 0.1 0.8 0.1 0.1 0.1 0.1 0.5
Service cost 75.7 23.7 11.7 13.5 12.7 61.9 14.6 9.1 11.3 6.2 38.8 0.0 1.6 3.6 4.8 10.0 5.5 6.0 7.2 9.0 27.7
Personnel expenses 44.6 11.5 9.1 8.5 7.4 36.9 7.4 6.6 6.0 4.8 23.6 2.3 2.7 3.4 4.1 12.5 4.7 4.7 4.7 5.4 19.7
Marketing and sales promotion
63.8
4.2
2.7
2.4
2.3
11.7
1.2
0.7
0.4
0.5
2.6
0.1
0.3
0.3
0.3
1.0
0.4
0.5
0.5
0.5
1.9
Other operating expenses
50.5
11.7
16.2
11.5
17.3
57.5
12.9
10.1
7.3
1.8
30.0
4.7
2.0
2.0
2.0
10.9
2.0
2.7
2.7
3.4
10.8
Depreciation and amortization 6.5 1.9 1.9 2.0 2.5 8.4 2.4 2.4 2.5 2.1 8.8 2.1 2.2 2.2 2.2 8.6 2.0 2.0 2.0 2.0 7.8
Goodwill impairment
0.0
0.0
0.0
0.0
0.0
0.0
0.0
0.0
0.0
2.9
2.9
0.0
0.0
0.0
0.0
0.0
0.0
0.0
0.0
0.0
0.0
Total expenses
241.1
53.0
41.6
37.8
42.2
176.4
38.5
28.9
27.5
18.4
106.7
9.1
8.8
11.4
13.4
42.9
14.7
15.9
17.1
20.3
68.0
Income from operations
(51.6)
(10.3)
(12.9)
(4.7)
(8.8)
(37.3)
(5.4)
(3.2)
0.4
(0.7)
(8.3)
(6.2)
(4.8)
(2.6)
(1.5)
(15.2)
(0.8)
(0.9)
1.1
2.3
1.6
Adjusted EBITDA
(29.3)
(5.9)
(3.2)
(2.2)
(6.3)
(17.8)
(3.0)
(0.8)
2.9
(3.8)
(1.6)
(4.1)
(2.6)
(0.4)
0.7
(6.5)
1.3
1.2
3.2
4.4
10.0
Share of loss of joint venture
(0.2)
(0.1)
(0.0)
(0.0)
(0.0)
(0.2)
(0.0)
(0.0)
(0.1)
(0.0)
(0.1)
(0.0)
(0.1)
(0.0)
(0.0)
(0.1)
(0.0)
(0.0)
(0.0)
(0.0)
(0.1)
Finance income
1.4
0.1
0.2
0.2
0.2
0.6
0.4
0.2
0.2
0.1
0.8
0.4
0.0
0.0
0.0
0.4
0.0
0.0
0.0
0.0
0.0
Finance cost (2.4) (0.7) (0.6) (0.9) (1.6) (3.8) (0.7) (0.7) (0.7) (0.6) (2.6) (0.5) (0.5) (0.5) (0.5) (2.1) (0.5) (0.5) (0.5) (0.5) (2.2)
Change in fair value of warrants
(8.7)
6.4
11.6
7.6
(2.0)
24.1
0.7
(1.7)
1.9
(0.8)
0.0
5.3
0.0
0.0
0.0
5.4
0.0
0.0
0.0
0.0
0.0
Income before taxes
(61.4)
(4.5)
(1.8)
2.2
(12.4)
(16.6)
(5.1)
(5.5)
1.7
(2.0)
(10.2)
(1.1)
(5.4)
(3.1)
(2.0)
(11.6)
(1.4)
(1.5)
0.5
1.8
(0.6)
Tax expense (0.9) (0.0) (0.4) (0.2) (0.0) (0.7) (0.2) (0.1) (0.1) (0.5) (0.9) 0.0 (0.1) (0.1) (0.1) (0.4) (0.1) (0.1) (0.1) (0.1) (0.5)
Net income
(62.2)
(4.6)
(2.2)
2.0
(12.4)
(17.3)
(5.3)
(5.7)
1.6
(2.5)
(11.1)
(1.1)
(5.5)
(3.3)
(2.2)
(12.1)
(1.5)
(1.6)
0.4
1.6
(1.2)
Adjusted net income
(37.9)
(8.5)
(6.0)
(5.1)
(10.3)
(30.3)
(6.0)
(3.9)
(0.3)
(3.9)
(13.3)
(6.3)
(5.5)
(3.3)
(2.2)
(17.4)
(1.4)
(1.5)
0.5
1.8
(0.6)
EPS Basic
($1.79)
($0.12)
($0.04)
$0.04
($0.26)
($0.38)
($0.11)
($0.12)
$0.03
($0.05)
($0.24)
($0.02)
($0.09)
($0.05)
($0.04)
($0.20)
($0.02)
($0.03)
$0.01
$0.03
($0.02)
EPS Diluted ($1.79) ($0.12) ($0.04) $0.04 ($0.26) ($0.37) ($0.11) ($0.12) $0.03 ($0.05) ($0.24) ($0.02) ($0.09) ($0.05) ($0.04) ($0.20) ($0.02) ($0.03) $0.01 $0.03 ($0.02)
Adjusted EPS
($1.10)
($0.23)
($0.13)
($0.11)
($0.22)
($0.68)
($0.13)
($0.08)
($0.01)
($0.08)
($0.29)
($0.13)
($0.09)
($0.05)
($0.04)
($0.30)
($0.02)
($0.02)
$0.01
$0.03
($0.01)
Basic shares outstanding 34.3 35.7 45.8 46.2 46.5 43.5 46.5 46.5 46.5 46.5 46.5 47.7 61.0 61.0 61.0 57.7 61.5 61.5 61.5 61.5 61.5
Diluted shares outstanding
34.3
36.4
46.6
47.3
46.5
44.3
46.5
46.5
47.2
46.5
46.5
48.5
61.0
61.0
61.0
57.9
61.5
61.5
61.5
61.5
61.5
% Change (Y-o-Y)
Adjusted revenue
64.8%
17.8%
11.4%
7.0%
10.6%
13.2%
-16.9%
-25.5%
-33.6%
-56.2%
-38.4%
-87.4%
-85.2%
-68.0%
-37.9%
-70.9%
253.1%
277.2%
102.6%
87.3%
140.0%
Air ticket
57.9%
11.4%
3.0%
-3.1%
11.4%
7.2%
-9.2%
-23.0%
-31.2%
-57.3%
-36.4%
-86.5%
-83.7%
-64.5%
-32.8%
-68.5%
230.8%
245.7%
93.6%
81.5%
128.5%
Hotel and package 70.5% 13.7% 20.4% 1.3% -17.3% 4.3% -55.7% -60.2% -56.8% -64.8% -61.7% -95.4% -76.9% -54.8% -9.5% -60.7% 1318.5% 353.8% 117.8% 81.5% 177.1%
Total expenses
60.8%
-14.3%
-13.8%
-40.1%
-39.1%
-26.8%
-27.4%
-30.7%
-27.3%
-56.4%
-39.5%
-76.3%
-69.6%
-58.5%
-27.2%
-59.8%
60.4%
81.3%
49.8%
51.5%
58.3%
EBIT
107.7%
-31.4%
46.3%
-52.7%
-51.3%
-27.8%
-47.5%
-74.9%
-108.7%
-92.1%
-77.8%
14.9%
48.1%
-733.8%
113.3%
83.7%
NM
NM
NM
NM
NM
Adjusted EBITDA 119.8% -37.0% -27.1% -63.5% -34.5% -39.5% -49.8% -74.5% -229.6% -39.7% -90.9% 37.2% 218.9% -114.3% -117.9% 305.8% NM NM NM NM NM
% of adjusted revenue
Air
67.7%
61.5%
65.5%
62.1%
66.8%
64.1%
67.2%
67.7%
64.4%
65.1%
66.2%
72.0%
74.5%
71.4%
70.4%
71.5%
67.5%
68.2%
68.2%
68.2%
68.1%
Hotel and package
22.9%
25.9%
20.4%
20.7%
18.0%
21.1%
13.8%
10.9%
13.5%
14.5%
13.1%
5.0%
17.0%
19.0%
21.1%
17.7%
20.2%
20.5%
20.5%
20.5%
20.4%
Service cost 66.6% 79.5% 40.3% 40.2% 36.0% 48.1% 59.0% 42.1% 50.9% 40.0% 48.9% 0.0% 50.0% 50.0% 50.0% 43.1% 50.0% 50.0% 50.0% 50.0% 50.0%
Personnel expenses
39.2%
38.5%
31.5%
25.5%
20.9%
28.6%
30.0%
30.9%
27.1%
31.3%
29.7%
72.6%
85.1%
47.6%
42.3%
54.0%
42.9%
39.5%
32.9%
30.1%
35.4%
Marketing and sales promotion
56.1%
14.0%
9.5%
7.1%
6.5%
9.1%
4.8%
3.0%
1.7%
3.4%
3.3%
2.5%
8.5%
3.8%
3.5%
4.2%
3.7%
3.9%
3.3%
3.0%
3.4%
Other operating expenses 44.4% 39.4% 56.2% 34.2% 48.9% 44.6% 51.9% 46.9% 32.9% 11.7% 37.8% 149.6% 63.8% 28.6% 21.1% 47.1% 18.4% 22.6% 18.8% 18.8% 19.5%
EBIT
5.7%
6.5%
6.6%
5.9%
7.1%
6.5%
9.6%
11.1%
11.1%
13.5%
11.1%
67.5%
67.8%
30.4%
22.4%
37.4%
17.7%
16.3%
13.6%
10.9%
14.1%
Adjusted EBITDA
-25.8%
-20.0%
-11.1%
-6.6%
-17.7%
-13.8%
-12.1%
-3.8%
12.9%
-24.4%
-2.0%
-131.0%
-82.2%
-5.8%
7.0%
-28.3%
11.4%
9.9%
21.9%
24.4%
18.0%
Net margin -54.7% -15.3% -7.6% 5.9% -35.2% -13.4% -21.5% -26.2% 7.1% -16.0% -14.0% -33.6% -172.9% -46.2% -22.7% -52.1% -13.9% -13.4% 2.5% 9.0% -2.1%
Sources: Company reports and Sidoti & Company, LLC estimates
Notes:
1. Yatra provides a courtesy fx translation from INR to USD as of the end of the reported quarter and year. The sum of translated quarters may not equal the translated year, which is how we derive full year results.
2. We will adjust estimate quarters for changes in the fx rate until the final day of an unreported quarter, when we will fix it to the snap rate that day.
3. Adjusted net income removes non-cash and one-time elements, such as stock-based compensation and change in fair value of warrants.

YATRA ONLINE, INC.
Sidoti & Company, LLC
7
Table 2: Yatra Cash Flow Statement
($ in millions, except per share data)
F2017
F2018
F2019
F2020
F2021E
F2022E
Loss before tax
(91.1)
(61.4)
(16.6)
(10.2)
(11.6)
(0.6)
Depreciation and amortization 4.3 6.5 8.4 8.8 8.6 7.8
Listing and related expenses 62.9 0.0 0.0 0.0 0.0 0.0
Contingent dividend
0.0
(0.0)
0.0
0.0
0.0
0.0
Gain on termination of leases
0.0
0.0
0.0
(0.4)
0.0
0.0
Change in fair value of contingent consideration
0.0
4.5
7.0
(5.2)
0.0
0.0
Finance income (2.1) (1.3) (0.6) (0.4) (0.4) (0.4)
Finance costs 1.8 1.9 2.1 2.2 2.3 2.3
Impairment of goodwill
0.0
0.0
0.0
2.9
0.0
0.0
Unrealized foreign exchange loss/(gain)
0.1
(0.1)
(0.2)
(0.1)
0.0
0.0
Loss/(gain) on disposal of property, plant and equipment
(0.0)
(0.0)
(0.1)
(0.1)
0.0
0.0
Change in fair value of warrants (3.6) 8.7 (24.1) (0.0) (5.4) 0.0
Excess provision written back (0.7) (0.7) (0.5) (0.8) (0.4) (0.4)
Advances/provision written off 0.2 0.2 0.1 0.2 0.1 0.1
Trade and other receivables provision / written-off
1.2
1.8
4.4
1.2
1.4
1.4
Share of loss of a joint venture
0.1
0.2
0.2
0.1
0.0
0.0
Share-based payment expense
9.1
11.2
4.1
0.1
0.1
0.1
Change in working capital (6.8) 14.8 (32.1) (5.8) 1.5 (2.6)
Increase in trade and other receivables (13.7) (12.7) (19.0) 33.0 12.9 (22.2)
Decrease in inventories
(0.0)
(0.1)
0.3
0.0
0.0
0.0
Increase in trade and other payables
7.9
29.2
(13.3)
(38.3)
(11.4)
19.6
Direct taxes paid (net of refunds)
(0.9)
(1.6)
0.0
(0.5)
0.0
0.0
Net cash used in operating activities (24.6) (13.5) (47.7) (7.3) (4.0) 7.6
Acquisition of business
0.0
(5.4)
(3.7)
0.0
(0.7)
0.0
Investment in joint venture
(0.0)
0.0
0.0
(0.0)
0.0
0.0
Purchase of property, plant and equipment
(1.0)
(3.4)
(0.4)
(0.2)
(0.1)
(0.1)
Proceeds from sales of property, plant and equipment 0.0 0.0 0.2 0.3 0.0 0.0
Purchase of in tangible assets (6.3) (5.4) (5.7) (2.7) (2.7) (2.7)
Investment in term deposits (159.0) (80.8) (38.1) (14.5) 0.0 0.0
Proceeds from term deposits
129.4
113.7
38.2
18.3
0.0
0.0
Interest received
0.2
0.1
0.2
0.1
0.1
0.1
Net cash used in investing activities
(36.8)
18.8
(9.4)
1.3
(3.4)
(2.7)
Payment of principal portion of lease liabilities 0.0 0.0 0.0 (0.6) (0.5) (0.5)
Payment of interest portion of lease liabilities
0.0
0.0
0.0
(0.7)
(0.7)
(0.7)
Issuance of shares pursuant to Business Combination
61.3
0.0
0.0
0.0
0.0
0.0
Purchase of own shares
(0.2)
0.0
0.0
0.0
0.0
0.0
Proceeds from issue of share capital 25.9 0.1 51.5 0.0 10.5 0.0
Acquisition by non controlling interest 0.0 0.0 0.0 0.0 0.0 0.0
Transaction with equity shareholders
0.0
(1.7)
0.0
0.0
0.0
0.0
Proceeds from borrowings
0.0
21.5
0.0
0.0
0.0
0.0
Repayment of borrowings
(6.7)
(9.2)
(7.3)
(4.5)
(2.7)
(2.7)
Repayment of vehicle loan (0.2) (0.3) (0.4) (0.3) (0.3) (0.3)
Repayment from invoice discounting 0.0 0.0 0.0 12.2 0.0 0.0
Repayment of invoice discounting 0.0 0.0 0.0 (8.8) 0.0 0.0
Interest paid on term loan
(0.5)
(1.0)
(1.0)
(0.2)
(0.2)
(0.2)
Interest paid on vehicle loan
(0.1)
(0.1)
(0.1)
(0.0)
0.0
0.0
Interest paid on bank overdraft
(0.2)
(0.6)
(0.8)
(1.2)
(0.7)
(0.7)
Net cash from financing activities 79.3 8.9 42.0 (4.4) 5.5 (5.0)
Net increase (decrease) in cash and equivalents
18.0
14.1
(15.1)
(10.4)
(1.9)
(0.2)
Effect of exchange differences on cash and equivalents
(0.3)
0.2
2.7
0.9
0.0
0.0
Cash and equivalents beginning of year
6.0
23.5
35.6
18.1
8.8
15.2
Cash and equivalents end of year 23.7 37.9 19.7 8.6 15.2 15.0
FCF (Outflow)
(31.9)
(22.4)
(53.8)
(10.2)
(6.8)
4.8
FCF (Outflow) per share
($1.52)
($0.65)
($1.22)
($0.22)
($0.12)
$0.08
INR to USD translation rate 65.1 65.1 69.2 75.4 73.8 73.8
Sources: Company reports and Sidoti & Company, LLC estimates
Notes: Results are translated from Indian Rupee to USD at the rate corresponding to the year.

YATRA ONLINE, INC.
Sidoti & Company, LLC
8
Table 3: Yatra Online Balance Sheet
($ in millions, except per share data)
June
Sept
Dec
F2019
June
Sept
Dec
F2020
JuneA
SeptE
DecE
F2021E
F2022E
Property, plant, and equipment
3.1
2.9
2.7
2.2
1.8
1.5
1.2
0.8
0.7
0.5
0.3
0.1
0.1
Right-of-use assets 0.0 0.0 0.0 0.0 2.4 2.2 8.1 7.1 6.8 6.8 6.8 6.8 6.8
Intangible assets and goodwill 30.9 32.2 32.3 32.3 31.0 29.5 26.6 22.6 21.7 20.4 19.1 17.9 16.1
Prepayments and other assets
0.1
0.1
0.1
0.1
0.1
0.0
0.0
0.0
0.0
0.0
0.0
0.0
0.0
Other financial assets
0.8
0.6
0.5
0.4
0.4
0.3
0.3
0.4
0.4
0.4
0.4
0.4
0.4
Term deposits 0.0 0.0 0.0 0.3 0.3 0.3 0.3 0.0 0.0 0.0 0.0 0.0 0.0
Other non financial assets
2.6
2.7
2.7
3.7
3.4
3.5
3.0
3.0
3.0
3.0
3.0
3.0
3.0
Deferred tax asset
1.6
1.4
1.4
1.8
1.7
1.8
1.8
1.2
1.3
1.3
1.3
1.3
1.3
Total non-current assets
39.1
40.1
39.8
40.9
41.2
39.0
41.2
35.2
33.9
32.4
31.0
29.5
27.7
Inventories 0.1 0.2 0.1 0.1 0.1 0.1 0.0 0.0 0.0 0.0 0.0 0.0 0.0
Trade and other receivables
60.9
69.1
61.7
71.2
69.3
57.2
49.3
31.4
15.8
9.6
14.2
19.2
41.4
Prepayments and other assets
13.5
14.7
11.1
13.0
11.0
11.5
10.4
11.3
9.0
9.0
9.0
9.0
9.0
Income tax receivable 5.2 6.0 6.7 7.2 5.8 6.3 6.1 6.4 5.1 5.1 5.1 5.1 5.1
Other current financial assets 0.6 1.0 4.6 3.4 3.6 4.2 4.2 3.6 1.8 1.8 1.8 1.8 1.8
Other non financial assets
0.0
0.0
0.0
0.0
0.0
0.0
0.0
0.0
0.0
0.0
0.0
0.0
0.0
Term deposits
12.0
14.7
14.8
14.5
15.0
10.0
11.5
10.0
9.4
9.4
9.4
9.4
9.4
Cash and cash equivalents 69.2 56.5 40.0 31.2 15.0 17.8 12.7 18.1 40.3 27.0 20.6 15.2 15.0
Total current assets
161.7
162.1
139.1
140.5
119.8
106.9
94.3
81.0
81.5
62.0
60.2
59.9
81.9
Total assets
200.8
202.2
178.8
181.5
161.0
145.9
135.5
116.2
115.4
94.4
91.2
89.4
109.6
Total shareholders' equity 42.8 43.7 45.7 34.4 28.1 22.2 22.6 20.0 29.8 23.2 19.6 17.0 17.7
Borrowings
3.4
2.1
0.8
0.4
2.4
2.1
7.6
6.4
6.4
6.4
6.4
6.4
6.4
Trade and other payables 0.0 0.0 0.0 0.0 0.0 0.3 0.3 0.4 0.4 0.4 0.4 0.4 0.4
Deferred tax liability
0.6
0.6
0.6
0.6
0.6
0.6
0.5
0.5
0.5
0.5
0.5
0.5
0.5
Employee benefits
1.0
1.0
1.1
1.2
1.2
1.2
1.0
0.8
0.7
0.7
0.7
0.7
0.7
Deferred revenue
2.7
0.0
0.0
1.4
2.3
1.2
2.5
3.1
3.1
0.5
1.1
1.4
2.7
Other financial liabilities 0.0 0.0 0.0 0.0 0.0 0.0 0.0 0.0 0.0 0.0 0.0 0.0 0.0
Other non-financial liabilities
0.1
0.1
0.1
0.0
0.0
0.0
0.0
0.0
0.0
0.0
0.0
0.0
0.0
Total non-current liabilities
7.8
3.8
2.6
3.6
6.6
5.3
11.9
11.1
11.0
8.4
9.0
9.4
10.6
Borrowings 12.3 18.0 18.1 16.7 15.1 13.5 17.3 13.8 3.4 3.4 3.4 3.4 3.4
Trade and other payables
68.8
72.7
61.6
76.1
64.0
58.1
44.8
37.9
40.5
28.7
28.5
28.9
45.1
Employee benefits
1.2
1.3
1.5
1.4
1.4
1.4
1.2
1.1
1.0
1.0
1.0
1.0
1.0
Deferred revenue 14.4 14.6 11.5 8.4 5.9 5.4 2.5 1.7 1.9 1.9 1.9 1.9 4.1
Income taxes payable
0.0
0.0
0.0
0.1
0.1
0.0
0.0
0.0
0.0
0.0
0.0
0.0
0.0
Other financial liabilities
36.4
32.1
23.4
25.4
24.7
25.5
22.2
17.8
12.8
12.8
12.8
12.8
12.8
Other current liabilities
17.0
16.1
14.6
15.4
15.1
14.5
12.9
12.7
15.0
15.0
15.0
15.0
15.0
Total current liabilities 150.2 154.7 130.6 143.5 126.3 118.4 100.9 85.0 74.6 62.8 62.6 63.0 81.4
Total liabilities
157.9
158.5
133.3
147.1
132.8
123.8
112.8
96.1
85.6
71.2
71.6
72.4
92.0
Total equity and liabilities
200.8
202.2
179.0
181.5
161.0
145.9
135.5
116.2
115.4
94.4
91.2
89.4
109.6
Metrics
Net cash
65.5
51.2
35.9
28.8
12.5
12.1
(0.6)
7.9
40.0
26.7
20.2
14.9
14.7
Net cash per share
$1.41
$1.08
$0.77
$0.65
$0.27
$0.26
($0.01)
$0.17
$0.66
$0.44
$0.33
$0.26
$0.24
LT Debt to Total Capital 7.4% 4.5% 1.8% 1.0% 7.9% 8.7% 25.0% 24.3% 17.6% 21.5% 24.5% 27.2% 26.5%
Return on equity (ttm)
NM
NM
NM
NM
NM
NM
NM
NM
NM
NM
NM
NM
NM
INR to USD translation rate
72.5
69.6
69.2
69.2
70.6
71.4
75.4
75.4
73.8
73.8
73.8
73.8
73.8
Sources: Company reports and Sidoti & Company, LLC estimates
Notes:
1. Yatra provides a courtesy fx translation from INR to USD as of the end of the reported quarter and year. The sum of translated quarters may not equal the translated year, which is how we derive full year results.
Appendix
Required Disclosures
Sidoti & Company, LLC
9
Required Disclosures
Yatra Online, Inc. (YTRA-$0.70) NR Price Target: $1.50 Risk Rating: H
Risks
The COVID-19 pandemic dramatically reduced air travel, and the recovery timeline is uncertain, particularly as infections
in India continue to grow. Yatra significantly reduced costs and India has allowed about 20% of domestic air capacity to date.
With vaccines tentatively expected in early 2021, we think travel will begin to reset to relatively normal levels by the end of 2021.
The OTA market in India is highly competitive and the leisure market is prone to disruption. The most notable recurring
cost to an online travel business is customer acquisition spending. Companies that can direct traffic at lower costs, such as a
search engine, can pose significant challenges to standalone companies like Yatra.
YTRA has reported years of cash burn and losses. However, we think the mix shift toward corporate affords the company a
more sustainable customer acquisition model that yielded a profit just prior to COVID-19 impacting revenue. Still, if YTRA does
not turn the cash flow corner by the end of F2022, we cannot rule out a dilutive capital raise.
YTRA received a delisting notice from NASDAQ. With shares trading below $1.00, the company has an initial period of until
January 25, 2021 to regain compliance. Given the extraordinary circumstances around COVID-19 and the likely business
recovery in the coming quarters, we speculate that leniency may be justified.
Valuation
YTRA stock currently trades around 0.7x F2022E adjusted revenue and about 0.5x EV/F2022E adjusted revenue, assuming net
cash of $14 million at the end of F2022. The shares trade around 0.8x the $50 million revenue level attainable at the current
expense level. In other words, we think as travel returns to new normal levels, post-pandemic, YTRA has the capacity to handle
about $50 million of revenue at the current reduced spending level. Peers trade at a median of 2.2x trailing twelve-month
revenue, which captures part of the COVID impact; historically, peers have traded at a median of about 4.2x EV/TTM revenue
and YTRA stock has traded at 1.2x EV/TTT revenue. Yatra’s business faced a difficult sequence between restrictions imposed
by the terminated merger agreement with Ebix followed by the pandemic, which obscured the business’ real potential for five
quarters. With air travel in India beginning to return, we think YTRA’s business potential and efficiency in corporate travel will
become more apparent to investors. We apply a multiple of about 1.2x our F2022E revenue to arrive at a $1.50 price target. We
think the multiple fairly reflects the selected valuation horizon.
Sidoti & Company. Sidoti & Company, LLC is a licensed broker/dealer, and publishes research reports about some of the
securities it follows. All research published by Sidoti & Company, LLC is based on public information, or on information from the
company discussed in the report that that company is required to promptly make public . This report was prepared for market
professionals and institutional investor customers. Market professionals and institutional investors should consider this report as
only one factor in making their investment decisions. This report is for information purposes only and is not intended as an offer
to sell or a solicitation to buy securities. This research report is not a substitute for the exercise of your independent judgment.

Appendix
Sidoti & Company, LLC
10
Information contained herein is based on sources we believe to be reliable but we do not guarantee their accuracy. The stock
rating on this report reflects the analyst’s recommendation based on a 12-month period. It should be presumed that the analyst
who authored this report has had discussions with the subject company to ensure factual accuracy prior to publication.
Sidoti does NOT own securities of the issuers described herein, and Sidoti does not make a market in any securities. Sidoti does
not engage in, or receive compensation from, any investment banking or corporate finance-related activities with the company
discussed in the report. Sidoti’s contracts with issuers protect Sidoti’s full editorial control of all research, timing of release of
reports, and release from liability for negative reports. To ensure further independence, the company discussed in the report has
agreed to a minimum coverage term of one Initiation Report and three Update Reports, which that company cannot unilaterally
terminate earlier. Sidoti & Company, LLC takes steps to ensure analyst independence including setting fees in advance and
utilizing analysts who must abide by the CFA Institute Code of Ethics and Standards of Professional Conduct. Each Sidoti &
Company, LLC analyst has full discretion on the rating and revenue target based on his or her own due diligence. Analysts are
paid in part based on overall profitability of Sidoti & Company, LLC. Such profitability is derived from a variety of sources and
includes payments received from issuers of securities covered by Sidoti & Company, LLC for services described below. No part
of analyst compensation was, or will be, directly or indirectly, related to the specific recommendations or views expressed in any
report or article. All issuers to be considered for research obtain the approval of a stock selection committee comprised of the
Director of Research, the Chief Compliance Officer, and an independent outside person for screening applicants.
Sidoti Company Sponsored Research Rating System The Sidoti & Company, LLC Company Sponsored Research rating
system consists of “Moderately Risky” (M) and “Highly Risky” (H) ratings. “Moderately Risky” suggests companies, that while still
subject to relatively high price volatility, are characterized by more stable and predictable cash flow, a more established operating
history, and an operating environment that is somewhat less competitive with a potential for loss of principal. “Highly Risky”
suggests high risk equities of companies with a short or unprofitable operating history, limited or less predictable revenues, very
high risk associated with success, significant financial or legal issues, or a substantial risk/loss of principal. As of 09/29/20,
Company Sponsored Research provides research on 23 companies, of which 18 (78%) are rated Moderately Risky and 5 (21%)
are rated Highly Risky. Earnings targets and opinions concerning the composition of market sectors included in this report
reflect analyst judgments as of this date and are subject to change without notice. A risk to our earnings targets is that the
analyst’s estimates or forecasts may not be met. This report contains forward-looking statements, which involve risks and
uncertainties. Actual results may differ significantly from such forward-looking statements. Factors that may cause such
differences include, but are not limited to, those discussed in the “Risk Factors” section in the issuer’s SEC filings available in
electronic format through SEC Edgar filings at www.sec.gov.
Every company in the Microcap sector bears certain inherent risks and Sidoti & Company, LLC will not provide any company
subject to those risks with a rating below moderate because stock in the Microcap segment of the market have many risks that
are not as prevalent in Large-Cap, Blue Chips, or even Small-Cap stocks. Often it is these risks that cause Microcap stocks to
trade at discounts to their peers. The most common of these risks is liquidity risk, which is typically caused by small trading floats
and very low trading volume which can lead to large spreads and high volatility in stock price. In addition, Microcaps tend to have
significant company specific risks that contribute to lower valuations. Investors need to be aware of the higher probability of
financial default and higher degree of financial distress inherent in the Microcap segment of the market.
Sidoti & Company policy is to update research reports as and when the Research Analyst and Research Management deem
appropriate, based on developments with the issuer, the sector, or the market that may have a material impact on the research
views or opinions stated therein. In addition, certain Research publications are intended to be updated on a regular periodic basis
(weekly/monthly/quarterly/annual) and will ordinarily be updated with that frequency, unless the Research Analyst and Research
Management determine that a different publication schedule is appropriate based on current conditions.
Sidoti & Company Research does not provide individually tailored investment advice. Sidoti & Company Research has been
prepared without regard to the circumstances and objectives of those who receive it. Sidoti & Company recommends that
investors independently evaluate particular investments and strategies, and encourages investors to seek the advice of a
financial adviser. The appropriateness of an investment or strategy will depend on an investor's circumstances and objectives.
The securities, instruments, or strategies discussed in Sidoti & Company Research may not be suitable for all investors, and
certain investors may not be eligible to purchase or participate in some or all of them. Sidoti & Company Research is not an offer
to buy or sell or the solicitation of an offer to buy or sell any security/instrument or to participate in any particular trading strategy.
The value of and income from your investments may vary because of changes in interest rates, foreign exchange rates, default
rates, prepayment rates, securities/instruments prices, market indexes, operational or financial conditions of companies or other
factors. There may be time limitations on the exercise of options or other rights in securities/instruments transactions. Past
performance is not necessarily a guide to future performance. Estimates of future performance are based on assumptions that
may not be realized. If provided, and unless otherwise stated, the closing price on the cover page is that of the primary exchange
for the subject company's securities/instruments.
These opinions may not fit to your financial status, risk and return preferences. For this reason, to make an investment decision
by relying solely to this information stated here may not bring about outcomes that fit your expectations. The trademarks and
service marks contained in Sidoti & Company Research are the property of their respective owners. Third-party data providers
make no warranties or representations relating to the accuracy, completeness, or timeliness of the data they provide and shall not
have liability for any damages relating to such data.

Appendix
Sidoti & Company, LLC
11
Investors should consider Sidoti & Company Research as only a single factor in making their investment decision. For valuation
methodology and risks associated with any recommendation, rating or price target referenced in this research report, please
contact the Client Support Team as follows: US/Canada +1 212-453-7000. Alternatively you may contact your investment
representative or Sidoti & Company Research at 1177 Avenue of the Americas, (Attention: Director of Research), New York, NY
10036 USA.
Compensation. Sidoti & Company, LLC received a flat fee of $40,000, renewable annually from the company discussed in this
report for the creation and dissemination of an Initiation Report and three Update Reports, including this report. The purpose of
the fee is to subsidize the high costs of research and monitoring. Sidoti holds a conference twice a year and charges a fee of
$5,000 per conference for presenting companies. Sidoti does not currently have a current investment banking services
relationship with the company discussed in this report, or contemporaneously with any other companies discussed in other
(Sidoti) Company Sponsored Research reports. Sidoti has not received investment banking income from the company discussed
in the report in the past 12 months, and does not expect to receive investment banking income from the company discussed in
the report in the next 12 months. Of securities rated in other Sidoti Company Sponsored Research reports, Sidoti has received
investment banking income from 0 companies (0%) in the past 12 months. Investment banking services, as defined under FINRA
Rule 2241, include, among other things, acting as an underwriter in, or as a member of the selling group in, a securities
underwriting. Sidoti’s role in any issuer’s investment banking transaction can be viewed in that issuer’s filings at www.sec.gov.
Sidoti has non-research employees who will seek compensation for brokerage commission revenue in connection with market
trading the securities of this company. Sidoti & Company, LLC has received compensation for non-investment banking services
on the Small-Cap Universe, and expects to receive additional compensation for non-investment banking services on the Small-
Cap Universe, paid by issuers of securities covered by Sidoti & Company, LLC analysts. These non-investment banking services
include investor relations services and software, financial database analysis, advertising services, brokerage services, advisory
services, investment research, investment management, non-deal road shows, and attendance fees for conferences sponsored
or co-sponsored by Sidoti & Company, LLC.
Sidoti Analysts. Sidoti policy does not allow an analyst or a member of their household (i) to own, trade, or have any beneficial
interest in any securities of any company that analyst covers, or (ii) serve as an officer or director of a covered company. Sidoti
employees, including research analysts, receive compensation that is based in part upon the overall performance of the firm,
including revenues generated by Sidoti’s investment banking and brokerage activities, but compensation is not directly related to
investment banking or brokerage revenues.
Sidoti maintains and enforces written policies and procedures reasonably designed to prevent any controlling persons, officers (or
persons performing similar functions), or employees of Sidoti from influencing the activities of research analysts and the content
of research reports prepared by the research analyst. Sidoti research analysts seek to have management of their covered
companies meet with investors during non-deal road shows. Analysts’ compensation may be related to their success in
scheduling non-deal road shows. This approach could be viewed as presenting potential conflicts of interest.
Reprints of Sidoti & Company, LLC reports are prohibited without permission. Additional information is available upon request.
For any further questions, please contact the Chief Compliance Officer at Sidoti.
Analyst Certification. Matthew Galinko certifies that this report accurately reflects his/her personal views about the subject
securities and issuers and that none of the research analyst's compensation was, is or will be, directly or indirectly, related to the
analyst's specific recommendations or views contained in this research report
Source
Key Statistics data is sourced from FactSet Research Systems
