
BUILDING TECHNOLOGIES PROGRAM
Prepared for the
U.S. Department of Energy
PECI U.S. Department of Energy
Pacific Northwest National Laboratory
Advanced Energy
Retrofit Guide
Practical Ways to Improve
Energy Performance
Retail Buildings

DISCLAIMER
This report was sponsored by the United States Department of Energy, Oce of
Energy Eciency and Renewable Energy, Building Technologies Program. Neither
the United States Government nor any agency or contractor thereof, nor any of their
employees, makes any warranty, express or implied, or assumes any legal liability
or responsibility for the accuracy, completeness, or usefulness of any information,
apparatus, product, or process disclosed, or represents that its use would not
infringe privately owned rights. Reference herein to any specific commercial
product, process, or service by trade name, mark, manufacturer, or otherwise, does
not necessarily constitute or imply its endorsement, recommendation, or favoring
by the United States Government or any agency or contractor thereof. The views
and opinions of authors expressed herein do not necessarily state or reflect those of
the United States Government or any agency or contractor thereof.

BUILDING TECHNOLOGIES PROGRAM
Advanced Energy
Retrofit Guides
RETAIL BUILDINGS
PREPARED BY
Pacific Northwest National Laboratory
and
PECI
With assistance from the U.S. Department of Energy
September 2011
Prepared for the U.S. Department of Energy
under Contract DE-AC05-76RLO 1830
PNNL-20814

4
Retail Buildings
Advanced Energy Retrofit Guides
Project Team
Pacific Northwest National Laboratory
Guopeng Liu, Technical Lead/Project Manager
Bing Liu, Principal Investigator
Jian Zhang, Analyst Support/Author
Weimin Wang, Analyst Support
Rahul Athalye, Analyst Support
PECI
Dave Moser, Technical Lead/Author
Eliot Crowe, Management Oversight
Nick Bengtson, Project Manager/Author
Mark Enger, Technical Support/Author
Lia Webster, Author/Reviewer
Skanska
Steve Clem, Costing Management Oversight
Bob McGinnis, Costing Analyst – Mechanical
Paul Schlattmann, Costing Analyst – Electrical
Solarc Engineering
Mike Hatten, Reviewer/Author

1
Retail Buildings
Advanced Energy Retrofit Guides
A cknowledgements
The series of Advanced Energy Retrot Guides (AERG) is the result of numerous people working to achieve
a common goal of improving existing building energy efciency across the commercial building sector.
The authors wish to acknowledge the contribution and valuable assistance provided by the staff of the U.S.
Department of Energy (DOE), Ofce of Energy Efciency and Renewable Energy (EERE), through the Building
Technologies Program. Specically, we would like to thank Joseph Hagerman, acting commercial buildings team
leader, for providing the resources and leadership necessary to develop the guides.
We would also like to thank Robert Hendron, Diwanshu Shekhar, and Shanti Pless of National Renewable
Energy Laboratory (NREL), for their close collaboration and support throughout the development of the guides.
In addition, the authors would like to recognize the many individuals and organizations that contributed valuable
information, ideas, and guidance throughout the planning, development, and peer review phases of this project:
u
Cara Carmichael, Elaine Adams, Ellen Franconi, and Michael Bendewald, Rocky Mountain Institute;
u Carlos Santamaria, Glenborough, LLC;
u Cathy Higgins and Mark Frankel, New Buildings Institute;
u Floyd Barwig, New York Public Service Commission, Ofce of Energy Efciency and Environment;
u Ira Krepchin and Rachel Buckley, E Source;
u James Green, Hines;
u James Russell, John Farley, Glenn Hansen, Karla Hendrickson, Chris Rogers and Amber Buhl, PECI;
u Jeffrey Cole, Konstrukt;
u Jeremiah Williams, U.S. Department of Energy;
u John Jennings, Northwest Energy Efciency Alliance (NEEA);
u Kevin Powell, U.S. General Services Administration;
u Lam Vu, U.S. Department of Veterans Affairs;
u Lilas Pratt, ASHRAE;
u Marina Kriticos, International Facility Management Association;
u Mark Jewell, Energy Efciency Funding Group;
u Mark Warren, WSP Flack+Kurtz Engineering;
u Michael Groppi, Grubb & Ellis Management Services;
u Mick Schwedler, Trane;
u Timothy C. Wagner, United Technologies Research Center.
We invited twenty people to peer review the draft and collected a large number of comments and observations
that helped to strengthen and clarify the guide. We appreciate the peer reviewers’ considerable time invested in
evaluating the guide and hope that they see the impacts of their recommendations in the nished product.

2
Retail Buildings
Advanced Energy Retrofit Guides
We’d like to thank our internal review team, Andrew Nicholls, Emily Rauch, Katherine Cort, Gopal
Bandyopadhyay, Sriram Somasundaram, and Supriya Goel. Eric Richman of PNNL also provided insightful
comments and support on the lighting retrot measures.
Finally, the authors would like to extend their appreciation to PNNL’s document production team – Dave Payson,
Elaine Schneider, and Rose Zanders – for the conscientious, team-oriented, and high quality assistance they
brought to this version of the document.
We are very proud of the guide that the project team has developed. We hope readers will nd it to be a valuable
source of practical information for guiding retail building energy efciency retrot projects.
Guopeng Liu, Project Manager
September 2011

3
Retail Buildings
Advanced Energy Retrofit Guides
How to Use This Guide
The Advanced Energy Retrot Guide for Retail Buildings is one of the ve retrot guides DOE commissioned at
the beginning of Fiscal Year 2011. By presenting general project planning guidance as well as nancial payback
metrics for the common energy efciency measures, we believe these guides provide a practical roadmap for
effectively planning and implementing performance improvements for existing buildings.
The Advanced Energy Retrot Guides (AERGs) are designed to address key segments of the U.S. commercial
building stock: retail, ofce, K-12 schools, grocery, and healthcare buildings. The guides’ general project
planning considerations are applicable nationwide, while the energy and cost savings estimates for recommended
energy efciency measures have been developed based on energy simulations and cost estimates tailored to
ve distinct climate zones, identied in the gure below. The results of these analyses are presented for each
individual measure, and for a package of recommended measures for three project types: operations and
maintenance (O&M) measures implemented through the existing building commissioning (EBCx) process,
standard retrots, and deep retrots. In this guide, the recommended standard retrot measures provide cost-
effective and low-risk efciency upgrade options including equipment, system, and assembly retrots. The
recommended deep retrot measures may require a larger upfront investment and may have longer payback
periods than the O&M or standard retrot measures.
Figure F.1. Scope of AERGs
This guide is primarily designed for facility managers and energy managers of existing retail buildings of all
sizes. Additional parties, outlined in the following gure, will also nd this guide benecial.
Foreword

4
Retail Buildings
Advanced Energy Retrofit Guides
FOREWORD
Retail
Building Owners
1
Building Operators
2
Financial Institutions
Government Agencies
Utilities
Energy Auditors
Commissioning Providers
Architects and Engineers
Store Sta
1.0 Introduction
2.0 Improving Energy Performance
3.0 EBCx
4.0
Standard Retrofits
5.0
Deep Retrofits
6.0
M&V
7.0
O&M
8.0
Conclusions
1 • Includes facility managers and energy managers
2 • Includes service contractors
Figure F.2. Target Audiences
The signicant number of energy efciency project planning considerations is matched only by the scale of
opportunity for energy efciency improvements in existing retail buildings. A typical retail building can cut
energy use by up to 15% by implementing no and low cost measures and over 45% (including 15% EBCx
savings) by pursuing deeper retrot measures presented in this guide. The impact of such projects will be felt in
the form of reduced operating costs, improved occupant comfort, and a host of related benets.

5
Retail Buildings
Advanced Energy Retrofit Guides
A cronyms
AEDG Advanced Energy Design Guide
AERG Advanced Energy Retrot Guide
AIA American Institute of Architects
AIRR Adjusted internal rate of return
ASHRAE American Society of Heating, Refrigerating and Air Conditioning Engineers
BAS Building automation system
BEEP BOMA Energy Efciency Program
BEPC BOMA Energy Performance Contract
BOC Building Operator Certication
BOMA Building Owners and Managers Association
CAV Constant air volume
COP Coefcient of performance
DB Dry bulb
DCV Demand-controlled ventilation
DDC Direct digital controls
DOAS Dedicated outdoor air system
DOE Department of Energy
DSIRE Database of State Incentives for Renewables and Efciency
DX Direct expansion
EBCx Existing Building Commissioning
EC Evaporative cooling
EERE Ofce of Energy Efciency and Renewable Energy (Department of Energy)
EIA Energy Information Administration
EIS Energy information system
EPA Environmental Protection Agency
ESCO Energy service company
EUI Energy use intensity (typically described as kBtu/sf)
EUL Effective useful life

6
Retail Buildings
Advanced Energy Retrofit Guides
ACRONYMS
HID High-intensity discharge
HP Horsepower
HVAC Heating, ventilation, and air conditioning
IEA International Energy Agency
IGV Inlet guide vanes
IPMVP International Performance Measurement & Verication Protocol
IRR Internal rate of return
IT Information technology
kW Kilowatt
kWh Kilowatt-hour
LBNL Lawrence Berkeley National Laboratory
LCC Life cycle cost
LEED Leadership in Energy and Environmental Design
LPD Lighting power density
MACRS Modied Accelerated Cost Recovery System
MCWB Mean coincident wet bulb
MIRR Modied internal rate of return
M&V Measurement and verication
NAESCO National Association of Energy Service Companies
NBI New Buildings Institute
NC New construction
NEEA Northwest Energy Efciency Alliance
NIST National Institute of Standards and Technology
NOI Net operating income
NPV Net present value
NREL National Renewable Energy Laboratory
O&M Operations and maintenance
OA Outdoor air
OMETA Operations, maintenance, engineering, training, and administration

7
Retail Buildings
Advanced Energy Retrofit Guides
ACRONYMS
PACE Property Assessed Clean Energy (nancing)
PIER Public Interest Energy Research
PNNL Pacic Northwest National Laboratory
RA Return air
RCx Retrocommissioning
RFQ Request for qualications
RH Relative humidity
ROI Return on investment
RP Recommended package
RTU Rooftop unit
SF Square feet
SHGC Solar heat gain coefcient
SHW Service hot water
SWH Service water heating
TAB Testing, adjusting and balancing
VAV Variable air volume
VFD Variable frequency drive
WSDGA Washington State Department of General Administration

8
Retail Buildings
Advanced Energy Retrofit Guides

9
Retail Buildings
Advanced Energy Retrofit Guides
Contents
Acknowledgements .....................................................................................................................................................1
Foreword ...............................................................................................................................................................................3
Acronyms .............................................................................................................................................................................. 5
1 Introduction .....................................................................................................................................................................13
1.1 Purpose of the Guide ....................................................................................................................................... 14
1.2 Approach of the Guide .................................................................................................................................... 14
2 Improving Energy Performance In Existing Retail Buildings ............................................................................19
2.1 The Retail Energy Picture .................................................................................................................................19
2.2 A Roadmap for Building Performance ....................................................................................................... 20
2.3 Benchmarking Current Energy Performance ............................................................................................24
2.4 Energy Audits .....................................................................................................................................................28
2.5 Planning Energy Performance Improvements .........................................................................................34
2.6 Business Case for Upgrading Building Performance ..............................................................................38
2.7 Financial Assistance for Energy Eciency Projects ............................................................................. 46
3 Existing Building Commissioning (EBCx) ............................................................................................................. 49
3.1 O&M Measure Summary Table ...................................................................................................................... 50
3.2 EBCx Recommended Packages .....................................................................................................................51
3.3 Additional Considerations ...............................................................................................................................54
3.4 Additional Resources and Guides .................................................................................................................57
4 Standard Retrofits .........................................................................................................................................................59
4.1 Standard Retrofit Measure Summary Table .............................................................................................. 60
4.2 Standard Retrofit Recommended Packages .............................................................................................62
4.3 Additional Considerations .............................................................................................................................. 64
4.4 Additional Resources and Guides ................................................................................................................ 69
5 Deep Retrofits .................................................................................................................................................................71
5.1 Planning and Design of Deep Retrofits ........................................................................................................71
5.2 Deep Retrofit Recommended Packages.....................................................................................................79
5.3 Additional Considerations .............................................................................................................................82
5.4 Additional Resources and Guides .................................................................................................................85
6 Measurement and Verification (M&V) ..................................................................................................................... 87
6.1 Planning for M&V ...............................................................................................................................................88
6.2 Overview of M&V Approaches .......................................................................................................................88
6.3 Developing an M&V Plan ................................................................................................................................ 90
6.4 M&V Approaches for Recommended Packages ........................................................................................91
6.5 Measure Characterization .............................................................................................................................. 96
6.6 Operational Verification Activities ............................................................................................................... 96
6.7 Savings Verification and Ongoing Performance Assurance .................................................................97
6.8 Building Performance Tracking .....................................................................................................................97
6.9 Additional Resources and Guides ............................................................................................................... 98

10
Retail Buildings
Advanced Energy Retrofit Guides
CONTENTS
7 Continuous Improvement Through O&M .............................................................................................................. 99
7.1 What is O&M? .................................................................................................................................................... 99
7.2 O&M Management ...........................................................................................................................................100
7.3 O&M Program Development .........................................................................................................................101
7.4 Building Performance Tracking ...................................................................................................................102
7.5 Additional Resources ....................................................................................................................................103
8 Conclusions ................................................................................................................................................................... 105
9 References .....................................................................................................................................................................107
10 Appendix .......................................................................................................................................................................109
10.1 Baseline Building Characteristics and Simulation Approaches .........................................................109
10.2 Modeling Results Considerations ................................................................................................................. 115
10.3 Reference Climate Zone Characteristics .................................................................................................... 118
10.4 Cost-Eectiveness Analysis Methodology ................................................................................................118
10.5 O&M Measures .................................................................................................................................................. 126
10.6 Retrofit Measures .............................................................................................................................................. 131
10.7 Technical References ...................................................................................................................................... 163
Figures
F.1 Scope of AERGs .............................................................................................................................................................3
F.2 Target Audiences ............................................................................................................................................................4
1.1 Distribution of Commercial Building Energy Use .................................................................................................
13
2.1 Percent Energy Use by Building System (U.S. Energy Information Administration, 2006) .................. 20
2.2 Audit Cost and Quality .................................................................................................................................................31
2.3 Recommended Project Phases for a Staged Approach to Energy Eciency Upgrades ........................34
2.4 Example Project Using a Staged Approach for Energy Eciency Upgrades ............................................. 35
2.5 Reduction in Energy Usage Leads to Increased ENERGY STAR Scores .......................................................39
2.6 Distribution of Energy Cost Savings through Performance Contracting .....................................................47
3.1 EBCx Process ................................................................................................................................................................. 49
5.1 Traditional Project Design Team ............................................................................................................................... 77
5.2 Integrated Project Design Team ...............................................................................................................................78
6 1 M&V Timeline ..................................................................................................................................................................88
6.2 Measurement Boundary for M&V Options .............................................................................................................89
10.1 Workflow of Simulation Support for Retrofit Guide Development ...............................................................114

11
Retail Buildings
Advanced Energy Retrofit Guides
CONTENTS
Tables
1.1 Energy Upgrade Project Type Descriptions ...........................................................................................................16
1.2 AERG Climate Zones and Reference Cities ............................................................................................................17
2.1 Common Comparisons made when Benchmarking ...........................................................................................25
2.2 Approaches to Benchmarking ..................................................................................................................................25
2.3 Sample Quantitative and Qualitative Measures of Building Performance ................................................... 26
2.4 Steps to the Benchmarking Process .......................................................................................................................27
3.2 EBCx Recommended Packages - Results of Common Metrics ........................................................................ 51
3.1 O&M Measure Summary Table ...................................................................................................................................51
3.3 EBCx Recommended Package Measures ..............................................................................................................52
3.4 EBCx Recommended Package - Energy Savings Results ................................................................................. 53
3.5 EBCx Recommended Packages Financial Analysis Result ...............................................................................53
4.1 Retrofit Measure Summary Table ............................................................................................................................ 60
4.2 Standard Retrofit Recommended Packages - Results of Common Metrics ................................................62
4.3 Standard Retrofit Recommended Package Measures .......................................................................................62
4.4 Standard Retrofit Recommended Packages - Results of Common Metrics ................................................63
4.5 Standard Retrofit Recommended Packages Financial Analysis Result ....................................................... 64
5.1 Opportunities in a Building’s Life to Perform a Deep Retrofit ........................................................................72
5.2 Deep Retrofit Recommended Packages - Results of Common Metrics .......................................................79
5.3 Deep Retrofit Recommended Packages Measures ............................................................................................. 79
5.4 Deep Retrofit Recommended Package Energy Savings Results .....................................................................81
5.5 Deep Retrofit Recommended Package Financial Analysis Results ................................................................81
6.1 Key IPMVP M&V Terminology Approaches ...........................................................................................................87
6.2 Overview of IPMVP Options .....................................................................................................................................90
6.3 Components of an M&V Plan .....................................................................................................................................91
6.4 M&V Approaches for O&M Measures Implemented as Part of EBCx Packages .........................................93
6.5 M&V Approaches for Retrofit Measures Implemented as Part of Standard Retrofit Packages .............
93
6.6 M&V Approaches for Retrofit Measures Implemented as Part of Standard Retrofit Packages ............ 94
6.7 M&V Approaches for Retrofit Measures Implemented as Part of Deep Retrofit Packages ....................95
10.1 Retail Reference Building Characteristics ............................................................................................................
109
10.2 Reference Climate Zone Characteristics ............................................................................................................... 118
10.3 Energy Cost Rates for Reference Cities ............................................................................................................... 123

1 INTRODUCTION
13
Retail Buildings
Advanced Energy Retrofit Guides
1
Introduction
The Advanced Energy Retrot Guides (AERGs) for Existing Buildings
have been developed by the U.S. Department of Energy (DOE) to help
building owners, facility managers and energy managers select the
energy efciency improvements that best suit their building type and
location, and successfully execute those improvements. The full series
of guides will address key segments of the commercial building stock.
Emphasis is put on actionable information, practical methodologies,
diverse case studies, and objective evaluations of the most promising
retrot measures for each building type.
This guide addresses retail buildings, which represent approximately 13% of energy use in commercial
buildings nationwide (Figure 1.1). Retail buildings in the U.S. are second only to ofce buildings in total energy
consumption. And with over 70% of existing retail buildings built before 1980
1
, many are past due for upgrades
to aging building equipment, systems, and assemblies (U.S. Energy Information Administration, 2006). Retail
buildings offer signicant opportunities for deep, cost-effective and energy efciency improvements, and this
guide provides practical and specic guidance for realizing these opportunities.
1 The age distribution for retail buildings provided by this source excludes mall buildings. Many of the measures presented in this guide
can be applied to malls.
This guide to building energy
retrofits oers practical
methodologies, diverse case
studies, and objective evaluations
of the most promising retrofit
measures for retail buildings. By
combining modeled energy savings
and estimated costs, this guide
presents cost-eectiveness metrics
for both individual measures
and recommended packages of
measures. This information can be
used to support a business case
for energy retrofit projects and
improve the energy performance of
buildings nationwide.
ABOUT THIS SECTION
Figure 1.1. Distribution of Commercial Building Energy Use (U.S.Energy Information Administration, 2006)

1 INTRODUCTION
14
Retail Buildings
Advanced Energy Retrofit Guides
1.1 Purpose of the Guide
This guide has been created to help building owners, facility managers and energy managers plan, design, and
implement energy improvement projects in their facilities. A 2011 survey identied record high interest in energy
efciency projects among building owners and managers, but also noted signicant barriers relating to project
nance and planning (Institute for Building Efciency, 2011). This guide provides building owners and managers
with insightful information to address those barriers, including robust approaches to project planning, plus data
and methods for nancial analysis.
The primary audience for this guide is facility managers and energy managers who wish to improve the energy
performance of their buildings, generate strong nancial returns, and simultaneously achieve non-energy benets,
such as improved occupant comfort. An owner who is new to energy efciency projects will nd a primer on
the key concepts in Chapter 2, and guidance on implementing O&M measures to reap up to 15% savings in
Chapter 3. A facility manager who has optimized existing operations can nd recommendations on energy
efcient retrots in Chapter 4. Chapter 5 is for those who are looking to distinguish their facilities through deep
and integrated retrots, perhaps as part of a major renovation.
The following additional audiences are expected to benet from much or
all of the content in this guide:
u
Financial institutions seeking objective analysis of the cost savings
and performance risks associated with specic building improvements
u
Government agencies considering the feasibility and cost-
effectiveness of regulations or nancial incentives for energy
efciency improvements in existing buildings
u
Utilities operating energy efciency programs
u Architects, design engineers, and consultants responsible for a major
renovation
u
Commissioning agents evaluating the cost-effectiveness of energy
efciency improvements
u
Building operators interested in cost-effective operational strategies
This guide targets one of the key barriers to implementing energy saving projects: the lack of actionable cost
and energy savings data and analysis for energy efciency improvements (IBE, 2011). This guide addresses
that gap by providing practical analytical methods for evaluating the cost-effectiveness of potential building
upgrades, tailored to retail buildings in multiple locations. These methods are then applied to produce a series of
recommended measures and packages of measures that are tailored to ve U.S. climates.
Detailed tables are included to illustrate the energy impact of implementing the recommended packages of
measures on a typical building. Case studies are also included, to demonstrate how retail building owners have
successfully implemented similar energy efciency projects.
1.2 Approach of the Guide
Retail buildings have widely varying designs and uses, and building owners and managers face a variety of
nancial constraints. To address the diversity, this guide presents three levels of upgrade options: (1) Implementing
operations and maintenance (O&M) improvements through Existing Building Commissioning (EBCx),
§ Diculty getting started
§ Limited capital and
competition for resources
§ Shortage of actionable cost
and energy savings
§ Failure to consider all benefits
over project life
§ Lack of specific methods to
achieve deep retrofits
BARRIERS ADDRESSED

1 INTRODUCTION
15
Retail Buildings
Advanced Energy Retrofit Guides
(2) standard retrots, and (3) deep retrots. In this guide, standard retrot measures provide cost-effective and
low-risk efciency upgrade options including equipment, system and assembly retrots. Deep retrot measures
require a larger upfront investment and may have longer payback periods than O&M or standard retrot
measures. Another layer of diversity is created by the dependence of retrot options on climate, so the upgrade
options for standard and deep retrots are customized for ve different
climates. This multi-level and multi-climate
approach broadens the applicability of the guides to a wide range of situations.
The ow chart in Figure 1.2 provides one example of how the main sections of the guide correspond to key
project planning and implementation phases.
Figure 1.2. Example of AERG Project Planning Flow Chart
* Integrated Approach: Simultaneous retrofit of multiple building systems, EBCx after the system/equipment upgrade
Staged Approach: Retrofit of building systems sequentially
The guide begins in Chapter 2 with an introduction to key concepts underpinning energy efciency projects;
discussions of goal setting, project planning, and performance tracking illustrate the process for initiating energy
efciency projects. Chapter 2 also explains energy audits, nancial analysis, and nancing options, to provide
the remaining elements needed for a strong business case. This chapter lays the foundation upon which energy
efciency project options are built in the subsequent sections.
Chapters 3 through 5 provide sample upgrade packages for three levels of project: EBCx, standard retrots, and
deep retrots. Each package has been modeled based on a typical retail building (25,000 square feet), to give
robust and consistent estimates of implementation costs and energy savings.
In reality, all buildings are unique, so the recommended packages presented in this guide are intended as an
intelligent starting point. The costs and savings values included in this guide for the recommended packages
and the individual measures are estimated values. A brief description of the sample recommended package of
measures presented in Chapters 3 through 5 is provided in Table 1.1. The savings ranges for all three project
types presented in the table below assume a common baseline building condition.

1 INTRODUCTION
16
Retail Buildings
Advanced Energy Retrofit Guides
Table 1.1. Energy Upgrade Project Type Descriptions
Existing Building Commissioning (EBCx) Up to 15% energy savings
Significant savings can often be achieved with minimal risk and capital outlay by improving building operations and
restructuring maintenance procedures. This process, commonly known as existing building commissioning, or EBCx, is
generally recommended even when deeper retrofits are being considered. A nationwide study of commissioning projects by
Lawrence Berkeley National Laboratory found median energy savings of 16% through EBCx, with an average simple payback
period of 1.1 years (Mills, 2009).
Standard retrofit 15-45% energy savings
This type of project includes the system retrofits that are most cost-eective and lowest risk. These standard retrofit
measures are typically component-level replacements of existing equipment for improved energy eciency. Typically, no
one standard retrofit measure will achieve 15-45% site energy savings, but as a package of measures, this range is easily
achievable.
Deep retrofit 45% energy savings and above
Deep retrofits go beyond component level replacements and take an integrated whole-building approach to energy saving
projects. Savings beyond 45% are achievable when upgrades to the building envelope are combined with retrofits of lighting
and mechanical systems.
The recommended retrot packages presented in this guide are built on an analysis of 40 promising energy
efciency measures. Chapters 3 and 4 introduce these measures, and additional detail is provided in the
appendices. The process for developing the recommended packages of measures was done by rst brainstorming
all potential measure options, then prioritizing measures based on technical feasibility and appropriateness, and
nally nalizing measure packages based on cost-effectiveness. This process, simplied in Figure 1.3, can be
mirrored by building owners to determine the energy efciency measures best suited to their building’s needs and
energy performance improvement strategy.
Figure 1.3. Measure Prioritization Process

1 INTRODUCTION
17
Retail Buildings
Advanced Energy Retrofit Guides
Many of the measures presented in this guide are climate-dependent; for example, improvements in cooling
efciency will have a greater impact in hotter climate regions. For this reason, each package of measures is
analyzed for the ve different climate zones shown in Table 1.2. The cost/savings data are based on the regional
utility rates and labor rates.
Table 1.2. AERG Climate Zones and Reference Cities
Climate Zone Represented by
Hot & Humid Miami, FL
Hot & Dry Las Vegas, NV
Cold Chicago, IL
Very Cold Duluth, MN
Marine Seattle, WA
Throughout the guide, diverse case studies provide examples of how the approaches described in this guide have
been successfully implemented by building owners and managers. The case studies are accessible and objective,
offering insights into the opportunities, trade-offs, and potential pitfalls that may be encountered in a retrot
project.
The guide concludes with a discussion of strategies to ensure that the energy savings expected from the upgrades
are achieved and persist over time. The rst of these strategies, described in Chapter 6, is to implement a
measurement and verication (M&V) program, together with the upgrades, to ensure that improvements are
operating as intended. The second key strategy, covered by Chapter 7, is to optimize O&M activities to maintain
and continually improve facility performance.

2 IMPROVING ENERGY PERFORMANCE IN EXISTING RETAIL BUILDINGS
19
Retail Buildings
Advanced Energy Retrofit Guides
2
Improving Energy
Performance in Existing
Retail Buildings
Industry leaders have long recognized the role that energy efciency can play in reducing operating costs
and increasing asset value, while also improving occupant comfort. Opportunities for improved energy
performance exist in nearly every retail building. These opportunities come in many forms, including improved
operational and maintenance practices, equipment retrots, occupant behavioral changes, and building envelope
modications, to name just a few. Over the life of a building, different opportunities will be available at different
times, depending on the changing usage of a building, remaining life of the equipment and assemblies, and
availability of improved technologies in the market.
While the opportunities for energy efciency improvements in existing retail buildings are signicant, the
process of identifying, analyzing, and implementing those improvements is not always straightforward. This
chapter of the guide provides an overview of the steps necessary to identify energy efciency improvement
opportunities and plan their implementation. It addresses plotting an energy efciency roadmap, available
nancing mechanisms, performance assessment through benchmarking, and identifying cost-effective measures
through energy auditing. Each section includes links to the extensive body of literature that exists on these topics
to provide more details.
2.1 The Retail Energy Picture
Before addressing how to implement energy efciency improvements, it is valuable to rst investigate how
energy usage is spread across building systems in a typical retail building. Figure 2.1 demonstrates the percent
breakdown of energy consumption by end-use for retail buildings in the U.S.
As indicated in the gure, end-uses related to the HVAC system (heating, cooling, and ventilation) make up 48%
of total energy use, and lighting represents 35% of total use. Because these two end-uses combined typically
make up more than three quarters of a retail building’s energy use, it’s usually best to focus on energy retrots
related to these end-uses rst (U.S. Energy Information Administration, 2006). The quantity of measures
presented in this guide for each building system is reective of the relative energy use of that system and the
scale of opportunity for energy savings.

2 IMPROVING ENERGY PERFORMANCE IN EXISTING RETAIL BUILDINGS
20
Retail Buildings
Advanced Energy Retrofit Guides
2.2 A Roadmap for Building
Performance
All retail buildings present some opportunity for energy efciency
improvements. As more efcient technologies and practices emerge,
even relatively new buildings can reap savings. Successful continuous
improvement of building performance requires more than opportunities,
however; industry leaders often talk about energy efciency becoming
part of the company culture. This section discusses how an organization
can nd and deliver on energy-saving opportunities. It begins with a
commitment and goal setting, and then moves to implementing upgrades
and measuring progress.
Making the Commitment
This guide provides numerous examples where implementing an energy efciency upgrade makes good business
sense. But the fact remains that many building owners and operators are missing out on these opportunities to
cut expenses and strengthen revenues. In many organizations, this gap persists because internal infrastructure
operations are not linked to business strategy discussions. One way to create this linkage is through a high-level
commitment to reducing energy use. Today’s business environment provides numerous nancial, policy, and
market drivers that can support such a commitment, including:
Figure 2.1. Percent Energy Use by Building System (U.S. Energy Information Administration, 2006)
§ Making the commitment
§ Setting goals for energy
performance
§ Creating an action plan
§ Evaluating financing options
and incentives
§ Implementation approach
§ Project completion
2.2 TOPICS COVERED

2 IMPROVING ENERGY PERFORMANCE IN EXISTING RETAIL BUILDINGS
21
Retail Buildings
Advanced Energy Retrofit Guides
u Tenant recognition of energy efciency value, leading to higher occupancy rates and pricing
u Industry initiatives, such as Leadership in Energy and Environmental Design (LEED
®
) and
Architecture 2030
®
, providing a competitive edge in the marketplace
u
Energy and environmental regulations and codes
u Aging infrastructure leading to declining economic value
u Utility, state, and federal energy efciency and nancing programs
Combining these motivations with the promise of attractive investment opportunities can put energy efciency
on the agenda of any organization. The commitment to nding and implementing energy efciency upgrades can
be effectively communicated with the establishment of an internal goal for building energy performance.
Setting Goals for Energy Performance
An energy performance goal expresses an aspiration for achieving an improvement on a building’s baseline
energy performance through efciency upgrades. Such a goal can serve as a strong motivator to drive projects
from inception through completion. To be effective, an energy performance goal should:
u
Express the building owner’s motivations for the project
u Be achievable, based on industry best practice
u Function as a basis for tracking progress
Energy performance can be assessed at the building portfolio, building, and system level. Procedures for
assessing energy performance include benchmarking and energy audits, which are discussed in detail in
Sections 2.3 “Benchmarking Current Energy Performance” and 2.4 “Energy Audits.” Both of the procedures
provide an understanding of baseline performance and some idea of the potential for improving performance.
This information can be used to set the performance goal.
An energy performance goal is often expressed as a percentage reduction relative to the existing energy use
intensity of the building. As such, it can be aligned with one of the three levels of energy efciency upgrades that
are dened within this guide. An alternative approach is to call for implementation of all projects that feature
a return on investment better than a dened threshold. This latter approach has the benet of aligning with
many organizations’ standard nancial evaluation process, but it may be less effective at encouraging creative,
integrated approaches inspired by an energy performance goal. When a percentage reduction is targeted, specic
project proposals can still be subjected to an organization’s standard nancial evaluation.
Creating an Action Plan
An organizational goal for building performance improvement must be supported by an action plan that shows
how the goal will be achieved through implementation of specic projects. If the goal-setting process utilized a
detailed energy audit, then this audit will have identied specic projects that can form the basis of the plan. If
another approach was used to set the goal, then an energy audit can be conducted next with the explicit purpose
of developing a plan to achieve the goal. Where the goal targets energy savings of greater than 45% (deep retrot
territory), the plan will most likely call for an integrated design process to precede a major renovation.
A deep retrot project requires simultaneous evaluation of opportunities across multiple building systems. It
thus lends itself to an integrated design process and concurrent implementation of upgrades to many systems.
In contrast, a plan calling for a standard energy efciency retrot may elect to implement measures in stages.

2 IMPROVING ENERGY PERFORMANCE IN EXISTING RETAIL BUILDINGS
22
Retail Buildings
Advanced Energy Retrofit Guides
Often, a staged approach is chosen because of budget constraints. When using the staged approach, it is
important to consider the ordering of projects to ensure that maximum performance is ultimately achieved. The
integrated and staged approaches to energy efciency upgrades are discussed in Section 2.5 “Planning for Energy
Performance Improvements.”
Evaluating Financing Options and Incentives
Energy savings are valuable. They offer building owners and renters a low risk investment that will reduce
operating and maintenance expenditures. They allow electric and gas utilities to avoid costly infrastructure
investments. And they contribute to healthier environments and more competitive industries, which benet the
entire economy. Because of this wide valuation by various stakeholders, many options exist for nancing energy
efciency upgrades.
Conventional project nance options, such as commercial loans, can be used for energy performance upgrades. In
addition, there is a suite of nance options available only to energy efciency projects.
These additional options
include energy performance contracts, utility rebate and on-bill nance programs, and government-supported low
interest loans. A variety of tax incentives further improve the economics of energy efciency upgrades.
The energy performance goal and action plan must align with the nancing options available to an organization.
Stating the anticipated funding sources in planning documents is important, as is a formal planned task to
validate the anticipated funding assumptions. Key planning considerations and questions include:
u
What is the preferred approach to economic analysis and decision-making?
u What are the economic criteria that the project needs to satisfy?
u Who are the external project partners that can offer nancial incentives?
u What level of funding can potentially be acquired?
u What is the preferred source of funding, and is performance contracting an option?
These questions do not necessarily need to be answered within a planning document, although this can be
highly benecial. At a minimum, a plan needs to identify when these questions will be answered and who will
be responsible for answering them. Sections 2.6 “Business Case for Upgrading Building Performance” and
2.7 “Financial Assistance for Energy Efciency Projects” of this guide provide further discussion of the issues
involved in developing a business case, including nancing options.
Implementation Approach
Identifying the likely implementation approach is another important part of an energy efciency planning effort.
Each approach has implications for the project as a whole. Energy efciency projects can be implemented using
one or a combination of three key approaches: in-house implementation, design-build contracts, and design-
bid-build construction. To this list we can also add energy performance contracting, which is a nancing and
management tool that can be applied to the design-build approach.
In-house implementation is typically the lowest out-of-pocket cost for an energy project. It assumes that
a building owner’s facilities maintenance personnel will actually execute and install the identied building
energy efciency improvements. This implies that these individuals can integrate this additional work with
their ongoing work tasks, or that the building owner can temporarily hire additional personnel.
Design-build contracts imply turnkey project delivery with the design and construction activities integrated
into a single team.

2 IMPROVING ENERGY PERFORMANCE IN EXISTING RETAIL BUILDINGS
23
Retail Buildings
Advanced Energy Retrofit Guides
Design-bid-build construction approaches are conventional in the new construction market and can be applied
to complex, deep retrots of existing buildings. Under this approach a design rm delivers bidding documents,
which the owner then uses to solicit bids for the construction phase of the work.
Energy performance contracting is a special case of design-build construction, where the same contractor (the
Energy Service Company, or ESCO) is involved from initial performance assessment through nal monitoring
and verication, and generally will offer some level of guarantee that savings will be achieved. An energy
performance contract may be the lowest out of pocket cost, when the project cost has to be met. Section 2.7
“Financial Assistance for Energy Efciency Projects” provides more information on energy performance
contracting.
With any approach, a major challenge is to maintain the same level of energy efciency awareness in the design
and construction team as was present in the planning team. If an information disconnect occurs between these
teams, the project can fall short of its savings goals.
Regardless of the approach chosen, there are other implementation considerations that must be addressed as a
retrot project is dened. Most important among these is the project’s impact on building occupants. Scheduling
construction work after normal building operating hours or temporarily vacating portions of the building may be
necessary for some retrots, which can impact project timeline and cost.
Project Completion
Close-out of an energy efciency retrot project is often more complex than that of a typical construction project.
Not only do all of the installed elements need to work upon completion, the energy use reduction goals need to be
achieved in order for the project to be deemed successful. Generally, project close-out will involve: (1) Standard
inspections, (2) Performance testing to ensure measures function as intended, (3) Delivery of project close-out
documents and owner training, and (4) Measurement and verication (M&V) of energy savings.
Using M&V to quantify the energy savings results of a project is critical to validating a project’s investment,
showing progress toward goals, and building the business case for subsequent retrot projects. For a detailed
discussion of M&V best practices, see Chapter 6.
§ A roadmap for building performance improvement incorporates elements of commitment, planning,
and execution.
§ Setting an energy savings performance goal that addresses the “before and after” energy use of the
building isastrong first step toward completing an energy improvement plan.
§ An energy audit assesses current building performance and identifies opportunities for energy
eciency improvement.
§ Many options exist for financing energy eciency upgrades, ranging from commercial loans to
utility incentives. You can select from these options to match your organization’s needs and upgrade
opportunities.
§ The three most common approaches to project implementation are in-house, design-build, and
design-bid-build.
§ M&V of project savings is critical to validating a project’s investment and building the business case
forsubsequent retrofit projects.
2.2 KEY POINTS

2 IMPROVING ENERGY PERFORMANCE IN EXISTING RETAIL BUILDINGS
24
Retail Buildings
Advanced Energy Retrofit Guides
Additional Resources
Use these resources for more detailed information on planning and procedural aspects of energy efciency
project implementation.
u
Environmental Protection Agency, “Building Upgrade Manual”, 2008: A strategic guide for planning and
implementing a protable energy saving building upgrade following a ve-stage process. Chapter 1 discusses
Investment Analysis. Available for free download online; www.energystar.gov.
u
ASHRAE, “Energy Efciency Guide for Existing Commercial Buildings: The Business Case for Building
Owners & Managers”, 2009: A guide to making the business case for efciency upgrades; includes discussion
of cash ow analysis methods. Available for purchase; www.techstreet.com.
u
BetterBricks, “The High Performance Portfolio Framework”: A strategic guide to improving building
performance that addresses organizational best practice procedures. Available for free download online;
www.betterbricks.com.
u
Rocky Mountain Institute, Retrot Depot: A website that provides a wealth of information and tools for
planning and designing commercial building retrots; www.retrotdepot.org.
2.3 Benchmarking Current
Energy Performance
Benchmarking is an essential starting point for understanding a
building’s energy performance. Calculating an energy performance
metric for a building and comparing that against the same metric for
similar buildings provides a hint at the opportunity for upgrades in the
building. For a portfolio of buildings, benchmarking will suggest which
buildings are in greatest need of upgrades. Moreover, top-performing
buildings can provide examples of best practices that may be transferrable to other facilities. Energy
benchmarking can also allow top-performing buildings to receive industry recognition with certications, such as
an ENERGY STAR
®
label.
After project implementation is underway, an ongoing benchmarking program continues to provide value as a
good, high-level check that building performance is improving. This section will dene energy benchmarking,
introduce different approaches, and describe how to benchmark facilities using some helpful tools.
Definition of Energy Benchmarking
Energy benchmarking is a process for describing the energy performance of a building at a point in time, and
for comparing that performance with similar buildings. As this denition implies, there are two key elements
in benchmarking: (1) the description of performance, and (2) the comparison. The description of performance
is often accomplished through calculation of a performance metric. Many types of comparisons are possible.
Several common comparisons are described in Table 2.1.
§ Definition of energy
benchmarking
§ Approaches to energy
benchmarking
§ Benchmarking a building
2.3 TOPICS COVERED

2 IMPROVING ENERGY PERFORMANCE IN EXISTING RETAIL BUILDINGS
25
Retail Buildings
Advanced Energy Retrofit Guides
Table 2.1. Common Comparisons made when Benchmarking
Comparison Definition
Best in class Compare the building to the best performing building in a
population of buildings with similar characteristics.
Average Compare the building to the average performance of buildings in a
population with similar chacteristics.
Baseline Compare the building’s performance to its historical performance.
Performance standard Compare the building to a clearly defined performance standard,
such as those established in building energy codes.
The appropriate benchmarking metric depends on what type of comparison will be made. Comparison across
building populations require metrics that adjust for dissimilar building characteristics. Comparisons against
historical performance of the same building are simpler, but can also include adjustments for changing weather
and building use.
Approaches to Energy Benchmarking
Energy benchmarking may be internal or external and quantitative or qualitative. Internal benchmarking
compares data within a building owner’s portfolio of buildings, where external compares against a broader
population of buildings. A quantitative approach compares numerical measures of performance to see how
building performance changes over time or ranks against that of similar buildings. The qualitative approach
analyzes management and operational practices across the entire building portfolio to identify best practices and
areas for improvement. These basic approaches are summarized in Table 2.2.
Table 2.2. Approaches to Benchmarking
Internal External
Quantitive
Compare calculated metrics of
your building’s performance
against its own historical
performance or against other
buildings in your portfolio.
Compare calculated metrics of
your building’s performance
against similar buildings in a
defined geographic area.
Qualitative
Compare management and
operational practices in your
building over time or against
other buildings in your portfolio.
Compare management
and operational practices
in your building against
similar buildings in a defined
geographic area.
A combination of qualitative and quantitative measures in (Table 2.3) can be a powerful tool for detecting
poor performance and identifying best practices that can be harnessed for improvements. For example, a
benchmarking exercise might calculate the energy use intensity for a portfolio of ten retail buildings. If three
of the buildings show twice the energy use per square foot as the best performing building, then it’s natural to
begin looking for an explanation. By comparing qualitative characteristics of the buildings, such as those shown
in Table 2.3, one can begin to understand the reason for the performance discrepancy. It may then be possible to
improve performance at the lagging buildings, by looking to the practices at the leading building.
When using quantitative metrics, it is important to make reasonable comparisons. This means that adjustments
must be made to account for differences between buildings. Some of the most common adjustments are shown below.

2 IMPROVING ENERGY PERFORMANCE IN EXISTING RETAIL BUILDINGS
26
Retail Buildings
Advanced Energy Retrofit Guides
Table 2.3. Sample Quantitative and Qualitative
Measures of Building Performance
Quantitative
Energy cost per square foot
Energy (Btu) per square foot
Energy (Btu) per occupant
Qualitative
Presence of an energy manager
History of retrofit projects
Building envelope characteristics
Type of lighting controls
Type of HVAC controls
Energy type: A typical common energy basis is the Btu (British thermal unit). For example, multiplying
electric (kWh) usage by 3,412 will give an equivalent amount of usage in Btus. Usage values for other fuels can
also be converted to Btus, and then summed together to show the total amount of energy used onsite.
Floor space: Large buildings consume more energy than small buildings. They also have more useful area.
Thus, quantitative metrics are commonly normalized to the building’s total conditioned oor area.
Climate: A building in Las Vegas has different needs than a building in New York. When comparing buildings
in different climates, it is appropriate to include an adjustment factor that suggests how the buildings would
rank in a common environment. Similarly, weather can vary considerably from one year to the next, so climate
adjustments may also be required when comparisons are made over time.
Benchmarking whole building energy use is the most common and straightforward approach, and sub-metering is
an option for building owners who want to dig deeper into benchmarking and optimizing buildings. Sub-metering
the consumption of specic end-uses is still relatively rare, and can incur extra cost to install, but it is considered
a key factor in taking a building to the high end of performance.

2 IMPROVING ENERGY PERFORMANCE IN EXISTING RETAIL BUILDINGS
27
Retail Buildings
Advanced Energy Retrofit Guides
Benchmarking a Building
Benchmarking can be challenging, especially the rst time. Following the approach described in Table 2.4 will
help the process proceed smoothly.
Table 2.4. Steps to the Benchmarking Process
PLAN
Engage Partners: Include all relevant internal (e.g., facilities sta, building management) and
external (e.g., utility representatives) parties.
Create a Plan: A benchmarking plan defines the goals, scope, and schedule of the eort.
IMPLEMENT
Collect Data: Common data needs to include energy use and cost, physical building design,
operational statistics, and climate variables.
Calculate Metrics: Determine a building’s baseline energy use, rate the building (using a software
program such as Portfolio Manager), and document the results of eorts to improve energy
performance.
Compare: Once quantitative metrics are calculated and qualitative measures are tabulated, it is a
relatively straightforward process to compare buildings using software programs. Buildings can
be ranked, anomalies flagged and high performance recognized.
Repeat: Ongoing benchmarking will help track progress toward goals.
Benchmarking provides an indication of the opportunity and a basis for tracking progress. The results may be
used to set goals and develop action plans targeting poorly performing buildings. Most likely, one outcome of
benchmarking will be a motivation to further understand the energy performance of some buildings. The next
section of this guide discusses energy audits, which offer a deeper investigation into the energy performance
of a building.
§ Energy performance benchmarking provides baseline information that will help building owners
set energy performance goals, create energy management plans, and prioritize potential upgrade
opportunities.
§ A benchmarking plan begins by assembling stakeholders, defines the goals for the project, and
clarifies the scope of the eort, including the metrics and data needed.
§ Implementation of benchmarking includes data collection, calculation of benchmarking metrics,
performance comparisons, and ongoing tracking.
2.3 KEY POINTS

2 IMPROVING ENERGY PERFORMANCE IN EXISTING RETAIL BUILDINGS
28
Retail Buildings
Advanced Energy Retrofit Guides
Additional Resources
Use these resources for more detailed information on benchmarking building energy use.
u
Environmental Protection Agency, “Building Upgrade Manual”, 2008: A strategic guide for planning and
implementing a protable energy saving building upgrade following a ve-stage process. Chapter 2 focuses
on benchmarking. Available for free download online; www.energystar.gov.
u
ENERGY STAR, Portfolio Manager: A comprehensive, interactive tool that provides a set of benchmarks
developed specically for retail buildings that can be used to assess energy performance. Available for free
use online; www.energystar.gov.
u
ENERGY STAR, Target Finder: A no-cost online tool that enables architects and building owners to set
energy targets; www.energystar.gov.
u
Oak Ridge National Laboratory, Benchmarking Building Energy Performance webpage: Includes sections on
benchmarking retail buildings for a handful of states; http://eber.ed.ornl.gov/benchmark.
u
California Commissioning Collaborative, “The Building Performance Tracking Handbook”, 2008: A guide to
various approaches to tracking and analyzing building energy performance. Benchmarking is presented as one
approach. Available for free download online; www.cacx.org.
2.4 Energy Audits
The objective of an energy audit is to develop an understanding of a
building’s energy performance and energy saving opportunities through
an investigation of the current equipment, operations, and building
energy use patterns. An energy audit provides the project cost and
savings information for potential improvement measures, and can be
performed with varying levels of rigor and expense.
The following section explores the basic elements of an audit, common
types
of audits and their characteristics, and considerations for choosing
an audit type.
Elements of an Audit
Audits can generally be broken down into three primary steps:
u
Pre-site visit analysis
u Site visit data gathering
u Post-site visit analysis and reporting
The pre-site visit analysis involves a review of available data relating to the building’s operations and current
energy performance. Documents and data reviewed can include building plans and construction documents,
historical energy use, and any past audit reports. The energy auditor may also complete a preliminary phone
interview with building operations staff to learn as much as possible about building operations before the
site visit.
§ Elements of an audit
§ Types of audits
§ Audit cost
§ Choosing an appropriate
auditlevel
§ Selecting a qualified
energyauditor
ABOUT THIS SECTION

2 IMPROVING ENERGY PERFORMANCE IN EXISTING RETAIL BUILDINGS
29
Retail Buildings
Advanced Energy Retrofit Guides
The site visit is the primary opportunity for the auditor to collect current data and observe the building’s
operations. The auditor will complete a walk-through to inspect all or a subset of the building’s energy-
consuming systems. By lling out template audit forms, taking photos and conducting interviews with building
operations staff and service contractors, the auditor gathers the necessary information to complete the post-
site visit analysis and reporting. The depth of investigation during the site visit is dependent on the audit type
(discussed in detail below), and can range from a basic equipment survey to sub-metering of equipment.
Finally, with audit information in hand, the auditor will complete engineering and nancial analyses to identify
potential building energy efciency measures. The audit report will detail the building’s baseline energy use, the
energy savings potential of the identied retrot and operational improvements. It will contain a rank-ordered list
of the measures based on cost-effectiveness and any other priorities set by the building owner.
This nal audit report is reviewed by the building owner and used to lay the groundwork to create a roadmap of
energy efciency upgrades for the near-, mid-, and long-term. See Section 2.5 “Planning Energy Performance
Improvements” for more discussion on various energy efciency implementation strategies.
Types of Audits
There are many approaches a building owner can take to complete an energy audit. The most common and
standardized audit approach is offered by ASHRAE. To streamline auditing efforts and provide a common set of
standards, ASHRAE has developed three levels of audits with increasing level of detail, depth of analysis and
cost with each step up in level (Cowan, Pearson and Sud, 2004).
Preliminary Energy Use Analysis
All ASHRAE audits share a common foundation of preliminary energy use analysis. In its simplest form this
analysis involves a review of historical total building energy use and cost, using utility bills from at least the
previous two years. The analysis will dene the building’s Energy Use Intensity (EUI), showing the building’s
energy use on a per square foot basis. The building’s EUI can then be benchmarked against other buildings or
industry average. See section 2.3 “Benchmarking Current Energy Performance” for more detail.
ASHRAE Level I Audit
The ASHRAE Level I audit builds on the preliminary energy use analysis with a brief walk-through of the
building and survey of the building’s energy consuming equipment. Given the limited information gathered in
a Level I audit, the audit report will be limited to identifying no-cost and low-cost measures and recommending
further investigation into measures that would require more signicant investment. Estimated energy savings
and project costs are based on simple calculations and typically do not account for interactions between systems,
such as the reduced cooling load that results from the installation of more efcient lighting. Therefore, the energy
saving estimates at this audit level are not highly accurate and are not recommended for nancial decision-
making on capital-intensive projects.
Consultants can perform a Level I audit, or it can be performed in-house by a building engineer and used to
decide whether or not to hire a consultant or auditor to complete a more detailed audit.
ASHRAE Level II Audit
A Level II audit offers a more comprehensive look at building energy use through a survey of all building
systems, which is used to compute a breakdown of energy consumption by end-use, including heating, cooling,
and interior lighting. A Level II audit builds on a Level I audit by including a more in-depth investigation into
the overall performance of the major building systems. Level II audits usually include spot measurements and

2 IMPROVING ENERGY PERFORMANCE IN EXISTING RETAIL BUILDINGS
30
Retail Buildings
Advanced Energy Retrofit Guides
time-series data logging of equipment to gain an understanding of system performance and to identify potential
measures. All practical measures will be analyzed in the audit report, which will provide, at a minimum,
estimated energy savings and project costs. For complex and capital-intensive measures, a Level II audit may
recommend further data collection and engineering analysis to increase the accuracy of estimated savings and
costs. A Level II audit is adequate for many buildings and measures.
ASHRAE Level III Audit
A Level III audit offers the most detailed engineering and nancial analysis. The results can be used with a high
level of condence by the building owner to consider complex and signicant capital investment decisions. For
this reason, Level III audits are often termed “investment grade” audits. A Level III audit builds on a Level II
audit by providing a more detailed and accurate analysis of building energy performance and identied measures.
The key feature of an investment grade audit is that it accounts for the interactive effects of all building system
improvements, often by using computer models to simulate building and equipment operations. This allows for
a rigorous total system engineering analysis that details the estimated cost and savings with a level of condence
sufcient to support large nancial decisions. In practice, Level II audits are used as the basis for many decisions
where the investment is modest or large returns overshadow any uncertainty. But when a large, expensive project
like a deep retrot is under consideration, a Level III audit reduces the risk related to important parameters that
were assumed or interaction that might have been overlooked. Taking interactions into account may also lead to
opportunities to reduce equipment size. For example, energy efcient lighting and energy efcient windows may
reduce cooling loads enough to downsize HVAC equipment.
While a Level III audit provides the most comprehensive estimates of cost and savings for potential measures,
these audits are costly and may identify more improvements than can be immediately implemented. When
ESCOs perform an investment grade audit as part of a performance contract, they often include nancing options
to overcome this barrier. Section 2.7 “Financial Assistance for Energy Efciency Projects” discusses this and
other nancing options.
EBCx Audits
The O&M measures discussed in this guide are low-cost strategies for optimizing existing building operations.
While Level I, II & III audits consider O&M measures, the unique nature of the EBCx process will likely yield
the greatest O&M savings. As a result, EBCx is often pursued independently before equipment retrots. EBCx is
introduced here, as it relates to energy audits, and then Chapter 3 provides a detailed discussion of EBCx.
An EBCx provider will often conduct a walk-through audit as part of the early phase of commissioning services.
The level of detail of this EBCx walk-through audit is comparable to an ASHRAE Level I audit. The in-depth
investigation portion of an EBCx project is comparable to an ASHRAE Level II audit, which results in a report
that identies potential measures and estimates their cost and energy savings potential based on rigorous system
data collection.
The key distinction between EBCx and ASHRAE audits is that the EBCx process continues through
implementation, measurement and verication of savings, hand off to operations, and in some cases to ongoing
commissioning. EBCx typically also addresses non-energy aspects of building performance such as indoor
environmental quality, equipment life, maintenance costs, and assembly durability.

2 IMPROVING ENERGY PERFORMANCE IN EXISTING RETAIL BUILDINGS
31
Retail Buildings
Advanced Energy Retrofit Guides
Audit Cost
For the same building, costs increase from the Level I to Level III audit. However, for the same type of audit,
costs may vary dramatically from one building to another, depending upon factors such as location, building size,
and complexity of building systems and operation. The audit levels should also be considered as bands of quality;
within Level II audits, providers may deliver differing levels of comprehensiveness and detail. It’s generally a
good idea to check references or review an auditor’s sample work products for similar facilities to ensure that the
audit quality will support the type of decisions it is meant to support. The range of audit cost and quality is shown
in Figure 2.2.
As shown in gure above, audit costs span a wide range, particularly for the most complex, Level III audits. Part
of this range is due to geographic diversity of provider costs. It is also reasonable to consider that part of an audit
cost is xed (e.g., reviewing utility bills) where another part of it varies with building area (e.g., investigating
lighting and HVAC systems). The xed cost leads to higher per square foot costs for smaller buildings.
EBCx cost is typically towards the top end of the range for a Level II audit costs, or perhaps higher depending on
project scope. The higher cost is reective of the fact that EBCx continues through implementation, hand off, and
potentially ongoing commissioning.
Choosing an Appropriate Audit Level
Many factors gure in to the choice of an appropriate audit level, including audit cost, availability of funds for
energy efciency upgrades, and the long-term strategy for the building. If a building owner is interested only in
obtaining a rough idea of a building’s potential energy savings opportunities, a Level I audit would be sufcient.
A Level I audit could, for example, be used to verify that the building portfolio prioritization achieved through
benchmarking is indeed reective of the buildings’ energy saving potential.
35
Figure2‐2.AuditCostandQuality
Asshowninfigureabove,auditcostsspanawiderange,particularlyforthemostcomplex,LevelIIIaudits.Partofthis
rangeisduetogeographicdiversityofprovidercosts.Itisalsoreasonabletoconsiderthatpartofanauditcostisfixed
(e.g.reviewingutilitybills)whereanotherpartofitvarieswithbuildingarea(e.g.investigatinglightingandHVAC
systems).Thefixedcostleadstohigherpersquarefootcostsforsmallerbuildings.
EBCxcostistypicallytowardsthetopendoftherangeforaLevelIIauditcosts,orperhapshigherdependingonproject
scope.ThehighercostisreflectiveofthefactthatEBCxcontinuesthroughimplementation,handoff,andpotentially
ongoingcommissioning.
ChoosinganAppropriateAuditLevel
Manyfactorsfigureintothechoiceofanappropriateauditlevel,includingauditcost,availabilityoffundsforenergy
efficiencyupgrades,andthelong‐termstrategyforthebuilding.Ifabuildingownerisinterestedonlyinobtaininga
roughideaofabuilding’spotentialenergysavingsopportunities,aLevelIauditwouldbesufficient.ALevelIauditcould,
forexample,beusedtoverifythatthebuildingportfolioprioritizationachievedthroughbenchmarkingisindeed
reflectiveofthebuildings’energysavingpotential.
Forthestandardenergyefficiencyretrofitsoutlinedinthisguide(e.g.lightingandHVACupgrades),aLevelIIaudit
wouldtypicallyprovideenoughdetail.Fordeeperretrofitmeasuresthatinvolvealongerreturnoninvestmentand
moresignificantcapitaloutlay,abuildingownershouldcompleteaLevelIIIaudittoensurecostandsavingsestimates
areasaccurateaspossible.
Onesystem
AllSystems
andSystem
Interactions
Lowcost,no
costoptions
Majorcapital
investments
BreadthofAudit
DepthofAudit
LevelI
($0.02‐$0.06/ft
2
)
LevelII
($0.05‐$0.15/ft
2
)
LevelIII
($0.10‐$0.50/ft
2
)
Therangeofauditcostsareestimatedbasedonmarketresearchand
previousestimatesbytheCaliforniaEnergyCommission(2000)
Figure 2.2. Audit Cost and Quality

2 IMPROVING ENERGY PERFORMANCE IN EXISTING RETAIL BUILDINGS
32
Retail Buildings
Advanced Energy Retrofit Guides
For the standard energy efciency retrots outlined in this guide (e.g., lighting and HVAC upgrades), a Level II
audit would typically provide enough detail. For deeper retrot measures that involve a longer return on investment
and more signicant capital outlay, a building owner should complete a Level III audit to ensure cost and savings
estimates are as accurate as possible.
EBCx may be a standalone project or a complement to a retrot projects. Standalone EBCx projects are common
where capital budgets are low, if there are known operational problems, or if the main focus is on improvements
with short payback periods. Availability of rebates from a local utility may also be a motivating factor.
Selecting a Qualified Energy Auditor
As the previous paragraphs have described, audits can be conducted with varying levels of detail and cost. Thus,
when selecting an auditor it is important to clearly specify the scope of the audit and to verify that the auditor is
capable of delivering on that scope. For this reason, many building owners decide to select an auditor through
a competitive process. An open and competitive process offers insight into the range of qualications and costs
that are available within the eld of rms that offer energy audits. An owner’s basic process for competitive
selection of an energy auditor is as follows: Issue of a Request for Qualications (RFQ), host site visits, evaluate
providers’ qualications, interview top ranked rms, select an auditor, and negotiate a contract.
A competitive process is not always necessary to hire an auditor. It is also possible to take a sole-source
approach, particularly where an owner already has an established relationship with a rm that offers ener
gy
audits. Directly negotiating a scope and budget with a preferred vendor is likely to be the quickest path to an
audit and offers the benet of selecting a rm that has already proven its abilities. However, even with a preferred
vendor, it may be wise to examine examples of their past audit work and contact references.
Once an auditor has been selected, a contract is established to deliver a specied scope of auditing services.
The contract with an auditor details the scope of work that they are expected to perform, the specic personnel
assigned to the project, the project schedule and budget. It is also a good time to identify any support that the
building management team must provide to facilitate the audit. The project description from the RFQ will
provide a starting point, but the contracting process represents an opportunity to negotiate a specic scope of
work for the selected auditor tied to a maximum price.
§ An energy audit involves pre-site visit analysis, on-site data gathering, and post-site visit analysis and
reporting.
§ Energy audits detail current building energy performance and identify measure opportunities based on
energy savings and project cost estimates.
§ ASHRAE’s three levels of audits provide varying degrees of analysis and detail that are suitable to
diverse scenarios depending on the building owner’s needs.
§ EBCx audits are similar to ASHRAE Level II audits, but focus on operational measures and follow the
project through implementation, hand-o, and potentially ongoing commissioning
2.4 KEY POINTS

2 IMPROVING ENERGY PERFORMANCE IN EXISTING RETAIL BUILDINGS
33
Retail Buildings
Advanced Energy Retrofit Guides
Additional Resources
Use these resources for more detailed information on energy audits.
u
ASHRAE, “Procedures for Commercial Building Energy Audits,” 2004: A guide that offers a brief overview
of ASHRAE audit levels and template audit forms. Available for purchase; www.techstreet.com.
u
Department of Energy, “Energy Savings Assessment Training Manual,” 2005: A thorough reference guide to
energy audits, including audit types, implementing audits, and diagnostic tools. Available for free download
online; www.eere.energy.gov.
u
Rocky Mountain Institute, energy audit sample forms through Retrot Depot. Available for free download
online; www.retrotdepot.org.
u
Environmental Protection Agency, “A Retrocommissioning Guide for Building Owners,” 2007: A comprehensive
guide to EBCx projects; includes section on EBCx investigation. Available for free download online;
www.peci.org.
u
California Energy Commission, “How to Hire an Energy Auditor To Identify Energy Efciency Projects,”
2000: A guide that discusses procedures for selecting and contracting an energy auditor. Available for free
download online; www.energy.ca.gov.

2 IMPROVING ENERGY PERFORMANCE IN EXISTING RETAIL BUILDINGS
34
Retail Buildings
Advanced Energy Retrofit Guides
2.5 Planning Energy
Performance Improvements
Once benchmarking and audits have revealed the opportunities for
performance improvements, a strategy can be designed for achieving
high performance buildings. With many variables at play, such as age
and condition of equipment, the timing and coordination of upgrades are
important considerations. A long-term and holistic vision for building
upgrades offers the best potential for realizing the maximum return on investment (ROI).
Project Planning Approaches
The measures discussed in this guide are organized into three levels: (1) existing building commissioning
(EBCx), (2) standard retrots, and (3) deep retrots. Energy savings increase in magnitude as you move from
EBCx to deep retrot, but adopting a plan that steps sequentially through each level is not necessarily the most
cost-effective approach. The following section will discuss two primary energy efciency upgrade strategies, the
staged and integrated approaches, and describe considerations for choosing one strategy over the other.
Staged Approach
The key to the staged upgrade approach is to complete improvements to buildings systems in the order that
reects the inuence of one system on another. For example, inefcient lights add heat to retail spaces that must
be removed by HVAC equipment during periods of cooling. By rst upgrading lights, future HVAC system
improvements can be better optimized in a subsequent stage of the project. Under the staged approach, projects
are implemented in the order shown by Figure 2.3. Figure 2.4 provides an illustrative example of how the staged
approach might look on a project basis.
EBCx optimizes the performance of existing equipment, which provides a better baseline for determining
which retrots will be cost-effective. In some cases, EBCx can improve the cost-effectiveness of subsequent
measures by showing where systems can be downsized when operated efciently. In addition, the typically low
cost and quick returns of O&M measures makes them an obvious rst step for building owners who want to see
immediate results with limited capital expense. The risk to completing EBCx rst is that the system optimization
may need to be repeated as subsequent retrots are completed. Carefully documenting EBCx measures can
reduce this effort.
§ Project planning approaches
−Staged approach
−Integrated approach
§ Additional considerations
ABOUT THIS SECTION
Figure 2.3. Recommended Project Phases for a Staged
Approach to Energy Eciency Upgrades
Step 1. EBCx process, O&M measures
q
Step 2. Load-based retrofit measures
– Lighting system retrofits
– Plug and process load retrofits
– Building envelope retrofits
q
Step 3. HVAC system retrofits

2 IMPROVING ENERGY PERFORMANCE IN EXISTING RETAIL BUILDINGS
35
Retail Buildings
Advanced Energy Retrofit Guides
After EBCx, completing measures that affect heating and cooling loads is the next step. A variety of measures fall
into this category. Some of them directly reduce energy consumption with cooling savings as an indirect benet,
such as replacement of inefcient lighting. Others, such as building envelope improvements, solely reduce
energy through indirect means. What they have in common is that all have an impact upon the building’s heating
and cooling demand. More efcient lights will emit less wasted energy into the building as heat, and therefore
reduce the building’s cooling needs and potentially increase its heating needs. The envelope improvements may
reduce solar heat gain and thereby lower cooling needs. By rst completing retrots to these systems, the next
stage of retrots can be optimized for the changed heating and cooling demand.
In standard retrot projects, it is common to progress from the measures affecting heating and cooling loads to a
one-to-one replacement of components in the heating and cooling system. A
10-ton rooftop unit is replaced with
a more efcient 10-ton rooftop unit. In this standard approach, efciency is no doubt improved, but a big cost
saving opportunity is missed. A carefully planned approach will look deeper, to identify where the heating and
cooling system can be resized to meet the demand of the optimized building. An engineering analysis may show
that the 10-ton rooftop unit could be replaced with an efcient 7-1/2-ton rooftop unit. Not only does the smaller
rooftop unit cost less, but it also performs better because it is a better match to the optimized building’s load.
Building owners must tailor their plan to match the needs of their building, so the staged approach presented
here may not always t. Departing from the stages shown here, it may be necessary at times to deal, for example,
with nancial constraints or tenant needs. It’s a good idea for owners to at least investigate the potential for
implementing retrot measures that will impact heating and cooling loads before embarking on a large-scale
HVAC system retrot. That way, the trade-offs that are being made can be clearly examined.
The primary benet of the staged approach relative to the integrated approach, described below, is that the
upfront project costs can be spread over a longer period. Projects with quick paybacks are typically completed
rst, and it may be possible to use the savings from these early projects to justify the costs of subsequent stages.
For this reason, the staged approach may be ideal for organizations unable to justify one large upfront project
cost for an integrated retrot package.
39
Figure2‐4.ExampleProjectUsingaStagedApproachtoEnergyEfficiencyUpgrades
EBCxoptimizestheperformanceofexistingequipment,whichprovidesabetterbaselinefordeterminingwhichretrofits
willbecosteffective.Insomecases,EBCxcanimprovethecosteffectivenessofsubsequentmeasuresbyshowingwhere
systemscanbedownsizedwhenoperatedefficiently.Inaddition,thetypicallylowcostandquickreturnsofO&M
measuresmakesthemanobviousfirststepforbuildingownerswhowanttoseeimmediateresultswithlimitedcapital
expense.TherisktocompletingEBCxfirstisthatthesystemoptimizationmayneedtoberepeatedassubsequent
retrofitsarecompleted.CarefullydocumentingEBCxmeasurescanreducethiseffort.
AfterEBCx,completingmeasuresthataffectheatingandcoolingloadsisthenextstep.Avarietyofmeasuresfallinto
thiscategory.Someofthemdirectlyreduceenergyconsumptionwithcoolingsavingsasanindirectbenefit,suchas
replacementofinefficientlighting.Others,suchasbuildingenvelopeimprovements,solelyreduceenergythrough
indirectmeans.Whattheyhaveincommonisthatallhaveanimpactuponthebuilding’sheatingandcoolingdemands.
Themoreefficientlightswillemitlesswastedenergyintothebuildingasheat,andthereforereducethebuilding’s
coolingneedsandpotentiallyincreaseitsheatingneeds.Theenvelopeimprovementsmayreducesolarheatgainand
therebylowercoolingneeds.Byfirstcompletingretrofitstothesesystems,thenextstageofretrofitscanbeoptimized
forthechangedheatingandcoolingdemand.
Instandardretrofitprojects,itiscommontoprogressfromthemeasuresaffectingheatingandcoolingloadstoaone‐
to‐onereplacementofcomponentsintheheatingandcoolingsystem.A10tonrooftopunitisreplacedwithamore
efficient10tonrooftopunit.Inthisstandardapproach,efficiencyisnodoubtimproved,butabigcostsaving
opportunityismissed.Acarefullyplannedapproachwilllookdeeper,toidentifywheretheheatingandcoolingsystem
canberesizedtomeetthedemandoftheoptimizedbuilding.Anengineeringanalysismayshowthatthe10tonrooftop
Elaine Schneider 9/20/11 3:31 PM
Formatted: Highlight
Figure 2.4. Example Project Using a Staged Approach for Energy Eciency Upgrades
Step 1: EBCx process, O&M measures
Step 2A: Lighting system retrofit
Step 2B: Add smart power strips with occupancy sensors
Step 2C: Replace weather stripping at exterior doors
Step 3: HVAC System Retrofit
q
q
q
q
q

2 IMPROVING ENERGY PERFORMANCE IN EXISTING RETAIL BUILDINGS
36
Retail Buildings
Advanced Energy Retrofit Guides
Integrated Approach
In contrast to the staged approach, the integrated approach to energy efciency upgrades focuses on the
simultaneous retrot of multiple building systems, with a package of measures of varying complexities and
nancial benets being installed at the same time. For example, a building owner may complete a lighting system
retrot at the same time as increasing the amount of roof insulation and replacing the HVAC system.
The integrated approach is well-suited to building owners who either have ambitious energy savings goals to be
met in a short period of time, or have the opportunity to install deep retrot measures due to planned changes in
a building’s systems, such as those that occur when a building is repurposed or undergoes a major renovation.
From a nancial perspective, implementing multiple measures simultaneously has two distinct benets:
u
The overall economics of the project are often improved. Cumulative project costs can be reduced compared
to the staged approach, due to efciencies from installing multiple measures at once. Lifecycle benets may
be simultaneously increased, as energy savings begin at a high level, rather than phasing in over time as stages
are completed.
u
The integrated approach allows for optimization of equipment sizes when multiple building systems and
assemblies are replaced simultaneously. For example, if lighting and HVAC systems are replaced, the HVAC
system designer can take into account the reduced cooling load achieved by the lighting retrot, resulting
in a smaller cooling system. Though this can also occur in the staged approach, the integrated approach is
generally more conducive to identifying such opportunities.
The integrated approach typically involves architects, design engineers, and potentially commissioning providers
working together as part of an integrated design process, where the various design disciplines coordinate closely
to design and specify systems and assemblies that will meet the owner’
s needs as well as result in minimal
energy use (Energy Design Resources, 2002). Retrot systems are designed in concert, rather than as a sum of
individual parts, and the nal design is evaluated using lifecycle economics. This process aligns well with the
design needs of the deep retrot projects described later in this guide.
Additional Considerations
When developing a plan for any level of retrot, it’s important to consider the potential need to install complex,
deep retrots in the future. For example, if a building’s HVAC system is nearing the end of its useful life,
implementing retrots that reduce cooling demand at the same time as replacing the HVAC system may allow
for the installation of a smaller HVAC system. However, if the HVAC system is replaced without rst or
simultaneously completing the demand reducing retrots, the HVAC system will be over-sized when those
retrots are eventually completed, resulting in a higher than necessary HVAC system rst cost and a lost energy
saving opportunity.
If the integrated approach is adopted for a project that includes the retrot of the building’s HV
AC system, it is
essential to understand the expected performance of the optimized building systems and ensure all of these loads
are met by the new HVAC system. For deep retrots, it’s important that the design team consider the building’s
various systems and components as an integrated system. Members of the project team must coordinate to
minimize the expected energy usage of the building and meet the owner’s specic design goals. Because of the
complex interaction between systems, a whole-building energy modeling software program is often required for

2 IMPROVING ENERGY PERFORMANCE IN EXISTING RETAIL BUILDINGS
37
Retail Buildings
Advanced Energy Retrofit Guides
the integrated approach.
Retrots can substantially improve occupant comfort and productivity in a building. However, the process
of implementing retrots may be disruptive to building tenants. Construction dust, noise or use of space may
disrupt tenant operations and comfort. Also, working around tenants increases the complexity of a job for the
construction crew. Some common strategies for mitigating these impacts are to schedule work outside of the
tenants’ normal business hours or to provide some form of compensation to tenants for any disruptions that
cannot be avoided. Including tenants early on in the discussion of a proposed project will help to inform tenant’s
of their long-term benets and to dene a mutually satisfactory mitigation strategy.
After implementing retrots, it’s important to verify that the systems are installed properly and operating
correctly in order to achieve the maximum energy savings potential of the retrot. Appropriate measurement and
verication (M&V) approaches are discussed in Chapter 6 of this guide.
Additional Resources
u Environmental Protection Agency, “Building Upgrade Manual”, 2008: A strategic guide for planning and
implementing a protable energy saving building upgrade following a ve-stage process. Chapter 1 discusses
the staged approach to energy efciency upgrades. Available for free download online; www.energystar.gov.
u
Energy Design Resources: A website with resources and guidance related to integrating building system
design to achieve maximum energy savings. Most content is related to new construction, but the concepts are
applicable to deep retrot projects. www.energydesignresources.com.
§ The staged approach to energy eciency project planning entails sequentially completing projects on
building systems. Systems that have a large potential to reduce load requirements of other systems
should be replaced first.
§ The staged approach allows the savings of each completed project to support the business case of the
next project. With careful planning, annual energy savings may reach the same level as in an integrated
approach, but cumulative savings will always be less due to the delay in implementing some upgrades.
§ The integrated approach focuses on the simultaneous retrofit of multiple building systems, with
measures of varying complexity and financial benefits being installed at the same time. Simultaneously
considering multiple measures allows the cost-eectiveness and energy savings of the measures to be
evaluated as a bundle, rather than individually.
§ The integrated approach entails significant upfront project costs, but has the benefit of dramatically
reducing energy use over a short period of time, with corresponding benefits for the project’s lifecycle
cost savings.
§ The integrated approach utilizes an integrated design process, where the design team optimizes the
energy performance of the building as a whole rather than just the energy performance of individual
systems.
§ A carefully planned approach will capture opportunities to resize systems to meet the demand of an
optimized building. “Right sized” systems typically cost less and perform more eciently.
2.5 KEY POINTS

2 IMPROVING ENERGY PERFORMANCE IN EXISTING RETAIL BUILDINGS
38
Retail Buildings
Advanced Energy Retrofit Guides
2.6 Business Case for
Upgrading Building
Performance
Energy efciency upgrades often provide a generous return on
investment. A study that reviewed nearly two hundred projects in
commercial buildings found the vast majority of those projects achieved
an internal rate of return greater than 15% (Goldman, Hopper and
Osborn, 2005). The direct cost reductions that upgrades deliver through
reduced energy use are complemented by valuable non-energy benets.
This section explores the benets of energy efciency and discusses
the effect of different lease structures on these benets. Methods of
cash ow analysis are presented to aid in evaluating potential energy
efciency investments.
Energy Benefits
The primary driver for most building owners to invest in energy efciency is the direct benet of reduced utility
costs. The average U.S. retail building’s annual energy expenditures amount to roughly $1.40/ft
2
, though there
is a particularly wide range of energy intensities in the retail sector (U.S. Energy Information Administration,
2006). This can represent a signicant portion of a building’s total operating costs. Thus, reducing utility costs
by 30% or more through a deep retrot would deliver a signicant cut in total operating costs and for income-
producing properties a potential increase in net operating income (NOI).
The energy benet may also be leveraged for public recognition. Programs such as ENERGY STAR and LEED
offer buildings a way to receive public recognition for high energy performance. An ENERGY STAR rating
is a label of excellence in building energy performance. Buildings that achieve an ENERGY STAR energy
performance score of 75 or higher, on a scale of one to 100 (with one being the worst energy performer and 100
the best), can receive the ENERGY STAR label. For an average performing building, with an ENERGY STAR
score of 50, an energy use reduction of approximately 30% will increase the ENERGY STAR score to above
75, making the building eligible for an ENERGY STAR label (Figure 2.5). This reduction is possible with the
implementation of a combination of the energy reduction measures outlined in this guide.
To accurately estimate the value of a project’s energy savings, many variables need to be considered, including
operating schedules, equipment efciency, interactions with other energy using systems, and energy costs,
which vary over time (Landsberg, Lord and Carlson, 2009). There are many approaches to estimating a project’s
energy savings potential. For simple equipment replacements, the most easily accessible estimate is often the
vendor’s published energy savings calculations. While this can be a good starting point, it’s essential to examine
the variables and assumptions used to calculate the savings value; for example, the vendor’
s claims for cooling
savings may be based on a building in a very hot climate. Integrated, deep retrots typically require savings to be
modeled using energy simulation software.
Estimating a project’s energy savings potential is challenging, but fortunately a number of tools have been
developed to calculate the energy usage of equipment and the potential savings of upgrades. Moreover, energy
auditing professionals and other contractors can be hired to complete the calculations. For a list of objective
calculator tools available online, see the Additional Resources at the end of this section. An additional calculation
resource is utility-sponsored energy efciency programs, which will often provide calculations of potential
energy savings to program participants.
§ Energy benefits
§ Non-energy benefits
§ Impact of lease structures
§ Building financial performance
§ Risks associated with inaction
§ Estimating project value
§ Choosing a financial analysis
method
ABOUT THIS SECTION

2 IMPROVING ENERGY PERFORMANCE IN EXISTING RETAIL BUILDINGS
39
Retail Buildings
Advanced Energy Retrofit Guides
Figure 2.5. Reduction in Energy Usage Leads to Increased ENERGY STAR Scores
75 = qualifies for
ENERGY STAR label
Non-Energy Benefits
While a strong business case can often be formed on energy cost savings alone, there are a number of other
benets that can enter into project economics. These non-energy benets may in fact be dominant project drivers
in situations where energy costs are less important to the bottom line. Non-energy benets fall into two categories
– quantitative and qualitative – with examples provided below:
Quantitative Benefits
u Reduced O&M expenditures
u Extended equipment life
u Increased rental value. Recent studies have found that commercial buildings with green certications
command 6 to 16% higher rents than otherwise comparable buildings (Eichholtz, Kok and Quigley, 2009;
Fuerst and McAllister, 2009)
u
Improved occupancy rates. The same studies observe signicantly higher occupancy rates for buildings with
green and efcient certications (Ibid). This message of tenants’ desire for high performance buildings is
likely to transfer to the retail sector
Increased rents and improved occupancy translate to higher net operating income for a building owner. Using a
common calculation method presented later in this section, this equates to higher asset value.

2 IMPROVING ENERGY PERFORMANCE IN EXISTING RETAIL BUILDINGS
40
Retail Buildings
Advanced Energy Retrofit Guides
Qualitative Benefits
u Reduced environmental impact of operations and progress towards sustainability-related objectives
u Marketing and PR value for energy saving practices and improved sustainability
u Improved indoor environmental quality (e.g., air quality, noise and lighting levels), which leads to more
satised building occupants and higher productivity
Impact of Lease Structures
For owner-occupied buildings, the owner bears the cost and enjoys the full nancial benet of energy
efciency improvements, which produces a natural motivation to consider cost-saving upgrades. In income-
producing properties, the lease term denes how the costs and benets of energy-saving upgrades would be
allocated between landlord and tenants. This plays a large role in determining each party’s motivation to pursue
improvements.
There are three primary lease structures in commercial real estate (U.S. Environmental Protection Agency
, 2007):
u
Gross lease: The landlord pays all utility costs, and hence would capture any cost savings that result from an
efciency upgrade. In a gross lease, the landlord’s motivation to invest in efciency should be similar to that
of the owner-occupant.
u
Net lease: The tenants pay all utility costs and are the initial beneciaries of the cost savings from efciency
upgrades. In a net lease, the landlord may be unmotivated to make upgrades due to an inability to realize
the operational cost savings produced by those improvements. Tenants, on the other hand, may be reluctant
to invest in upgrades to a building they do not own. Furthermore, in situations where the tenants’ shares of
savings are allocated based on their share of the building’s rentable square feet, a tenant that occupies only a
portion of the building could nd itself in a situation where it funds the entire cost of an upgrade to its own
space and receives a fraction of the resulting savings. These so-called “split incentives” can be a barrier to
energy efciency in landlord/tenant settings.
u
Fixed-base lease: The landlord pays utility costs up to a xed amount (typically in the context of a “base
year” or “expense stop” calculation) with the remainder being borne by the tenant. In a xed-base lease, the
exact terms dening the xed and variable expense portions, including how annual adjustments are made,
determine the extent to which the landlord, the tenant or both enjoy the nancial benets of efciency
upgrades made during the lease term.
Adequate energy metering is also an important requirement for tracking and attributing energy project costs
and savings. Sub-building level meters allow energy use to be attributed to specic building systems or spaces.
In multi-tenant buildings, such meters interact with lease terms to dene how project costs and savings may be
passed on to tenants. The building’s metering infrastructure has important implications for measurement and
verication (M&V) and continuous improvement activities through O&M, which are discussed in Chapter 6 and 7.
Overcoming the Split Incentive
There are several approaches to overcoming the so-called “split incentive” described above. First, lease language
could be crafted to ensure that the party that pays for an improvement is the one that receives the nancial
benets, enabling that party to recoup the rst cost of the said investment. Many leases include language that
allows the rst cost of an expense-reducing capital improvement to be passed through to the tenants at a pace that
is in line with the energy cost savings that are enjoyed by those tenants. This mechanism is particularly helpful in
the context of a net or xed-base lease, where the typical lease structure offers limited means for the landlord to

2 IMPROVING ENERGY PERFORMANCE IN EXISTING RETAIL BUILDINGS
41
Retail Buildings
Advanced Energy Retrofit Guides
recoup investments in efciency.
Second, implementing a “green lease” can provide an even greater incentive for owners and tenants to cooperate
in the pursuit and realization of energy cost savings. Such leases typically include provisions that make energy
efciency improvement a priority and help ensure that the party that pays for the increased efciency is the party
that primarily benets from it. Examples of resources for executing green leases include the Building Owners
and Managers Association (BOMA) International Commercial Lease and the California Sustainability Alliance’s
Green Leases Toolkit, both of which are included in the Additional Resources at the end of this section.
Finally, an increasing number of studies are noting that higher performing buildings appear to enjoy higher asset
values, occupancy, and rental rates. These benets provide strong nancial motivation for landlords to invest in
efciency upgrades even if their tenants would see all the direct cost
savings initially.
Building Financial Performance
In an income-producing property setting, the energy and non-energy
benets referenced above can result in either cost savings, increased
rental income (through higher base rent or lower vacancy), or both.
These benets can drive improved nancial performance for an income-
producing building in the form of both higher net operating income and
higher asset value.
Energy costs can comprise 30% or more of a building’s operating
expenses. But unlike some operating expenses, such as taxes and
insurance, energy should not be considered a xed cost.
In situations where the leases allow the landlord to capture the nancial
benets of an expense-reducing capital project, that project holds the
potential to boost the property’s net operating income (NOI). NOI may
also increase if the project enhances the property’s ability to attract
or retain tenants. If the property is perceived to have lower operating
expenses or a “greener” prole in the wake of the improvement, base
rents may increase, which also improves the property’s NOI.
Assuming a stable capitalization rate, incremental NOI has the potential to increase the building’s appraised
value. A common method for appraising income-producing property is called the “Income Approach” where the
NOI is divided by a “capitalization rate,” which can be described as the minimum rate of return required by an
investor who purchases the property without the use of leverage.
Asset Value = NOI / Capitalization Rate
Increases in asset value are important whenever a building is sold or renanced. V
aluation increases are also
important when an income-property owner needs to demonstrate an increase in equity; for example, in the
context of periodic portfolio assessments.
Consider a 100,000-ft
2
building with an annual
energy cost of $1.20/ft
2
.
If an eciency upgrade
costing $1.00/ft
2
reduces
annual energy expenses
by 15%, this equates
to $18,000 in annual
cost savings. At an 8%
capitalization rate, this
translates into a $225,000
increase in asset value,
which is more than twice
the project’s first cost.
EXAMPLE OF ENERGY SAVINGS
IMPACT ON ASSET VALUE

2 IMPROVING ENERGY PERFORMANCE IN EXISTING RETAIL BUILDINGS
42
Retail Buildings
Advanced Energy Retrofit Guides
Risks Associated with Inaction
The preceding sections of this guide illustrate how planning and implementing energy-saving upgrades requires
proactive decision-making and some level of initial nancial outlay. Energy and non-energy benets will soon
pay back the initial investment, but there are denite organizational challenges to overcome when energy
efciency is considered alongside the wide range of other ongoing activities and priorities. Improving energy
performance takes effort and there are some risks to consider; however, there are market-related and regulatory
risks associated with inaction that building owners should also consider.
Market Risk
In recent years, energy efcient buildings have begun to demand a premium on the commercial real estate market
(Eichholtz, Kok and Quigley, 2009). As market awareness of energy issues grows and tenants increasingly
demand the disclosure of building energy performance scores (e.g., ENERGY STAR score), the market value gap
between high performance and lower performance buildings will continue to widen.
Energy prices represent another source of market risk to building owners. Energy prices have proven to be
tremendously volatile in recent years. The potential for future price increases should be considered in long-term
nancial planning (Landsberg, Lord and Carlson, 2009).
Regulatory Risk
The threat of climate change has put the high energy use of buildings front and center in efforts to reduce national
energy use and carbon emissions (Landsberg, Lord and Carlson, 2009). If policymakers choose to regulate
energy and carbon as a way to reduce energy consumption, energy producers will likely pass on the additional
costs to energy consumers. An energy efcient building would be less impacted by this cost increase than
inefcient buildings.
Estimating Project Value
Understanding the benets of energy efciency and the risks of the status quo provides a compelling argument
for energy efciency upgrades. Once motivated, building owners will need to develop a project-specic business
case that will ensure that the project meets long-term cost-effectiveness requirements. The following analysis
methods quantify a project’s overall nancial impact in different ways, and the benets and drawbacks of each
approach are summarized.
Simple Payback Method
The most simple and commonly used nancial analysis method is simple payback. Simple payback is dened as
the time, in years, for a project’s cumulative annual savings to equal its upfront cost. For example, if a lighting
retrot costs $100,000 and saves $15,000 in annual energy costs, its simple payback would be 6.7 years.
Simple payback does not take into account any benets or costs that occur after the initial investment has been
recouped. A project can initially appear to be unattractive when viewed through the lens of simple payback
period, while a more complete economic analysis reveals it to be a highly protable investment. Life-cycle cost
(LCC) analysis (see below) is more effective at identifying the best project option, once the costs and benets of
each alternative are carefully analyzed and expressed in present value terms.

2 IMPROVING ENERGY PERFORMANCE IN EXISTING RETAIL BUILDINGS
43
Retail Buildings
Advanced Energy Retrofit Guides
Net Present Value (NPV)
NPV offers a more rigorous analysis than simple payback by not only extending the analysis to include all cash
ows over the useful life of the project, but also accounting for the time value of money. The project’s cash
ows include the rst cost, energy cost savings (which may be assumed to increase with rising energy prices),
and all other costs and benets, such as O&M costs and any salvage value at the end of the analysis term. The
calculation of a project’s NPV depends on the discount rate selected as well as the length of the analysis term.
Discount rate is often dened as the investor’s minimum acceptable rate of return for an investment whose
length and risk prole match those of the project being evaluated. In an NPV analysis, the discount rate is used to
determine the present value of each cash ow, adjusting all cash outows and inows over the life of the project
to comparable dollar amounts today. The choice of a discount rate is critical; the chosen rate should reect the
rate of return that could be earned on an investment of similar risk and duration.
A positive NPV indicates that the present value of the cash inows is greater than the present value of the
cash outows over the analysis term. A negative NPV indicates that the investment required is greater than the
project’s return, once all of the cash outows and inows are reduced to their present values and summed. Using
the same lighting retrot example, the present value of future cash ows, assuming an 8% discount rate and a
12-year useful life of the lighting equipment is calculated as $106,560. Subtracting the upfront project cost of
$100,000 produces an NPV of $6,560.
NPV is the primary metric used for economic analysis of the measures presented in this guide. See Appendix
10.4 for a detailed discussion of the NPV methodology as it is applied in this guide. The Additional Resources at
the end of this section offers publicly available tools to aid in NPV calculations.
Internal Rate of Return (IRR) and Modified Internal Rate of Return (MIRR)
IRR is related to NPV as it denes, for a given series of cash ows and a specic analysis term, the discount
rate that would result in an NPV of zero. Investors sometimes compare their discount rate (or “hurdle rate”) to a
project’s IRR.
A signicant shortcoming of IRR is that it assumes that all cash inows over the life of the investment can be
reinvested at the IRR itself. In most cases, this is an unrealistic assumption. Fortunately, an alternative metric can
be calculated: Modied Internal Rate of Return (“MIRR,” which is sometimes called, “Adjusted Internal Rate of
Return” or “AIRR”). MIRR allows the user to specify the rate at which cash inows will be reinvested during the
analysis term, yielding a nancial metric that is more reasonable than IRR.
Life-Cycle Cost (LCC)
As the name implies, life-cycle cost analysis considers all cash inows and outows over the useful life of the
project, reducing each ow to its present value. When two or more mutually exclusive alternatives are being
evaluated, the one with the lowest life-cycle cost should be selected. That alternative will represent the lowest
cost when expressed in present value terms. NPV, discussed above, is a form of LCC analysis.
There are many resources available that provide more detail and tools for calculating LCC, including the
National Institute of Standard and Technology’s Life-Cycle Costing Manual and online Building Life-Cycle
Cost Program tool. The Rocky Mountain Institute also offers a Microsoft Excel
®
-based LCC calculator called
LCCAid. See Additional Resources at the end of this section for a listing of these and other available tools.

2 IMPROVING ENERGY PERFORMANCE IN EXISTING RETAIL BUILDINGS
44
Retail Buildings
Advanced Energy Retrofit Guides
Choosing a Financial Analysis Method
The basic characteristics of several commonly used nancial analysis methods have been described; however,
there are many additional considerations specic to each method and for choosing between methods. Some
additional analytical considerations include:
u
Double counting. Some measures have interrelated energy savings and thus nancial impacts. It is important
to avoid double-counting savings to avoid skewing the analysis.
u
Assumptions about future values. Future cash ows are dependent on dynamic variables such as energy prices.
A simple sensitivity analysis can reveal how changes in these assumptions would impact project value.
u
The audience for the analysis. Some decision makers are only comfortable with certain methods of analysis.
This human factor is a key consideration when selecting an approach.
Generally, in situations where one needs to decide between mutually exclusive alternatives (e.g., one needs to
select a single chiller from a eld of many possibilities), LCC methods offer a more realistic portrayal of project
economics. LCC is more rigorous because it accounts for all cash outows and inows over the analysis term
and uses time value of money to adjust each cash ow to its present value.
In situations where one needs to decide the order in which non-mutually exclusive alternatives should be funded
(e.g., one needs to choose which of six potential energy-saving projects should be funded given limited capital),
one should rst calculate the NPV of each alternative (ensuring that no alternative has a negative NPV), and then
rank the proposed projects in order of descending MIRR so that they may be approved and funded in that order.
Taking this approach ensures the highest and best use of limited capital.
The resources and considerations referenced in this section should be considered a starting point for building a
solid business case for energy efciency projects. While sound engineering and nancial analyses are essential to
a project’s success, equally important is the alignment of all groups within an organization to achieve a common
goal. With participation from both the facility team and management team in the creation of the business case, a
project will have a much higher likelihood of successful execution.
§ Improved building energy eciency can reduce operational costs, and in the case of income-
producing properties, provide incremental net operating income and asset value.
§ In addition to energy cost savings, energy eciency improvements can have significant non-energy
benefits, including extended equipment life, increased lease rates, better indoor environmental quality,
improved occupant satisfaction, improved sustainability and associated marketing value.
§ Improving building performance is a risk management strategy; various market and policy risks can be
reduced by improving energy eciency.
§ Simple payback period and internal rate of return are both popular metrics; however, both have their
shortcomings. Modified internal rate of return, net present value and life-cycle cost are preferred, and
their proper use depends on whether the decision being made involves “mutually exclusive” or “non-
mutually exclusive” alternatives.
2.6 KEY POINTS

2 IMPROVING ENERGY PERFORMANCE IN EXISTING RETAIL BUILDINGS
45
Retail Buildings
Advanced Energy Retrofit Guides
Additional Resources
u BOMA, “BOMA International Commercial Lease: Guide to Sustainable and Energy Efcient Leasing
for High Performance Buildings”: A guide that helps property professionals execute a lease that addresses
building operations and performance. Available for purchase; www.boma.org.
u
California Sustainability Alliance, Green Leases Toolkit: An online toolkit that provides templates for
implementing a green lease. Available for free download online; www.sustainca.org.
u
Capital E, “The Costs and Financial Benets of Green Buildings”, 2003: A report that investigates the
nancial viability of investing in “sustainable” or “green” building practices. A
vailable for free download
online; www.cap-e.com.
u
Green Building Finance Consortium, “Value Beyond Cost Savings”, 2010: A guide to underwriting sustainable
properties. Available for free download online; www.greenbuildingfc.com.
u
Department of Energy, Energy Calculators & Software webpage: A list of resources related to estimating
energy use of equipment and potential energy savings of efciency measures. www.eere.energy.gov/
calculators/buildings.html.
u
California Commissioning Collaborative, Retrocommissioning Toolkit: Retrocommissioning online resources,
including spreadsheet tools to perform energy savings calculations. Available for free download online;
www.cacx.org.
u
Rocky Mountain Institute, LCCAid: An Excel-based tool designed to present the results of a LCC analysis in a
meaningful and compelling form for key decision makers. Available for free download online;
www.retrotdepot.org.
u
Environmental Protection Agency, Cash Flow Opportunity Calculator: Excel-based cash ow analysis tool
that includes NPV calculation and estimated cost of delaying efciency upgrades. Available for free download
online; www.energystar.gov.
u
National Institute of Standard and Technology (NIST), “Life Cycle Costing Manual”, 1995: A guide to
understanding the LCC methodology and criteria established by the Federal Energy Management Program.
Available for free download online; www.nist.gov.
u
Department of Energy, Building Life Cycle Cost program: An LCC analysis software program designed for
government projects but applicable to commercial projects. Available for free download online;
www.eere.energy.gov.
u
Pacic Northwest National Lab (PNNL), Facility Energy Decision System: A software tool that identies
energy efciency improvement opportunities and completes detailed retrot project analyses across a wide
variety of building types. Available for free download online; www.pnl.gov.
u
Environmental Protection Agency, “Building Upgrade Manual”, 2008: A strategic guide for planning and
implementing a protable energy saving building upgrade following a ve-stage process. Chapter 1 discusses
Investment Analysis. Available for free download online; www.energystar.gov.

2 IMPROVING ENERGY PERFORMANCE IN EXISTING RETAIL BUILDINGS
46
Retail Buildings
Advanced Energy Retrofit Guides
u ASHRAE, “Energy Efciency Guide for Existing Commercial Buildings: The Business Case for Building
Owners & Managers”, 2009: A guide to making the business case for efciency upgrades; includes discussion
of cash ow analysis methods. Available for purchase; www.techstreet.com.
u
Environmental Protection Agency, “A Retrocommissioning Guide for Building Owners”, 2007: A
comprehensive guide to EBCx projects; includes sections on lease structures and impacts to building nancial
metrics. Available for free download; www.peci.org.
u
BetterBricks, “The High Performance Portfolio Framework”: A strategic guide to improving building
performance; The “Commit” chapter includes discussion on developing a business case for efciency
upgrades. Available for free download; www.betterbricks.com.
2.7 Financial Assistance for
Energy Eciency Projects
Dening an approach for nancing is a key step in creating the business
case for an energy efciency project. The approach to nancing includes
determining the source of funds to pay upfront costs and identifying
incentives that may substantially reduce those costs. This section provides an overview of the most common
purchase options and some of the incentives available that may improve a project’s nancial attractiveness.
Purchase Options
A building owner has two primary routes to fund the upfront costs of an energy efciency project: purchase
of equipment and services, or performance contracting. In addition, utility and government incentives can be
leveraged to reduce total project costs.
Debt
While an owner may use cash to purchase the services and equipment associated with an energy efciency
project, the most common way to nance a project is through borrowing. When considering this option, it’s
recommended to research low-interest loans specically tailored to energy efciency projects (see “Utility
Incentives” below).
Government loans or loan guarantees are often available at multiple levels (local, state, and federal). Many
of these loan programs were historically limited to energy retrots in public buildings, but have recently been
extended to commercial buildings.
Performance Contracting
Performance contracting is an alternative to conventional project nancing. Under a performance contract, an
energy service company (ESCO) delivers turnkey energy efciency projects, with the project cost recovered
over time out of energy savings. The ESCO will typically complete an audit, obtain contractor bids, manage the
installation, and nance the project (Landsberg, Lord and Carlson, 2009). Energy cost savings are then shared
between the ESCO and the building owner, with the ESCO’s share of savings paying for the ESCO’s services,
including the cost of capital. See Figure 2.6.
§ Purchase options
§ Utility and government
incentives
ABOUT THIS SECTION

2 IMPROVING ENERGY PERFORMANCE IN EXISTING RETAIL BUILDINGS
47
Retail Buildings
Advanced Energy Retrofit Guides
Figure 2.6. Distribution of Energy Cost Savings through Performance Contracting
Performance contracting addresses many of the common barriers that delay projects. Some of the key benets
include:
u
Building owners avoid upfront project costs because the ESCO nances the project
u ESCOs provide technical expertise for implementing measures
u Risk may be reduced by including a savings guarantee in the project contract
Performance contracts are complicated by the technical nature of a large energy efciency project and the
complex and nuanced calculations they require. Measurement and verication of savings becomes a critical and
sometimes the controversial part of the contract and project, especially for larger investments where the contract
term may exceed ten years. In response to the complexity of designing and executing performance contracts,
several organizations offer detailed guidance on energy performance contracting. These resources are described in
the Additional Resources below.
The primary disadvantage of performance contracting is that the owner does not see the full benet of reduced
operating costs during the period of the contract. Further, the ESCO’s cost of capital has a signicant inuence
on the project economics. Some building owners may be able to secure nancing at better rates than the ESCO,
in which case the benet of a performance contract is reduced. On the other hand, ESCOs have a wealth
of knowledge about energy efciency measures, and they may be a valuable project partner even without a
performance contract.
Utility and Government Incentives
Leveraging incentives available through utility programs can be an effective way to reduce a project’s total cost.
There are numerous programs available offering cash rebates to help make an energy efciency project more
nancially attractive. The availability of incentives is time and location dependent. To compile an up-to-date list
of options, the Database of State Incentives for Renewables and Efciency (DSIRE) provides a good starting
point. Utility representatives are also often able to describe opportunities that relate to your facility. It’
s worth
noting that the incentives usually are issued upon project completion, so the owner will still need to make the full
upfront investment.

2 IMPROVING ENERGY PERFORMANCE IN EXISTING RETAIL BUILDINGS
48
Retail Buildings
Advanced Energy Retrofit Guides
Utility “On-Bill Finance”
Some utilities have started nancing energy efciency retrots through On-Bill Finance. On Bill Finance offers
utility customers the opportunity to receive a utility payment for a retrot and then repay the utility through a
charge on the utility bill, which is typically offset by project savings. As with performance contracting, this can
be a useful way to nance a project but will result in the owner not seeing the full benet of the savings until the
nancing is repaid.
Tax Relief
There are also nancial incentives available in the form of tax relief, offered by all levels of government, but
dependent on location. The primary tax relief offered by the federal government is the Commercial Buildings
Tax Deduction, which offers up to $1.80/sf for projects that achieve at least 50% energy cost savings (extended
through 2013 at time of publication). To demonstrate 50% savings, participating buildings are required to be
modeled in a qualifying software program (U.S. Department of Energy
, 2011b).
An additional tax relief mechanism that has been tested in local government pilot programs throughout the U.S.
is Property Assessed Clean Energy (PACE) nancing. By allowing building owners to nance retrot projects
as a property tax assessment, PACE nancing programs result in more favorable lending rates compared to
traditional loans.
Additional Resources
u Department of Energy, Database of State Incentives for Renewables and Efciency (DSIRE): An online
database of government and utility incentives available throughout the U.S.; www.dsireusa.org.
u
Department of Energy, Tax Incentives for Commercial Buildings webpage: Includes information related to the
“Commercial Buildings Tax Deduction”; www.eere.energy.gov/buildings/tax_commercial.html.
u
Department of Energy, Energy Savings Performance Contracts webpage: Extensive documentation of federal
experience with performance contracts; www.eere.energy.gov/femp/nancing/espcs.html.
u
BOMA, BOMA Energy Performance Contract (BEPC) model: A performance contracting toolkit that
includes boilerplates documents, including RFPs and contracts. Available for free download; www.boma.org.
u
Capital E, “Energy Efciency Financing: Models and Strategies,” 2011: A report that maps nancing models
and strategies that can help accelerate bank and institutional capital participation in scaling energy efciency
nancing. Available for free download; www.cap-e.com.
u
National Association of Energy Service Companies (NAESCO): Resource for list of qualied ESCOs;
www.naesco.org.
§ Commercial building owners’ two primary options for procuring energy eciency upgrades are cash
or conventional lending, and performance contracting.
§ Incentives in the form of special loans tailored to energy eciency upgrades, tax relief, and utility
rebates can be leveraged to reduce a project’s total costs.
2.7 KEY POINTS

3 EXISTING BUILDING COMMISSIONING (EBCx)
49
Retail Buildings
Advanced Energy Retrofit Guides
3
Existing Building
Commissioning (EBCx)
Signicant energy savings can often be achieved with
minimal risk and capital outlay by improving building
operations and restructuring maintenance procedures.
Operations and maintenance (O&M) includes two
components: “operations” focuses on the control and
performance optimization of equipment, systems,
and assemblies, while “maintenance” typically refers
to routine, periodic physical exercises conducted to
prevent the failure or decline of building equipment and
assemblies. This process of improving O&M procedures
is a key component of existing building commissioning
(EBCx), which is a quality-oriented process for
investigating and optimizing the performance of a
facility and its systems to meet the current needs of the
facility.
An EBCx process usually consists of four phases:
planning, investigation, implementation, and hand-off.
The EPA’s “A Retrocommissioning Guide for Building
Owners” includes a detailed discussion of the activities
that take place in each of these phases. Note that the
terms “EBCx” and “retrocommissioning” (RCx) are
used interchangeably. The EBCx process may vary
slightly for specic projects, but most projects follow the
process shown in Figure 3.1.
Much of the effort, and cost, of EBCx is applied during
the Investigation Phase, where the EBCx provider works
with the building operators to conduct an in-depth
investigation into building operations, to gain a detailed
understanding of the systems and assemblies and to identify operational improvements. About half of the overall
project cost is devoted to the EBCx provider’s work on the project, which includes this in-depth investigation.
The other half is devoted to implementing the measures.
Figure 3.1. EBCx Process

3 EXISTING BUILDING COMMISSIONING (EBCx)
50
Retail Buildings
Advanced Energy Retrofit Guides
EBCx is generally recommended even when deeper retrots are being considered, in order to optimize
building system operations prior to designing and implementing the retrots. Besides being a highly cost-
effective strategy for reducing energy usage, EBCx can help reduce other O&M costs besides energy, and
help ensure the persistence of proper operation. It provides a good rst step on the road to increased energy
performance, whether using a staged or integrated approach (see Section 2.5 “Planning for Energy Performance
Improvements”).
This chapter rst discusses O&M measure options that are suitable for most retail buildings. The O&M Measure
Summary Table provides a comprehensive list of O&M measures that could be identied and implemented as
part of an EBCx project. The measures included in this list were developed by evaluating the most common and
cost-effective measure options being implemented in retail buildings. For more detailed information about each
O&M measure, refer to Appendix 10.5.
A selection of these measures is then grouped in recommended packages for a representative retail building.
These packages have been subjected to careful energy and nancial analysis. The Energy Plus modeling results
of the EBCx recommended packages of measures resulted in an average energy savings of 15% across the
ve primary climate zones. As a point of comparison, Mills (2009) found 16% median energy savings among
hundreds of EBCx projects across the country.
Next, additional considerations for O&M measures and the EBCx process are offered that address factors that
can inuence cost-effectiveness, and aspects to consider when evaluating O&M measures. Because all buildings
are unique and have particular needs and opportunities for energy upgrades, building owners are encouraged to
think about how these aspects will inuence their projects.
This section concludes with case studies of retail buildings that have successfully implemented O&M measures
as part of an EBCx project. These case studies offer insight into the process that retail building owners went
through in completing their EBCx project, and highlight the energy savings and nancial results of select real
world projects.
3.1 O&M Measure Summary Table
Table 3.1 lists all O&M measure options investigated in this guide. Appendix 10.5 provides a discussion of the
technical details of each of these measures.
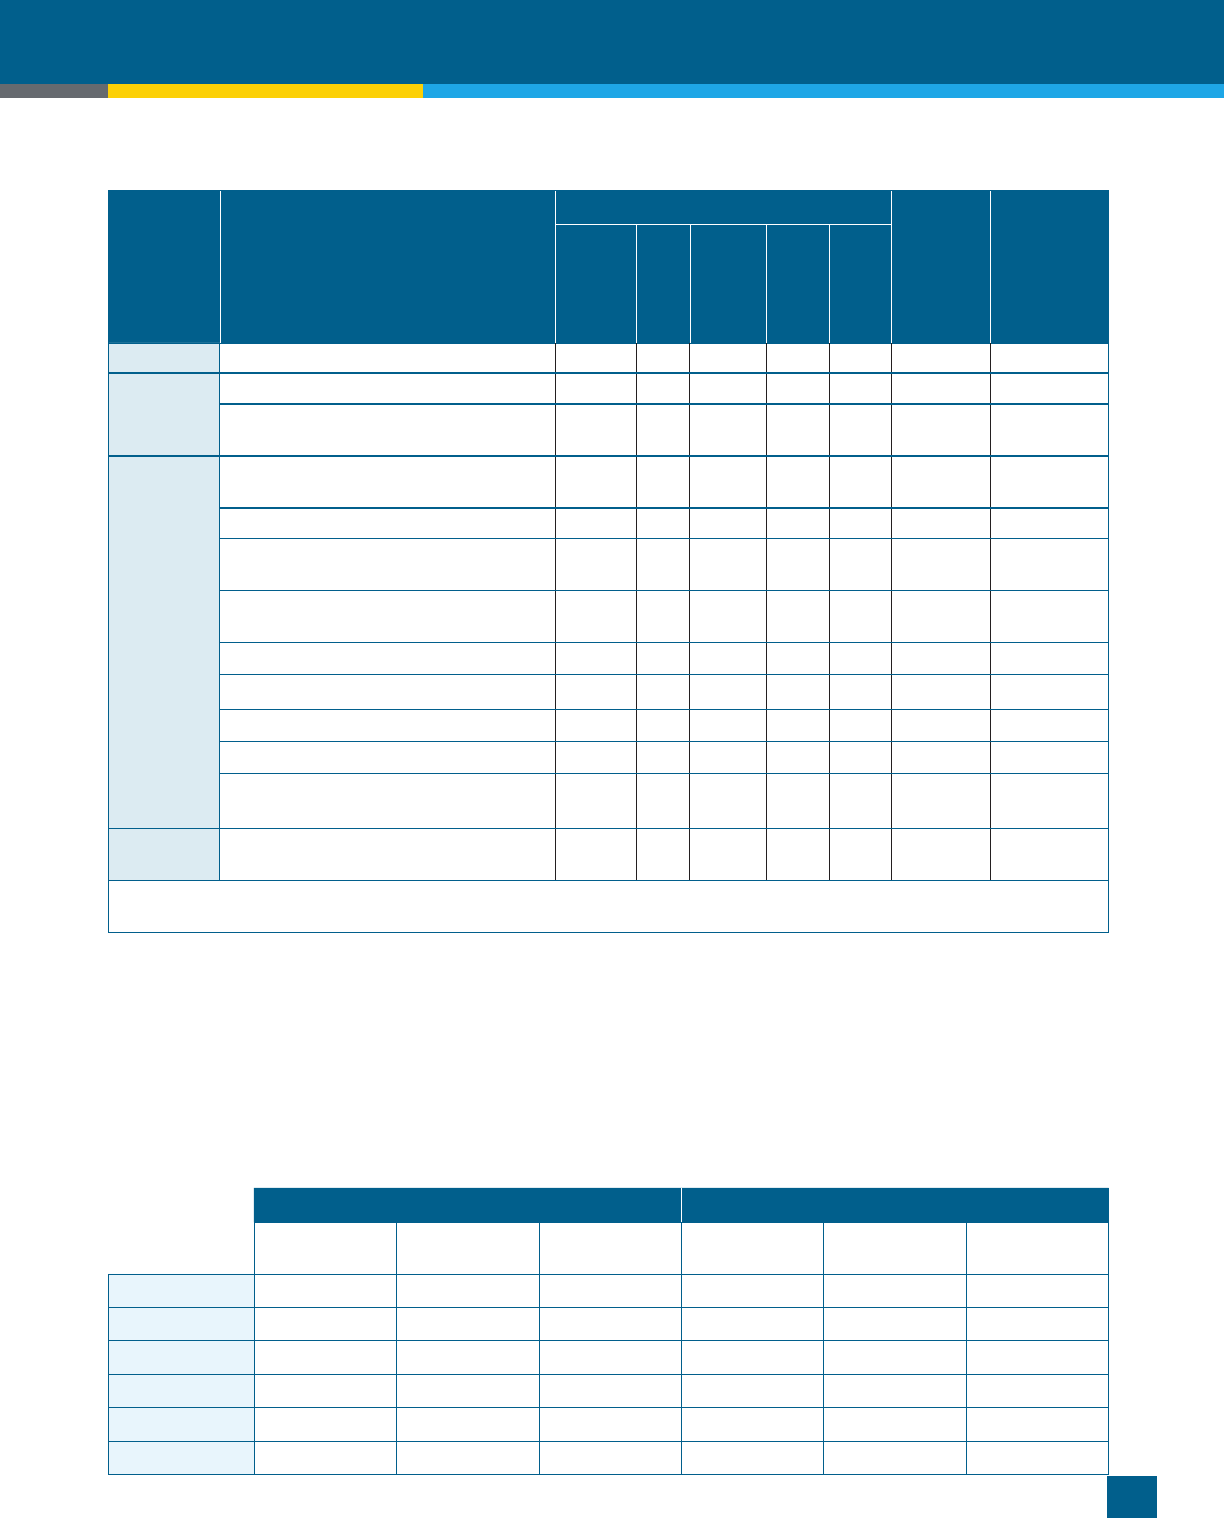
3 EXISTING BUILDING COMMISSIONING (EBCx)
51
Retail Buildings
Advanced Energy Retrofit Guides
System Measure Number and Description
Applicable To
Stage
(see
Section
2.5)
Appendix
Page #
Reference
Hot &
Humid
Hot & Dry
Marine
Cold
Very Cold
Lighting L1. Calibrate exterior lighting photocells RP RP RP RP RP 1 127
Envelope
E1. Reduce envelope leakage RP RP RP RP RP 1 127
E2. Replace worn out weather stripping
at exterior doors
RP RP RP RP RP 1 127
HVAC
H1. Clean cooling and heating coils, and
comb heat exchanger fins
RP RP RP RP RP 1 128
H2. Revise air filtration system RP RP RP RP RP 1 128
H3. Add equipment lockouts based on
outside air temperature
RP RP RP RP RP 1 128
H4. Reprogram HVAC timeclocks to
minimize run time
RP RP RP RP RP 1 129
H5. Optimize outdoor air damper control
RP RP RP RP RP 1 129
H6. Repair airside economizer
RP RP RP RP RP 1 129
H7. Implement a night purge cycle
O O O O O 1 130
H8. Correct refrigerant charge
O O O O O 1 130
H9. Increase deadband between heating
and cooling setpoints
RP RP RP RP RP 1 130
Service
hot water
S1. Replace plumbing fixture faucets
with low flow faucets with sensor control
RP RP RP RP RP 1 131
RP = measure is part of recommended package
O = measure is not part of recommended package but is an option
3.2 EBCx Recommended Packages
Tables 3.2 and 3.3 summarize the results of the energy and nancial analysis of the recommended packages of
O&M measures, and identify which measures are included for each climate zone.
At-A-Glance Results
Table 3.2. EBCx Recommended Packages - Results of Common Metrics
Site Energy Use Intensity (EUI) (kBtu/sf/yr) Annual Energy Cost per Square Foot
Baseline Post-EBCx
% Reduction
from Baseline
Baseline Post-EBCx
Reduction from
Baseline
Hot & Humid 107 93 13% $2.75 $2.39 $0.36
Hot & Dry 103 87 15% $2.71 $2.36 $0.35
Marine 90 78 14% $2.30 $2.01 $0.29
Cold 100 85 15% $2.83 $2.43 $0.40
Very Cold 102 86 16% $2.49 $2.19 $0.30
Average 100 86 15% $2.62 $2.28 $0.34
Table 3.1. O&M Measure Summary Table

3 EXISTING BUILDING COMMISSIONING (EBCx)
52
Retail Buildings
Advanced Energy Retrofit Guides
Table 3.3. EBCx Recommended Package Measures
System Measured Description Climate Zone
Appendix
Page # Ref.
Lighting L1. Calibrate exterior lighting photocells All 127
Envelope E1. Reduce envelope leakage All 127
Envelope E2. Replace worn out weather stripping at
exterior doors
All 127
HVAC H1. Clean cooling and heating coils, and
comb heat exchanger fins
All 128
HVAC H2. Revise air filtration system All 128
HVAC H3. Add equipment lockouts based on
outside air temperature
All 128
HVAC H4. Reprogram HVAC timeclocks to
minimize run time
All 129
HVAC H5. Optimize outdoor air damper control All 129
HVAC H6. Repair airside economizer All, except hot-humid 129
HVAC H9. Increase deadband between heating
and cooling setpoints
All 130
Service Hot
Water
S1. Replace plumbing fixture faucets with
low flow faucets with sensor control
All 131
The EBCx package is the same for all ve climate zones, with the following exception: the “Repair airside
economizer” measure is not included in the Hot-Humid package, since airside economizers are typically not used
in hot and humid climates, and the reference building for Miami does not include an airside economizer system.
Rationale for Recommended Measures
The measures in the EBCx package were chosen based upon their frequency of occurrence on EBCx projects,
ease of implementation, and likelihood of implementation.
Note that the measures included in the recommended package are only a subset of the measures listed in
Table 3.1 in Section 3.1. An EBCx process typically identies many opportunities for improved O&M and
energy performance. Often, some of those opportunities are not implemented, for reasons such as budgeting,
scheduling, and future planned work that would affect the measure. The measures in the EBCx package were
chosen as a representative mix of measures that would be implemented as part of an EBCx process.
Energy Savings
The energy and demand savings for the recommended EBCx packages are shown in Table 3.4. These values were
determined by applying the measures to the retail reference building described in Appendix 10.1.

3 EXISTING BUILDING COMMISSIONING (EBCx)
53
Retail Buildings
Advanced Energy Retrofit Guides
Table 3.4. EBCx Recommended Package - Energy Savings Results
Electricity
Savings (annual
kWh)
Electric
Demand
Savings
(peak kW)
Gas
Savings
(annual
therms)
Site (EUI)
Savings
(kBtu/sf/yr)
Savings as
% of Total
Site Usage
Source
EUI
Savings
(kBtu/sf/
yr)
Savings
as % of
Total
Source
Usage
Hot & Humid
100,200 19 150 14 14% 40 13%
Hot & Dry
89,200 23 720 15 15% 38 14%
Marine
60,600 20 1,000 12 14% 23 12%
Cold
67,900 20 1,300 15 15% 34 13%
Very Cold
54,000 18 2,200 16 16% 31 13%
The source EUI savings are calculated by the site EUI savings from simulation and the site-to-source conversion
factors from ve different utility companies (Florida Power & Light, Nevada Power, Puget Sound, Chicago
ComEd, and Minisota Power). The site-to-source conversion factors are calculated by the weighting factors for
each fuel type. As shown, implementation of O&M measures as part of an EBCx process can yield signicant
energy savings. The overall reductions in building energy usage shown in Table 3.4 are similar to the range cited
in research on actual EBCx projects (Mills, 2009).
Financial Analysis
The cost of individual measures can vary greatly, depending on the baseline condition of the building and the
work involved in implementing the measures. Studies have shown that the average cost for an EBCx project
is $0.30/sf. For smaller buildings such as the 24,692 sf retail reference building, this value will be higher, to
the order of $0.60/sf (Mills, 2009). Applying this value to the 24,692 sf retail reference building and applying
ination rates for the past two years gives an overall EBCx package cost, including EBCx provider costs and
measure implementation costs, of $15,100 (Table 3.5).
Table 3.5. EBCx Recommended Packages Financial Analysis Result
Total Measure
Costs
Total Annual
Energy Cost
Savings
Annual
O&M Cost
Savings
Total Annual
$ Savings
Simple
Payback
(Years)
Net Present
Value
Hot & Humid
$15,100 $8,910 $0 $8,910 1.7 $51,000
Hot & Dry
$15,100 $8,680 $0 $8,680 1.7 $48,900
Marine
$15,100 $6,950 $0 $6,950 2.2 $33,100
Cold
$15,100 $10,100 $0 $10,100 1.5 $61,600
Very Cold
$15,100 $7,370 $0 $7,370 2.0 $37,000
As shown, EBCx has a quick simple payback and positive net present value, making it an attractive method to
achieve energy savings. Studies have shown that EBCx has a simple payback of 1.1 years, on average, based
on energy savings (Mills, 2009). Note that the “Measure Costs” shown in the table are the overall EBCx project
costs, including the cost of the EBCx provider and the cost of implementing the measures.
Non-energy benets, such as improved thermal comfort and extended equipment life, can also be achieved by the
EBCx process. Studies have estimated the median non-energy impacts of EBCx at $0.18/ft
2
(Mills, 2004). This is
signicant, when compared to the median energy savings of $0.29/ft
2
related to EBCx (Mills 2009). While there

3 EXISTING BUILDING COMMISSIONING (EBCx)
54
Retail Buildings
Advanced Energy Retrofit Guides
may be savings that are realized beyond the energy savings reported in the table above, some costs may also
increase. Additional O&M expenses may be required to maintain optimal energy performance after the EBCx
process. For this analysis, the additional non-energy costs and benets were assumed to cancel out, resulting in
zero net impact on O&M expenses.
To maintain the energy benets related to O&M measures, it’s important to maintain the performance of the related
equipment and systems through periodic monitoring. The nancial analysis assumes that recommissioning
is performed every four years to maintain the persistence of benets, and that, as a result of this periodic
recommissioning, the measure life of EBCx is 20 years. The cost of recommissioning is usually less than the cost
of initial EBCx. For the nancial analysis, the recommissioning cost is estimated to be two-thirds of the initial
EBCx cost. This recommissioning cost is not identied separately in the table above, but it is included in the net
present value calculation.
3.3 Additional Considerations
The O&M measures proposed in the recommended packages above and comprehensive O&M measure list in
Appendix 10.5 provide a starting point for measure options to be considered for most retail buildings. However,
not all measures will be applicable to all buildings, since all buildings are unique. Moreover, other measures may
be applicable to a specic building that aren’t included in the measure list. The EBCx process, which includes
an in-depth investigation into building operations, will identify opportunities for improved performance of the
building, including energy performance, occupant comfort, O&M effort, and equipment performance. The extent
of the opportunities identied will be partly dependent on the comprehensiveness of the EBCx scope.
Building owners considering implementing the EBCx process will benet from consulting the detailed
description of the O&M measures in Appendix 10.5 to gain an understanding of the types of measures typically
implemented as part of an EBCx project. That appendix includes a discussion of each measure’s technical
characteristics, special considerations, and technical assumptions for implementing the measure in the reference
building.
When evaluating O&M measures to investigate in more detail for a specic building, the following aspects could
be considered to help narrow the options to the most feasible measures:
u
Is the measure applicable to the systems and assemblies in the building?
Certain measures may not be feasible due to the constraints of the installed systems. For example, adding
equipment lockouts based on outside air temperature may not be feasible for some types of HVAC systems.
u
Is the measure relevant to the operations of the building?
Measures that affect indoor environmental quality (IEQ) should be closely evaluated and considered, since
they may impact occupant comfort. Also, the capabilities of the service contractors and operations staff
should be considered when evaluating measures. Do the contractors and staff have the necessary skills and
knowledge to support the measure? If not, is there additional training that they can receive?
u
How difcult will it be to ensure that the measure persists?
After measures are implemented, they require periodic monitoring to ensure that the benets of the
measures are realized over time. Sufcient resources and strategies must be put into place to ensure
measure persistence.

3 EXISTING BUILDING COMMISSIONING (EBCx)
55
Retail Buildings
Advanced Energy Retrofit Guides
u Are there planned retrots that may wipe out the EBCx measure?
If a facility has scheduled retrots in the near future, it may make sense to delay implementation of EBCx
measures until those retrots have occurred. For example, if the exterior lighting will soon be upgraded to
more efcient xtures, it may not be worth calibrating the existing xtures’ integral photocells before the retrot.
The cost of EBCx is an important consideration for most building owners. Much of the cost of EBCx relates to
the EBCx provider cost – for the planning, investigation, and hand-off phases of a typical EBCx project (Mills,
2009). And most of the EBCx provider cost is spent during the in-depth investigation portion of the project.
While the cost of implementing O&M measures is typically low, it’s important to also consider the EBCx
provider effort, which is necessary to identify the O&M opportunities. EBCx providers are typically better
suited for managing the EBCx process than in-house staff or service contractors, for the following reasons (U.S.
Environmental Protection Agency, 2007):
u
The in-house staff or service contractors may not have the resources to lead the process, or the skills to
perform the in-depth investigation.
u
A third party EBCx provider offers a “second set of eyes,” with signicant experience to draw upon and
without biased notions about how the building should perform.
u
EBCx providers have the specialized tools for performing the work – e.g., data loggers, functional test forms,
power monitors
u
EBCx providers have the necessary analytic skills and resources for diagnosing performance issues and
determining the cost-effectiveness of identied improvements.
Many factors contribute to the cost-effectiveness of an EBCx project, and some of these factors can be identied
prior to starting an EBCx project. Some indicators of a good EBCx building candidate include:
u
High, unjustied energy use
u
Low performing building equipment or control systems (high failure rate)
u
Direct digital controls
u
Experienced and available in-house staff
u
Up-to-date building documentation
These are just a few of the factors that should be considered. An experienced EBCx provider can help determine
if a building is a good candidate for EBCx or not. To help determine a building’s suitability for EBCx and to give
greater condence in proceeding with an EBCx project, an ASHRAE Level I energy audit can be conducted.
Building occupants can also signal the suitability of a building for EBCx. A
building with a high number of
occupant complaints is often a good candidate for EBCx. In such a building, the O&M measures that will
result from an EBCx project will achieve energy savings and may also provide the additional benet of helping
to retain occupants. The building commissioning industry suggests that it is best practice to engage building
occupants during both investigation and persistence phases of commissioning (Building Commissioning
Association, 2008).

3 EXISTING BUILDING COMMISSIONING (EBCx)
56
Retail Buildings
Advanced Energy Retrofit Guides
O&M Case Study:
Wada Kings Interiors
Wada King Interiors* is an interior design and furniture retail store
located in Live Oak, CA. The store’s showroom was having trouble
receiving consistent heating and cooling from the building’s HVAC
system. Instead of conditioned air, the HVAC system would push
ambient air into the space.
Wada King Interiors leveraged a local utility program that offered
incentives for HVAC system tune-ups with the aim of optimizing
system controls, setpoints, and operations to run as efciently as
possible. The utility program facilitated a local contractor to inspect
the building’s HVAC system and make recommendations for how to
x the problem as well as improve the efciency of the system.
The contractor cleaned the cooling and heating coils, which xed
the air quality problem, and also adjusted the refrigerant charge
and the thermostat’s schedule. The result was a more effective, and
efcient HVAC system, with an estimated $2,640 annual savings in
electricity costs. With the nancial assistance of the utility program,
the store didn’t have any out of pocket expense and is now saving an
estimated 4% of energy use compared to before the retrot.
Project Costs
Financial
Incentives
Net Cost to Owner
$875 $875 $0
Estimated
Annual
Electricity
Savings
Estimated Annual
Gas Savings
Estimated Annual
Energy $ Savings
Simple
Payback
16.600 kWh 150 therms $2,640 0 years
Estimated Energy Use
Estimated Energy Use
Intensity (EUI)
Estimated
% Site
Savings
Before After Before After
4%
1,350 MBtu/yr 1,280 MBtu/sf 112 kBtu/ft
2
/yr 107 kBtu/ft
2
/yr
*The O&M HVAC tune-up measures completed in this case study do not encompass
the entire EBCx process.
Disclaimer: Reported energy savings results were provided by the building owner or
a third party and have not been veried.
Quick Facts
Owner: Wada King Interiors
Location: Live Oak, CA
Gross Square Footage: 12,000
Post-retrofit EUI: 107 kBtu/sf/yr
Key Measures
§ Complete thermostat
adjustments
§ Including revising schedules
and adjusting unoccupied
setpoints and fan modes
§ Adjust refrigerant charge
§ Clean cooling/heating coils
onrooftop units

3 EXISTING BUILDING COMMISSIONING (EBCx)
57
Retail Buildings
Advanced Energy Retrofit Guides
3.4 Additional Resources and Guides
For additional references related to the EBCx process and O&M measures discussed in this chapter, refer to the
following.
General Guidance
u Environmental Protection Agency, “A Retrocommissioning Guide for Building Owners,” 2007: A
comprehensive guide to the EBCx process. Also includes case studies, sections on lease structures and
impacts to building nancial metrics. Available for free download online; www.peci.org.
u
Mills (Lawrence Berkeley National Lab), “Building Commissioning: A Golden Opportunity for Reducing
Energy Costs and Greenhouse Gas Emissions,” 2009: An investigation of the cost-effectiveness of EBCx that
leverages past EBCx project data. Available for free download online; www.lbl.gov.
u
Environmental Protection Agency, “Building Upgrade Manual,” 2008: A strategic guide for planning and
implementing a protable energy saving building upgrade following a ve-stage process. Available for free
download online; www.energystar.gov.
u
U.S. Green Building Council, “Green Operations Guide: Integrating LEED into Commercial Property
Management,” 2011: A resource to assist building owners in reducing the environmental impact associated
with commercial real estate operations, while also helping to facilitate LEED for Existing Buildings: O&M
certication. Available for purchase online; www.usgbc.org.
Technical Guidance
u California Commissioning Collaborative: A source for case studies, tools, and templates related to EBCx
projects; www.cacx.org
u
BetterBricks: A source for advice and resources related to building operations; www.betterbricks.org.
u
PECI, “A Study on Energy Savings and Measure Cost Effectiveness of Existing Building Commissioning,”
2009: A cost-effectiveness analysis of EBCx on a measure by measure basis. Available for free download
online; www.peci.org.
u
PECI, “Functional Testing Guide,” 2006: Guidance and sample tests for HVAC systems, as well as advice on
how to achieve integrated operation. Available for free download online; www.peci.org.
u
Building Operator Certication (BOC): A nationally recognized training and certication program for
building operators. The BOC training focuses on improving an operator’s ability to operate and maintain
comfortable, energy efcient facilities. More information available at www.theboc.info.

4 STANDARD RETROFITS
59
Retail Buildings
Advanced Energy Retrofit Guides
4
Standard Retrofits
Standard retrot measures provide cost-effective and low-risk efciency upgrade options for building owners
who are limited to making incremental capital upgrades to their building. Standard retrot measures include
equipment, system and assembly retrots. They are different from the EBCx process, which alters a building’s
O&M strategies based on an in-depth investigation, and from deep retrots, which simultaneously retrot
equipment on multiple building systems using an integrated design approach. Standard retrots are often staged,
with one measure conducted after another. The sequencing of standard retrot measures is important, as the
impact of a retrot to one system (e.g., lighting) will have an impact on other systems (reduced HVAC load). See
the “Staged Approach” discussion in Section 2.5 “Planning for Energy Performance Improvements”.
The scope of Chapter 4 is limited to standard retrots, except for the Retrot Measure Summary T
able (see
Section 4.1), which includes measures that could be implemented as part of either a standard retrot project or a
deep retrot project. In other words, standard and deep retrot measures are not mutually exclusive; a measure
may be part of a standard retrot project if implemented in a staged approach, but part of a deep retrot project if
implemented in an integrated design approach. The Retrot Measure Summary Table provides a starting point for
considering retrot measure options that are relevant for each climate zone.
Following the measure summary, recommended standard retrot packages are presented. These packages for
a representative retail building have been developed for ve primary climate regions in the U.S. The measures
included in the recommended packages were selected for their appropriateness and cost-effectiveness in each
climate region and result in energy savings of up to 38% when coupled with implementation of a package of
O&M measures. The energy savings and nancial analysis for each recommended package takes into account
interactive effects between building systems and other retrot measures in the package to provide as accurate as
possible expected results.
Next, additional considerations for standard retrots are offered that address factors that can inuence cost-
effectiveness, and aspects to consider when evaluating retrot measures. Because all buildings are unique and
have particular needs and opportunities for energy upgrades, building owners are encouraged to think about how
these aspects will inuence their projects.
Finally, case studies of retail buildings that have successfully implemented standard retrot measures are
provided to show the effectiveness of these retrots in actual buildings. These case studies provide insight into
the process the retail building owners went through for completing their standard retrot project, and exhibit the
energy savings and nancial results achieved by real world projects.

4 STANDARD RETROFITS
60
Retail Buildings
Advanced Energy Retrofit Guides
4.1 Retrofit Measure Summary Table
Table 4.1 lists all standard and deep retrot measure options investigated in this guide. Appendix 10.6 provides a
discussion of the technical details of each of these measures, along with an energy savings and nancial analysis
for each measure.
Table 4.1. Retrofit Measure Summary Table
System Measure Number and Description
Applicable to:
Stage
(see
Section
2.5)
Appendix
Page #
Reference
Hot &
Humid
Hot & Dry
Marine
Cold
Very Cold
Lighting L2. Install occupancy sensors to control
interior lighting
O O O O O 2 133
L3. Add daylight harvesting RP-
S&D
RP-
S&D
RP-
S&D
RP-
S&D
RP-
S&D
2 134
L4. Re circuit and schedule lighting
system by end use
RP-
S&D
RP-
S&D
RP-
S&D
RP-
S&D
RP-
S&D
2 135
L5. Retrofit interior fixtures to reduce
lighting power density by 13%
RP-S RP-S RP-S RP-S RP-S 2 136
L6. Retrofit interior fixtures to reduce
lighting power density by 24%
O O O O O 2 136
L7. Retrofit interior fixtures to reduce
lighting power density by 58%
RP-D RP-D RP-D RP-D RP-D 2 136
L8. Install skylights and daylight
harvesting
RP-D RP-D RP-D RP-D RP-D 2 139
L9. Retrofit exterior fixtures to reduce
lighting power density, and add exterior
lighting control
RP-
S&D
RP-
S&D
RP-
S&D
RP-
S&D
RP-
S&D
2 141
Plug &
Process
Loads
P1. Purchase energy ecient oce and
sales equipment O O O O O 2 142
P2. Add advanced on/o control of
common plug load equipment
O O O O O 2 143
Envelope E3. Replace windows and frames
O O O O O 2
144
E4. Install high R-Value roll-up receiving
doors
O O O O O 2 145
E5. Install cool roof
O O O O O 2 146
E6. Add roof insulation
RP-D O O O O 2 147
E7. Add wall insulation
O O O O O 2 148
E8. Add overhangs to windows
O O O O O 2 149

4 STANDARD RETROFITS
61
Retail Buildings
Advanced Energy Retrofit Guides
System Measure Number and Description
Applicable to:
Stage
(see
Section
2.5)
Appendix
Page #
Reference
Hot &
Humid
Hot & Dry
Marine
Cold
Very Cold
HVAC H10. Adjust airside economizer damper
control
O O O O O 3 151
H11. Add demand-controlled ventilation
O O O O O 3 151
H12. Replace RTUs with higher
eciency units
RP-D RP-D RP-D RP-D RP-D 3 152
H13. Replace RTUs with units that use
evaporative cooling
O O O O O 3 154
H14. Replace RTUs with high eciency
VAV units
O O O O O 3 155
H15. Replace HVAC system with a
dedicated outdoor air system
RP-D RP-D RP-D RP-D RP-D 3 156
H16. Replace RTUs with air-to-air heat
pumps
O O O O O 3 158
H17. Replace HVAC system with a
displacement ventilation system
O O O O O 3 158
H18. Remove heat from front entry
O O
RP-
S&D
RP-
S&D
RP-
S&D
3 159
SHW S2. Increase eciency of service hot
water system
O O O O O N/A 160
Other O1. Replace electric transformers with
higher eciency models
O O O O O N/A 162
RP-S = measure is part of standard retrofit recommended package
RP-D = measure is part of deep retrofit recommended package
RP-S&D = measure is part of standard and deep retrofit recommended package
O = measure is not part of recommended package but is an option
Table 4.1 (contd)

4 STANDARD RETROFITS
62
Retail Buildings
Advanced Energy Retrofit Guides
4.2 Standard Retrofit Recommended
Packages
Tables 4.2 and 4.3 summarize the results of the energy and nancial analysis of the recommended packages of
standard retrot measures, and identify which measures are included for each climate zone.
At-A-Glance Results
Table 4.2. Standard Retrofit Recommended Packages - Results of Common Metrics
Site Energy Use Intensity (EUI)
Savings (kBtu/sf/yr)
Site EUI Reduction
Annual Energy Cost
per Square Foot
Baseline
Post-
Standard
Retrofit
Post-
EBCx
Post-Standard
Retrofit
Reduction
beyond EBCx
Baseline
Post-
Standard
Retrofit
Reduction
from
Baseline
Hot & Humid
107 73 13% 32% 18% $2.75 $1.98 $0.77
Hot & Dry
103 69 15% 33% 18% $2.71 $1.96 $0.75
Marine
90 58 14% 36% 22% $2.30 $1.55 $0.75
Cold
100 64 15% 36% 21% $2.83 $1.87 $0.96
Very Cold
102 63 16% 38% 22% $2.49 $1.65 $0.84
Average
100 66 15% 35% 20% $2.62 $1.80 $0.82
The retrot measures included in the standard retrot packages are shown in Table 4.3. The last measure,
“Remove heat from front entry,” is included in the Cold, Very Cold, and Marine standard retrot packages only.
The Hot-Humid and Hot-Dry standard retrot packages do not include this measure.
Table 4.3. Standard Retrofit Recommended Package Measures
System Measure Description Climate Zone
Appendix
Page # Ref.
Lighting L3. Add daylight harvesting All 134
Lighting L4. Re circuit and schedule lighting system
by end use
All 135
Lighting L5. Retrofit interior fixtures to reduce
lighting power density by 13%
All 136
Lighting L9. Retrofit exterior fixtures to reduce
lighting power density, and add exterior
lighting control
All 141
HVAC H18. Remove heat from front entry Marine, Cold, Very
Cold
159
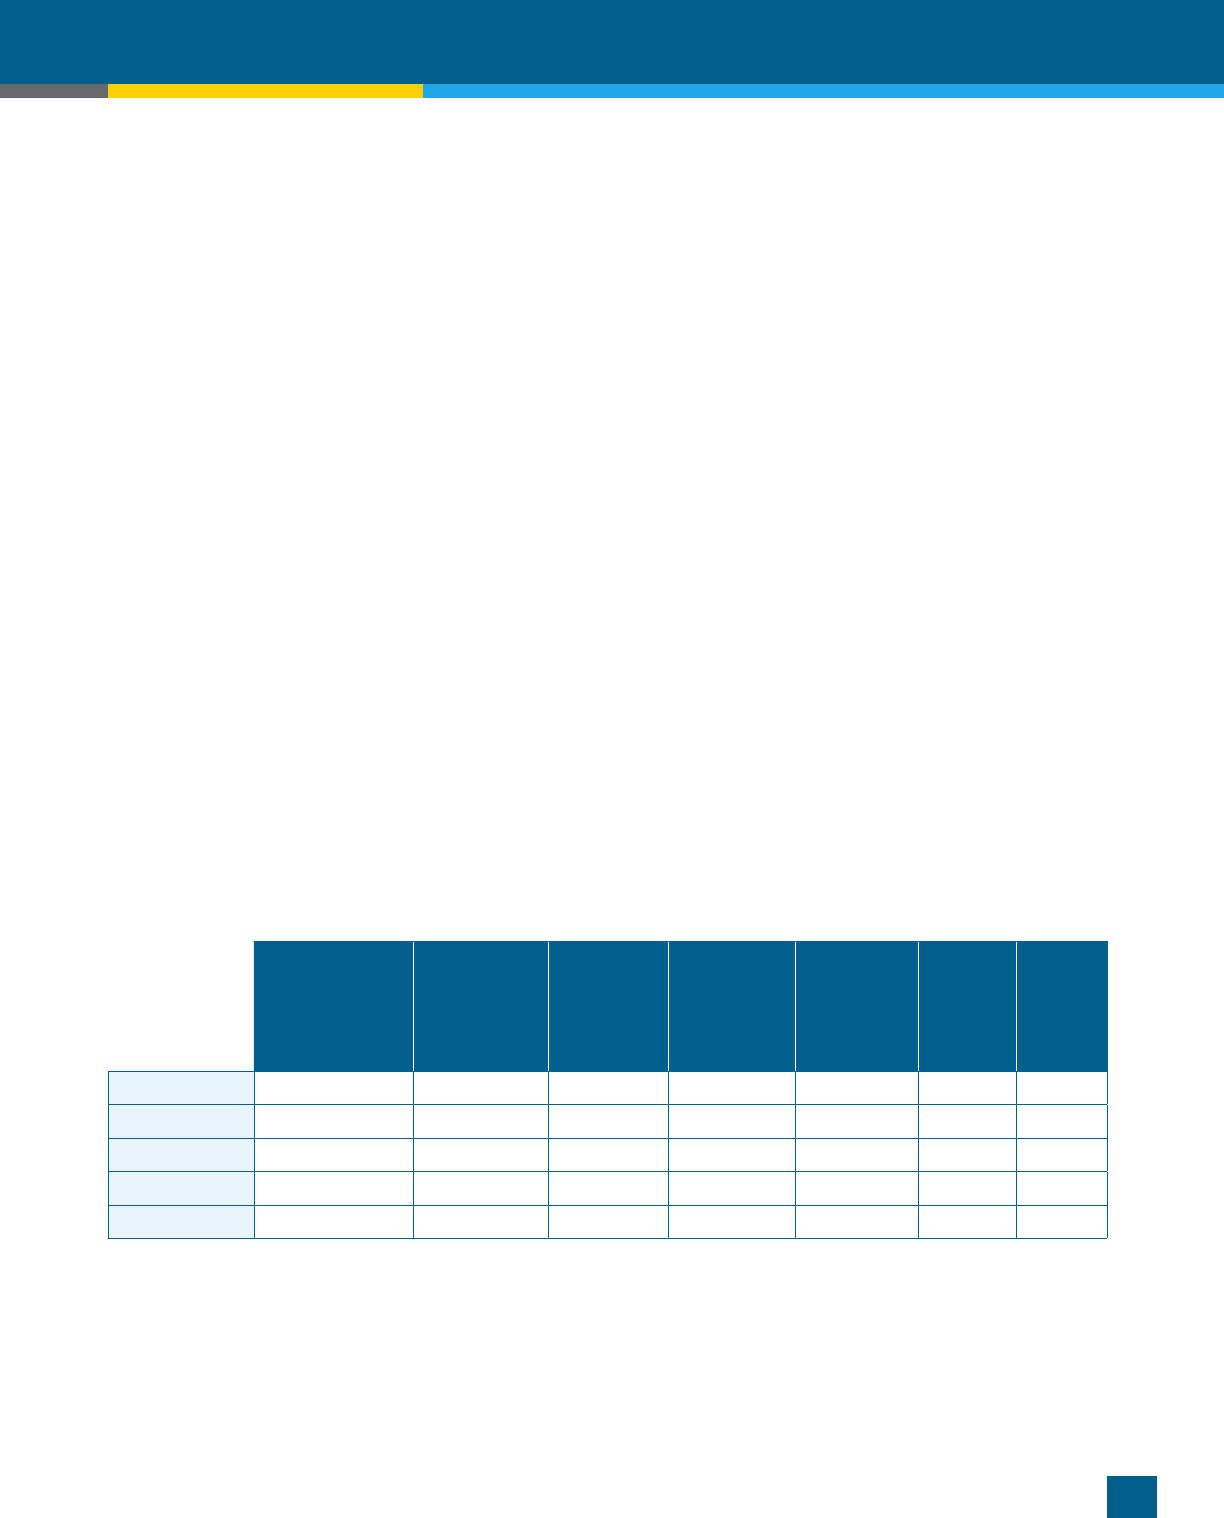
4 STANDARD RETROFITS
63
Retail Buildings
Advanced Energy Retrofit Guides
Rationale for Recommended Measures
The measures were chosen for inclusion in the standard retrot package based on their high energy savings
potential, high cost-effectiveness, and relatively simple implementation. These are representative of measures
that building owners typically implement solely to realize energy savings. Often, owners will implement
these measures before the affected equipment has reached the end of its useful life. For example, the exterior
lighting measure may be implemented prior to the xtures reaching the end of their service life. Note that other
measures could be included as part of a standard retrot package – the measures listed above were chosen as a
representative example.
The measures included in the standard retrot package either add functionality to existing systems, replace an
existing system component with a more efcient version, or adjust an existing system to operate more efciently.
They are measures that typically do not require a design process as part of implementation, and usually do not
represent changes to system types. For retail buildings, they are measures that can be implemented with minimal
disruption to the store’s normal operations.
The measures were also chosen for simplicity – they can be implemented concurrently or in any order, since the
four load-based lighting measures do not impact the one HVAC measure. Other combinations of standard retrot
measures may benet from a staged approach, as discussed previously in this guide.
Energy Savings
The analysis of the standard retrot package assumes that O&M measures are implemented rst, as part of an
EBCx process, and then the retrot measures shown in table 4.3 are implemented. This is estimated to result in
savings of more than 30% of site energy usage, based on an analysis of the measures included in the packages
using EnergyPlus. In the following table, each climate zone shows signicant energy savings, with only small
variation between the zones. For the savings of individual retrot measures included in the package, see
Appendix 10.6.
Table 4.4. Standard Retrofit Recommended Packages - Results of Common Metrics
Electricity
Savings (annual
kWh)
Electric
Demand
Savings
(peak kW)
Gas
Savings
(annual
therms)
Site EUI
Savings
(kBtu/sf/yr)
Savings as
% of Total
Site Usage
Source
EUI
Savings
(kBtu/sf/
yr)
Savings
as % of
Total
Source
Usage
Hot & Humid 240,000 30 140 34 32% 94 31%
Hot & Dry 225,000 34 610 34 33% 90 32%
Marine 193,000 31 1,400 32 36% 64 35%
Cold 200,000 29 2,000 36 36% 91 34%
Very Cold 185,000 29 3,200 39 38% 86 36%
Financial Analysis
The nancial metrics associated with the standard retrot package in each climate zone are shown in the
following table. These metrics include the O&M measures implemented as part of an EBCx process, and
implementation of the retrot measures shown in Table 4.3. As such, the initial savings were calculated as the
difference between the energy use of the baseline reference building and the energy use after both EBCx and the
installation of the standard retrot package. For the nancial metrics of individual retrot measures included in
the package, see Appendix 10.6.

4 STANDARD RETROFITS
64
Retail Buildings
Advanced Energy Retrofit Guides
As shown in Table 4.5, when combined with the savings from the EBCx process, the standard retrot package
has a fast simple payback and positive net present value, making it an attractive method to achieve energy
savings.
Table 4.5. Standard Retrofit Recommended Packages Financial Analysis Result
Total Measure
Costs
Total Annual
Energy Cost
Savings
Annual
O&M Cost
Savings
Total Annual
$ Savings
Simple
Payback
(Years)
Net Present
Value
Hot & Humid
$113,000 $29,000 ($220) $27,800 4.1 $116,000
Hot & Dry
$137,000 $27,400 ($260) $27,100 5.1 $90,800
Marine
$133,000 $25,500 ($250) $25,200 5.3 $77,000
Cold
$152,000 $34,000 ($280) $33,700 4.5 $131,000
Very Cold
$137,000 $28,100 ($250) $27,900 4.9 $95,500
The nancial analysis of the standard retrot packages is based on the assumption that the original equipment
is replaced before the end of its useful life. The annual cash ows used in the NPV calculation assumes that the
original equipment would have been replaced with current technology at year 10 of the 20-year analysis period.
After year 10, the energy savings were reduced by 50% to adjust for the improved baseline performance that
would most likely have resulted if the original equipment were replaced at the end of its life.
The expected useful life of the standard retrot package is assumed to be 20 years due to the periodic
recommissioning efforts that are implemented throughout this timeframe. Additional costs required to maintain
individual measures in the package with less than a 20 year life, such as the photocells and occupancy sensors,
are reected as increased annual O&M costs.
4.3 Additional Considerations
The standard retrot measures proposed in the recommended packages above and comprehensive retrot
measure list in Appendix 10.6 provide a starting point for standard retrot options to be considered for most
retail buildings. However, not all measures will be applicable to all buildings, and there may be some other
measures that are applicable to a specic building yet aren’t included in the measure list. The standard retrot
measures presented in this guide are applicable to a theoretical reference building used to model the measures’
savings, which has characteristics similar to common retail buildings in the U.S. See Appendix 10.1 for a detailed
discussion of the reference building’s characteristics and considerations and for how the energy savings results
may be impacted by variations in building characteristics.
Building owners considering implementing specic retrot measures should consult the detailed description of
the retrot measures in Appendix 10.6 to gain an understanding of the types of retrot measures that can typically
be implemented. That appendix includes a discussion of each measure’s technical characteristics, special
considerations, and technical assumptions for implementing the measure in the reference building.
When evaluating standard retrot measures for application to a specic building, the following aspects besides
measure cost-effectiveness could be considered to help narrow the options to the most feasible measures:
u
Are the equipment or assemblies in the building nearing the end of their useful lives?
By identifying and evaluating equipment that is nearing the end of its life before it has failed, owners can
evaluate multiple retrot options considering all potential costs and benets instead of just replacing the
equipment with like equipment once it fails.

4 STANDARD RETROFITS
65
Retail Buildings
Advanced Energy Retrofit Guides
u Is the measure relevant to the operations of the building?
The capabilities of the service contractors and/or operations staff should be considered when evaluating
measures. Does the staff have the necessary skills and knowledge to support the measure? If not, is there
additional training that they can receive?
u
Are there load-based retrots that can be considered and implemented prior to HVAC retrots?
As mentioned previously in this guide, using a staged approach for standard retrots can produce greater savings
and increased performance than just replacing systems and components with like-sized equipment. Implementing
load-based retrots rst, which have an impact on the heating and cooling load, can help lower the cost of
subsequent HVAC retrots, improve the performance of HVAC systems, and reduce the overall energy use of the
building.
u
Have the building characteristics changed over time in a way that could impact the retrot?
When replacing equipment, it’s important to evaluate whether or not the equipment should be replaced with like-
sized equipment. As load-based retrots occur over time in a building (e.g., envelope, lighting), the load on the
HVAC equipment can change, which can impact the necessary size of the equipment. Also, if building operating
criteria have changed over time, this can also impact the new equipment. For example, if required lighting levels
have changed, this could impact the number and layout of xtures installed in a lighting retrot.
u
Do energy codes apply to the retrot?
Energy codes have minimum efciency standards for most equipment installed in retail buildings. Prior to
embarking on a retrot project, it’s important to ensure that the equipment being installed as part of the retrot
meets or exceeds local energy efciency codes.
u
Are there incentives that can help increase the cost-effectiveness of a particular retrot?
Many electric and gas utilities offer incentives for replacing old, inefcient equipment with new equipment
that exceeds the code energy efciency requirement. The local utility can provide information on incentive
programs.
u
Will the retrots be commissioned during implementation, to verify performance?
Commissioning helps verify that a system is operating as intended. To realize the energy savings related to
retrots, it’s important that the retrots be commissioned to ensure that the systems are operating correctly.
One of the most cost effective measures that can be implemented in buildings is not found in this chapter,
because it does not t neatly into the mold of retrots. That measure is promoting occupant behaviors which will
reduce energy consumption. Many building loads, notably plug loads, depend directly on occupant behavior.
Others, such as HVAC operations, are at least strongly inuenced by occupant behavior. Owners typically
go to great lengths to shelter building occupants from the impacts of retrots. Mitigating negative impacts
during construction is obviously important, but a retrot also presents an opportunity to engage occupants in a
discussion about their role in building energy consumption. Planning for this discussion may yield additional
benets, beyond those quantied in this chapter.

4 STANDARD RETROFITS
66
Retail Buildings
Advanced Energy Retrofit Guides
Standard Retrofit Case Study:
Lexus of Las Vegas
Lexus of Las Vegas decided in 2007 to further its goal of setting a
high standard for energy efciency and environmental sustainability
by pursuing a LEED for Existing Buildings certication. The
dealership contacted consultant Sustainable Energy Solutions
(SES) to guide them through the process of LEED certication and
provide technical expertise on achieving its energy reduction and
environmental goals.
Lexus of Las Vegas and SES worked together over the course of
three years to identify and implement a series of energy efciency
measures. Through the implementation of O&M measures,
installation of variable frequency drive (VFDs), and upgrades to both
the interior and exterior lighting systems, Lexus of Las Vegas has
seen an estimated 20% reduction in site energy use and is saving an
estimated $85,000 a year in energy costs.
The project showcases how a staged approach to energy efciency
measure implementation can achieve impressive results and provide
an attractive return on investment (ROI). At the time of publication,
Lexus of Las Vegas is planning additional energy efciency
projects and is a contestant in the EPA’s 2011 National Buildings
Competition.
Audit Costs
Equipment &
Installation Costs
Net Cost to Owner
$11,000 $134,000 $145,000
Estimated
Annual
Electricity
$ Savings
Estimated
Annual
Demand $
Savings
Estimated
Annual
Energy $
Savings
Simple
Payback
ROI
$76,600 $8,700 $85,300 1.7 years 53%
Estimated Energy Use
(EUI)
Estimated
% Site
Savings
Before After
20%
73 kBtu/ft
2
/yr 58 kBtu/ft
2
/yr
Disclaimer: Reported energy savings results were provided by the building owner or
a third party and have not been veried.
Quick Facts
Owner: AAG Real Estate Las
Vegas LLC
Location: Las Vegas, NV
Gross Square Footage: 123,500
Post-retrofit EUI: 67 kBtu/sf/yr
Key Measures
§ Install VFDs on HVAC
glycol loop pumps
§ Implement O&M measures
on ice plant, lighting
and HVAC system,
including demand control
ventilation
§ Upgrade exterior lighting
to lower wattage lamps
§ Upgrade interior lighting
§ Including wattage
reduction and controls
4 STANDARD RETROFITS
67
Retail Buildings
Advanced Energy Retrofit Guides
Standard Retrofit Case Study:
Sears – Glen Burnie
Sears has developed more ambitious energy management strategies
in the past 5 years as a way to reduce its operational costs. Wanting
to showcase the results of its efciency upgrades, Sears chose to
enter its Glen Burnie, Maryland store in the 2010 ENERGY STAR
National Building Competition. The impressive results on the project
can be seen in the table below, but just as important are the lessons
the project teaches in organizational alignment.
Sears’ energy services project manager comments that “Project
support at all levels, from upper management to the energy team
to store managers and associates, was key to project execution and
success.” The high level of support that led to the success of the Glen
Burnie project was achieved through a combination of objective
project analysis and shared enthusiasm for reducing energy costs.
The nancial analysis of the project at a chain-wide level included
simple payback, as well as Net Present Value and Internal Rate of
Return calculations, which clearly laid out the project’s positive
long-term cash ow impact, and helped make the business case for
initiating the project.
Once the project was initiated, the Glen Burnie store managers
showed remarkable enthusiasm for the project. Store managers were
trained in operation of the store’s EMS system and took an active
role in ensuring efciency measures were operating as intended. This
high level of cooperation between the store managers and the energy
management team was key in delivering the impressive results of the
project: a 32% reduction in Energy Use Intensity (EUI).
Equipment
Costs
Installation
Costs
Financial Incentives
(utility rebates &
federal tax credits
Net Cost to
Owner
$143,800 $61,000 $110,000 $94,800
Estimated
Annual
Electricity
$ Savings
Estimated
Annual
Demand $
Savings
Estimated
Annual
Energy $
Savings
Simple
Payback
ROI
$46,000 $5,700 $52,000 1.8 years 55%
Estimated Energy Use
(EUI)
Estimated
% Site
Savings
Before After
32%
104 kBtu/ft
2
/yr 71 kBtu/ft
2
/yr
Disclaimer: Reported energy savings results were provided by the building owner or
a third party and have not been veried.
Quick Facts
Owner: Sears
Location: Glen Burnie, MD
Gross Square Footage: 198,000
Post-retrofit EUI: 71 kBtu/sf/yr
Key Measures
§ Retrofit 4-Lamp 32W T8
fixtures with 2-lamp 30W T8
fixtures
§ Install occupancy sensors in
restrooms and oces
§ Implement HVAC preventative
maintenance
§ Adjust HVAC and lighting
schedules through EMS
§ Relocate zone thermostats
and sensors from ceiling to
floor level
§ Repair rooftop unit (RTU) as
needed

4 STANDARD RETROFITS
68
Retail Buildings
Advanced Energy Retrofit Guides
Standard Retrofit Case Study:
Kohl’s – Southlake
Kohl’s Department Stores has made energy efciency a priority at its
more than 1,000 stores across the country, resulting in more than 600
ENERGY STAR-labeled locations and ENERGY STAR Partner of the
Year Awards in 2010 and 2011.
These achievements are the result of a comprehensive energy
management program that utilizes central Energy Management Systems
(EMS) to control HVAC and lighting systems, makes ongoing energy
efciency upgrades to building systems, and continuously monitors
energy performance of facilities companywide. Kohl’s retrot strategy
is to rst test an energy efciency measure at a single store. If the result
provides a savings in energy and cost that meet a desired threshold, the
company extends the retrot measure to a small group of ve to ten
stores, and potentially, rolls out to stores nationwide.
With an ENERGY STAR score of 58 out of 100 in 2008, the Kohl’s store
in Southlake, Texas provides an example of how Kohl’s took advantage
of an opportunity to improve energy efciency at one of its facilities. By
upgrading the building’s EMS, which enabled greater control of the building’s HVAC and lighting systems, and
installing variable frequency drives (VFDs) on rooftop HVAC units, the store is now using 13 percent less energy
than in 2008, boosting its ENERGY STAR score to 74.
By enacting cost-effective energy efciency measures with an ROI of more than 50 percent and a payback period
of less than two years, Kohl’s demonstrates an understanding of the strong links between energy efciency,
corporate responsibility, and cost savings. Through implementing energy efciency programs that make sense for
their business and the environment, Kohl’s estimates that the company prevented nearly $50 million in electricity
costs from 2006 to 2010.
Estimated Simple Payback Estimated ROI
<2 years 50%
Estimated Energy Use
(EUI)
Estimated % Site Savings
Before After
13%
52 Btu/sf/yr 45 Btu/sf/yr
Disclaimer: Reported energy savings results were provided by the building owner or a third party and have not been veried.
Quick Facts
Owner: Kohl’s Department Stores
Location: Southlake, TX
Gross Square Footage: 83,000
Post-retrofit EUI: 45 kBtu/sf/yr
Post-retrofit Energy Star: 73
Key Measures
§ Upgrade Energy Management
System to allow for greater
control over the lighting and
HVAC systems
§ Install VFDs on rooftop HVAC
units
§ Implement EBCx measures on
HVAC and lighting systems

4 STANDARD RETROFITS
69
Retail Buildings
Advanced Energy Retrofit Guides
4.4 Additional Resources and Guides
For additional references related to the measures discussed in Chapter 4, refer to the following.
General Guidance
u Environmental Protection Agency, “Building Upgrade Manual”, 2008: A strategic guide for planning and
implementing a protable energy saving building upgrade following a ve-stage process.
u
Rocky Mountain Institute’s Retrot Depot, www.retrotdepot.com: Online resource for case studies, advice,
and tools & resources related to retrot project implementation.
u
ASHRAE, “Energy Efciency Guide for Existing Commercial Buildings: The Business Case for Building
Owners and Managers,” 2009: Includes guidance on planning for retrots, specic methods for improving
energy performance, and making the business case for energy retrots.
u
BOMA, “BEEP
®
(BOMA Energy Efciency Program)”, 2011: A training program targeted at commercial real
estate professionals on how to increase and maintain energy performance of commercial facilities.
Technical Guidance
u ASHRAE, “ Advanced Energy Design Guide for Small Retail Buildings,” 2008: Includes general and detailed
technical information on approaches for improving energy performance in small retail buildings. Available for
free download online; www.ashrae.org.
u
ASHRAE, “Energy Efciency Guide for Existing Commercial Buildings: Technical Implementation Guide,”
2011: Provides technical implementation considerations for common retrot measures, including many of the
measures discussed in this guide.
u
Doty, “Energy Management Handbook,” 2009: Provides detailed coverage of effective energy management
strategies. Available for purchase online.
u
Wulnghoff, “Energy Efciency Manual,” 1999: A primary reference, how-to guide, and sourcebook for
energy efciency upgrades in all building types.
u
ASHRAE, “Standard 189.1,” 2009: Provides minimum requirements for the siting, design, construction, and
plan for operation of high-performance green buildings. Available for purchase online.
u
Lawrence Berkeley National Lab (LBNL), “Tips for daylighting with windows,” 1997: Includes guidelines on
cost-effective approaches to exterior zone lighting design. Available for free download online; www.lbl.gov.
u
New Buildings Institute (NBI), “Advanced Lighting Guidelines,” 2010: Provides practical design information
on lighting technologies for high-performance buildings. Available for purchase online; www.algonline.org.

5 DEEP RETROFITS
71
Retail Buildings
Advanced Energy Retrofit Guides
5
Deep Retrofits
A deep retrot project provides an opportunity for a building owner
to reduce energy consumption signicantly beyond the savings from
O&M and standard retrot measures. While deep retrots can reduce
a building’s energy use by over 50%, they require a larger upfront
investment and may have longer payback periods than O&M or standard
retrot measures.
Deep retrot projects combine many O&M and standard retrot measures in an integrated whole-building design
approach (see Section 2.5 “Planning for Energy Performance Improvements”). The integrated design process
enables a deep retrot project to achieve more than a simple sum of the O&M and standard retrot parts. These
projects affect multiple building systems and assemblies (e.g., envelope, lighting, and HVAC), and the retrot of
each system and assembly must be designed in close consideration of the other retrots. Section 5.1 describes the
planning and design of deep retrot projects.
Next, Section 5.2 presents the deep retrot measure recommended packages. The ener
gy savings and nancial
performance of the packages are analyzed for a representative retail building in ve primary climate regions
in the U.S. The deep retrot measure packages provide a hypothetical example of a project where a bundle of
retrot and O&M measures will result in energy savings of 45% or more. The individual retrot and O&M
measures are listed previously, in Chapters 3 and 4, and described in detail in the Appendix. This section focuses
on estimating the energy savings and nancial benets of the deep retrot packages. The analysis accounts for
the interactive effects between building systems and measures to provide as accurate as possible estimates of
expected results.
Section 5.3 offers additional considerations when embarking on a deep retrot process. Because all buildings are
unique and have particular needs and opportunities for energy upgrades, building owners are encouraged to think
about how these additional factors will inuence their projects.
This chapter concludes with several case studies that highlight the results of deep retrot projects in actual
buildings, and provide insight into the process that the building owners went through to complete their projects.
5.1 Planning & Design of Deep Retrofits
The upfront cost of a deep retrot may be difcult to justify on the basis of energy and maintenance cost savings
alone. However, the business case is much easier to make when planned upgrades and the avoided costs of
equipment and assembly replacements are taken into account. Many building upgrades must occur throughout
the life of a building, and these planned capital improvements represent opportunities to perform a cost-effective
deep retrot. Table 5.1 lists some key opportunities to complete a cost-effective deep retrot and their alignment
with events in a building’s lifecycle.
A highly collaborative and iterative
design process for eciency that
often yields much larger resource
savings than standard design
practice. These larger savings
are achieved by considering the
performance of entire systems
and interactions between systems
to capture multiple benefits from
single expenditures.
Integrated Design

5 DEEP RETROFITS
72
Retail Buildings
Advanced Energy Retrofit Guides
Table 5.1 Opportunities in a Building’s Life to Perform a Deep Retrofit
Building Event Opportunity
Roof, window or siding
replacement
Planned roof, window and siding replacements provide opportunities
for significant improvements in daylighting and eciency at small
incremental cost. These improvements in turn allow for reduced
artificial lighting, and a smaller, more ecient HVAC system.
End (or near end) of
life major equipment
replacement
Major equipment replacements provide an opportunity to also
address the envelope and other building systems. After reducing
thermal and electrical loads, the marginal cost of replacing the major
equipment with smaller equipment, or no equipment at all, can be
negative, as seen in the Empire State Building Case Study, below.
Upgrades to meet code Life safety upgrades may require substantial disruption and cost,
enough that the incremental investment and eort to radically
improve the building eciency becomes not only feasible but also
profitable.
New owner or refinancing New ownership or refinancing can include building upgrades
as part of the transaction. This may oer a lower interest rate
than is normally available for upgrades which improves the cost-
eectiveness of a deep retrofit.
Major occupancy change A major occupancy change presents a prime opportunity for a deep
retrofit, for two reasons. First, a deep retrofit can generate layouts
that improve energy and space eciency, while creating more
leasable space by downsizing mechanical equipment. Second, owners
may be able to leverage tenant investment in the fit-out.
Building greening An owner or tenant-driven to achieve green building or energy
certification may require significant work on the building and its
systems, which may then make a deep retrofit economical.
Large utility incentives Many utilities will subsidize the cost for a deep retrofit. In some
regions, the incentives might be large enough to make the deep
retrofit economical.
Fixing an “energy hog” Upon examination, some buildings are found to have such high
energy costs that deep retrofits have good economics without
leveraging any other building event.
Portfolio planning The cost eectiveness of a deep retrofit may be improved when many
similar measures are implemented across a portfolio of buildings.
This is particularly true when buildings in the portfolio share similar
characteristics, allowing both the design and construction teams to
achieve some eciencies of scale.
When building owners are aware of the opportunities presented in Table 5.1, they can engage the integrated
design process and make a planned component replacement grow into a deep retrot. In some cases, the
opportunity is obvious. For example, if the roof must be replaced, insulation can be added to the new roof. But
other opportunities are less straightforward. For instance, if a building’s roof needs replacement in ve years but
the HVAC rooftop units are slated for replacement now, it probably makes most economic sense to move that
roof replacement up, and add insulation to reduce the heating load and the size and cost of the HVAC units. This
latter example highlights how a basic understanding of the deep retrot process can help building owners reap
greater rewards from their investments.

5 DEEP RETROFITS
73
Retail Buildings
Advanced Energy Retrofit Guides
Deep Retrofit Design Overview
Investing in greater efciency and load reduction can actually eliminate signicant costs through downsizing,
or even eliminating, HVAC systems. This is a key feature of deep retrots, but it cannot be achieved without
thoughtful, integrated design. The following, step-by-step approach for designing a deep retrot project will lead
to maximum benets:
1. Dene the needs and services required by the store staff, customers and even the merchandise. Start from the
desired outcomes. This means identifying a purpose, such as cooling, instead of going directly to a solution,
such as DX cooling rooftop units.
2. Understand the existing building structure and systems. What needs are not being met? Why not?
3. Understand the scope and costs of planned or needed renovations. What systems or components require
replacement or renovation for non-energy reasons? What costs and interruptions to service or occupancy do
those renovations entail?
4. Reduce loads. Select measures to reduce loads:
• First, through passive means (such as increased insulation)
• Then, by specifying the most efcient non-HVAC equipment and xtures
5. Select appropriate and efcient HVAC systems. After reducing loads as much as possible, consider what
HVAC system types and sizes are most appropriate to handle the reduced loads.
6. Find synergies between systems and measures. Seek synergies across disciplines and nd opportunities to
recover and reuse waste streams. This exercise will often identify multiple benets that arise from a single
expenditure.
7. Optimize controls. After the most appropriate and efcient technologies have been selected, the focus should
shift to optimizing the control strategies.
8. Realize the intended design. Conduct initial and ongoing commissioning to ensure continued realization of the
intended design and its benets.
This step-by-step approach shows the critical elements of a deep retrot design process. The following sections
describe deep retrot approaches and considerations for individual building systems.
Lighting
A deep retrot project often presents opportunities to reduce lighting energy use and improve occupant visual
comfort beyond the standard retrot’s lamp replacements, delamping, and occupancy sensors. Lighting upgrades
in a deep retrot can leverage concurrent renovations of the building envelope and redesign of interior layouts
to lead to better use of natural daylighting. A comprehensive lighting retrot can result in a dramatically more
appealing space, an improved visual environment that meets the needs of occupants, signicant energy savings,
and the benets of controlling solar heat gain and reducing cooling loads.
When it comes to visual comfort, more light does not necessarily equate to better vision. Providing a comfortable
visual environment is about tuning that environment to specic tasks at hand. The Illuminating Engineering
Society’s Lighting Handbook provides detailed lighting guidelines to address different visual tasks in typical
space types (DiLaura, 2011). Assessing the baseline situation is a good way to understand what opportunities

5 DEEP RETROFITS
74
Retail Buildings
Advanced Energy Retrofit Guides
may be present. Measurement of lighting levels and conducting store staff interviews regarding glare and other
possible lighting issues are both useful for assessing lighting needs and determining when and why those needs
are not being met.
After describing lighting needs, a deep retrot typically looks at daylight as the preferred resource for meeting
those needs. Retrot projects inherit the pros and cons of existing building orientation, massing, and window
count and placement. Daylighting design must consider the geometric proportions of existing spaces in relation
to existing windows and skylights. Then, strategies can be developed to improve daylight penetration and
distribution throughout regularly occupied areas.
Interior spaces can be shaped and congured to help redirect light, optimize light distribution and illuminance
levels, and reduce glare. When changes to windows and exterior shading are possible, relatively inexpensive
interior improvements such as light-colored interior surfaces can help make the most of concurrent envelope
investments. Even exclusive of window improvements, changes to interior reconguration and design can
make a big difference in perceived light quality. The Illuminating Engineering Society’s “Lighting Handbook”
(DiLaura, et al. 2011) and “Architectural Lighting” (Egan and Olgyay, 2002) provide detailed practical guidance
on daylight design.
Once daylighting has been used to maximum effect, efcient electric lighting can be introduced to meet the
remaining needs. Selecting the right xture for each specic lighting need will help reduce the required lighting
power. This means selecting xtures to meet ambient lighting needs separately from specialized accent and task
lighting needs. Once xtures are selected, they can then be equipped with high efciency lamps and ballasts
and tied to occupancy sensors, where appropriate, to complete the lighting upgrade. Fixtures that are part of a
daylighting control strategy should include dimmable ballasts, for maximum system performance and energy
efciency.
Plug and Process Loads
Plug and process loads are typically subject to occupant behavior. There are numerous low- and no-cost solutions
for reducing plug loads, as well as solutions that require signicant capital expenditures. One low cost option is
to educate staff about the importance of turning equipment off when it is not in use. Software solutions are also
available that will shut down monitors and computers when they are not in use. Hardware options, which may be
part of a deep retrot, include replacing or decommissioning existing plug load equipment, and adding controls
that automatically turn off or turn down equipment when it is not being used.
Surprisingly, most equipment, even small items like cell phone chargers, still use energy when it is plugged in
but not serving a useful purpose. Such items can be wired into an energy management system that turns them of
f
when they are not in use. Each of these individual loads may be small, but like other plug loads, the sum total of
all the individual loads can be quite large, particularly when interaction with the HVAC system is included in the
analysis. Thus, these loads merit consideration as part of a deep retrot.
Building Envelope
The building envelope serves as a rst line of defense against the elements and as a blanket of comfort for those
inside, with windows and doors as a link between indoor and outdoor environments. Standard energy retrots
rarely touch the envelope, but a deep retrot project should always address the envelope. A
deep retrot project
is an ideal time to address many façade and roof issues and correct original construction defects. Such upgrades
will often allow aging mechanical equipment to be replaced with downsized equipment, producing signicant
cost savings relative to a same size replacement. Envelope technology and products have evolved signicantly
since the 1990s, so any building constructed before that period is a likely candidate for an envelope upgrade.

5 DEEP RETROFITS
75
Retail Buildings
Advanced Energy Retrofit Guides
Building envelope retrots should address inltration rst and then thermal performance of the envelope
materials. Doors and windows are particularly vulnerable to inltration, as they include multiple joints between
different materials, may feature tolerances to allow movement, and must be lightweight enough for human
control. Routine maintenance usually aims to protect against water inltration, but ignores air inltration. Over
time, air inltration can grow, and the resulting need to condition greater volumes of outside air equates to excess
energy consumption. Excessive air inltration may also result from construction defects present from day one,
meaning even relatively new buildings may benet from envelope improvements. Infrared thermal images will
point to areas where air or water is clearly passing through the walls unintentionally. Most often, these are at
joints between walls and roof / oor, where materials change such as at the connection of glass to frame, and at
penetrations such as vents.
Though inltration is addressed rst, radiation is perhaps the most obvious source of heat gain in commercial
buildings. There are two approaches to mitigating radiative effects—modifying the building shading and
adjusting the reectivity of building materials. Building shading changes the amount of radiation that reaches
the building’s surface. Exterior nish colors and selective surfaces can cause building surfaces to absorb heat
(good for cold climates) or reect heat (good for hot climates), depending on the color and reectivity. In many
buildings, solar radiation offers a benet for daylighting, but introduces a penalty of heat gain through windows.
Spectrally selective window lms can address this dichotomy by rejecting a high percentage of heat while
admitting visible light.
In addition to inltration and radiation, the deep retrot design process should consider the desirability and
feasibility of adding thermal insulation. Adding insulation to an existing building envelope can be an expensive
proposition. In mild climates and where the existing insulation complies with a building energy code, adding
insulation may not be cost-effective. In any location, a careful analysis that includes building energy simulations
will help to assess the potential benet of insulation measures. It’s typically most ef
fective to install insulation on
the outside of the assembly, to create a layer of continuous insulation that spans the enclosure.
In some buildings, thermal bridging may be more important to address than insulation. Thermal bridging occurs
where materials that are good conductors (e.g., the metal and aluminum in door and window frames) allow heat
to ow relatively unimpeded between outdoor and indoor environments. Such bridges can be corrected by adding
a thermal break, though this often entails replacing entire door or window assemblies.
As with all deep retrot projects, an integrated design process is critical. Inltration, radiation and insulation
should be evaluated jointly and in light of the other building system upgrades. Envelope retrots will often prove
capable of delivering multiple benets from single expenditures. However, the rst step in addressing envelope
condition in a deep retrot project should always be investigation. Where are the weak points in the system? Is
there signicant room for improvement? Are envelope conditions affecting more than just energy consumption?
This investigation may include interviews with store staff and customer surveys, or the use of infrared thermal
imaging and building energy simulation.
HVAC
HVAC system performance impacts the health, comfort, and productivity of store staff and customers, as well
as on the overall energy use of the facility. Though all systems are important in the integrated design process,
HVAC systems depend upon and unite the other building systems. Its ultimate performance will, to a great
extent, dene the success of the integrated design process.

5 DEEP RETROFITS
76
Retail Buildings
Advanced Energy Retrofit Guides
Define Needs
HVAC systems provide for occupants’ thermal comfort by controlling the temperature and humidity of the
room air. One way to improve HVAC system energy performance is to recognize that there are a range of
acceptable temperature and humidity conditions. This recognition leads to one of the most cost-effective way to
reduce energy for HVAC systems, which is to expand the system’s allowable ranges for indoor temperature and
humidity. This range is often referred to as the “deadband,” the range of temperatures during which no heating
or cooling takes place at the zone (e.g., between 70°F and 75°F). Just a couple of degrees of adjustment can have
a signicant impact on the performance and energy usage of the system. An appropriate comfort range can be
determined using industry guidelines, provided by ASHRAE Standard 55 (ASHRAE 2004), in combination with
a study of building occupancy and use.
Another important service provided by the HVAC system is ventilation. Building occupants require outside air
to remain healthy and productive. However, conditioning that outside air is one of the most energy intensive
jobs that an HVAC system performs. So, an important measure for reducing HVAC system energy usage is
minimizing the amount of outside air that needs to be conditioned. This can be done without compromising
occupant health or product by accurately determining the required exhaust and ventilation based on the building’s
actual use and occupancy. The default occupancy values that are often used in place of careful analysis are very
conservative. Adjusting ventilation based on actual occupancy values can sometimes reduce the amount of
outside air by over 30%, saving energy and also reducing the size of the system required.
Design Strategies
A deep retrot design process will evaluate heating and cooling system options only after the load reduction
measures. It’s important to reduce heating and cooling loads rst since these have a direct impact on the HVAC
system energy usage. Also, reduced loads may change the appropriateness of various system type and sizing
options. When choosing a system type, it is important to consider whether the extent of the renovation will allow
for replacing the existing HVAC system with a wholly different system type. If so, then the local climate and the
building’s ventilation needs will feature prominently in an analysis to determine the most efcient system type.
In a major renovation, there is sometimes an opportunity to make improvements in the layout of the existing
air and water distribution systems. This translates into very signicant fan and pump energy savings. Low-
energy use ductwork and piping design involves short, direct, and low pressure drop runs. Reducing the number
of ttings also reduces turbulence. The efcient duct and piping layouts, together with the previous work to
minimized building loads, will yield opportunities for downsizing mechanical equipment. The smaller
, accurately
sized equipment will have a lower purchase price, lower utility costs, better dehumidication performance, and
deliver greater comfort for occupants.
Once the systems type has been chosen and sized, equipment with high peak and part load efciencies can
be selected to complete the efcient HVAC design. Variable ow air and water distribution systems, and
high efciency fans, motors, and pumps are all preferred components in an energy efcient design. Part load
performance is just as important as the rated efciency, so consideration of performance curves is important
when choosing equipment.
After the HVAC system is installed, optimizing HVAC controls is a cost effective energy saving strategy and is a
key component to any comprehensive retrot.

5 DEEP RETROFITS
77
Retail Buildings
Advanced Energy Retrofit Guides
Design Team Organization
The integrated design of lighting, plug and process loads, envelop and HVAC systems calls for a design team
with special capabilities. Chief among these capabilities is that of open communication among team members.
To foster open communication, integrated design teams are organized differently than traditional design teams.
See Figures 5.1 and 5.2 for a comparison of the typical parties involved and structure of relationships between
traditional and integrated project design processes.
Figure 5.1. Traditional Project Design Team
Reprinted from
Advanced Energy Design Guide for Small to Medium Oce Buildings
.
©
2011, ASHRAE

5 DEEP RETROFITS
78
Retail Buildings
Advanced Energy Retrofit Guides
Figure 5.2. Integrated Project Design Team
Reprinted from
Advanced Energy Design Guide for Small to Medium Oce Buildings
.
©
2011, ASHRAE
The discussion of deep retrot design that is provided in this section is intended only as an introduction. It
provides the foundation needed by building owners to decide when to pursue a deep retrot. Once that decision is
made, an owner will need to engage a skilled, integrated design team, like that represented in Figure 5.2, to carry
the project forward.

5 DEEP RETROFITS
79
Retail Buildings
Advanced Energy Retrofit Guides
5.2 Deep Retrofit Recommended Packages
At-A-Glance Results
Table 5.2. Deep Retrofit Recommended Packages - Results of Common Metrics
Site Energy Use
Intensity (EUI)
Savings
(kBtu/sf/yr)
Site EUI Reduction
Annual Energy Cost
per Square Foot
Baseline
Post-
Deep
Retrofit
Post-
EBCx
Post-
Standard
Retrofit
Post-
Deep
Retrofit
Reduction
beyond
EBCx
Reduction
beyond
standard
retrofit
Baseline
Post-
Deep
Retrofit
Reduction
from
Baseline
Hot &
Humid
107 44 13% 32% 59% 45% 27% $2.75 $1.20 $1.55
Hot & Dry
103 47 15% 33% 54% 39% 21% $2.71 $1.34 $1.37
Marine
90 38 14% 36% 58% 44% 22% $2.30 $1.01 $1.29
Cold
100 43 15% 36% 57% 42% 21% $2.83 $1.23 $1.60
Very Cold
102 46 16% 38% 55% 39% 17% $2.49 $1.08 $1.41
Average
100 44 15% 35% 56% 42% 22% $2.62 $1.17 $1.45
The retrot measures included in the deep retrot recommended packages are shown in Table 5.3.
Table 5.3. Deep Retrofit Recommended Packages Measures
System Measure Description Climate Zone
Appendix
Page # Ref.
Lighting L3. Add daylight harvesting All 134
Lighting L4. Re circuit and schedule lighting system by end
use
All 135
Lighting L7. Retrofit interior fixtures to reduce lighting
power density by 58%
All 136
Lighting L8. Install skylights and daylight harvesting All 139
Lighting L9. Retrofit exterior fixtures to reduce lighting
power density, and add exterior lighting control
All 141
Envelope E6. Add roof insulation Hot & Humid 147
HVAC H12. Replace RTUs with higher eciency units All 152
HVAC H15. Replace HVAC system with a dedicated
outdoor air system
Marine, Cold, Very cold 156
HVAC H18. Remove heat from front entry All 159
The measure “Remove heat from front entry” is included in the Cold, Very Cold and Marine deep retrot
packages only. The Hot-Humid and Hot-Dry deep retrot packages do not include this measure.

5 DEEP RETROFITS
80
Retail Buildings
Advanced Energy Retrofit Guides
Rationale for Recommended Measures
The measures included in the deep retrot packages go beyond the standard retrot package measures –
more system types are affected (lighting, HVAC and envelope), and the level of retrot is deeper. These are
representative of measures that an owner might implement for reasons not limited to energy savings. Such
reasons may include:
u
Equipment or assemblies are at the end of their useful life, and are in need of replacement
u
The usage of the building has changed, and the systems and assemblies need to be updated to follow suit
u
New building codes necessitate upgrades
u
Market repositioning effort (e.g., upgrading space from Class B to Class A)
The measures included in the deep retrot packages above range from the addition of simple controls
functionality (re-circuit and schedule lighting system), to signicant changes to the building’s systems (replace
HVAC system). The measures were chosen in consideration of their energy savings and cost-effectiveness. Some
of the measures are also included in the standard retrot recommended packages, as they are cost-effective
measures with signicant energy savings potential.
There are a number of retrot measures that could be included as part of a deep retrot package, depending on
the goals of the project and the outcomes of the integrated design process. The measures included in the Table 5.3
above should be considered representative examples. They may not be applicable to some retail buildings, and
there may be other measures that are applicable but aren’t included in the list. The measures listed above are
applicable to a reference building that has characteristics similar to most standalone retail buildings in the U.S.
Two of the measures listed in Table 5.3 apply to a specic type of HVAC system commonly found in standalone
retail buildings: single-zone packaged rooftop units with electric direct expansion (DX) cooling and gas heating.
While this is probably the most common type of HVAC system found in existing standalone retail buildings,
these two HVAC measures may not apply to other HVAC system types. However, the concepts can be applied
to other HVAC system types: increase the efciency of the existing system’s cooling and heating sections, and
utilize energy recovery.
For more detailed information about the measures included in the standard retrot packages, see Appendix 10.6.
Energy Savings
The analysis of the deep retrot packages assumes that O&M measures are implemented rst, as part of an EBCx
process, followed by the deep retrot measures included in the recommended package. This is estimated to result
in savings of over 50% of site energy usage in the reference retail building based on an analysis of the measures
included in the packages using EnergyPlus. Each climate zone shows signicant energy savings, with slight
variations between the climate zones. See Table 5.4.

5 DEEP RETROFITS
81
Retail Buildings
Advanced Energy Retrofit Guides
Table 5.4. Deep Retrofit Recommended Package Energy Savings Results
Electricity
Savings
(annual kWh)
Electric
Demand
Savings
(peak kW)
Gas
Savings
(annual
therms)
Site EUI
Savings
(kBtu/sf/
yr)
Savings as
% of Total
Site Usage
Source EUI
Savings
(kBtu/sf/yr)
Savings
as % of
Total
Source
Usage
Hot & Humid
449,000 80 150 63 59% 176 59%
Hot & Dry
380,000 68 700 55 54% 150 54%
Marine
330,000 62 1,500 52 58% 106 58%
Cold
344,000 64 2,200 57 57% 152 57%
Very Cold
323,000 63 2,900 56 55% 137 57%
Financial Analysis
The nancial metrics associated with the deep retrot packages in each climate zone are shown in Table 5.5.
These metrics include the O&M measures implemented as part of an EBCx process, and implementation of
the retrot measures shown in Table 5.3. The costs and savings shown in this table are incremental costs and
savings, since it is assumed that the equipment is at the end of its useful life and is in need of replacement. The
incremental cost of the deep retrot package is based on the difference between similar standard efciency
equipment and an energy efcient option. Full costs were assumed for measures that added functionality to
the original system. The estimated savings for the deep retrot package were reduced by 50% to adjust for the
incremental savings realized due to energy code-mandated increases in energy efciency. The actual realized
costs and savings will be greater.
As shown in Table 5.5, when combined with the savings from the EBCx process, the deep retrot packages have
a ve-to-six year payback and positive net present value, making them a cost-effective method of achieving
signicant energy savings.
Table 5.5. Deep Retrofit Recommended Package Financial Analysis Results
Total Measure
Costs
Total Annual
Energy Cost
Savings
Annual O&M
Cost Savings
Total Annual $
Savings
Simple
Payback
(Years)
Net Present
Value
Hot & Humid
$161,000 $28,000 ($220) $27,800 5.8 $4,860
Hot & Dry $129,000 $26,000 ($260) $25,300 5.1 $37,800
Marine
$124,000 $22,000 ($250) $22,600 5.5 $19,900
Cold
$139,000 $30,000 ($280) $29,600 4.7 $61,300
Very Cold
$130,000 $25,000 ($250) $24,400 5.3 $30,400
The useful life of the deep retrot package is assumed to be 20 years due to the periodic recommissioning efforts
that are implemented during this timeframe. Other costs required to maintain individual measures in the package
with less than a 20 year life, such as the photocells, are reected as increased O&M costs.

5 DEEP RETROFITS
82
Retail Buildings
Advanced Energy Retrofit Guides
5.3 Additional Considerations
The deep retrot measures proposed in the recommended packages above provide an overview of the types
of measures that could be implemented as part of a deep retrot project. However, not all measures will be
applicable to all buildings, and there may be some other measures that are applicable to a specic building
yet aren’t included in the measure list. See Appendix 10.1 for a detailed discussion of the reference building’s
characteristics and considerations for how the energy savings results may be impacted by variations in building
characteristics.
A deep retrot project is more than just a collection of individual retrots. It should include an integrated design
process where multiple retrot package options are developed and evaluated. The package of implemented
measures that result from the design process can vary substantially from building to building. Since each building
is unique, there’s no “off the shelf” deep retrot package. The various members of the design and operations
team should work together to design each system and assembly in consideration of its impact on the building as a
whole. Deep retrot projects usually involves whole building energy simulation, to help determine which options
will result in lowest energy usage while still meeting other project goals.
When evaluating whether to embark on a deep retrot project, the following aspects could be considered:
u
Are the equipment or assemblies in the building nearing the end of their useful lives?
Deep retrot projects are especially suited for buildings that have a signicant number of systems and
assemblies near the end of their useful lives. Rather than just replacing these systems and assemblies with
similar items, deep retrot projects are a great opportunity to re-evaluate the types of systems and assemblies
in the building, considering the current needs of the building and new technologies that have become available
over the years.
u
Has the usage of the building changed since the building was originally constructed?
If a building’s usage has changed signicantly since it was originally constructed, the systems and assemblies
in the building are likely not optimized to suit the current needs of the building. A deep retrot project
presents a perfect opportunity to evaluate the current systems and assembly types in a building, and present
options for alternate systems and assemblies that may be more suited to the building’s needs.
u
Do retail operations need to continue during the remodel period?
Deep retrots typically include major renovations to building systems and assemblies. Impact on the retail
operations must be considered, and this aspect can be a limiting factor in the depth that a deep retrot can go.
If the retail store can be closed for the deep retrot construction period, the level of retrot can be deeper than
if the store must remain open during the deep retrot construction period.
u
Will the project be commissioned
Commissioning is highly recommended for deep retrots. It provides assurance to building owners that the
project was designed and constructed to meet the owner’s requirements. Commissioning can start during a deep
retrot’s pre-design phase and proceed through construction, to help the project team match the design with the
needs of the building, and to help ensure the long term maintainability of the facility. Commissioning is often
most useful at the start of a project, when it can have the biggest impact.

5 DEEP RETROFITS
83
Retail Buildings
Advanced Energy Retrofit Guides
Quick Facts
Owner: jcpenney
Location: Colonial Heights, VA
Gross Square Footage: 107,216
Post-retrofit EUI: 35 kBtu/sf/yr
Key Measures
§ Install LED lights replacing
incandescent lights
§ Install LED signs replacing
neon signage lighting
§ Install 320W metal halide
lamps in parking lot replacing
1,000W metal halide lamps
§ Install lighting controls
including occupancy sensors
§ Install high eciency chillers
downsized to meet reduced
building loads
§ Install high eciency rooftop
units (RTUs)
§ Install high eciency HVAC
supply fan motors
§ Install HVAC controls
§ Complete EBCx measures
including optimizing
equipment runtime and
reduced heating setpoints in
vestibules
§ Add roof insulation
§ Install an Energy Recovery
Ventilator (ERV) and
implemented demand control
ventilation
Deep Retrofit Case Study:
jcpenney
jcpenney teamed with the Department of Energy’s Pacic Northwest
National Laboratory (PNNL) to nd ways to save energy at its
store in Colonial Heights, Virginia. As a participant in the DOE’s
Commercial Building Partnerships (CBP) program, jcpenney worked
with PNNL to explore energy efciency measures that may be
applied at over 1,100 jcpenney stores across the nation.
The Colonial Heights store was selected as a testing ground for
energy upgrades because it was already scheduled to undergo a
renovation. Completing energy upgrades during a general renovation
allowed for an integrated project design process, and made many
energy upgrades cost-effective which otherwise may not have been.
PNNL researchers worked with jcpenney engineers to design a
project that reduces energy consumption of all major building
systems, which ultimately reduced total building energy use by an
estimated 45%. Each measure was reviewed for cost-effectiveness by
calculating its simple payback and net present value (NPV). These
approaches to analyzing a project’s cost-effectiveness, combined
with project timing that allows for an integrated project design
process, demonstrate best practices for energy efciency upgrades.
Estimated
Annual
Electric
Savings
Estimated
Annual
Gas
Savings
Estimated
Annual
O&M $
Savings
Estimated
Annual
Energy $
Savings
Estimated
Total
Annual $
Savings
Net Cost
to Owner
831,000 kWh
2,700
therms
$22,800 $63,900 $86,700 $647,000
Internal Rate
of Return
(IRR)*
NPV*
Simple
Payback
ROI
15.6% $66,100 7.5 years 13%
Estimated Energy Use
Estimated Energy Use
Intensity (EUI)
Estimated
% Site
Savings
Before After Before After
45%
6,860 MBtu/yr 3,750 MBtu/yr 64 kBtu/ft
2
/yr 35 kBtu/ft
2
/yr
*IRR and NPV are based on jcpenney’s internal calculations.
Disclaimer: Reported energy savings results were provided by the building owner or
a third party and have not been veried.

5 DEEP RETROFITS
84
Retail Buildings
Advanced Energy Retrofit Guides
Quick Facts
Owner: Planet Subaru
Location: Hanover, MA
Gross Square Footage: 22,500
Post-retrofit EUI: 58 kBtu/sf/yr
Key Measures
§ Upgrade interior lighting
§ Install EMS system controls
lighting schedule, including
timeclock and photocell
§ Install operable windows to
take advantage of ambient air
cooling
§ Retrofit HVAC system with
high-eciency rooftop units
(RTUs)
§ Install programmable
thermostats
§ Install clerestory to increase
daylighting
§ Purchase ENERGY STAR oce
equipment
§ Lower showroom ceiling
to reduce space requiring
heating and cooling
§ Paint shop walls and floor
white to reduce lighting
requirements
§ Implemented employee
training to encourage energy
conservation
Deep Retrofit Case Study:
Planet Subaru
When Planet Subaru took over a former tire and auto parts store in
2002 as its new home, owner Jeff Morrill committed to renovating
the building to become more energy efcient. Morrill wanted to use
the building as a symbol of the dealership’s values of environmental
sustainability and resource conservation.
Beginning in 2002, the Planet Subaru building has incrementally
made energy efciency improvements to the HVAC, lighting,
and building envelope through a series of project phases. The
sequence of energy efciency measure implementation has been
dependent on specic needs of the building at each project phase
and available funding. The initial renovation in 2002 provided the
opportunity to replace the windows, install a clerestory, and upgrade
to programmable thermostats. In 2005, when more funds were
available, the lighting was replaced; and in 2010, the HVAC system
was retrotted with more efcient rooftop units.
Nine years after the initial renovation, the efciency improvements
have resulted in an estimated $22,000 annual savings in energy costs,
and a building that has received extensive media coverage as a top
energy performer in the industry. The dealership won the 2007 EPA
ENERGY STAR Small Business Award and was a nalist for the
USA Today/National Auto Dealers Innovation Award.
Estimated Annual
Electric Savings
Estimated Annual Gas
Savings
Estimated Annual
Energy $ Savings
125,000 kWh 1,300 therms $22,000
Estimated Annual Electric
Savings
Estimated Energy Use
Intensity (EUI)
Estimated %
Site Savings
Before After Before After
30%
1,860 MBtu/yr 1,300 MBtu/yr 83 kBtu/ft
2
/yr 58 kBtu/ft
2
/yr
Disclaimer: Reported energy savings results were provided by the building owner or
a third party and have not been veried.

5 DEEP RETROFITS
85
Retail Buildings
Advanced Energy Retrofit Guides
5.4 Additional Resources and Guides
For additional references related to the measures discussed in Chapter 5, refer to the following.
General Guidance
u Rocky Mountain Institute, Retrot Depot: Online resource for case studies, advice, and tools & resources
related to deep retrot project implementation; www.retrotdepot.org.
u
Environmental Protection Agency, “Building Upgrade Manual,” 2008: A strategic guide for planning and
implementing a protable energy saving building upgrade following a ve-stage process. Available for free
download online; www.energystar.gov.
u
ASHRAE, “Energy Efciency Guide for Existing Commercial Buildings: The Business Case for Building
Owners and Managers,” 2009: Includes guidance on planning for retrots, specic methods for improving
energy performance, and making the business case for energy retrots. Available for purchase online;
www.techstreet.com.
u
BOMA, BEEP
®
(BOMA Energy Efciency Program): A training program targeted at commercial real estate
professionals on how to increase and maintain energy performance of commercial facilities. More information
available at www.boma.org/beep.
u
American Institute of Architects (AIA), “Integrated Project Delivery: A Guide,” 2007: A tool to assist owners,
designers and builders to move toward integrated models and improved design, construction and operations
processes. Available for free download online; www.aia.org.
u
Energy Design Resources, “Integrated Building Design,” 2002: Presents a six-step integrated design process
for achieving maximum energy performance. Energy Design Resources provides other useful publications
on integrated design and energy performance. Available for free download online;
www.energydesignresources.org.
Technical Guidance
u ASHRAE, “Advanced Energy Design Guide for Small Retail Buildings,” 2008: Includes general and detailed
technical information on approaches for improving energy performance in small retail buildings. Available for
free download online; www.ashrae.org.
u
Doty, “Energy Management Handbook,” 2009: Provides detailed coverage of effective energy management
strategies. Available for purchase online.
u
Wulnghoff, “Energy Efciency Manual,” 1999: A primary reference, how-to guide, and sourcebook for
energy efciency upgrades in all building types. Available for purchase online.
u
ASHRAE, “Standard 189.1,” 2009: Provides minimum requirements for the siting, design, construction, and
plan for operation of high-performance green buildings. More information available at www.ashrae.org.
u
Lawrence Berkeley National Lab (LBNL), “Tips for daylighting with windows,” 1997: Includes guidelines on
cost-effective approaches to exterior zone lighting design. Available for free download online; www.lbl.gov.
u
New Buildings Institute (NBI), “Advanced Lighting Guidelines,” 2010: Provides practical design information
on lighting technologies for high-performance buildings. Available for purchase online; www.algonline.org.

6 MEASUREMENT & VERIFICATION (M&V)
87
Retail Buildings
Advanced Energy Retrofit Guides
6
Measurement &
Verification (M&V)
Determining the actual savings from an energy-efciency retrot project can help prove the effectiveness of a
project. Since savings represent the absence of energy use, they cannot be directly measured. Although pre- and
post- retrot measurements are often used to determine project performance, simple comparisons of energy use
before and after a retrot are typically insufcient to accurately estimate energy savings because they do not
account for uctuations in weather and building occupancy. Measurement and verication (M&V) is the practice
of measuring, computing and reporting the results of energy saving projects. Proven M&V strategies provide
a means to accurately estimate the energy savings by making adjustments to account for these uctuations,
allowing the comparison of baseline and post-installation energy use under the same conditions.
M&V activities include conducting site surveys, metering energy use, monitoring independent variables such as
outdoor air temperature, executing engineering calculations, and reporting. The industry guideline for conducting
these activities is the International Performance Measurement and V
erication Protocol (IPMVP). IPMVP
includes a framework for best practices in conducting M&V and outlines four general approaches or options.
Following these guidelines allows for transparent and reliable reporting of projects savings. Table 6.1 presents
key terminology used in IPMVP approaches.
Table 6.1. Key IPMVP M&V Terminology Approaches
Measurement Boundary: A hypothetical boundary drawn around
equipment and/or systems to isolate its energy mass flows relevant
for determining its energy savings.
Independent Variable: A parameter that is expected to change
regularly and have a measurable impact on the energy use of the
facility, system or piece of equipment.
Baselines Period: The period of time chosen to represent operation
of the facility or system before implementation of the energy
eciency project.
Baseline Energy: The energy use occurring during the baseline
period, and its relation to driving independent variables.
Adjustment Baseline Energy: The energy use of the baseline period,
adjusted using regression analysis or simulation modeling to a
dierent set of operating conditions, typically those of the post-
install conditions.
Savings: Typically, the adjusted baseline energy costs minus the post-
install energy costs.
§ Definition of M&V
§ Planning for M&V
§ Overview of M&V approaches
§ Developing an M&V plan
§ M&V approaches for
recommended packages
§ Measure characterization
§ Building performance tracking
TOPICS COVERED

6 MEASUREMENT & VERIFICATION (M&V)
88
Retail Buildings
Advanced Energy Retrofit Guides
The industry guidelines for M&V depict best practice, but are often not fully utilized unless savings are tied to
signicant levels of monetary compensation or other requirements, such as in a performance contract or when
pursuing LEED New Construction M&V credits. Other projects without these requirements may focus their
M&V activities on ensuring the building is performing as intended and has a high potential to achieve savings
with less emphasis placed on quantifying savings. In many instances, including utility sponsored incentive
programs, less rigorous methods are utilized to establish the level of energy saving, or to ensure savings persist
over time. Some of these methods include energy savings calculations alongside or within building performance
tracking tools, such as an advanced Energy Information System (EIS) capable of comparing pre and post-project
building energy use.
6.1 Planning for M&V
It is important for a building owner to determine early in the project planning process if M&V will be part of
the project. If savings are to be accurately measured and veried, special planning is required and may involve
metering and measurement activities prior to implementing any changes to the facility. Through metering and
utility bill analysis, the baseline energy use and costs are established. Then, baseline energy use is adjusted to
represent the costs that would have occurred under the same set of conditions that the post-retrot costs are based
upon. Savings are nally estimated as the difference between the adjusted baseline energy use and the actual
post-retrot energy use.
One of the key issues to consider is how exact the reported savings needs to be, which inuences the scope and
level of rigor of the M&V activities. Proper planning can help integrate the verication activities into the project
and potentially leverage the work of the design team and commissioning agent. A
key goal is to keep the cost of
the verication activities in line with the scope and needs of the project. See Figure 6.1.
6.2 Overview of M&V Approaches
There are two essential components of M&V for any energy-efciency-improvement project:
u
Operational verication veries that the measures are installed and operating properly. Activities include
visual inspection, data trending and/or functional testing. This should be achieved through comprehensive
commissioning of all affected systems supplemented by more data-driven activities (e.g., monitoring and
tracking). Setting clear expectations for equipment or system performance is helpful in ensuring effective
operational verication. Operational verication should be conducted even if savings verication activities
are not.
Figure 6 1. M&V Timeline
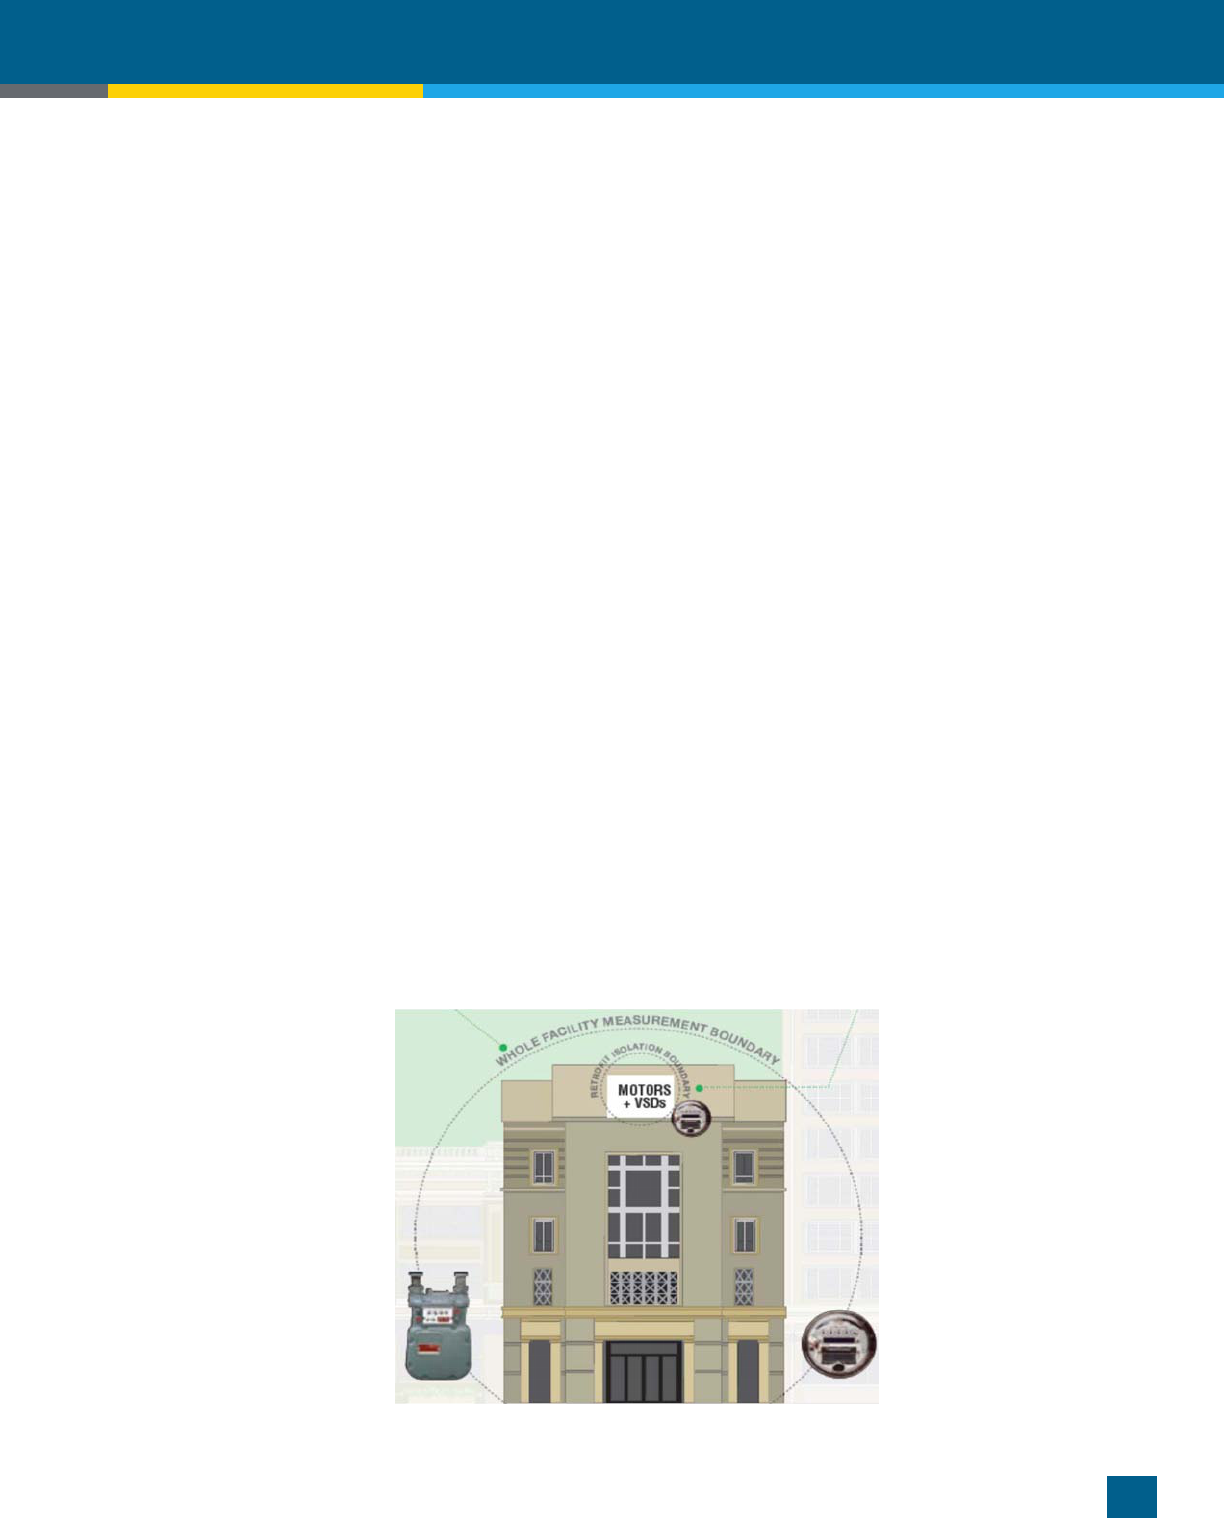
6 MEASUREMENT & VERIFICATION (M&V)
89
Retail Buildings
Advanced Energy Retrofit Guides
u Savings verication veries and calculates the savings resulting from the installed measures. These
verication procedures are covered by the IPMVP.
Operational verication and commissioning should be completed prior to implementing other post-retrot M&V
activities. This ensures the savings from measures, control and operation improvements are fully realized.
The four savings verication options dened by the IPMVP include:
u
Option A – Retrot isolation with partial measurement. Equipment is isolated and key parameters
affected, such as load or hours of operation, are spot measured before and after the retrot.
u
Option B – Retrot isolation with full measurement. Equipment is isolated and energy use is measured
across all operating conditions before and after the retrot. This strategy is preferred over Option A when
there is a high level of variability in the energy use depending on operating conditions.
u
Option C – Whole building. Utility data from the whole building is correlated with independent variables
such as outdoor air temperature, and baseline and post-retrot energy use is adjusted to the same set of
conditions and compared to determine energy savings.
u
Option D – Calibrated simulation. Typically applied as a whole building approach, energy use of the
building is modeled both before and after the retrot using specialized software and the models are
adjusted so they accurately predict building energy use. The before and after models are adjusted to the
same set of conditions and compared to determine energy savings.
These options can be put into two general categories: retrot isolation (Options A
and B) and whole building
(Options C and D). One of the fundamental differences between these approaches is where the savings boundary
is drawn, as shown in Figure 6.2. Retrot isolation strategies focus on the individual retrot, and will verify the
energy performance of a specic piece of equipment or system. Whole building methods are based on either
utility billing analysis or a calibrated whole building simulation. Whole building approaches are most appropriate
for comprehensive retrots when savings are expected to be greater than 10% of total electrical or gas usage,
and will report on the overall energy performance of the building. In addition to measurement boundary, these
methods vary in their requirement for measured data, their appropriate applications, and the level of effort and
cost to implement. An overview of the methods is provided in Table 6.2.
Figure 6.2. Measurement Boundary for M&V Options

6 MEASUREMENT & VERIFICATION (M&V)
90
Retail Buildings
Advanced Energy Retrofit Guides
The IPMVP puts forward several general requirements to ensure the adequacy of an M&V effort. These include:
u
Developing a complete M&V plan;
u
Measuring baseline energy use overall operating modes of the building or systems;
u
Adjusting energy use to the same set of conditions before calculating savings;
u
Reporting savings only for the post-installation measurement period, and not extrapolating beyond this period;
u
Establishing the acceptable savings accuracy during the M&V planning process.
Table 6.2 . Overview of IPMVP Options
Method Option A Option B Option C Option D
Boundary Retrofit Isolation Retrofit Isolation Whole Facility Whole Facility
Measured Data Key Parameters All Parameters Utility Data Utility Bills, End Use,
System, Equipment
Analysis Engineering Calculations Regression Analysis Regression Analysis Energy Simulation
Software
Applications Limited variation of some
parameters impacting measure
savings
Individual measure
assessment
Estimated savings >
10% of total use
No baseline data;
Multiple measures with
interactions
6.3 Developing an M&V Plan
Any effective M&V effort must be planned in advance, during the project planning phase. Each project must
establish its own specic M&V plan that outlines all activities that will be conducted. The M&V plan should
address the project’s unique characteristics and be crafted to balance the cost of M&V with the value it provides.
Before selecting an M&V approach, it is important to identify the goals and objectives for the M&V activities.
For example, M&V cost savings used to determine payments within Energy Saving Performance Contracts will
need to be more rigorous than an M&V effort conducted to meet LEED Certication requirements. It may be
appropriate for low-cost, no-cost measures to rely solely on operational verication methods that only conrm
their potential to save energy without attempting to quantify their actual savings.
Adherence to the IPMVP requires preparation of a project specic M&V plan that is consistent with IPMVP
terminology. It must name the IPMVP Option(s), metering, monitoring and analysis methods to be used, quality
assurance procedures to be followed, and person(s) responsible for the M&V. Key components of the M&V
plan
are outlined in Table 6.3.

6 MEASUREMENT & VERIFICATION (M&V)
91
Retail Buildings
Advanced Energy Retrofit Guides
Table 6.3. Components of an M&V Plan
Basic M&V Plan Components
Project Description
• Relevant site characteristics
• Existing and expected comfort conditions, lighting intensities, temperature
set point, etc.
• Measurement boundary and metering requirements
• Details and data of baseline conditions including equipment specications
and measured data such as energy use, loads, and hours of operation
Project Savings and Costs
• A description of the measures and performance expectations
• Estimated energy and cost savings
• All relevant utility rates
• Expected M&V cost and accuracy
Scheduling
• Schedule for obtaining baseline information
• Schedule for all post-installation M&V activities.
Reporting
• All assumptions and sources of data
• Identication of deviations from expected conditions
• Delineation of post-retrot period
• Documentation of the design intent of the measure(s)
• Calculation method to be used (all equations shown)
M&V Approach
• Selected Option(s) (A, B, C, D)
• Details on approach for baseline adjustments
• Savings calculation details
• Operational verication strategies
• Responsibilities for M&V activities and reporting
• Content and format of M&V reports
• Quality control/quality assurance procedures
• Ongoing verications procedures
6.4 M&V Approaches for Recommended
Packages
The following (Tables 6.4 through 6.7) summarize suggested approaches to M&V for the recommended measure
packages presented in this guide. As discussed earlier, M&V ensures that retrot project savings are achieved
and quantied. This section provides examples of effective M&V methods based on the measures selected for the
retrot packages. These M&V methods will depend on whether the measures are implemented in an integrated or
staged approach – the approaches are differentiated in the tables below. Included for each measure are estimated
cost savings, performance variability, operational verication activities, savings verication approach, savings
verication activities, and suggestions for ongoing performance assurance. See Tables 6.4 through 6.7 for a
discussion of the criteria presented in them.

6 MEASUREMENT & VERIFICATION (M&V)
92
Retail Buildings
Advanced Energy Retrofit Guides
Table 6.4. M&V Approaches for O&M Measures Implemented as Part of EBCx Packages – Integrated Approach*
* See Section 2.5 “Planning for Energy Performance Improvements” for details of the Integrated Approach to energy performance improvement.
Measure
Description
Total Energy
Cost Savings
Impact
Low 0-1%
Med 1-3%
High > 3%
Performance
Variability:
High, Med,
Low
Operational
Verification
Activities
Savings
Verification
Approach
Savings
Verification
activities
Ongoing
Performance
Assurance
Calibrate
exterior lighting
photocells
Low Medium Short-term
testing
None None
Short-term
testing
Reduce
envelope
leakage
Low Low Visual
inspection
Visual
inspection
Replace worn
out weather
stripping at
exterior doors
Low Low Visual
inspection
Visual
inspection
Clean cooling
and heating
coils, and comb
heat exchanger
fins
Low Medium Visual
inspection
Visual
inspection
Revise air
filtration system
Low Low Visual
inspection
Visual
inspection
Add equipment
lockouts based
on outside air
temperature
Low Medium Short-term
testing
Short-term
testing
Reprogram
HVAC
timeclocks to
minimize run
time
Low Medium Short-term
testing
Short-term
testing
Optimize
outdoor air
damper control
Low High Short-term
testing
Short-term
testing
Repair airside
economizer
Low High Short-term
testing
Short-term
testing
Increase
deadband
between
heating
and cooling
setpoints
Low Medium Visual
inspection
Short-term
testing
Replace
plumbing fixture
faucets with
low flow faucets
with sensor
control
Low Low Short-term
testing
Short-term
testing

6 MEASUREMENT & VERIFICATION (M&V)
93
Retail Buildings
Advanced Energy Retrofit Guides
Table 6.5. M&V Approaches for Retrofit Measures Implemented as Part of Standard Retrofit Packages – Integrated Approach*
* See Section 2.5 “Planning for Energy Performance Improvements” for details of the Integrated Approach to energy performance improvement.
**Whole building approaches will capture savings from all measures implemented.
Measure
Description
Total Energy
Cost Savings
Impact
Low 0-1%
Med 1-3%
High > 3%
Performance
Variability:
High, Med,
Low
Operational
Verification
Activities
Savings
Verification
Approach
Savings
Verification
activities
Ongoing
Performance
Assurance
Add daylight
harvesting
Medium High Short-term
testing
Whole
Building
Approach**
Utility data
analysis <or>
Building
simulation
Short-term
testing
Retrofit interior
fixtures to
reduce lighting
power density
by 13%
High Low Sample spot
measurement
Visual
inspection
Recircuit and
schedule
lighting system
by end use
High Medium Short-term
testing
Short-term
testing
Retrofit exterior
fixtures to
reduce lighting
power density,
and add exterior
lighting control
High Medium Short-term
testing
Short-term
testing
Remove heat
from front entry
Medium Low Visual
inspection
None

6 MEASUREMENT & VERIFICATION (M&V)
94
Retail Buildings
Advanced Energy Retrofit Guides
Table 6.6. M&V Approaches for Retrofit Measures Implemented as Part of Standard Retrofit Packages – Staged Approach*
* See Section 2.5 “Planning for Energy Performance Improvements” for details of the Staged Approach to energy performance improvement.
**Whole building approaches will capture savings from all measures implemented.
Measure
Description
Total Energy
Cost Savings
Impact
Low 0-1%
Med 1-3%
High > 3%
Performance
Variability:
High, Med,
Low
Operational
Verification
Activities
Savings
Verification
Approach
Savings
Verification
activities
Ongoing
Performance
Assurance
Add daylight
harvesting
Medium High Short-term
testing
Savings
Verification
Approach
Measure
run hours,
Estimate
wattages
Short-term
testing
Retrofit interior
fixtures to
reduce lighting
power density
by 13%
High Low Sample spot
measurement
Option A
-Partially
measured
retrofit
Isolation
Measure
wattages,
Estimate run
hours
Visual
inspection
Recircuit and
schedule
lighting system
by end use
High Medium Short-term
testing
Option A
-Partially
measured
retrofit
Isolation
Measure
run hours,
Estimate
wattages
Short-term
testing
Retrofit exterior
fixtures to
reduce lighting
power density,
and add exterior
lighting control
High Medium Short-term
testing
Option A
-Partially
measured
retrofit
Isolation
Measure
wattages,
Estimate run
hours
Short-term
testing
Remove heat
from front entry
Medium Low Visual
inspection
Option A
-Partially
measured
retrofit
Isolation
None
None

6 MEASUREMENT & VERIFICATION (M&V)
95
Retail Buildings
Advanced Energy Retrofit Guides
Table 6.7. M&V Approaches for Retrofit Measures Implemented as Part of Deep Retrofit Packages – Integrated Approach*
** See Section 2.5 “Planning for Energy Performance Improvements” for details of the Integrated Approach to energy performance improvement.
**Whole building approaches will capture savings from all measures implemented.
Measure
Description
Total Energy
Cost Savings
Impact
Low 0-1%
Med 1-3%
High > 3%
Performance
Variability:
High, Med,
Low
Operational
Verification
Activities
Savings
Verification
Approach
Savings
Verification
activities
Ongoing
Performance
Assurance
Add daylight
harvesting
Medium High Short-term
testing
Whole
Building
Approach**
Utility data
analysis <or>
Building
simulation
Short-term
testing
Retrofit interior
fixtures to
reduce lighting
power density
by 58%
High Low Sample spot
measurement
Visual
inspection
Recircuit and
schedule
lighting system
by end use
High Medium Short-term
testing
Short-term
testing
Install skylights
and daylight
harvesting
High High Short-term
testing
Short-term
testing
Retrofit exterior
fixtures to
reduce lighting
power density,
and add exterior
lighting control
High Medium Short-term
testing
Short-term
testing
Add roof
insulation
Medium to
High
Low Visual
inspection
Visual
inspection
Replace RTUs
with higher
eciency units
Medium to
High
Low Visual
inspection
Regular
maintenance
Remove heat
from front entry
Medium Low Visual
inspection
None
Replace HVAC
system with
a dedicated
outdoor air
system
Medium to
High
Medium Short-term
testing
Short-term
testing
The suggested methods in the tables above are illustrative and should not be applied broadly across projects.
These tables provide a general idea of the techniques that can be applied to similar measures. Refer to the
discussion below for further explanation of the criteria presented in the tables.

6 MEASUREMENT & VERIFICATION (M&V)
96
Retail Buildings
Advanced Energy Retrofit Guides
6.5 Measure Characterization
Prior to determining a savings verication approach and specifying activities for a retrot project, the
characteristics of the individual measures as well as the overall package should be considered. Based on the
measure and package characteristics, savings verication plans may call for a single whole building approach
addressing all measures for the project, or several M&V options to jointly cover the different measures of the
project.
Projects with a few low-savings measures or measures that don’t interact with each other are generally good
candidates for a retrot isolation approach. In contrast, measures or packages with large ener
gy savings (greater
than 10% of building energy), may adopt a simple whole building approach, such as utility data analysis using
Option C. Alternately, projects that have developed a detailed energy simulation model as a part of the retrot
evaluation process may be best suited to use Option D.
As previously discussed, one of the primary aims of M&V is to effectively balance the risk of losing savings
against the cost needed to verify them. This risk varies from one measure to the next, based on the expected level
of energy cost savings as well as the performance variability. In the tables above, levels of energy cost savings
were dened as Low (0% to 1%), Medium (1% to 3%), and High (> 3%) based on the overall impact to the
energy budget of the building.
Performance variability has also been categorized as Low, Medium, and High based on the level of variability in
the energy use of the measure due to operating conditions or user interaction. This criteria denes the likelihood
of savings not being realized due to operating conditions being different than predicted.
The performance of
some measures, such as envelope improvements, will be static and not change regardless of conditions and are
ranked as “Low.” Measures that are automated but could be disabled or changed, such as adjustments to control
setpoints, are ranked as “Medium.” Measures that could see a wide range of energy use such as VFDs, which
could operate at the same performance level of the baseline, are ranked as “High.”
6.6 Operational Verification Activities
Operational verication activities are needed to verify that measures are installed and operating properly. These
activities include:
u
Visual inspection – The physical installation associated with the measure should be inspected to conrm it
meets specications. This is most relevant for “static” measures that impact performance simply by being
properly installed (e.g., insulation).
u
Sample spot measurement – Verify performance by measuring single or multiple key parameters related to
energy-use for a representative sample of similar, installed equipment (e.g., a measure involving multiple
installations of the same lighting xture/lamps/ballast). In small sets of measures (e.g., less than ve), all
installations should be measured. In larger sets, a representative sample can be measured.
u
Short-term testing – Test for system component functionality and correct implementation of intended control
logic. May involve functional testing and measuring key performance and/or operating parameters.
u
Building automation system (BAS) control logic and/or data trending and review – May involve setting up
and reviewing BAS data trends or reviewing BAS control logic. Measurement period may last for a few days
to a few weeks. Duration is dependent on the period of time needed to capture the range of performance/
operation associated with the measure.

6 MEASUREMENT & VERIFICATION (M&V)
97
Retail Buildings
Advanced Energy Retrofit Guides
6.7 Savings Verification & Ongoing
Performance Assurance
Considerations for selecting a savings verication approach are discussed in the “Overview of M&V
Approaches” section above. These savings verication approaches include:
u
None
u
Option A – Partially measured retrot Isolation
u
Option B – Fully measured retrot isolation
u
Whole Building Approach (Option C or Option D)
Since some measures can be overridden or disabled, ongoing M&V activities will help to ensure savings persist
for the life of the equipment. Ongoing performance assurance activities may be composed of operational verica-
tion activities or a combination of operational and savings verication activities.
6.8 Building Performance Tracking
Many building owners are choosing to track energy savings over time, to evaluate performance and ensure that
savings persist. These efforts are enabled by an ever increasing amount of building performance tracking tools
and services, such as BAS system tracking, fault detection and diagnostic tools, advanced Energy Information
Systems (EIS) that track building energy use, and third party utility bill analysis services. Refer to Chapter 7
“Continuous Improvement through O&M” for more discussion on building performance tracking approaches,
tools, and services.
§ Measurement and verification (M&V) is the practice of measuring, computing, and reporting the results
of energy saving projects.
§ An M&V plan seeks to eectively balance the risk of losing savings against the cost needed to verify
them.
§ It is important to determine early in the project planning process if M&V will be part of the project,
as special planning is required and may involve metering and measurement activities prior to
implementing any changes to the facility.
§ IPMVP guidelines oer M&V best practices, including four specific approaches: “Option A”, retrofit
isolation with partial measurement; “Option B”, retrofit isolation with full measurement; “Option C”,
whole building using utility bill analysis; and “Option D”, whole building using calibrated simulation.
§ The two essential components of M&V for an energy eciency improvement project are operational
verification and savings verification.
KEY POINTS

6 MEASUREMENT & VERIFICATION (M&V)
98
Retail Buildings
Advanced Energy Retrofit Guides
6.9 Additional Resources & Guides
To learn more in-depth information about the M&V concepts presented here, refer to the following additional
resources:
u
Efciency Valuation Organization, “International Performance Measurement and Verication Protocol,” 2010:
Standardized guidelines for performing M&V activities. Available for free download online;
www.evo-world.org.
u
California Commissioning Collaborative, “Building Performance Tracking Handbook,” 2011: Includes a
discussion of performance tracking tools relevant to M&V activities. Available for free download online;
www.cacx.org.
u
Department of Energy, “M&V Guidelines: Measurement and Verication for Federal Energy Projects, Version
3.0,” 2008: Guidelines and methods for measuring and verifying energy, water, and cost savings associated
with federal energy savings performance contracts (ESPCs); much of the content is relevant to M&V activities
in private sector buildings. Available for free download online; www.eere.energy.gov.
u
ASHRAE, “Guideline 14”, 2008: A standard set of energy (and demand) savings calculation procedures for
M&V activities. More information available at www.ashrae.org.

7 CONTINUOUS IMPROVEMENT THROUGH (O&M)
99
Retail Buildings
Advanced Energy Retrofit Guides
7
Continuous Improvement
Through O&M
7.1 What is O&M?
Operations and maintenance (O&M) is the combination of mental
(operations) and physical (maintenance) activities that are required to
keep a building and its energy systems functioning at peak performance.
Operations focus on the control and performance optimization of
equipment, systems, and assemblies. Proper operations help ensure
the equipment produces the required capacity when needed, and that it
produces this capacity efciently. Maintenance typically refers to routine,
periodic physical activities conducted to prevent the failure or decline
of building equipment and assemblies. Proper physical care helps ensure that equipment maintains its required
capacity and that assemblies maintain their integrity. O&M is an activity that almost all facility management
staff engage in, but the nature of that engagement varies. Some engage in reactive O&M, primarily responding to
complaints and breakdowns, while those with a well-planned comprehensive O&M program work pro actively to
prevent complaints and failures.
Implementing a comprehensive O&M program with limited resources is a common challenge. All too often, a lack of
funding, time, manpower or even training prevents holistic and optimized O&M. Dedicating the resources
can be
advantageous, though, as a well-run O&M program can achieve the following (U.S. Department of Energy, 2010):
u Whole building energy savings of 5% to 20%
u Minimal comfort complaints
u Equipment that operates adequately until the end of its planned useful life, or beyond
u Design levels of indoor environmental quality
u Safe working conditions for building operating staff
Optimizing a building’s O&M program is one of the most cost-effective approaches to ensure reliability and
energy efciency, as a building’s O&M practices can often be signicantly enhanced with only minor initial
investments (U.S. Department of Energy, 2010). Through low cost improvements and operational tweaks, such as
those implementations as part of an EBCx process, a building’s energy use can be reduced while maintaining or
even improving occupant comfort (Landsberg, Lord and Carlson, et al. 2009).
§ What is O&M?
§ O&M management
§ O&M program development
§ Building performance tracking
TOPICS COVERED

7 CONTINUOUS IMPROVEMENT THROUGH (O&M)
100
Retail Buildings
Advanced Energy Retrofit Guides
When planning for energy upgrades, a building needs to evaluate how each retrot will impact its O&M program, and
if current O&M practices are adequate. Additional training or resources may be required to maintain the systems
and/or assemblies affected by the upgrade, or to maintain the benets associated with the upgrade. For standard
retrots, the O&M program may not be affected since these retrots usually replace systems and components
with similar but more efcient systems and components. However, even in these instances it’s important to
evaluate the sufciency of the current O&M program and consider devoting additional planning and resources
to maintain the performance and benets of these retrots.
7.2 O&M Management
Successful O&M practices require the support and coordination of much more than just the operations staff.
Integration across all levels of an organization is vital to empowering the right people at the right time to produce
and sustain an energy efcient building. Five key elements of a management system capable of producing
a comprehensive and optimized O&M strategy are represented by the acronym “OMETA” (Operations,
Maintenance, Engineering Support, Training and Administration) (Meador, 1995).
u Operations – Effective operations plans and protocols to maximize building systems’ efciency
u Maintenance – Effective maintenance plans and protocols to maximize building systems’ efciency
u Engineering Support – Availability of technical personnel that can effectively carry out an O&M program
u Training – Adequate training facilities, equipment, and materials to develop and improve the knowledge and
skills necessary to perform assigned job functions
u Administration – Effective establishment and implementation of policies and planning related to O&M
activities
While OMETA describes the key elements of O&M management, it’s also vital to establish a clear framework
for communication and cooperation among the various groups included in an O&M management structure. For a
retail building, these groups can include:
u Property manager or owner’s representative
u In-house operations staff
u Service contractors
u Energy managers
u Building occupants
An individual responsible for maintaining the lines of communication between the various groups, referred to
as an in-house champion, is a critical part of this framework. This champion must be knowledgeable about the
building systems and involved in decision making related to operations. The role of champion is vital to the
O&M process, since lack of support from any particular element of the structure can greatly reduce the benets
of O&M and limit the ability to achieve and retain a fully optimized building.
When implementing the EBCx process or retrots in a building, it’s important to obtain buy-in from all parties
associated with an O&M program. Buy-in from all parties will result in maximizing the persistence of benets
related to the upgrade. The O&M team needs to be closely involved in all core building-related upgrades, since
they are the team that will maintain the systems and assemblies and ultimately dene the sustainability of
upgrades.

7 CONTINUOUS IMPROVEMENT THROUGH (O&M)
101
Retail Buildings
Advanced Energy Retrofit Guides
An additional O&M management consideration is how O&M can be affected if a building outsources O&M
responsibilities to a maintenance management rm, as is often the case with retail buildings. These rms are
often highly skilled and capable of implementing advanced O&M programs, but will only do so if it is specied
in the service agreement. Building owners can review their existing service agreements and talk to their
service providers to determine what level of O&M activity is currently contracted and what may be lacking.
When entering into a new service agreement, building owners are encouraged to seek out vendors that offer
comprehensive O&M.
7.3 O&M Program Development
There are three general approaches to maintenance: reactive, preventive, and predictive (NEEA, 2011):
Reactive maintenance defers maintenance on components and systems until they fail. This approach saves
time and expenses in the short-term, but results in unplanned downtime, additional repairs, and can shorten
equipment life.
Preventive maintenance involves testing, maintaining, and replacing components at regular time intervals
or after specic run-hours so that failures rarely occur. This approach is more cost effective than reactive
maintenance.
Predictive maintenance is a type of routine maintenance that is gaining popularity. Predictive maintenance
utilizes periodic measurements and experience to help determine the service interval for a particular piece
of equipment. For example, instead of tearing apart the chiller annually to service the bearings (preventive
maintenance), predictive maintenance would use the results of annual vibration monitoring, oil analysis, and
lter analysis to estimate bearing wear. This approach may require specialized diagnostic equipment and staff
training, but will maximize equipment life and efciency.
Most buildings utilize a combination of reactive and preventive maintenance depending on factors such as
maintenance expense, energy expense, critical nature of the equipment, and safety concerns (NEEA, 2011).
A comprehensive O&M program is rooted in a detailed O&M plan, which incorporates preventive maintenance
and regular performance checks. The O&M plan describes expectations for equipment operations and
maintenance, and is usually based on an O&M manual. Some facilities may utilize computerized maintenance
management software which can assist in the planning and tracking of work orders, equipment performance,
periodic or run-hour-based preventive maintenance, as well as outside service calls. Use of this type of software
can improve the overall efciency of the maintenance program, but requires staff training and integration with
existing practices.
A clear and customized preventive maintenance plan should be tailored to the facility and consider both
operations and maintenance. Routine maintenance is usually prescribed by equipment manufacturers or
designers. Operational components may include checks for overrides in the controls that should be on ‘auto’,
for proper temperature setpoints, and to see that equipment operating schedules are up to date and consistent
with actual occupancy. These operational checks can help ensure the persistence of benets related to EBCx and
retrot upgrades implemented throughout the life of a building.
An O&M program should be exible enough to adapt to changes that occur to a building over time, including
the O&M and retrot measures discussed in this guide. As such measures are implemented, the O&M program,
including preventive maintenance tasks, should be revised to address the equipment and assemblies related to
these measures – to maintain the capacity, reliability, and performance, including energy performance, of the
equipment and assemblies.

7 CONTINUOUS IMPROVEMENT THROUGH (O&M)
102
Retail Buildings
Advanced Energy Retrofit Guides
7.4 Building Performance Tracking
A common saying in the building industry states “you can’t manage what you don’t measure.” This statement
very much applies to a building’s O&M practice. Measuring the impact of a proactive O&M program over time,
where O&M improvements are investigated and implemented continuously, can help maintain the operational
and energy benets related to upgrades and provides justication to continue investment in the O&M program.
Building performance tracking can support Measurement & Verication (discussed in detail in Chapter 6) of
O&M measures to quantify and validate the impact and related benets of a comprehensive O&M program.
Performance tracking can be integrated into an existing or new O&M management framework, and can be a
valuable method to maintain the persistence of benets associated with building upgrades. The following steps
are important considerations to include in the O&M framework when pursuing a performance tracking strategy
(California Commissioning Collaborative, 2011):
u Dedicate resources to support the performance tracking program
u Identify the performance tracking program team members, and assign responsibilities and communications
protocols
u Document baseline performance
u Set quantiable performance goals
u Consider incentives to motivate staff to achieve the goals
u Include performance tracking language in contracts
u Track performance on an ongoing basis. Take corrective action where needed, and regularly compare progress
to goals.
Building energy performance tracking can occur at two levels that can be deployed independently or together
as part of an O&M program: 1) energy tracking for whole building and major sub-meters; and 2) system level
tracking for main energy end-uses, using a building automation system (BAS) (California Commissioning
Collaborative, 2011). Energy tracking provides a general overview of the building and can be used to identify
unexpected changes, or to look for expected reductions in overall building energy use. System tracking helps
ensure individual end-uses are performing as expected, and provides more metrics to track at a higher resolution
than whole building tracking. This level of detail can aid in pin-pointing the problem when an issue is identied.
Both types of tracking can help ensure the continued energy performance of retrots.
Building performance tracking can also be a useful tool for increasing awareness among tenants and pursuing
behavior based energy savings. Tenants may have their own motivations for reducing energy consumption,
such as sustainability goals, or curbing expenses where they are responsible for utility bills. Energy tracking,
particularly when available at sub-meters, will support tenants in their efforts to meet those goals. Even where
tenants are not independently motivated to act, energy tracking can be used to educate tenants on the benets of
retrots and O&M programs.
The strategies and tools available to assist either energy tracking or system level tracking range from simple
utility bill tracking and benchmarking to system level fault-detection and diagnostics software. This wide
spectrum of tools provides ample exibility to align with a building’s specic ener
gy management goals and
O&M strategy.
The benets of an O&M program are not limited to the building’s energy performance. Additional non-energy
metrics that are impacted by O&M programs and can be tracked include:

7 CONTINUOUS IMPROVEMENT THROUGH (O&M)
103
Retail Buildings
Advanced Energy Retrofit Guides
u Work orders generated and closed out, including occupant comfort complaints
u Backlog of preventive and reactive maintenance items
u Actual equipment life
u Safety record
u Absentee rate and staff turnover
u Overtime worked
Proactively tracking the energy and non-energy metrics related to O&M program impact can help justify costs
related to equipment purchases, program modications, and staff hiring (U.S. Department of Energy, 2010).
7.5 Additional Resources
For more in-depth information about the O&M concepts presented here, refer to the following additional resources:
u Department of Energy, “Operations & Maintenance Best Practices,” 2010: A comprehensive guide to O&M
management considerations, tools, and strategies. Available for free download online; www.eere.energy.gov.
u BOMA, “Preventive Maintenance: Best Practices to Maintain Efcient & Sustainable Buildings”: A
comprehensive guide to establishing and implementing a preventive maintenance program. Available for
purchase online; www.boma.org.
u California Commissioning Collaborative, “Building Performance Tracking Handbook,” 2011: A guide
to utilizing building performance tracking to maximize savings from energy upgrades.
Available for free
download online; www.cacx.org.
u
BetterBricks, O&M online resources: includes management advice, tools, technical advice, and training
resources; www.betterbricks.com.
uPacic Northwest National Laboratory (PNNL): “Maintaining the solution to Operations and Maintenance
efciency improvement,” 1995: denes the key elements of a holistic approach to O&M management:
Operations, Maintenance, Engineering Support, Training and Administration (OMETA). Available for free
download online.
§ Operations and maintenance (O&M) is the combination of mental (operations) and physical
(maintenance) activities that are both required to keep a building and its energy systems functioning
at peak performance.
§ Five key elements of a management system capable of producing a comprehensive and optimized
O&M strategy can be described by the acronym “OMETA”: Operations, Maintenance, Engineering
Support, Training and Administration.
§ A comprehensive O&M program is rooted in a detailed O&M plan, which incorporates preventive
maintenance and regular performance checks.
§ Measuring the impact of a proactive O&M program over time can help maintain the operational
andenergy benefits related to upgrades and provides justification to continue investment in the
O&Mprogram.
KEY POINTS

8 CONCLUSIONS
105
Retail Buildings
Advanced Energy Retrofit Guides
8
Conclusions
Retail buildings use 13% of total commercial building energy use – the second highest energy use of any sector,
after ofce buildings – and existing retail buildings contain ample opportunity for energy saving, improvements.
70% of existing retail buildings were built before 1980, and the equipment in those building looks increasingly
inefcient when compared to newer technologies.
This guide demonstrates that 15% energy savings are relatively easy to achieve and savings of 45% or greater
are accessible for owners who are willing to invest in deep, holistic approaches. The rigorous nancial analysis
methods presented in this guide show that the long-term benets from these deep retrots considerably outweigh
the costs. Rising energy costs, climate risks, regulatory risks, and growing market value placed on sustainability
are other drivers moving building energy upgrades from a niche activity to an essential activity to maintain
competitiveness.
A growing body of evidence links elevated building performance to improved occupant comfort, higher building
occupancy rates, higher rents, and greater asset value. With energy costs typically constituting 30% of overall
operating costs, embracing energy efciency as a core strategy will allow commercial real estate owners to
substantially increase net operating income and asset value.
While most would agree that improved building performance is the right way to go, and acknowledge the wide
range of options, navigating those options and developing a protable long-term strategy has been far from
easy. This guide breaks down the myriad of options into recommended packages for key U.S. climate zones and
provides a strong start for any building owner. Crucially, the guide presents a cost-effectiveness metric for each
package that recognizes the complexity of companies’ business processes.
Even the most compelling business case might fall short of success without sound planning and implementation.
Therefore, this guide describes proven approaches to project planning and execution. Companies can drive their
buildings towards higher performance by setting goals, creating a long-term plan, and carefully tracking progress.
The roadmap presented in this guide will lead building owners from recognition of the opportunity through the
full journey that leads to high performance.
A wide array of resources are available to building owners seeking to enhance building performance. This
guide includes links to a host of other resources that owners may wish to consult. W
ith the help of information
and assistance offered by many government agencies, utility companies, and other organizations, nearly every
building owner is within easy reach of an energy saving project.

9 REFERENCES
107
Retail Buildings
Advanced Energy Retrofit Guides
9
References
Building Commissioning Association (2008), “Best Practices in Commissioning Existing Buildings,”
www1.eere.energy.gov/femp/pdfs/bcabestpractices.pdf.
California Energy Commission (2000), “How to Hire an Energy Auditor to Identify Energy Efciency Projects,”
www.energy.ca.gov/reports/efciency_handbooks/400-00-001C.PDF.
California Commissioning Collaborative (2011), “The Building Performance Tracking Handbook,”
www.cacx.org/PIER/handbook.html.
Cowan, J., R. Pearson, I. Sud (2004), Procedures for Commercial Building Energy Audits. American Society of
Heating, Refrigerating and Air-Conditioning Engineers, Incorporated.
DiLaura, D. (2011), “The Lighting Handbook,” Illuminating Engineering Society.
Egan, M., V. Olgyay (2002), “Architectural Lighting”. McGraw-Hill.
Eichholtz, P., N. Kok, J. M. Quigley (2009), “Doing Well by Doing Good: Green Ofce Buildings,” University
of California, Berkeley.
Energy Design Resources (2002), “Design Brief: Integrated Building Design,” www.energydesignresources.com/
resources/publications/design-briefs.aspx.
Fuerst, F., P. McAllister (2009), “An Investigation into the Effect of Eco-labeling on Ofce Occupancy Rates,”
Journal of Sustainable Real Estate, Vol. 1, No. 1.
Goldman, C., N. Hopper, J. Osborn (2005), “Review of U.S. ESCO Industry Market Trends: An Empirical
Analysis of Project Data,” Lawrence Berkeley National Laboratory.
Hopper, N. et al. (2005), “Public and Institutional Markets for ESCO Services: Comparing Programs, Practices,
and Performance,” Lawrence Berkeley National Laboratory.
IBE (Institute for Building Efciency) (2011), “2011 Energy Efciency Indicator: Global Results,”
www.institutebe.com/Energy-Efciency-Indicator.aspx.
Landsberg, D.R., M. R. Lord, S. W. Carlson (2009). Energy Efciency Guide for Existing Commercial Buildings:
The Business Case for Building Owners and Managers. American Society of Heating, Refrigerating & Air-
Conditioning Engineers, Incorporated (2009).
Meador, R. J. (1995), “Maintaining the Solution to Operations and Maintenance Efciency Improvement”,
World Energy Engineering Congress, Atlanta.

9 REFERENCES
108
Retail Buildings
Advanced Energy Retrofit Guides
Mills, E., et al. (2004), “The Costs and Benets of Commercial Building Commissioning: A Meta-Analysis of
Energy and Non-Energy Impacts in Existing Buildings and New Construction in the United States,” Lawrence
Berkeley National Laboratory.
Mills, E. (2009), “Building Commissioning: A Golden Opportunity for Reducing Energy Costs and Greenhouse-
gas Emissions,” Lawrence Berkeley National Laboratory.
Miller, N., J. Spivey, A. Florance (2008), “Does Green Pay Off ?,” http://www.costar.com/josre/pdfs/CoStar-
JOSRE-Green-Study.pdf.
NEEA (Northwest Energy Efciency Alliance) (2011), “BetterBricks” (website), www.betterbricks.org, accessed
July 2011.
U.S. Energy Information Administration (2006), “2003 Commercial Buildings Energy Consumption Survey,”
www.eia.doe.gov/emeu/cbecs/.
U.S. Environmental Protection Agency (2007), “A Retrocommissioning Guide for Building Owners,” www.peci.
org/documents/EPAguide.pdf.
U.S. Environmental Protection Agency (2008), “EnergyStar
®
Building Upgrade Manual,” www.energystar.gov/
ia/business/EPA_BUM_Full.pdf.
U.S. Department of Energy (2010), “Operations and Maintenance Best Practices,” www1.eere.energy.gov/femp/
pdfs/omguide_complete.pdf.
U.S. Department of Energy (2011a), “Better Buildings” (website), www1.eere.energy.gov/buildings/
betterbuildings/, accessed July 2011.
U.S. Department of Energy (2011b), “Tax Incentives for Commercial Buildings” (website), www1.eere.energy.
gov/buildings/tax_commercial.html.

10 APPENDIX
109
Retail Buildings
Advanced Energy Retrofit Guides
10
Appendix
10.1 Baseline Building Characteristics and
Simulation Approaches
Retail Reference Building Characteristics
To evaluate the energy impacts of various energy efciency measures, a hypothetical baseline building was
developed to represent a typical retail building with certain age. The 24,695 ft
2
standalone retail building (pre-
1980 construction version) described in DOE Commercial Reference Buildings (Deru et al., 2011) was used as
the starting point of the baseline model development in this project. DOE’s Building Technologies Program, in
conjunction with three of its national laboratories including PNNL, NREL, and LBNL, developed these models
to serve as starting points for energy efciency research. Over the past few years, the models have been improved
and republished with several version updates. During the course of this Advanced Energy Retrot Guide (AERG)
project, modications were made to the Reference model for the following reasons:
u
The baseline model for the Advanced Energy Retrot Guide (AERG) project needs to be able to accommodate
the necessary changes caused by the building retrot measures.
u
The baseline model should not have the worst or best performance among buildings with similar age. Instead,
it should represent the typical design and operating condition based on engineering judgment.
u
The pre-1980 construction building may have been upgraded with various retrots since it was originally
constructed.
The basic characteristics of the standalone retail baseline building used for the AERG project are shown in
Table 10.1. This baseline building was used to model the energy and demand impacts of the individual measures
and the recommended packages.
Table 10.1. Retail Reference Building Characteristics
Item Descriptions
Program
Vintage PRE-1980 CONSTRUCTION
Location
Zone 1A: Miami (Hot & Humid)
Zone 3B: Las Vegas (Hot & Dry)
Zone 4C: Seattle (Marine)
Zone 5A: Chicago (Cold)
Zone 7: Duluth (Very Cold)
Available fuel types gas, electricity

10 APPENDIX
110
Retail Buildings
Advanced Energy Retrofit Guides
Item Descriptions
Building Type (Principal
Building Function)
Retail
Building Prototype Standalone Retail
Form
Total Floor Area (ft
2
) 24,695 (178 ft x 139 ft)
Building shape
Aspect Ratio 1.28
Number of Floors 1
Window Fraction
(Window-to-Wall Ratio)
7.1% (Window Dimensions:
82.136 ft x 5 ft, 9.843 ft x 8.563 ft and 82.136 ft x 5 ft on the street facing facade)
Window Locations Windows only on the street facing façade (25.4% WWR)
Shading Geometry none
Azimuth non-directional
Thermal Zoning
Back_Space
Core_Retail
Point_of_Sale
Front_Retail
Front_Entry
Floor to floor height (ft) N/A
Floor to ceiling height (ft) 20
Glazing sill height (ft) 5 ft (top of the window is 8.73 ft high with 3.74 ft high glass)
Architecture
Exterior walls
Construction Steel Frame Wall

10 APPENDIX
111
Retail Buildings
Advanced Energy Retrofit Guides
Item Descriptions
U-value (Btu/h * ft
2
* °F)
Miami (Hot & Humid): 0.23
Las Vegas (Hot & Dry): 0.23
Seattle (Marine): 0.175
Chicago (Cold): 0.156
Duluth (Very Cold): 0.136
Dimensions based on floor area and aspect ratio
Tilts and orientations Vertical
Roof
Construction Insulation entirely above deck
U-value (Btu/h * ft
2
* °F)
Miami (Hot & Humid): 0.10
Las Vegas (Hot & Dry): 0.10
Seattle (Marine): 0.085
Chicago (Cold): 0.072
Duluth (Very Cold): 0.06
Dimensions based on floor area and aspect ratio
Tilts and orientations horizontal
Window
Dimensions based on window fraction, location, glazing sill height, floor area and aspect ratio
Glass-Type and frame Hypothetical window with the exact U-factor and SHGC shown below
U-factor (Btu/h * ft
2
* °F) Miami (Hot & Humid): U-1.08 SHGC-0.61
Las Vegas (Hot & Dry): U-1.08 SHGC-0.61
Seattle (Marine): U-1.08 SHGC-0.61
Chicago (Cold): U-0.55 SHGC-0.43
Duluth (Very Cold): U-0.55 SHGC-0.43
SHGC (all)
Skylight
Dimensions NA
Glass-Type and frame NA
U-factor (Btu/h * ft
2
* °F)
NASHGC (all)
Visible transmittance
Foundation
Foundation Type Slab-on-grade floors (unheated)
Construction 4" concrete slab poured directly on to the earth
Dimensions based on floor area and aspect ratio
Interior Partitions
Construction 0.5 in gypsum board + 0.5 in gypsum board
Dimensions based on floor plan and floor-to-floor height
Air Barrier System
Infiltration
Peak: 0.24192 cfm/sf of above grade exterior wall surface area (when fans turn o)
O Peak: 25% of peak infiltration rate (when fans turn on)
HVAC
System Type
Heating type Gas furnace inside the packaged air conditioning unit for back_space, core_retail,
point_of_sale, and front_retail. Standalone gas furnace for front_entry.
Cooling type
Packaged air conditioning unit for back_space, core_retail, point_of_sale, and front_
retail;
No cooling for front_entry.

10 APPENDIX
112
Retail Buildings
Advanced Energy Retrofit Guides
Item Descriptions
Distribution and
terminal units
Constant air volume air distribution
4 single-zone roof top units serving four thermal zones
(back_space, core_retail, point_of_sale, and front_retail)
HVAC Sizing
Air Conditioning autosized to design day
Heating autosized to design day
HVAC Eciency
Air Conditioning Various by climate location and design cooling capacity
Heating Various by climate location and design heating capacity
HVAC Control
Thermostat Setpoint 73°F Cooling/71°F Heating for back_space, core_retail, point_of_sale, and front_retail
65°F Heating for front_entry
Thermostat Setback 86°F Cooling/60°F Heating for back_space, core_retail, point_of_sale, and front_retail
60°F Heating for front_entry
Supply air temperature Maximum 122°F, Minimum 50°F
Chilled water supply
temperatures
NA
Hot water supply
temperatures
NA
Economizers Economizer out of order due to poor maintenance
Ventilation Outdoor air dampers fixed at 15% open, return dampers at 85% open
whenever fan is on.
Demand Control Ventilation NA
Energy Recovery NA
Supply Fan
Supply Fan Total Eciency
(%)
54%-60% depending on the fan motor size
Supply Fan Pressure Drop Various depending on the fan supply air cfm
Pump
Pump Type NA
Rated Pump Heat NA
Pump Power NA
Cooling Tower
Cooling Tower Type NA
Cooling Tower Eciency NA
Service Water Heating
SWH type Storage Tank
Fuel type Natural Gas
Thermal eciency (%) 78%
Tank Volume (gal) 40
Water temperature setpoint 120°F
Water consumption 843 gal/week

10 APPENDIX
113
Retail Buildings
Advanced Energy Retrofit Guides
Item Descriptions
Internal Loads & Schedules
Lighting
Average power density
(W/ft
2
)
1.37 W/ft
2
for back_space and 2.49 W/ft
2
for other spaces
Daylighting Controls NA
Occupancy Sensors NA
Plug load
Average power density
(W/ft
2
)
0.3 W/ft
2
for Core_Retail and Front_Retail, 1.21 W/ft
2
for back_space, 0.43 W/ft
2
for
point_of_sale, and 0 W/ft
2
for frount_entry
Occupancy
Average people 66.7 ft
2
/person
Miscellaneous
Elevator
Peak Power NA
Schedule NA
Exterior Lighting
Peak Power 7560 watts for parking lot, 4320 watts for signage, 1248 watts for loading dock, and
300 watts for entrance overhang

10 APPENDIX
114
Retail Buildings
Advanced Energy Retrofit Guides
Simulation Approach
Building energy simulation was intensively used in this project to support the retrot guide development. Due
to its strong capability to model different HVAC systems and equipment, EnergyPlus version 6.0 was selected
as the simulation program to assess and quantify the energy and cost saving potential for each individual energy
efciency measure. The quantied savings is then used together with the measure implementation cost for the
cost-effectiveness analysis, which formed the basis to determine the EBCx, standard retrot and deep retrot
packages. Each tiered package is further evaluated in terms of its energy saving and cost-effectiveness.
Figure 10.1 shows the series of steps followed in this work to conduct the energy simulation for development
of the guide.
Baseline building model development and evaluation
q
O&M and retrofit measures identification
q
O&M measure package energy saving
and cost-eectiveness analysis
q
Individual retrofit measure energy saving
and cost-eectiveness analysis
q
Retrofit measures categorization
q
Standard retrofit measure package energy saving
and cost-eectiveness analysis
q
Deep retrofit measure package energy saving
and cost-eectiveness analysis
Figure 10.1. Workflow of Simulation Support for Retrofit Guide Development
Additional detail on these steps is provided here:
u
Baseline building model development and evaluation. A baseline building model was developed as a rst
step. This model is based on the DOE’s Reference Building model for standalone retail buildings discussed
previously (Deru et al., 2011). The model was adjusted to reect the most common building design and
operation practice for pre-1980 vintage buildings in each climate location.
u
O&M and retrot measures identication. Based on the dened baseline building model, the project team’s
past experience with O&M and retrot measures implemented as part of O&M and retrot projects, and other
resources, a list of potential O&M and retrot measures was identied with specic improvements relative
to the baseline assumptions. Most of the measures affect the interior and exterior lighting, plug and process
loads, HVAC equipment and control, service hot water system, and building envelope. At this step, the retrot
measures were not distinguished with respect to the measure package that they belong to.

10 APPENDIX
115
Retail Buildings
Advanced Energy Retrofit Guides
u O&M measure package energy savings and cost-effectiveness analysis. The O&M measures that could
be modeled in EnergyPlus were evaluated as a package to determine the energy saving potential from
implementing an O&M processing each of the ve climate locations. Not all of the O&M measures were
modeled with EnergyPlus simulation for two reasons: 1) some O&M measures may not result in energy
savings; and 2) some building system operational faults or degradation cannot be accurately modeled in the
EnergyPlus simulation program.
u
Individual retrot measure energy savings and cost-effectiveness analysis. Each retrot measure was
individually evaluated in terms of its energy saving and cost-effectiveness. With the commissioned building
from the previous step as the reference, each individual retrot measure was added to the building model to
generate a new model for each measure. The new model and the reference model have the same hardcoded
equipment size and settings such as rooftop unit (RTU) cooling capacities. Site energy consumption was
obtained by running EnergyPlus for the new model. In addition, based on the predened utility rates,
EnergyPlus also calculated the energy cost, including both energy consumption cost and demand cost. The
site energy difference between the reference and the new model is regarded as the energy savings for that
measure. The peak demand savings is the difference in the annual peak demand between the reference and
the new model. The energy cost difference is the annual energy cost savings. This energy cost savings is then
used together with the estimated measure implementation cost to calculate cost-effectiveness metrics such as
simple payback and net present value. Section 10.6 “Retrot measures” provides the detailed results of each
individual retrot measure.
u
Retrot measures categorization. Based on the energy saving and the cost-effectiveness metrics for the retrot
measures from the previous step, retrot measures were selected for development of the standard retrot
and deep retrot packages. Generally, the standard retrot package includes relatively simple measures that
are implemented for energy reasons, while the deep retrot package includes measures where the equipment
is assumed to be at the end of its useful life, the building is going through a major upgrade, or where the
measures involve a substantial upgrade to the systems.
u
Standard retrot measure package energy savings and cost-effectiveness analysis. After the standard retrot
package was determined, its overall energy savings and cost-effectiveness was estimated as a whole in
comparison with the original baseline. The package analysis takes into account the interactions between
different measures. Hence, the packaged energy savings is not simply the sum of total individual measures.
For the standard package, the capacity of equipment that was not directly affected by the measures included in
the package stayed the same between the new model and the reference model.
u
Deep retrot measure package energy savings and cost-effectiveness analysis. Similar to the standard
package, after the deep retrot package was determined, its overall energy savings and cost-ef
fectiveness
was estimated as a whole in comparison with the original baseline. The package analysis takes into account
the interactions between different measures. Hence, the packaged energy savings is not simply the sum of
total individual measures. For the deep retrot package, equipment capacities were changed between the new
model and the reference model, to reect the “deep” nature of the package (e.g., (RTU) cooling and heating
capacities). However, equipment that was not directly affected by the measures included in the package stayed
the same between the new model and the reference model (e.g., water heater capacity).
10.2 Modeling Results Considerations
The estimated energy savings and costs of the energy efciency measures included in this guide are based
on energy simulation results from the EnergyPlus whole building energy simulation software program. The
user-dened inputs of the model’s pre-retrot conditions are dened by a theoretical reference building with
characteristics similar to common retail buildings in the U.S. For a detailed discussion of the reference building
characteristics and modeling approach, see Appendix 10.1.

10 APPENDIX
116
Retail Buildings
Advanced Energy Retrofit Guides
While the reference building reects common existing retail building characteristics, the multitude of building
characteristic variables means there will inevitably be differences between the characteristics of the reference
building and actual buildings. These differences can lead to different costs and energy savings results in the real
world compared to the estimated costs and savings of the measures discussed in this guide. The cost and savings
values in this guide should be used to gain a general idea of the cost-effectiveness of ener
gy efciency measures.
For an actual building, costs and measures should be calculated separate from the values presented in this guide.
Some of the primary variables that will impact the baseline energy performance and measure ener
gy savings of
an actual building compared to the model’s reference building include the following.
1) Outdoor climate
Outdoor climate conditions, including temperature, solar load, and humidity levels, are key variables that
impact the expected energy savings and suitability of many of the measures. The ve climate zones used to
model the measures’ energy savings represent a wide variety of climate conditions, but are not comprehensive.
A rough approximation of measure savings for a building in a climate that seems to fall between two of the ve
represented climate zones could be estimated by taking the average of the savings associated with the two most
similar climate zones.
2) Envelope thermal characteristics and geometries
Envelope building characteristics affect most O&M and retrot measure savings by impacting the building’s
heating and cooling load, which results in an impact on the building’s HV
AC systems. A comparison of
the reference building’s envelope characteristics (see Appendix 10.1 for details) with an actual building’s
characteristics can help inform expected energy savings. Some of the key building characteristics that should be
considered include:
u
Building geometry and orientation, including:
- Number of oors and distance from oor to oor
- Floor plan aspect ratio
- Percent window and skylight area
u Building envelope component thermal characteristics, including:
- Roof insulation, reectance, and thermal mass
- Wall insulation and thermal mass
- Window and skylight insulation, solar heat gain coefcient, visible light transmittance, shading devices,
and frame type
- Building air tightness
3) Building occupancy
The occupancy schedule, occupancy load, and type of occupancy of a building impact the amount of thermal heat
added from human activity, which in turn impacts the load on the building’s HVAC system. Occupancy schedule
relates to when people are in the building, occupancy load is dened by how many people are in the building,
and type of occupancy reects the activity level and, thus, thermal heat output of each person. Each of these can
have an impact on building energy performance. For example, buildings with reduced occupancy schedules may
have lower cooling loads and increased heating loads compared to similar buildings with more typical occupancy
schedules. Building occupancy can have an impact on the energy used by HVAC systems, due to its impact on
space heating and cooling loads and building ventilation.

10 APPENDIX
117
Retail Buildings
Advanced Energy Retrofit Guides
4) Internal equipment load
Also referred to as “plug loads”, this end use includes energy-consuming devices such as ofce equipment and
appliances. The power consumed by these devices has a direct impact on the energy used by a building, and this
energy is also released to the space as heat, which translates to either a cooling load or a form of space heating.
Computer server usage also has a signicant impact on building energy usage. While the oor area of computer
servers may be relatively small, the high energy density of computer servers makes this equipment an important
consideration in overall building energy usage.
5) Building HVAC system type
The type of HVAC system used can have a signicant impact on building energy usage. Different types of HVAC
systems will have varying levels of overall cooling and heating efciency, at part load and full load conditions.
6) Building equipment efciencies and efcacies
This typically relates to building HVAC systems, but can also apply to other building systems. The higher the
equipment efciency, the less energy consumed (input) to produce the same amount of useful energy (output).
Efcacy typically refers to lighting, and is a measure of how much light is produced by a lamp for a given unit of
power. Lamps with higher efcacy will draw less power to achieve the same resultant lighting level compared to
lower efcacy lamps.
7) Operation of building equipment
In addition to the load, efciency, and efcacy of building systems, their operating schedules and control
strategies can also have a signicant impact on total energy use. Variables to consider include:
u
HVAC equipment operating schedule and equipment staging strategies
u Lighting operating schedule
u Temperature setpoints of HVAC system
u HVAC controls strategies used
u Amount of minimum ventilation air
u Lighting control strategies (e.g., occupancy sensors or manual on/off)
8) Equipment zoning
The layout of the lighting and HVAC zones can have an impact on overall energy usage. Smaller lighting zones
give greater opportunity for shutting off lights when areas are not in use. The same concept holds true for HVAC
zones – smaller zones are more suited for standby mode when zones are unoccupied. The depth of the perimeter
zones is another factor that can inuence energy usage.
The reference building was chosen as a representative “average” standalone retail building. Actual building
characteristics, including installed systems and components and their operating characteristics may vary from
these reference building characteristics, which can have an impact on building energy usage.
In general, if your building uses less energy than the reference building due to higher equipment efciencies and
higher envelope thermal performance, for example, you can expect reduced savings compared to the numbers
presented in this guide. It’s important to compare the reference building’s characteristics to your building’s
characteristics, to get an idea of how applicable the measure costs and savings are for your situation.

10 APPENDIX
118
Retail Buildings
Advanced Energy Retrofit Guides
10.3 Reference Climate Zone Characteristics
Table 10.2 can be used by building owners to compare the characteristics of their climate zone with the
characteristics of the ve represented climate zones in this guide. ASHRAE provides climatic information for
most large cities in the United States. Climatic information for the ve climate zones addressed in this guide is
shown in Table 10.2 (ASHRAE, 2009b).
Table 10.2. Reference Climate Zone Characteristics
Climate
Zone
Winter design
temperature
1
, °F
Summer design
temperature
2
, °F
Summer design
humidity level,
% RH
Annual heating
degree days
3
,
°F-day
Annual cooling
degree days
3
,
°F-day
Miami (Hot
& Humid)
47.7 91.8 53% 130 4,458
Las Vegas
(Hot & Dry)
30.5 108.3 11% 2,105 3,348
Seattle
(Marine)
24.5 84.9 34% 4,729 177
Chicago
(Cold)
-4 91.9 45% 6,311 842
Duluth
(Very Cold)
-19.5 84.5 49% 9,425 209
¹ Reasonably expected minimum temperature. Winter design temperature = ASHRAE 99.6% DB.
² Reasonably expected maximum temperature. Summer design temperature = ASHRAE 0.4% DB. Summer design humidity
based on ASHRAE 0.4% DB/mean coincident wet bulb (MCWB)
³ Heating and cooling degree days are base 65°F.
10.4 Cost-Eectiveness Analysis
Methodology
The economic analysis of retrot measures is one of the most challenging topics to address in a guidebook, yet
is absolutely essential for building owners or facility managers trying to develop a convincing business case for
a retrot project. This guide provides best practice methodologies for calculating both net present value (NPV)
and simple payback period. We recognize that while NPV is the preferred metric because it better captures the
full range of benets and costs associated with an investment over time, simple payback remains the most well-
established metric for quantifying the cost-effectiveness of energy retrot projects. Simple payback is determined
by dividing the initial investment (costs incurred at year 0) by the rst year energy savings.
In this Appendix, we address the economic analysis of retrots measures in a much more practical manner than
has been attempted in other retrot guides. We provide methods for accurately quantifying multi-year cash ows,
including energy costs, demand reduction, replacement costs (including reduced energy savings if more efcient
equipment would have been required by code), salvage value, O&M costs, and M&V costs.
Techniques and
references are also provided for capturing the effect of temporary nancial incentives offered by government
agencies or utilities (such as rebates, low interest loans, tax credits, etc.) on multi-year cash ows. Indirect
benets such as productivity improvements and reduction in sick days are discussed qualitatively, but are not
quantied in the cash ow analysis.

10 APPENDIX
119
Retail Buildings
Advanced Energy Retrofit Guides
The recommended methodology described in this guide is applied to a reference building, discussed in Appendix
10.1, resulting in the selection of building improvement packages for projects at three levels of improved energy
performance (existing building commissioning, standard retrot, and deep retrot). The reference building
is based on a representative low-rise retail building of pre-1980s vintage, developed by three DOE national
laboratories for the purpose of evaluating the energy savings potential of new technologies and deployment
initiatives (Deru et al. 2011). The purpose of using this reference building is to illustrate the analysis and measure
selection process in the context of a realistic scenario, and to provide the reader with some idea of the energy
savings potential of the measures described in this guide. However, it is important to note that certain measures
may be highly cost-effective in the reference building, but may be a very poor choice in a different situation. Age
of equipment, cost structure, nancing terms, tax incentives, local weather conditions, and system interactions
can all have very large impacts on the cost-effectiveness of a particular measure.
Overall Net Present Value Calculation
As discussed in Section 2.6 “Business Case for Upgrading Building Performance”, net present value (NPV) is the
nancial analysis metric that best captures the full economic value of a retrot measure or package of measures.
NPV is an integral component of life cycle cost analysis, but we will limit our analysis to direct costs and benets
that impact a commercial building’s typical budget. Societal and environmental costs will not be addressed,
except to the extent they are reected in taxes, nancial incentives, purchase costs, and disposal costs.
The following general equation is used for NPV analysis in the context of a building energy retrot project:
Where:
C
0
= initial investment and related cash ows in Year 0
C
t
= sum of cash ows in Year t (current year dollars)
t = years after initial investment
N = number of years in analysis period
DF = real discount factor (does not include ination)
A 20-year project analysis period was adopted for this particular study. This time period is longer than the useful
life of most of the measures that will be evaluated, and provides a fair cut-off point for ener
gy savings and other
benets associated with a measure. Predicting the cash ows beyond a 20-year timeframe would likely introduce
unforeseen risks as signicant modications to a building or its use could occur beyond 20 years. These changes
to the building and its operation could negate the effectiveness of certain retrot measures. Finally, since cash
ows beyond 20 years are signicantly discounted in the NPV calculation, they no longer hold much weight in
the analysis.
The appropriate discount factor can vary wildly depending on the risk tolerance of the building owner, type of
nancing, uncertainty in energy savings, and alternative investment options that may be available. Based on an
informal survey of typical building owners, a discount rate of 8.0% was adopted for the retail cash ow analysis.

10 APPENDIX
120
Retail Buildings
Advanced Energy Retrofit Guides
Components of Multi-Year Cash Flows
There can be a large number of cash ows associated with a particular retrot measure, both positive and
negative. Positive cash ows represent net inows of money, while negative cash ows represent net outows
or costs. All cash ows are “net” cash ows relative to the reference case. A positive cash ow may be a direct
inow of cash to an organization, such as the sale of equipment or a rebate from the utility company, or they may
represent an avoided expenditure, such as energy cost savings or not purchasing replacement equipment when the
original equipment would have reached the end of its useful life. Equations A-2 and A-3 identify the cash ows
that are the most important for a meaningful NPV calculation. The cash ows are assumed to be in current year
dollars (i.e. adjusted for ination).
Where:
C
pur
= purchase cost of equipment, the “material” cost
C
inst
= installation cost of measure/package, the “labor” cost
C
salv,ref
= salvage value of existing equipment
C
tax,0
= tax benets associated with disposing of existing equipment
C
incent
= NPV of nancial incentives (rebates, tax credits, etc.)
C
disp
= disposal cost of existing equipment
C
plan
= cost of project planning (=0 for individual measures)
Where:
C
energy,elec,t
= annual electricity cost savings in Year t
C
energy,gas,t
= annual natural gas cost savings in Year t
R
esc,elect
= fuel price escalation rate for electricity = 0.5% (U.S. Energy Information Administration
(EIA), 2011b)
R
esc,gas
= fuel price escalation rate for natural gas = 2.0% (U.S. EIA, 2011b)
C
om
= additional O&M costs (negative if O&M savings)
C
mv
= additional M&V costs (=0 for individual measures)
C
repl,eem
= replacement cost for measure/package (=0 except at end of useful life)
C
repl,ref
= replacement cost for reference case (must meet code) (=0 except at end of useful life)
C
salv,eem,20
= salvage value of measure (=0 except in year 20)
C
salv,ref,20
= salvage value of reference equipment (=0 except in year 20)
Guidance, assumptions, and technical resources for estimating each of these cash ows are presented in the
following sections.
Purchase Cost (C
pur
)
The purchase cost of the measure or package of measures includes the cost of equipment and associated
materials. It does not include labor costs. Purchase cost for a particular product or piece of equipment is
relatively consistent from project to project, but may still vary depending on the volume purchased, presence
of local competition, and any negotiated purchasing agreements with suppliers. For our analysis, a professional
cost-estimating rm was contracted to estimate purchase costs associated with each measure based on the
building type (retail) and geographic location.

10 APPENDIX
121
Retail Buildings
Advanced Energy Retrofit Guides
Installation Cost (C
inst
)
Unlike purchase cost, the installation costs associated with a measure can vary dramatically depending on the
building being modied and the capabilities of the contractor. Costs may be higher for a variety of reasons:
u
Systems are difcult to access
u Complex integration with existing systems and controls is necessary
u The work must be done at night or on weekends to avoid disrupting building operations
u Hazardous materials must be removed or controlled (asbestos, mold)
The analysis for this guide assumes that none of these complications are present, and that typical installation
costs apply.
Salvage Value of Existing Equipment (C
salv,ref
)
For the most part, older equipment and materials removed from a building have very little salvage value. Newer
equipment may have more value, but is less likely to be replaced as part of an energy retrot. In most cases, we
assume that equipment cannot be re-used, and the value of recyclable components (such as copper, aluminum,
and glass) is approximately the same as the cost of hauling the equipment away.
Tax Benefits Associated with Disposing of Existing
Equipment (C
tax,0
)
If existing capital equipment is replaced before it is fully depreciated, the difference between the un-depreciated
value of the equipment (or adjusted basis) and the salvage value (if any) is considered an operating loss, which
can be deducted from corporate taxes. In subsequent years, the depreciation tax deduction that would have
been available for the existing equipment is lost. C
tax,0
is equal to the net present value of these competing tax
implications. However, for this analysis, the specic tax benets from operating losses were not considered.
Financial Incentives (C
incent
)
Financial incentives from utilities or government entities can take many different forms, including rebates,
subsidies, tax credits, accelerated depreciation, low interest loans, guaranteed loans, and free energy audits.
These incentives can be quite signicant, causing marginally cost-effective measures to produce large returns
on investment. Financial incentives should not be ignored when evaluating measures for actual retrot projects.
For the analysis, however, we do not include these incentives because they may come and go over time, and our
intention is to identify packages of measures that pay for themselves strictly through energy cost savings.
Disposal Cost of Existing Equipment (C
disp
)
Certain materials associated with the existing equipment may require special handling, recycling, or disposal
procedures that can increase the overall cost of a measure. Examples include uorescent lamps, computers,
refrigerators, and construction materials containing asbestos. These costs can be very different from one site
to another, but generally are not very large compared to other costs associated with a project. For the example
analysis, we estimated disposal costs using professional cost estimators.

10 APPENDIX
122
Retail Buildings
Advanced Energy Retrofit Guides
Project Planning (C
plan
)
Overall project planning includes all of the preparatory work conducted by the building owners and design team
prior to the selection of measures that will be implemented. After that point, management and coordination
activities are most easily treated as overhead costs for individual measures. The following costs are examples of
those included in project planning category for standard retrot projects:
u
Form the internal project team
u Perform energy benchmarking activities
u Conduct a site energy audit
u Write statements of work for subcontracted activities
u Review bids and select contractors
u For deep retrot projects, there is typically an added expense related to the associated design effort. Deep
retrot projects involve an integrated design process, usually involving an architect and engineering
disciplines, to design the retrots from a whole building perspective, to minimize resultant energy use.
For the example analysis, we used a project planning cost of 10% of the total initial construction cost for the
deep retrot packages, based on values shown in RS Means Building Construction Cost data. W
e did not include
project planning costs for the standard retrot packages, assuming that these costs could be absorbed in-house.
Electricity Cost Savings (C
energy,elec,t
) and Natural Gas
Cost Savings (C
energy,gas,t
)
Energy savings can be difcult to calculate without using a sophisticated modeling tool. Even straightforward
measures such as lighting improvements have large interactions with space conditioning energy. As a result,
we do not recommend using oversimplied techniques to quantify energy savings for complex projects that
require large nancial commitments and involve signicant risk. DOE has assembled summaries of more than
300 building energy simulation tools (http://apps1.eere.energy.gov/buildings/tools_directory/), which can be
quite helpful for organizations that do not have an established approach for energy analysis and may be seeking
expert guidance for selecting the right tool. If in-house expertise is not available to conduct a comprehensive
energy cost savings analysis, consider contracting with a third party rm. The identication of energy savings
opportunities and associated energy and cost saving estimates are commonly included in energy audits or existing
building commissioning (EBCx) projects.
Annual electricity cost savings includes reductions in both energy use (kWh) and peak demand (kW). Natural
gas cost savings is based simply on the reduction in volume of gas used (1000 ft
3
). Utility rate structures are
highly variable depending on geographic location, time of year, and facility size. Therefore, the actual utility rate
schedule should be identied and utilized for the purpose of calculating electricity cost savings. If actual utility
rates cannot be found, estimated energy prices for each state are published by the EIA (http://www.eia.gov/).
Energy savings can sometimes change over the life of a project. For example, if new equipment is not well-
maintained, its efciency may degrade signicantly or it may fail prematurely. Our assumption for the analysis
is that comprehensive O&M and M&V protocols are implemented to ensure that the performance of new
equipment is sustained. The cash ows associated with O&M and M&V are consistent with this assumption.

10 APPENDIX
123
Retail Buildings
Advanced Energy Retrofit Guides
The energy savings for a retrot project can also diminish over time because the reference building must comply
with local energy codes when equipment is replaced. If the reference building has a very old boiler with 70%
combustion efciency and ve years of useful life remaining, we can expect that boiler to be replaced in ve
years by a new boiler with combustion efciency greater than 80%, as required by the Federal equipment
standards. As a result, the energy savings for a boiler retrot measure would diminish in ve years because the
energy use for the reference building would have decreased anyway.
Fuel price escalation rates may be applied to future energy savings cash ows. However, fuel prices are very
volatile, and it is very difcult to predict energy prices with any degree of accuracy. The most authoritative
reference for fuel price projections is the EIA, which publishes the Annual Energy Outlook (http://www.eia.gov/
forecasts/aeo/). Fuel price escalation rates should not include the effect of ination. All values in the cash ow
analysis should be in base year dollars.
In the example retail building analysis, EnergyPlus software was used to calculate energy savings for each
relevant measure and for each package of measures presented in this guide. The actual 201
1 electricity price
schedules were used for each of the ve cities, including appropriate time-of-day and seasonal adjustments, and
rate changes associated with peak demand reductions. Natural gas prices were based on either current utility
schedules or state average gas prices published by DOE (http://www.eia.gov/dnav/ng/ng_pri_sum_dcu_nus_m.
htm). Fuel price escalation rates were taken from the EIA Annual Energy Outlook 2011 (http://www.eia.gov/
forecasts/aeo/pdf/0383(2011).pdf). A more comprehensive overview of the modeling approach is presented in
Appendix 10.1.
Table 10.3. Energy Cost Rates for Reference Cities
Criteria
Miami
(Hot & Humid)
Las Vegas
(Hot & Dry)
Seattle
(Marine)
Chicago
(Cold)
Duluth
(Very Cold)
Marginal Electricity Rate ($/kWh) $0.0539 $0.0673 $0.0650 $0.0840 $0.0831
Demand Charge, Summer ($/kW) $11.05 $19.23 $5.76 $5.75 $4.87
Demand Charge, Winter ($/kW) $11.05 $0.50 $8.65 $5.75 $4.87
Duration of Summer Demand Rate (months) 6 4 6 4 6
Gas Rate ($/therm) $1.0240 $0.9510 $0.9835 $0.8650 $0.7774
Energy Tax Rate 8.0% 8.0% 8.5% 8.0% 6.0%
Additional O&M Cost (C
om
)
The effect of retrot measures on O&M costs can be either positive or negative. Older equipment often breaks
down or performs poorly, forcing maintenance personnel to invest a substantial amount of time into keeping
it performing at an adequate level. In most cases, new energy efcient equipment is more reliable, reducing
the O&M costs associated with the equipment. But some newer equipment may be more complex, and require
additional interaction from O&M personnel to keep it running properly.
Many of the O&M measures discussed in this guide include heightened attention to activities such as regularly
cleaning coils, replacing lters, calibrating sensors, and adjusting control settings. Ongoing costs associated with
commissioning are almost always worthwhile from an energy savings an equipment lifetime perspective, but
these costs should be quantied and included in the cash ow analysis in order to create a clear picture of the
overall cost-effectiveness of a building improvement project.

10 APPENDIX
124
Retail Buildings
Advanced Energy Retrofit Guides
A maintenance escalation rate may be applied to O&M costs in future years. In general, this rate is not much
higher than the ination rate, and the effect is small compared to the uncertainty in projecting future O&M costs.
We do not recommend using a maintenance escalation rate unless O&M costs are very well dened.
For simplicity, we include what is sometimes referred to as repair and replacement (R&R) costs in the O&M
category. Replacements in this category should be limited to components or elements of each measure, not
replacement of the entire measure.
For the example building analysis, professional cost estimators provided the relative O&M costs for each measure. In
some cases, there was no basis for assuming any change to O&M costs, and a value of zero was used.
Additional M&V Cost (C
mv
)
M&V costs are usually attributed to the project as a whole, but there may be times when the performance of
a particular piece of equipment will be tested or tracked very closely. In such cases it may be appropriate to
attribute certain M&V costs to the measure itself, to provide a more complete accounting of costs and benets for
that measure.
For the example analysis, we assigned M&V costs to packages of measures as a whole. Consequently, we used a
value of zero for C
mv
when evaluating the NPV of individual measures. For the standard retrot and deep retrot
packages, we assumed that annual M&V costs are equal to 10% of the estimated annual energy cost savings.
Replacement Cost for Measure (C
repl,eem
)
It should be assumed that each measure is replaced at the end of its useful life with a system of the same design
and efciency. In some cases, replacement cost may be much less than the original installation cost because the
infrastructure is already in place and there are records of specic components, vendors, and procedures that were
used the rst time. In other cases there may be very little difference in cost.
The useful life can be estimated for most common measures using the table of service life estimates in
Chapter 37 of the ASHRAE HVAC Applications Handbook (ASHRAE, 2011). The list is primarily limited to
HVAC measures. Estimated useful life estimates for other measures, including envelope, domestic hot water,
lighting, and refrigeration, can be found in life cycle cost analysis guidance published by the State of W
ashington
General Administration (www.ga.wa.gov/eas/elcca/simulation.html). Recommended replacement schedules for
most building components assemblies can also be found in the R.S. Means Facilities Maintenance & Repair Cost
Data handbook (R.S. Means 2009).
Professional cost estimators provided the values of C
repl,eem
used in our example analysis, which assumes a 20 year
analysis period. Most energy efciency measures that involve mechanical or electrical equipment are replaced at
least once during that time period. Envelope measures usually last longer.
Replacement Cost for Reference Case (C
repl,ref
)
In order to correctly evaluate net cash ows associated with a measure, a realistic reference case must be
developed for comparison. This reference case must include the equipment replacements and upgrades that
would have occurred if the measure was never implemented. In some cases, equipment would be replaced with
similar equipment that has the same efciency. In other cases, the worst-performing new equipment may be a
signicant upgrade over the existing equipment, due to improvements in technology and updates to energy codes
with higher efciency requirements.
Typically, existing equipment is replaced at the end of its useful life. In most scenarios, remaining useful life can
be calculated by subtracting equipment age from the useful life estimated.

10 APPENDIX
125
Retail Buildings
Advanced Energy Retrofit Guides
In some cases, equipment may be considered at the end of its useful life because it is broken beyond repair, or
there are building modications underway for non-energy reasons that necessitate equipment replacement. In
such cases, the remaining useful life is zero, and equipment replacement for the reference case happens during
the rst year of the project analysis period. This allows the consolidation of C
repl,ref
, C
pur
, and C
inst
into a single
incremental cost for improved equipment over a newer version of the current equipment (or the worst equipment
allowed by code). If the replacement equipment lifetimes are the same for the measure and the reference case,
C
repl,ref
and C
repl,eem
can also be combined into a single incremental cost for the improved equipment. Otherwise
cash ows for equipment replacement must be tracked separately for the two scenarios and assigned to the
appropriate year.
For our analysis of individual retrot measures and for the standard retrot packages, we assumed that all
equipment is 50% through its useful life. We used the State of Washington service life estimates to determine
the original useful life for existing equipment. For the deep retrot packages analyses, we assumed that any
equipment replaced as part of the packages is at the end of its useful life.
Tax Deductions for Depreciation (C
depr,eem,t
and C
depr,ref,t
)
The vast majority of energy efciency measures discussed in this guide are capital expenditures that can be
depreciated over a number of years for tax purposes, assuming the building owner is a for-prot entity
. The
depreciable basis for such measures includes both the purchase cost and the installation cost of the equipment.
The use of the Modied Accelerated Cost Recovery System (MACRS) is required by the Internal Revenue
Service for most categories of equipment. Certain measures may be treated as operating expenses and deducted
immediately, including O&M measures and equipment with a useful life of less than one year.
If the project does not include special tax incentives, such as the 179D Federal Energy
Tax Deduction, these cash
ows largely cancel out and are usually not worth the effort to analyze in detail. The net present value can be
reduced by the corporate tax rate (usually 35%) to approximate the overall effect of taxes on the investment.
Salvage Value of Measure and Reference Equipment at
the End of the Analysis Period (C
salv,eem,20
and C
salv,ref,20
)
At the end of the 20-year analysis period, both the measure and the equipment in the reference building are likely
to have some remaining salvage value. In order to produce a fair estimate of net present value, the 20 year value
of both the measure and reference equipment is calculated based on straight-line depreciation. The difference
between the depreciated values of the equipment at the end of the analysis period is included in the year 20 cash
ow. No capital loss or gain tax benets were included at the end of the analysis period.
Approach to Costing Measures
A key input to the cash ow analysis for each measure and recommended package was the estimated current
installation and equipment costs. This “costing” exercise was carried out through the following approach.
Measures were priced in January 2012 dollars. Each was priced as if they were to occur separately (except as
noted). The pricing was based on the Seattle metropolitan geographic region and then normalized to the other
reference cities (Miami, Las Vegas, Chicago, and Duluth) using the RS Means City Cost Indexes from the 2010
Edition of RS Means Building Construction Cost Data.

10 APPENDIX
126
Retail Buildings
Advanced Energy Retrofit Guides
Pricing was based on outside contractors performing the work in a competitive bid environment at prevailing
or union wage, not via a service contract or physical plant staff. In order to account for hoisting, demolition,
architectural repairs, on-site supervision and other potential soft costs, a 20% multiplier was added to the direct
work total for all measures. It was assumed that the work would be performed during normal working hours and
that the crews would have adequate access to the work zones in a manner that would allow normal work ow.
Any new equipment is assumed to t within the existing physical space allowed without structural or
architectural changes. Temporary systems, workarounds and shutdown impacts cannot be accurately quantied
without knowledge of the operations of each building and are excluded. Furthermore, any code, seismic or
re life safety upgrades that may be triggered by the type or valuation of the work of the measure are
excluded from this study.
10.5 O&M Measures
The following section includes a technical description and special considerations for each O&M measure
investigated in this guide.
O&M Measure Index
LIGHTING O&M MEASURES
L1. Calibrate Exterior Lighting Photocells ................................................................................................................ 127
E1. Reduce Envelope Leakage ..................................................................................................................................... 127
E2. Replace Worn Out Weather Stripping at Exterior Doors ............................................................................ 127
H1. Clean Cooling and Heating Coils, and Comb Heat Exchanger Fins ..........................................................128
H2. Revise Air Filtration System ................................................................................................................................. 128
H3. Add Equipment Lockouts Based On Outside Air Temperature .................................................................128
H4. Reprogram HVAC Timeclocks to Minimize Runtime .....................................................................................129
H5. Optimize Outdoor Air Damper Control ............................................................................................................129
H6. Repair Airside Economizer ................................................................................................................................... 129
H7. Implement a Night Purge Cycle...........................................................................................................................130
H8. Correct Refrigerant Charge ..................................................................................................................................130
H9. Increase Deadband Between Heating and Cooling Setpoints ................................................................... 130
SERVICE HOT WATER O&M MEASURES
S1. Replace Plumbing Fixture Faucets With Low Flow Faucets With
Sensor Control
............................................................................................................................................................131

10 APPENDIX
127
Retail Buildings
Advanced Energy Retrofit Guides
LIGHTING O&M MEASURES
L1. Calibrate Exterior Lighting Photocells
Technical Description
Exterior lighting typically only needs to operate during the night. However, lights that are manually switched
can accidentally be left on, and lights that operate based on a timeclock do not account for varying sunrise and
sunset times. Photocell lighting control tailors the lighting operating schedule to the specic needs of the area by
operating the lighting only when needed – at night (Wulnghoff, 1999).
Photocells that are out of calibration could be causing energy waste or unsafe conditions. If the lights are
operating beyond nighttime hours, when they don’t need to be operating, energy is being wasted. If the lights
are not operating enough during nighttime hours, this could result in unsafe conditions due to underlit spaces. T
o
maintain proper operation, the photocells should be cleaned and calibrated periodically.
Measure Special Considerations
When calibrating the photocells, make sure that they are mounted in representative locations, out of direct
sunlight and away from the effect of other light sources.
BUILDING ENVELOPE O&M MEASURES
E1. Reduce Envelope Leakage
Technical Description
Air leakage through the building envelope most often occurs where building envelope elements are connected
together. Leakage is typically a result of either improper design or construction, lack of maintenance, or normal
degradation over the life of a building. (Wulnghoff 1999) Envelope leakage is most pronounced when the
HVAC system is off, i.e., when the building is not mechanically pressurized. Signicant nighttime air leakage
causes the HVAC systems to operate harder upon morning start-up, to bring the building back to temperature.
Energy savings can be achieved by identifying signicant air leaks in the building envelope and sealing them.
Specic methods of sealing will vary depending on the component(s) being sealed. In general, large gaps should
be sealed with structural material before applying caulk. Tools to help identify air leaks include as-built drawings
and an infrared camera.
Measure Special Considerations
For retail buildings, common areas of air leakage include softs, roof-to-wall joints, expansion joints, parapet
ashing, and roof penetrations (Wulnghoff, 1999).
Air leakage can affect occupant comfort, HVAC system performance, window and door performance, and
building energy usage.
E2. Replace Worn Out Weather Stripping at Exterior Doors
Technical Description
Weather stripping helps to reduce the amount of outside air inltration through the space between the door and
the frame. Over time, this weather stripping develops gaps due to normal wear and tear. By replacing worn
out weather stripping, energy savings can be realized due to reduced inltration and, thus, reduced load on the
building HVAC equipment (Wulnghoff, 1999).

10 APPENDIX
128
Retail Buildings
Advanced Energy Retrofit Guides
Measure Special Considerations
When selecting weather stripping, each of the four sides of a door must be considered. There are different types
of weather stripping for different types of door/frame combinations.
HVAC O&M MEASURES
H1. Clean Cooling and Heating Coils, and Comb Heat Exchanger Fins
Technical Description
The efciency of HVAC components such as evaporator and condenser heat exchangers eventually degrades
as the coils are blocked by debris, corrosion or damage to heat exchanger ns. Blocked coils reduce the overall
system efciency by restricting both heat transfer and air ow. Removing the ow restrictions by periodically
cleaning the coils and straightening (combing) damaged heat exchanger ns will restore the system efciencies
to normal (Wulnghoff, 1999).
Measure Special Considerations
This measure is relatively simple to implement and should require minimal costs and time investments if the
applicable coils are relatively accessible. This work could be included in a facility’s preventive maintenance
tasks, and done on an annual basis. Otherwise, the coils will likely return to their blocked state within a year
after they are cleaned.
In addition to increased cooling and heating efciency, supply fan efciency may increase with this measure
when associated fans are equipped with VFDs. The measure would allow the fans to operate at a lower speed to
maintain the desired airow.
H2. Revise Air Filtration System
Technical Description
Packaged RTUs should include some sort of ltration for cleaning the air before it is supplied to the zones. Filters
can improve the overall air quality and also protect the HVAC equipment by reducing particle build up on the
internal equipment. Filters are continuing to improve and there are now more efcient versions that provide the
same ltration as standard lters, but at a reduced pressure drop. When VFDs are present, the reduced pressure
drop should allow the system to operate at a lower speed.
Measure Special Considerations
For simplicity, many facilities change their lters on a routine schedule, e.g., every six months, instead of
monitoring pressure drop across the lters and changing them when the pressure drop reaches a certain level.
With this scheduled approach, it’s important to check the pressure drop at the time of change out. If it’s at or
above the manufacturer’s recommended maximum pressure drop, it may be worth changing the lters more
frequently to maintain lter performance and realize energy savings. If it’s well below the manufacturer’s
recommended maximum pressure, it may be worth leaving them in longer to save on lter replacement costs
(material and labor) (Taylor, 2007).
H3. Add Equipment Lockouts Based on Outside Air Temperature
Technical Description
The heating and cooling sections of packaged RTUs typically operate in sequence, without overlap, to maintain
comfort conditions in the space. For these systems, heating is typically not required at warm outside air
conditions (e.g., above 65°F), and DX cooling is typically not required at cold outside air conditions (e.g.,

10 APPENDIX
129
Retail Buildings
Advanced Energy Retrofit Guides
below 50°F). Adding outside air temperature-based lockouts of the heating and cooling sections gives increased
condence that these sections remain off when they should be off.
Measure Special Considerations
Adding outside air temperature-based lockouts represents another layer of controls complexity for RTUs. It’s
important to consult with the rooftop manufacturer for the proper method of adding lockouts to the DX cooling
and gas heating sections.
H4. Reprogram HVAC Timeclocks to Minimize Runtime
Technical Description
The maximum energy savings related to an HVAC system can be achieved by shutting the system off when not
in use, to minimize run time. While equipment scheduling is relatively simple to implement, reducing excessive
runtime is one of the most common opportunities implemented as part of an EBCx process (Efnger, 2009).
This
measure adjusts the HVAC operating schedule to more closely match the occupancy patterns of the building.
Measure Special Considerations
None.
H5. Optimize Outdoor Air Damper Control
Technical Description
Outdoor air dampers are open during HVAC unit operation to provide ventilation air to the space, and to provide
economizer cooling when conditions allow. These dampers should close when the units are turned off and when
the units operate during unoccupied (morning warm-up/cool-down) mode. If they remain open, they increase the
energy use of the system through increased ventilation-related heating and cooling loads.
Measure Special Considerations
Some RTUs may not allow for a separate operating & unoccupied (morning warm-up/cool-down) mode. Even
with these units, it’s benecial to at least close the outside air dampers when the units are off, to minimize
inltration through the units and into the space.
H6. Repair Airside Economizer
Technical Description
An airside economizer cycle utilizes outside air for cooling a facility when conditions are right – namely, when
the outside conditions are cooler than inside conditions. Economizer cycles reduce the amount of mechanical
cooling energy necessary for cooling a facility. For RTUs, the economizer cycle operates as the rst stage of
cooling if outside conditions are cool enough. Some economizer systems can operate in “integrated economizer”
mode, meaning that mechanical cooling is allowed even if the outside air dampers are open 100%.
Airside economizer dampers are prone to failure, as often times the only result of their failure is higher-than-
necessary energy bills. They can fail due to lack of maintenance, failed control components, or improper control
sequences. A study found that 64% of installed RTUs have failed economizers. (Jacobs, 2003) Restoring the
proper operation of economizer dampers can result in signicant energy savings.

10 APPENDIX
130
Retail Buildings
Advanced Energy Retrofit Guides
Measure Special Considerations
To maintain the energy benets associated with airside economizer, periodic functional testing of the dampers
can be performed to verify that the dampers are operating correctly, and that leakage is minimal when the
dampers are closed. While many economizer cycle systems are temperature-based, some are based on enthalpy,
especially for facilities located in more humid environments.
H7. Implement a Night Purge Cycle
Technical Description
A night purge cycle is a method of cooling the building at night using 100% outside air (no mechanical cooling),
to pre-cool the building for the next day. The night purge cycle typically compares outside air temperature
to average indoor temperature, and operates for a couple of hours just before the occupied period when the
conditions are benecial.
In addition to saving mechanical cooling energy, night purge cycles can also reduce the building’s peak demand,
which may be desirable in areas that have high electric peak demand charges.
Measure Special Considerations
A night purge strategy is only effective for buildings with high thermal mass that are unoccupied at night, in
climates with warm daytime temperatures and cold nighttime temperatures. The night purge cycle operates only
during this narrow set of outside air conditions. It’s most effective in dry climates, such as the Southwest.
H8. Correct Refrigerant Charge
Technical Description
Data from 74 commercial RTUs in California have shown that nearly half of the systems are operating with an
incorrect refrigerant charge (Jacobs, 2003). Improperly charged units can negatively impact the unit efciency by
as much as 20%. This measure involves restoring the refrigerant charge to the recommended level.
Measure Special Considerations
Check for any leaks in the system and repair as part of this measure, otherwise the benets from correcting the
refrigerant charge will not persist for very long.
Improper refrigerant charge may increase cooling energy consumption by as much as 5-11% (NBI, 2004).
H9. Increase Deadband Between Heating and Cooling Setpoints
Technical Description
Zone level setpoints can have a strong impact on the energy consumption due to space conditioning, especially
when the space is served by packaged, or unitary equipment. For systems with multiple HVAC units serving a
common space, such as a retail building with multiple RTUs, it’s important to widen the deadband to a point that
will minimize simultaneous heating and cooling between the units. If the deadband is zero with a multiple HVAC
unit scenario, the units may ‘ght’ each other – some in heating, some in cooling – resulting in energy waste.
Systems with zero deadband use more energy than systems with a wider deadband, through increased heating and
cooling loads.

10 APPENDIX
131
Retail Buildings
Advanced Energy Retrofit Guides
Measure Special Considerations
Most thermostats will accommodate separate heating and cooling setpoints. If an existing installation has a zero
deadband thermostat, it may need to be replaced to widen the deadband.
Occupant comfort needs to be maintained with any zone control strategy (ASHRAE, 2004).
SERVICE HOT WATER O&M MEASURES
S1. Replace Plumbing Fixture Faucets with Low Flow Faucets with Sensor Control
Technical Description
Over the last thirty years, federal regulations have progressively reduced the allowable ow rate through faucets,
including lavatories and sinks, for new construction. New faucets are able to deliver the same performance as
older faucets, at lower ow rates. Besides saving water consumption, use of low ow faucets can also reduce
water heater energy consumption due to lower load on the water heating system. Many faucets are available with
motion sensor control, which reduces waste by delivering water only when needed (Wulnghoff, 1999).
Measure Special Considerations
None.
10.6 Retrofit Measures
The following section includes a technical description, special considerations, energy savings results, and
nancial analysis results for each retrot measure investigated in this guide.
The costs and savings analysis of the following retrot measures are based on an assumed equipment condition
in the reference building. Each measure was analyzed independently based on the assumption that the equipment
was replaced or enhanced before the end of its useful life in order to save energy by installing more efcient
equipment.
As such, many of the individual Net Present Value (NPV) results are negative. However, a negative NPV for
an individual measure does not necessarily indicate a lack of cost-effectiveness for all situations. Dif
ferences
between the reference building used to model the energy savings for this guide and actual building’s equipment
types, labor rates, nancial assumptions such as a specic discount rate, availability of nancial incentives and
synergies between individual measures may produce signicantly different results than those reported here.
Identifying potential synergies between measures or processes can improve the cost-effectiveness of a project.
For example, many of the low cost O&M measures identied through an EBCx process may offset the
installation of a less cost-effective retrot or package of retrots, while still maintaining a positive NPV for the
entire project and realizing signicant energy savings.

10 APPENDIX
132
Retail Buildings
Advanced Energy Retrofit Guides
Retrofit Measure Index
LIGHTING RETROFIT MEASURES
L2. Install Occupancy Sensors to Control Interior Lighting ............................................................................... 133
L3. Add Daylight Harvesting .......................................................................................................................................134
L4. Recircuit and Schedule Lighting System by End-use ................................................................................. 135
L5 - L7. Retrofit Interior Fixtures to Reduce Lighting Power Density ...........................................................136
L8. Install Skylights and Daylight Harvesting ........................................................................................................139
L9. Retrofit Exterior Fixtures to Reduce Lighting Power Density, and Add
Exterior Lighting Control .......................................................................................................................................141
PLUG AND PROCESS LOADS RETROFIT MEASURES
P1. Purchase Energy Ecient Oce and Sale Equipment .................................................................................142
P2. Add Advanced on/o Control of Common Plug Load Equipment .......................................................... 143
BUILDING ENVELOPE RETROFIT MEASURES
E3. Replace Windows and Frames ..........................................................................................................................144
E4. Install High R-value Roll-up Receiving Doors ................................................................................................145
E5. Install Cool Roof ......................................................................................................................................................146
E6. Add Roof Insulation ...............................................................................................................................................147
E7. Add Wall Insulation ................................................................................................................................................. 148
E8. Add Overhangs to Windows ...............................................................................................................................149
HVAC RETROFIT MEASURES
H10. Adjust Airside Economizer Damper Control ................................................................................................151
H11. Add Demand-controlled Ventilation ................................................................................................................ 151
H12. Replace RTUs with Higher Eciency Units .................................................................................................. 152
H13. Replace RTUs with Units that use Evaporative Cooling ........................................................................... 154
H14. Replace RTUs with High Eciency VAV Units ............................................................................................ 155
H15. Replace HVAC System with a Dedicated Outdoor Air System ...............................................................156
H16. Replace RTUs with Air-to-Air Heat Pumps ..................................................................................................158
H17. Replace HVAC System with Displacement Ventilation System .............................................................. 158
H18. Remove Heat from Front Entry .......................................................................................................................159
SERVICE HOT WATER RETROFIT MEASURES
S2. Increase Eciency of Service Hot Water System .........................................................................................160
OTHER RETROFIT MEASURES
O1. Retrofit Electric Transformers with Higher Eciency Models ................................................................... 162

10 APPENDIX
133
Retail Buildings
Advanced Energy Retrofit Guides
LIGHTING RETROFIT MEASURES
L2. Install Occupancy Sensors to Control Interior Lighting
Technical Description
Since lighting is typically required only when people are present, xed lighting operating schedules may use
more energy than necessary in zones with intermittent occupancy. Installing occupancy sensors in applicable
zones can automatically match the lighting operation with occupancy.
This helps minimize run time and should
save energy when compared with xed operating schedules (Wulnghoff, 1999).
Measure Special Considerations
In retail buildings, occupancy sensors are most applicable to non-sales areas with intermittent occupancy.
Receiving areas, stock rooms, tting rooms and restrooms are usually the most suitable locations for placement
of occupancy sensors in a retail facility.
The most common occupancy sensor types are ultrasonic (motion detection) and passive infrared (heat
detection). Generally, ultrasonic sensors are more suited for larger areas, and passive infrared sensors are more
suited for smaller areas, within a 15 foot range. Some sensors use a combination of these two sensor types.
Technical Assumptions for Implementing Measure in Reference Building
In the reference building, the lighting circuits for all zones follow the same operating schedule. This measure is
applied to the back space of the building which includes approximately 4,000 ft
2
of intermittently occupied area.
Energy Savings Results
Climate Zone
Electricity
Savings
(annual kWh)
Electric Demand
Savings
(peak kW)
Gas Savings
(annual therms)
Site EUI Savings
(kBtu/sf/yr)
Savings as % of
Total Site Usage
Hot & Humid
4,831 1 0 0.7 0.8%
Hot & Dry
4,625 1 (6) 0.6 0.7%
Marine
4,406 1 (8) 0.6 0.7%
Cold
4,458 1 (15) 0.6 0.6%
Very Cold
4,358 1 (29) 0.5 0.6%
Values presented in this table are total savings from the reference building baseline usage, not incremental savings from a
current code baseline.
Figure 10.2. Occupancy Sensor Control Schematic
Reprinted from Advanced Energy Design Guide for Small to Medium Oce Buildings. © 2011, ASHRAE

10 APPENDIX
134
Retail Buildings
Advanced Energy Retrofit Guides
The baseline assumes a lighting power density of 1.37 W/ft
2
in the back space and approximately 3,420 hours of
lighting operation.
The measure assumes the occupancy sensors create a 15% reduction on the lighting schedule in the back spaces only.
Financial Analysis Results
Climate
Zone
Equipment
Cost
Install
Cost
Total
Cost
Total Annual
Energy Cost
Savings
Annual
O&M Cost
Savings
Total
Annual
$ Savings
Simple
Payback
(years)
NPV
Hot & Humid $6,408 $2,475 $8,883 $420 $(217) $203 >20 $(7,297)
Hot & Dry $6,466 $3,548 $10,013 $392 $(255) $137 >20 $(9,174)
Marine $6,696 $3,264 $9,960 $404 $(250) $154 >20 $(8,939)
Cold $6,338 $4,290 $10,627 $455 $(277) $178 >20 $(9,423)
Very Cold $6,312 $3,573 $9,885 $421 $(252) $169 >20 $(8,722)
Values presented in this table are total costs and savings, not incremental costs and savings from a current code baseline.
Implementation costs are based on 11 occupancy sensors and the required wiring. Additional labor may be
required to re-circuit individual areas for occupancy control. Replacement cost of the measure includes the
sensors only. The Effective useful life (EUL) for this measure is estimated at 10 years (WSDGA, 2006).
L3. Add Daylight Harvesting
Technical Description
Interior lighting accounts for the largest percentage of electrical use and a signicant portion of overall energy
use in a typical retail building. Daylighting is becoming a popular strategy to generate savings in this energy
intensive end-use (Doty and Turner, 2009). This measure involves the installation of photocells to control the
electric lights near the existing windows at the front of the retail store. This measure also includes replacing the
lighting with dimmable ballasts, since dimmable ballasts are necessary to realize energy savings.
Measure Special Considerations
The use of daylighting in a retail facility will likely require some rewiring of the existing light circuits. The zones
next to the exterior windows need to be on an independent circuit to successfully benet from a daylighting
strategy. Dimmable ballasts are typically also required as part of a daylighting strategy.
The design of a daylight harvesting system should account for sensor location, sensor orientation, and number of
sensors. During installation, the light sensitivity settings need to be adjusted so that the desired lighting level is
maintained in the space. Also, the system should be periodically tested for proper functionality.
Technical Assumptions for Implementing Measure in Reference Building
The baseline system does not currently reduce electric light levels in the presence of daylight. The lights are
scheduled on from 7:00 AM to 9:00 PM on weekdays and 7:00 AM to 10:00 PM on weekends.
A daylighting strategy would affect only the lights nearest to the windows. In the reference building, these
windows are located at the front retail, the main entry and the point of sale.

10 APPENDIX
135
Retail Buildings
Advanced Energy Retrofit Guides
Energy Savings Results
Climate Zone
Electricity
Savings
(annual kWh)
Electric Demand
Savings
(peak kW)
Gas Savings
(annual therms)
Site EUI Savings
(kBtu/sf/yr)
Savings as % of
Total Site Usage
Hot & Humid 13,425 3 (0) 1.9 2.0%
Hot & Dry 13,989 3 (8) 1.9 2.2%
Marine 10,869 4 (24) 1.4 1.8%
Cold 7,811 2 (27) 1.0 1.1%
Very Cold 7,761 0 (54) 0.9 1.0%
Values presented in this table are total savings from the reference building baseline usage, not incremental savings from a
current code baseline.
Financial Analysis Results
Climate
Zone
Equipment
Cost
Install
Cost
Total
Cost
Total Annual
Energy Cost
Savings
Annual
O&M Cost
Savings
Total
Annual
$ Savings
Simple
Payback
(years)
NPV
Hot & Humid $2,681 $3,828 $6,510 $1,166 $(217) $949 7 $3,165
Hot & Dry $2,706 $5,487 $8,193 $1,240 $(255) $985 8 $1,860
Marine $2,802 $5,048 $7,850 $951 $(250) $701 11 $(674)
Cold $2,652 $6,635 $9,287 $752 $(277) $475 19 $(4,389)
Very Cold $2,641 $5,526 $8,167 $681 $(252) $429 19 $(3,745)
Values presented in this table are total costs and savings, not incremental costs and savings from a current code baseline.
Implementation costs are based on the required hardware, such as two photocell sensors, ten dimmable ballasts
and the re-wiring of perimeter lighting circuits. The EUL for this measure is estimated at 20 years (WSDGA, 2006).
L4. Recircuit and Schedule Lighting System by End-use
Technical Description
Large blocks of lights controlled by a single circuit may lead to excessive energy use if the various spaces within
a lighting zone do not follow the same occupancy schedule. Dividing the circuits into smaller end-uses that can
be controlled independently is an energy savings opportunity (Doty and Turner, 2009). In typical retail buildings,
lighting has at least two purposes: general lighting and accent lighting. General lighting may be required outside
of normal business hours for activities such as restocking and cleaning. Accent lighting is important during
normal business hours to highlight merchandise, but is not typically required after normal store hours.
Measure Special Considerations
Existing lights may not be zoned in a way that allows for easy implementation of this measure. In some cases,
additional labor may be required to re-circuit the lighting system to enhance controllability over desired zones or
end-uses.
Technical Assumptions for Implementing Measure in Reference Building
All lights in the baseline reference building follow the housekeeping schedule. Therefore, all lights are on from
7:00 AM to 9:00 PM on weekdays and 7:00 AM-10:00 PM on weekends. The weighted average lighting power
density for the retail space is a total of 2.31 W/ft
2
.
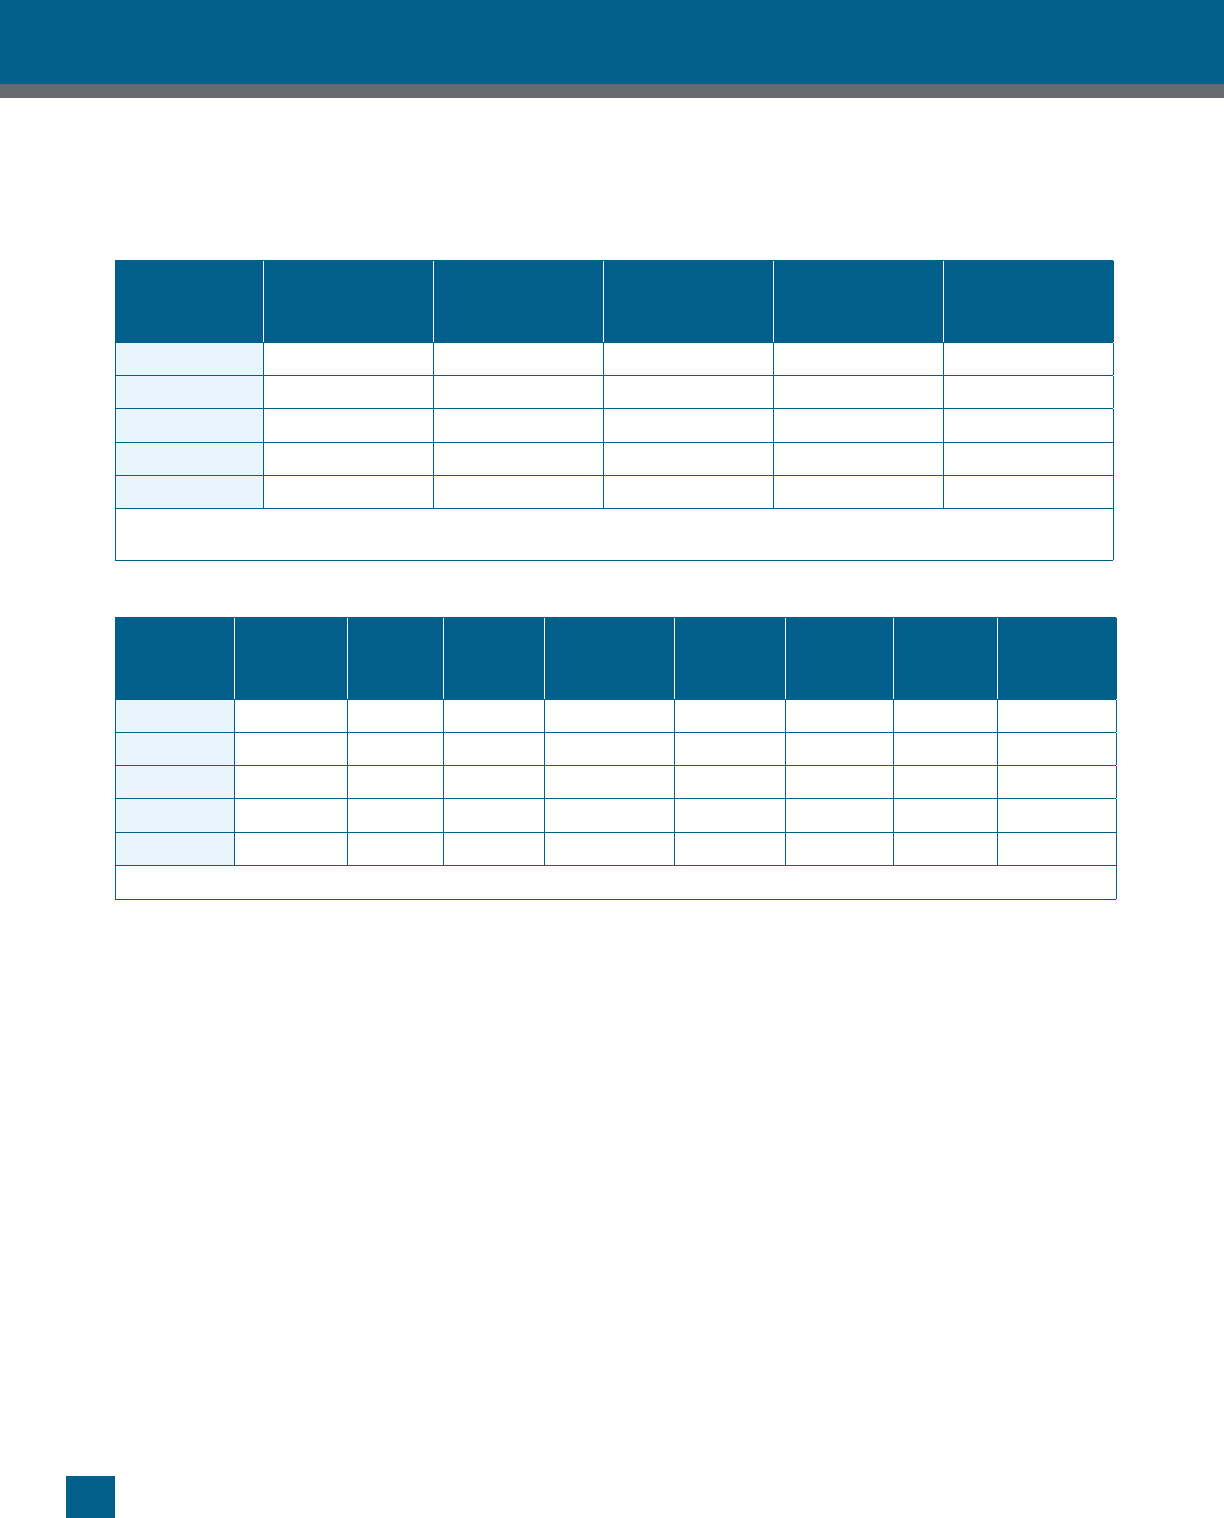
10 APPENDIX
136
Retail Buildings
Advanced Energy Retrofit Guides
The measure assumes the accent lighting can be separated from the main circuits and scheduled for only store
occupancy hours. Store open hours are 9:00 AM to 8:00 PM on weekdays and 9:00 AM to 8:00 PM on weekends.
Energy Savings Results
Climate Zone
Electricity
Savings
(annual kWh)
Electric Demand
Savings
(peak kW)
Gas Savings
(annual therms)
Site EUI Savings
(kBtu/sf/yr)
Savings as % of
Total Site Usage
Hot & Humid 40,658 0 0 5.6 6.1%
Hot & Dry 38,853 0 (80) 5.0 5.8%
Marine 37,469 0 (136) 4.6 6.0%
Cold 37,872 0 (165) 4.6 5.4%
Very Cold 37,256 0 (247) 4.1 4.8%
Values presented in this table are total savings from the reference building baseline usage, not incremental savings from a
current code baseline.
Financial Analysis Results
Climate
Zone
Equipment
Cost
Install
Cost
Total
Cost
Total Annual
Energy Cost
Savings
Annual
O&M Cost
Savings
Total
Annual
$ Savings
Simple
Payback
(years)
NPV
Hot & Humid $10,910 $6,436 $17,345 $2,604 $0 $2,604 7 $8,135
Hot & Dry $11,008 $9,224 $20,232 $2,323 $0 $2,323 9 $2,398
Marine $11,400 $8,486 $19,886 $2,616 $0 $2,616 8 $5,718
Cold $10,790 $11,153 $21,943 $3,338 $0 $3,338 7 $10,972
Very Cold $10,746 $9,289 $20,035 $3,087 $0 $3,087 6 $10,337
Values presented in this table are total costs and savings, not incremental costs and savings from a current code baseline.
Implementation costs are based on labor required to recongure lighting scheduling controls. It is assumed that
accent lighting is already on dedicated circuits from the overhead lighting and can be controlled separately. Three
separate circuits and schedules are included. The EUL of this measure is estimated at 7 years (WSDGA, 2006).
L5 - L7. Retrofit Interior Fixtures to Reduce Lighting Power Density
Technical Description
Interior lighting accounts for the largest percentage of electrical use and a signicant portion of overall energy
use in a typical retail building. Utilizing more energy efcient technologies and lighting strategies to reduce the
overall amount of energy devoted to lighting end-uses can result in signicant whole building energy savings.
Available lighting efciencies have steadily increased over the last few decades. Minimum efciencies prescribed
in building energy codes and federal regulations are frequently increased to keep pace with these improved
efciencies. This measure describes the benets of reducing the amount of energy used by the lighting end-use
by three levels of LPD reduction: 13%, 24% and 58%.
Measure Special Considerations
When evaluating lighting technologies, other factors should be considered in relation to cost besides energy
savings and rst cost. These include:

10 APPENDIX
137
Retail Buildings
Advanced Energy Retrofit Guides
u Human productivity. The new lights should provide at least the same level of quality as the existing lights.
u Lamp replacement frequency and costs, including labor costs.
A lighting retrot requires lighting design to achieve appropriate illumination with minimal energy usage. The
design should evaluate the existing lighting system in terms of lighting orientation, layout, type, and control. It
should evaluate each activity area and xture individually, accommodate future changes in activities and space
layout, and stress visual quality. (Wulnghoff 1999)
An efcient lighting system consists of efcient lamps, xtures, control, and light path. All four of these should
be considered as part of lighting design for a retrot.
Technical Assumptions for Implementing Measure in Reference Building
The reference building baseline LPD is based on ASHRAE 90.1-1999. The total weighted LPD is 2.31 W/ft
2
,
which includes 2.49 W/ft
2
for retail areas and an additional 1.37 W/ft
2
for the back spaces. This guide presents
three lighting retrot measures, each with a different level of reduction of lighting power density (LPD):
L5. 13% LPD reduction: The weighted LPD is reduced to 2.0 W/ft
2
. The lower LPD was estimated by
replacing each lamp’s baseline efciency (lumens/Watt) with 2010 efciency levels. This measure attempts to
represent the savings from a basic ballast and lamp replacement.
L6. 24% LPD reduction: The weighted LPD is reduced to 1.76 W/ft
2
. The lower LPD was estimated using
2010 efciency levels as well as xture replacements. It was assumed that improved efcacies of the new
xture types allowed for a reduction in the total number of xtures compared to the baseline case. This
measure would likely require some additional design in order to appropriately place the new xtures to meet
the facility’s lighting requirements.
L7. 58% LPD reduction: The weighted LPD is reduced to 0.96 W/ft
2
. The lower LPD was estimated using
2010 efciency levels as well as advanced xture replacements. This measure builds upon the lighting
redesign described by the previous measure (24% LPD reduction). Greater efcacies of the new xtures
allow for a substantial reduction in the number of xtures when compared to the baseline case and a moderate
reduction when compared to the 24% LPD reduction. This measure also includes the replacement of 669
compact uorescent down-lights with 491 screw-in LED down-lights. Reducing the LPD by 58% may require
substantial planning and redesign to appropriately place the new high efciency xtures to meet the facility’s
lighting requirements.
Energy Savings Results
L5. 13% LPD Reduction
Climate Zone
Electricity
Savings
(annual kWh)
Electric Demand
Savings
(peak kW)
Gas Savings
(annual therms)
Site EUI Savings
(kBtu/sf/yr)
Savings as % of
Total Site Usage
Hot & Humid 46,258 9 0 6.4 6.9%
Hot & Dry 44,658 9 (32) 6.0 6.9%
Marine 42,750 9 (68) 5.6 7.3%
Cold 42,992 8 (98) 5.5 6.5%
Very Cold 42,181 9 (180) 5.1 5.9%
Values presented in this table are total savings from the reference building baseline usage, not incremental savings from a
current code baseline.

10 APPENDIX
138
Retail Buildings
Advanced Energy Retrofit Guides
L6. 24% LPD Reduction
Climate Zone
Electricity
Savings
(annual kWh)
Electric Demand
Savings
(peak kW)
Gas Savings
(annual therms)
Site EUI Savings
(kBtu/sf/yr)
Savings as % of
Total Site Usage
Hot & Humid 82,864 16 (1) 11.4 12.4%
Hot & Dry 79,897 17 (61) 10.8 12.4%
Marine 76,367 16 (128) 10.0 12.9%
Cold 76,914 15 (190) 9.9 11.6%
Very Cold 75,361 16 (346) 9.0 10.5%
Values presented in this table are total savings from the reference building baseline usage, not incremental savings from a
current code baseline.
L7. 58% LPD Reduction
Climate Zone
Electricity
Savings
(annual kWh)
Electric Demand
Savings
(peak kW)
Gas Savings
(annual therms)
Site EUI Savings
(kBtu/sf/yr)
Savings as % of
Total Site Usage
Hot & Humid 204,078 39 (3) 28.2 30.4%
Hot & Dry 196,214 41 (165) 26.4 30.3%
Marine 187,042 40 (362) 24.4 31.4%
Cold 188,792 39 (516) 24.0 28.2%
Very Cold 184,831 40 (992) 21.5 25.1%
Values presented in this table are total savings from the reference building baseline usage, not incremental savings from a
current code baseline.
A custom spreadsheet calculation was used to build up the building’s baseline and measure lighting power
density from individual xtures.
Financial Analysis Results
L5. 13% LPD Reduction
Climate
Zone
Equipment
Cost
Install
Cost
Total
Cost
Total Annual
Energy Cost
Savings
Annual
O&M Cost
Savings
Total
Annual
$ Savings
Simple
Payback
(years)
NPV
Hot & Humid $10,023 $25,471 $35,494 $3,999 $0 $3,999 9 $13,214
Hot & Dry $10,113 $36,506 $46,619 $3,784 $0 $3,784 13 $2,477
Marine $10,474 $33,587 $44,060 $3,932 $0 $3,932 12 $5,962
Cold $9,913 $44,141 $54,054 $4,427 $0 $4,427 13 $3,320
Very Cold $9,873 $36,763 $46,635 $4,147 $0 $4,147 12 $6,166
Values presented in this table are total costs and savings, not incremental costs and savings from a current code baseline.

10 APPENDIX
139
Retail Buildings
Advanced Energy Retrofit Guides
L6. 24% LPD Reduction
Climate
Zone
Equipment
Cost
Install
Cost
Total
Cost
Total Annual
Energy Cost
Savings
Annual
O&M Cost
Savings
Total
Annual
$ Savings
Simple
Payback
(years)
NPV
Hot & Humid $107,378 $51,232 $158,610 $7,161 $0 $7,161 >20 $(42,170)
Hot & Dry $108,343 $73,428 $181,771 $6,759 $0 $6,759 >20 $(63,184)
Marine $112,205 $67,556 $179,761 $7,012 $0 $7,012 >20 $(58,997)
Cold $106,198 $88,785 $194,982 $7,902 $0 $7,902 >20 $(61,027)
Very Cold $105,769 $73,944 $179,713 $7,387 $0 $7,387 >20 $(55,174)
Values presented in this table are total costs and savings, not incremental costs and savings from a current code baseline.
L7. 58% LPD Reduction
Climate
Zone
Equipment
Cost
Install
Cost
Total
Cost
Total Annual
Energy Cost
Savings
Annual
O&M Cost
Savings
Total
Annual
$ Savings
Simple
Payback
(years)
NPV
Hot & Humid $69,454 $35,916 $105,370 $17,654 $0 $17,654 6 $102,191
Hot & Dry $70,078 $51,477 $121,555 $17,150 $0 $17,150 7 $85,126
Marine $72,576 $47,360 $119,936 $17,113 $0 $17,113 7 $86,099
Cold $68,690 $62,243 $130,933 $19,330 $0 $19,330 7 $100,539
Very Cold $68,413 $51,839 $120,252 $17,992 $0 $17,992 7 $94,771
Values presented in this table are total costs and savings, not incremental costs and savings from a current code baseline.
Implementation costs are based on the level of retrot required to achieve the desired LPD reduction. The 13%
LPD reduction measure includes costs for the replacement of lamps and ballasts for slightly more than 200 linear
uorescents and nearly 1,000 CFL bulbs. The 24% LPD reduction includes costs for a general lighting redesign
which replaces the baseline equipment with over 300 efcient linear uorescent xtures and reduces the number
of CFL xtures to less than 700. The 58% LPD reduction measure includes a substantial redesign which replaces
the baseline equipment with approximately 150 linear uorescent xtures and nearly 500 screw-in LED bulbs in
existing downlight xtures.
The EUL is estimated at 12 years for measures that include only ballast and lamp replacements. For general
xture replacements, a 20 year EUL is assumed (WSDGA, 2006).
L8. Install Skylights and Daylight Harvesting
Technical Description
Daylighting is becoming a common strategy to generate savings in this energy intensive end-use (Doty and
Turner 2009). Daylighting is most applicable for perimeter zones with existing windows. Directing light to
interior spaces in an existing building not originally designed for this feature typically requires additional efforts.
Installing skylights is a possible strategy to direct natural daylight into interior zones so electric lighting levels
can be reduced.

10 APPENDIX
140
Retail Buildings
Advanced Energy Retrofit Guides
Measure Special Considerations
The design of a daylight harvesting system should account for sensor location, sensor orientation, and number
of sensors. During installation, the light sensitivity settings should be adjusted so that the desired lighting level
is maintained in the space. Also, the system should be tested for proper functionality. Dimmable ballasts are
typically also required as part of a daylighting strategy.
Technical Assumptions for Implementing Measure in Reference Building
The baseline reference building does not utilize daylighting strategies. There is no natural light present in the
interior retail area.
The retrot involves adding skylights over 3% of the gross roof area. T
wo light level sensors are installed - one
near the exterior wall and one between two skylights - to effectively measure the space light level and determine
the amount of electric lighting needed. Each sensor controls half the space. The lighting control can cycle
through three levels of electric lighting power output, and has the ability to turn off electric lights when sufcient
daylight is available.
Energy Savings Results
Climate Zone
Electricity
Savings
(annual kWh)
Electric Demand
Savings
(peak kW)
Gas Savings
(annual therms)
Site EUI Savings
(kBtu/sf/yr)
Savings as % of
Total Site Usage
Hot & Humid 133,303 3 (2) 18.4 19.9%
Hot & Dry 100,328 3 (70) 13.6 15.5%
Marine 91,086 10 (189) 11.8 15.2%
Cold 108,581 2 (398) 13.4 15.7%
Very Cold 104,411 (2) (789) 11.2 13.1%
Values presented in this table are total savings from the reference building baseline usage, not incremental savings from a
current code baseline.
Financial Analysis Results
Climate
Zone
Equipment
Cost
Install
Cost
Total
Cost
Total Annual
Energy Cost
Savings
Annual
O&M Cost
Savings
Total
Annual
$ Savings
Simple
Payback
(years)
NPV
Hot & Humid $29,456 $28,529 $57,985 $8,818 $217 $9,035 7 $26,151
Hot & Dry $29,721 $40,890 $70,610 $7,499 $255 $7,754 10 $(1,125)
Marine $30,780 $37,620 $68,400 $6,625 $250 $6,875 11 $(7,250)
Cold $29,132 $49,441 $78,573 $9,685 $277 $9,962 9 $12,914
Very Cold $29,014 $41,177 $70,192 $8,532 $252 $8,784 9 $10,210
Values presented in this table are total costs and savings, not incremental costs and savings from a current code baseline.

10 APPENDIX
141
Retail Buildings
Advanced Energy Retrofit Guides
Implementation costs are based on labor and materials required to install skylights in the existing ceiling.
Materials include the skylights, dimmable ballasts and the photocells. No ceiling or soft work is required and no
relocation of items in the ceiling or below the roof is required. The replacement cost at t
he end of useful life does
not include skylights. The EUL for this measure is estimated at 20 years (WSDGA, 2006).
L9. Retrofit Exterior Fixtures to Reduce Lighting Power Density, and Add Exterior Lighting Control
Technical Description
For retail buildings, exterior lighting typically consists of parking area, walkway, building façade lighting
and signage. This lighting is typically turned on at sunset and turned off at sunrise, based on photosensor or
astronomical timeclock control. Energy savings can be realized by lowering the exterior lighting level below
full load power during times when nobody is present. A high performance building standard (ASHRAE 189.1-
2009) recommends that exterior lighting power density be reduced by a minimum of 50% one hour after normal
business closing, and to turn off outdoor lighting within 30 minutes after sunrise.
Parking areas are traditionally lit with high-intensity discharge (HID) lighting xtures, typically metal halide or
high pressure sodium lights. Replacing these xtures with newer, more efcient technologies such as uorescent,
induction, or light-emitting diode (LED) xtures will yield energy savings. (PG&E 2009)
Measure Special Considerations
Overall lighting system efciency, xture life, light output depreciation, maintenance, environmental impact,
and controllability should all be considered when replacing lighting xtures. (DOE 2011) In addition to reducing
the lighting power density of parking area lighting, façade lighting should also be evaluated for LPD reduction
opportunities.
The exterior lighting system needs to be designed and operated in a manner to maintain minimum required
illumination levels in all affected spaces during both modes of operation (full power and reduced power). For
implementation of this measure, bi-level xtures are typically required to shut off some of the lamps in each
xture during lighting reduction periods. If bi-level xtures are not used and a portion of the xtures are shut off
instead, dark spots may result.
Lighting power should not be reduced until one hour after normal business closing (ASHRAE, 2009a).
Technical Assumptions for Implementing Measure in Reference Building
The reference building’s parking area is a surface lot, not a parking garage. In the baseline case, the exterior
lighting is assumed to be at 100% power whenever it is dark outside, as sensed by a photocell. The original
parking lot lights are metal halide HID lighting xtures, a mixture of metal halide and incandescent cans for
façade lighting and a neon store sign.
For the measure case, the exterior lighting is also photocell-controlled. However, at 9 pm on weekdays and 8
pm on weekends, all of the parking area lights except two lights are shut off for the remainder of the night, and
the signage, entrance, and loading dock lighting levels are reduced. This corresponds to one hour after normal
business closing. The measure also includes retrotting the original parking lighting with more efcient ceramic
metal halides, more efcient metal halide and compact uorescent façade lighting, and a LED sign.
In both the baseline and measure cases, the lights are turned off at sunrise.

10 APPENDIX
142
Retail Buildings
Advanced Energy Retrofit Guides
Energy Savings Results
Climate Zone
Electricity
Savings
(annual kWh)
Electric Demand
Savings
(peak kW)
Gas Savings
(annual therms)
Site EUI Savings
(kBtu/sf/yr)
Savings as % of
Total Site Usage
Hot & Humid 53,589 0 0 7.4 8.0%
Hot & Dry 52,822 0 0 7.3 8.4%
Marine 53,158 0 0 7.3 9.5%
Cold 52,992 0 0 7.3 8.6%
Very Cold 53,169 0 0 7.3 8.6%
Values presented in this table are total savings from the reference building baseline usage, not incremental savings from a
current code baseline.
Financial Analysis Results
Climate
Zone
Equipment
Cost
Install
Cost
Total
Cost
Total Annual
Energy Cost
Savings
Annual
O&M Cost
Savings
Total
Annual
$ Savings
Simple
Payback
(years)
NPV
Hot & Humid $10,619 $3,465 $14,084 $3,432 $0 $3,432 4 $21,975
Hot & Dry $10,714 $4,967 $15,681 $3,159 $0 $3,159 5 $17,723
Marine $11,096 $4,570 $15,666 $4,266 $0 $4,266 4 $28,983
Cold $10,502 $6,006 $16,508 $5,132 $0 $5,132 3 $36,973
Very Cold $10,460 $5,002 $15,462 $5,030 $0 $5,030 3 $36,898
Values presented in this table are total costs and savings, not incremental costs and savings from a current code baseline.
Implementation costs include replace of lamps and/or ballasts on 16 xtures and one exterior LED sign. Controls
are based on the lighting circuit, not at individual xtures. The EUL for this measure is estimated at 30 years for
the xtures, with bulb replacement every ten years. (U.S. Department of Energy, 2011). The EUL for the control
portion of this measure is estimated at seven years (WSDGA, 2006).
PLUG AND PROCESS LOADS RETROFIT MEASURES
P1. Purchase Energy Ecient Oce and Sale Equipment
Technical Description
Plug loads make up a relatively minor portion (<5%) of a retail facility’s overall electricity usage when compared
to other end-uses such as lighting and HVAC (U.S. Energy Information Administration, 2006). Though the
end-use is small, purchasing the most efcient technologies will provide some energy savings opportunities.
High efciency plug-load equipment that operates at reduced power consumption when not in use is available
from numerous manufacturers (ASHRAE 2008b). Energy Star labeling is a recognized means to identify these
efcient manufacturers.

10 APPENDIX
143
Retail Buildings
Advanced Energy Retrofit Guides
Cash registers, computers, monitors, printers, and copiers consume the majority of retail plug load consumption.
If possible, cash registers and point of sale devices with sleep mode capability should be used to reduce energy
consumption of these devises when not in use.
Measure Special Considerations
Most owners only consider replacing plug load appliances at the end of useful life. Replacing functioning
appliances for the sake of energy efciency may not be cost-effective.
Technical Assumptions for Implementing Measure in Reference Building
Since plug loads are a minor portion of retail energy use, detailed cost and savings analysis is not presented for
this measure. Initial simulations indicate savings on the order of several hundred dollars per year, which would
not likely cover the cost of replacing functioning plug load equipment before the end of useful life. This meas
ure is likely not cost-effective for most retail facilities unless the original equipment is near the end of its useful
life. It might be worth considering for retail facilities that have a large plug load end-use load.
P2. Add Advanced on/o Control of Common Plug Load Equipment
Technical Description
Plug loads make up a relatively minor portion (~10%) of a retail facility’s overall electricity usage. Many of the
main plug loads in a retail facility remain on even when not in use. T
echnologies are available to turn off these
plug loads at times when they’re not required. These technologies include:
u
Adding controls to turn off cash registers and point of sale devices when the store is closed.
u Adding computer power management software to optimize the energy performance of computers
u Rewiring electric circuits and implementing controls to shut off retail appliances such as printers and copy
machines based on sensed occupancy from motion sensors.
u
Using “smart” power strips that use personal occupancy sensors to turn off task lighting when spaces are
unoccupied
u
Adding VendingMiser, CoolMiser, and SnackMiser controls on vending machines
u Adding time switches to turn off water coolers and coffee makers
Reducing the power draw of plug loads saves energy directly, and may have a small impact on overall HVAC
system energy usage in a retail facility.
Measure Special Considerations
None
Technical Assumptions for Implementing Measure in Reference Building
In the reference building, common plug load equipment is assumed to be controlled manually by the occupants.
This includes cash registers, computers, monitors, printers, copy machines, vending machines, water coolers,
coffee makers, and possibly task lighting. Since the plug loads make up such a small portion of the overall utility
usage for the reference building, detailed cost-effectiveness analysis is not presented for this measure. Initial
simulations show energy savings of a couple hundred dollars per year. This measure might be worth considering
for retail facilities that have a large plug load end-use.

10 APPENDIX
144
Retail Buildings
Advanced Energy Retrofit Guides
BUILDING ENVELOPE RETROFIT MEASURES
E3. Replace Windows and Frames
Technical Description
Windows can account for a signicant portion of a building’s heat loss and heat gain. Replacing old, inefcient
window assemblies with newer ones that offer better thermal performance can reduce building energy usage. It
also can improve occupant comfort through reduced solar radiation heat gain and quality of view.
Factors to consider when evaluating existing window assemblies and selecting replacements include the number
of surfaces (panes), insulating properties of the frames, low-emissivity coatings, insulating ll gases, visible
light transmittance, infrared transmission, interactions with daylighting systems, color, and reective appearance
(Wulnghoff, 1999).
Measure Special Considerations
Installing high performance windows, along with other measures that reduce heat gain or losses through the
building envelope, could result in smaller sized HVAC systems when also pursuing a general HVAC replacement
measure, due to the lower resultant cooling and heating loads from window replacement. This measure is
typically not a standalone measure unless the existing windows are at the end of their useful life.
Windows with lower solar heat gain properties should reduce cooling loads but may incur an energy penalty with
increased heating loads. When evaluating window assembly options, the energy performance should be evaluated
on an annual basis, not just for one season.
Technical Assumptions for Implementing Measure in Reference Building
See Appendix 10.1 for detailed baseline building characteristics. The windows in the baseline retail building are
located only on the south wall only and consist of approximately 7% of the total exterior wall area.
Energy Savings Results
Climate Zone
Electricity
Savings
(annual kWh)
Electric Demand
Savings
(peak kW)
Gas Savings
(annual therms)
Site EUI Savings
(kBtu/sf/yr)
Savings as % of
Total Site Usage
Hot & Humid 3,069 1 0 0.4 0.5%
Hot & Dry 6,742 3 3 0.9 1.1%
Marine 3,197 2 117 0.9 1.1%
Cold 806 0 47 0.3 0.4%
Very Cold 69 0 175 0.7 0.8%
Values presented in this table are total savings from the reference building baseline usage, not incremental savings from a
current code baseline.
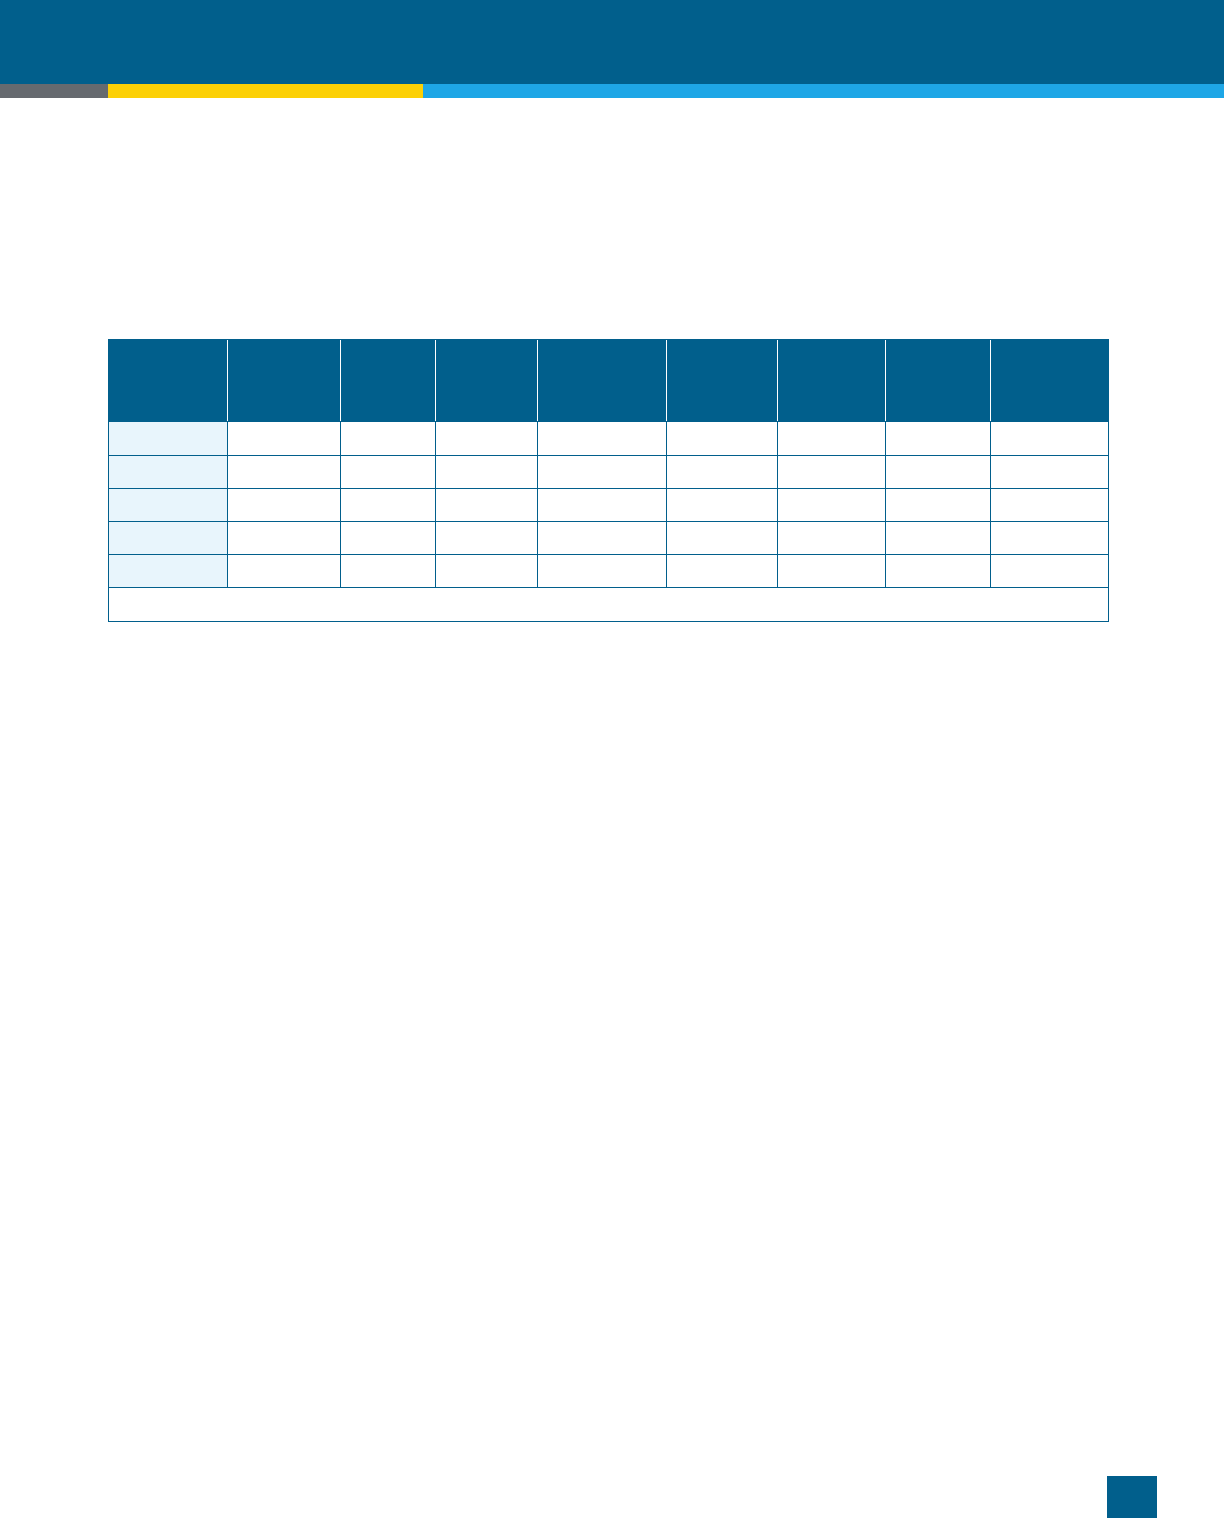
10 APPENDIX
145
Retail Buildings
Advanced Energy Retrofit Guides
Baseline windows in hot & humid, hot & dry, and marine climate zones are modeled as single paned with SHGC
of 0.54 and U-factor of 1.03 Btu/hr-ft-˚F. The cold and very cold climate zones have better performing baseline
windows, with SHGC of 0.41 and U-factor of 0.62 Btu/hr-ft-˚F. Measure windows are double-paned, low-e,
vinyl framed.
Financial Analysis Results
Climate
Zone
Equipment
Cost
Install
Cost
Total
Cost
Total Annual
Energy Cost
Savings
Annual
O&M Cost
Savings
Total
Annual
$ Savings
Simple
Payback
(years)
NPV
Hot & Humid $13,066 $12,655 $25,721 $272 $0 $272 >20 $(17,470)
Hot & Dry $13,184 $18,138 $31,321 $711 $0 $711 >20 $(17,577)
Marine $13,654 $16,687 $30,341 $459 $0 $459 >20 $(19,152)
Cold $12,923 $21,931 $34,853 $142 $0 $142 >20 $(25,820)
Very Cold $12,870 $18,265 $31,135 $143 $0 $143 >20 $(22,939)
Values presented in this table are total costs and savings, not incremental costs and savings from a current code baseline.
Implementation costs assume xed panes and no additional painting required due to the installation. The EUL of
this measure is estimated at 20 years.
E4. Install High R-value Roll-up Receiving Doors
Technical Description
Receiving doors in a retail facility may be a signicant source of inltration and heat loss while closed. When
open, it is nearly impossible for the HVAC system to keep up and maintain proper temperatures. Doors should
be selected to minimize inltration when closed, and these doors should remain closed as much as possible
(Wulnghoff, 1999). This measure describes retrotting the existing receiving doors with a high efciency model
that has better thermal performance, less inltration and a high speed roll up to minimize opening time.
Measure Special Considerations
None
Technical Assumptions for Implementing Measure in Reference Building
The baseline receiving door is modeled as an 8’ x 7’ double-skin, sectional tilt-up steel ribbed garage door
with 1-3/8 inch extruded polystyrene (ASHRAE, 2009b). The associated U-factor is 0.36 Btu/h-ft
2
-˚F
(R-value = 2.78).
The measure is a super-insulated (596 Series) door with 2” foamed in place polyurethane. The improved R-value
is 17.5.

10 APPENDIX
146
Retail Buildings
Advanced Energy Retrofit Guides
Energy Savings Results
Climate Zone
Electricity
Savings
(annual kWh)
Electric Demand
Savings
(peak kW)
Gas Savings
(annual therms)
Site EUI Savings
(kBtu/sf/yr)
Savings as % of
Total Site Usage
Hot & Humid 408 0 0 0.1 0.1%
Hot & Dry 456 0 5 0.1 0.1%
Marine 64 0 9 0.0 0.1%
Cold 419 0 20 0.1 0.2%
Very Cold 533 0 50 0.3 0.3%
Values presented in this table are total savings from the reference building baseline usage, not incremental savings from a
current code baseline.
Financial Analysis Results
Climate
Zone
Equipment
Cost
Install
Cost
Total Cost
Total Annual
Energy Cost
Savings
Annual
O&M Cost
Savings
Total
Annual
$ Savings
Simple
Payback
(years)
NPV
Hot & Humid $2,871 $1,502 $4,372 $40 $0 $40 >20 $(2,662)
Hot & Dry $2,897 $2,152 $5,049 $61 $0 $61 >20 $(2,938)
Marine $3,000 $1,980 $4,980 $16 $0 $16 >20 $(3,335)
Cold $2,839 $2,602 $5,442 $67 $0 $67 >20 $(3,141)
Very Cold $2,828 $2,167 $4,995 $94 $0 $94 >20 $(2,561)
Values presented in this table are total costs and savings, not incremental costs and savings from a current code baseline.
The cost of this measure assumes the new efcient door with a chain hoist. No additional structural changes are
assumed. The estimated EUL is 20 years.
E5. Install Cool Roof
Technical Description
Cool roofs are constructed with material that reects sunlight and emits thermal energy. In effect, the roof is
“cooler” than conventional roofs, which reduces the amount of heat transferred into the building. Reducing the
amount of heat transfer will also reduce the amount of mechanical cooling required in the building. This measure
involves replacing the existing roof membrane with a cool roof membrane.
Measure Special Considerations
Net annual energy cost savings tend to be greatest for buildings located in climates with long cooling seasons and
short heating seasons (Levinson, 2009). Cool roofs will likely incur a heating penalty, which may be signicant
in heating dominated climates.
Technical Assumptions for Implementing Measure in Reference Building
This measure was not modeled for the reference building, as the energy modeling software does not accurately
model this measure. This measure is likely more cost-effective in the hot and humid climate zone, which has a
long cooling season, than in the very cold climate zone, for example. For buildings located in warm climates,
this measure is worth consideration.

10 APPENDIX
147
Retail Buildings
Advanced Energy Retrofit Guides
E6. Add Roof Insulation
Technical Description
A roof represents a signicant source of heat loss in cold climates and heat gain in warm climates. For roong
systems that have insulation entirely above the deck surface, which is a common roof arrangement in commercial
retail buildings, it’s relatively simple to add insulation to reduce heat transfer into or out of the building
(Wulnghoff, 1999).
Measure Special Considerations
Adding insulation to the roof will likely require the removal existing covering. Most owners may consider this
measure when the existing roof is in need of replacement. Also, replacing the covering with reective coatings,
such as a cool roof, at the time of the insulation installation may also help to decrease overall cooling loads in
hot climates.
Existing roof penetrations and curbs need to be considered when increasing the insulation, to maintain the
minimum distance between the top of the membrane and the top of curbs.
Technical Assumptions for Implementing Measure in Reference Building
The baseline reference building is assumed to have roof insulation values equating to approximately R-10 for the
hot & humid and hot & dry climate zones, R-12 for the marine climate zone, R-14 for the cold climate zone and
R-17 for the very cold climate zone (Deru, 2011).
The measure assumes insulation levels equivalent to ASHRAE 189.1-2009 for non-residential facilities.
ASHRAE specied R-20 as the minimum insulation value.
Energy Savings Results
Climate Zone
Electricity
Savings
(annual kWh)
Electric Demand
Savings
(peak kW)
Gas Savings
(annual therms)
Site EUI Savings
(kBtu/sf/yr)
Savings as % of
Total Site Usage
Hot & Humid 24,003 9 2 3.3 3.6%
Hot & Dry 26,528 14 102 4.1 4.7%
Marine 10,578 7 188 2.2 2.9%
Cold 12,497 6 321 3.0 3.6%
Very Cold 6,597 3 446 2.7 3.2%
Values presented in this table are total savings from the reference building baseline usage, not incremental savings from a
current code baseline.
Financial Analysis Results
Climate
Zone
Equipment
Cost
Install
Cost
Total Cost
Total Annual
Energy Cost
Savings
Annual
O&M Cost
Savings
Total
Annual
$ Savings
Simple
Payback
(years)
NPV
Hot & Humid $86,128 $118,304 $204,432 $2,409 $0 $2,409 >20 $(129,326)
Hot & Dry $110,076 $195,645 $305,721 $3,068 $0 $3,068 >20 $(204,121)
Marine $114,000 $180,000 $294,000 $1,314 $0 $1,314 >20 $(212,763)
Cold $107,897 $236,562 $344,458 $1,735 $0 $1,735 >20 $(246,023)
Very Cold $124,428 $216,722 $341,150 $1,077 $0 $1,077 >20 $(251,940)
Values presented in this table are total costs and savings, not incremental costs and savings from a current code baseline.
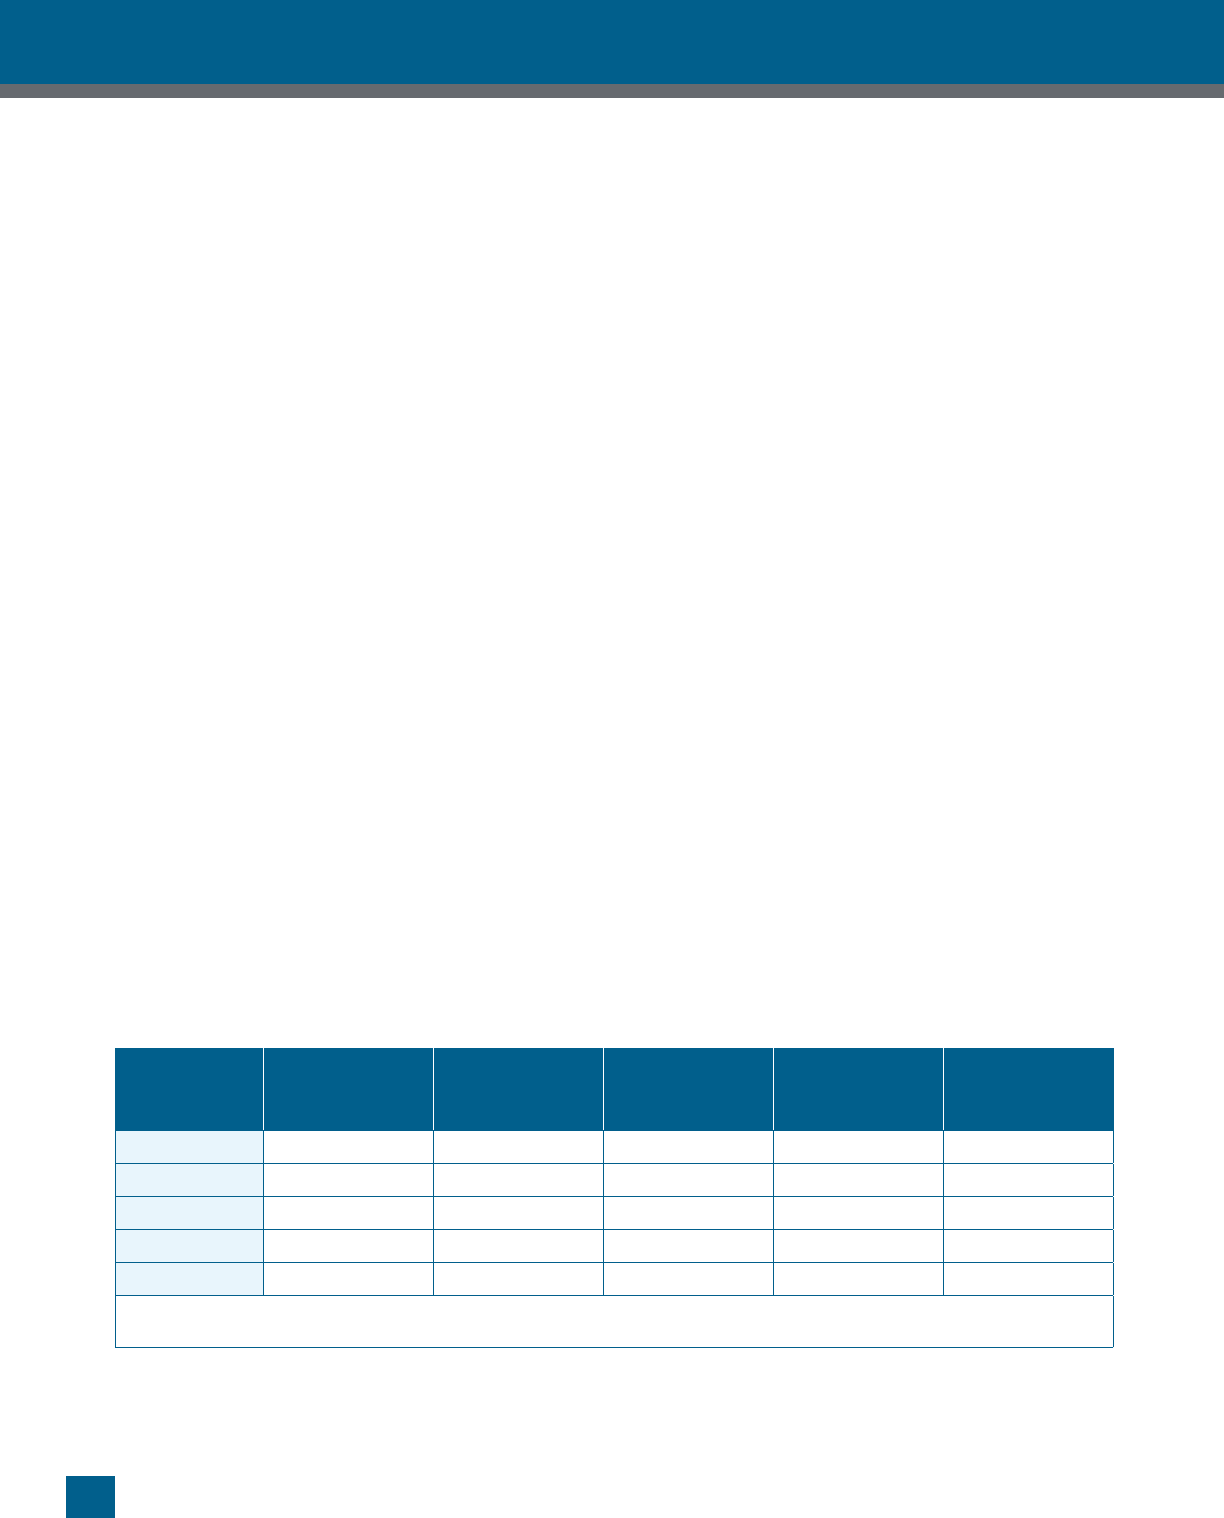
10 APPENDIX
148
Retail Buildings
Advanced Energy Retrofit Guides
Implementation costs assume roof drains must be raised and a new roong membrane is included. It’s assumed
that the existing HVAC system roof curbs are high enough to accommodate the additional insulation. This
measure is not cost-effective from an energy standpoint alone. Adding additional insulation as part of an existing
roof replacement project at the end of useful life will improve the cost-effectiveness. Incremental costs should be
considered in this situation. Evaluating the measure on an incremental basis would increase the NPV values. The
EUL of this measure is estimated at 20 years (WSDGA, 2006).
E7. Add Wall Insulation
Technical Description
The thermal energy gained or lost through walls via conduction accounts for a large percentage of conditioning
costs in a building. Adding additional insulation to an existing wall can reduce the amount of heat transfer.
The best time to install insulation is during initial construction. However, there are an increasing number of
options available to increase insulation for existing structures, especially when the building has large areas of
unobstructed wall space, such as the reference retail building.
Measure Special Considerations
To reap the maximum benets from adding wall insulation, it’s important to also take steps to minimize
inltration.
Heat is lost more easily through windows than walls, so buildings with a large percentage of glazing may not
see a signicant difference with additional insulation. It’s important to evaluate the wall assembly as a whole,
including opaque and translucent surfaces, to optimize its performance.
Technical Assumptions for Implementing Measure in Reference Building
The baseline reference building is a steel framed structure with wall insulation values equating to approximately
R-4.3 for the hot and humid climate zone, R-5.7 for hot and dry, R-6.4 for marine and cold and R-7.4 for very
cold (Deru, 2011).
The measure assumes insulation levels equivalent to ASHRAE 189.1 for non-residential facilities. ASHRAE
specied R-13 with an additional layer of continuous R-5 as the minimum insulation value.
Energy Savings Results
Climate Zone
Electricity
Savings
(annual kWh)
Electric Demand
Savings
(peak kW)
Gas Savings
(annual therms)
Site EUI Savings
(kBtu/sf/yr)
Savings as % of
Total Site Usage
Hot & Humid 19,781 7 2 2.7 3.0%
Hot & Dry 25,867 14 107 4.0 4.6%
Marine 7,564 5 222 1.9 2.5%
Cold 9,942 4 360 2.8 3.3%
Very Cold 7,417 3 659 3.7 4.3%
Values presented in this table are total savings from the reference building baseline usage, not incremental savings from a
current code baseline.

10 APPENDIX
149
Retail Buildings
Advanced Energy Retrofit Guides
Financial Analysis Results
Climate
Zone
Equipment
Cost
Install
Cost
Total Cost
Total Annual
Energy Cost
Savings
Annual
O&M Cost
Savings
Total
Annual
$ Savings
Simple
Payback
(years)
NPV
Hot & Humid $21,916 $21,226 $43,142 $1,892 $0 $1,892 >20 $(13,099)
Hot & Dry $22,113 $30,423 $52,535 $2,954 $0 $2,954 19 $(8,585)
Marine $22,901 $27,990 $50,891 $1,004 $0 $1,004 >20 $(27,181)
Cold $21,675 $36,785 $58,460 $1,464 $0 $1,464 >20 $(27,473)
Very Cold $21,587 $30,637 $52,224 $1,290 $0 $1,290 >20 $(25,146)
Values presented in this table are total costs and savings, not incremental costs and savings from a current code baseline.
Installation costs assume a drill and ll method at front of the retail spaces and rigid insulation with drywall
sheathing in back spaces. Incremental costs should be considered between the code minimum and advanced
standard for this measure. Evaluating the measure on an incremental basis would increase the NPV values.
The
EUL of this measure is estimated at 20 years (WSDGA, 2006).
E8. Add overhangs to windows
Technical Description
Exterior windows are often installed almost ush with the exterior wall surface, with no adjacent surfaces on the
exterior or interior surfaces to minimize solar heat gain and increase the depth of daylight penetration. In warm
climates, exterior overhangs installed near the windows help reduce both direct sun penetration and heat gain
from vertical glazing surfaces, thus reducing cooling loads of the building (ASHRAE, 2008b).
Specic shading methods include projecting horizontal shelves installed above the level of the windows on south
facing windows, xed louvers on the east, south and west windows, and external blinds.
Light shelves are horizontal surfaces installed on the interior face of windows to increase the depth of daylight
penetration. Typically they are installed on tall windows, with the shelves located a few feet down from the top
of the window and extending a few feet into the interior space. Using light shelves can increase the depth of
daylight penetration by 10 to 20 feet in a typical installation, increasing the energy efciency of the daylighting
system (Wulnghoff, 1999).
Figure 10.3. Fixed External Window Shading
Reprinted from Advanced Energy Design Guide for Small to Medium Oce Buildings. © 2011, ASHRAE

10 APPENDIX
150
Retail Buildings
Advanced Energy Retrofit Guides
Measure Special Considerations
Adding exterior shading devices or interior light shelves can have a signicant impact on the appearance of a
facility. They should integrate cleanly with the existing structure.
Design and selection considerations for exterior window shading include shading effectiveness, effect on view,
daylighting potential, passive heating potential, appearance, longevity, and method of attachment to the building.
Since shading effectiveness depends on the performance of the system at all sun positions, the system should be
designed based on the specic location and orientation of the facility (Wulnghof
f, 1999).
Light shelf systems utilize the light shelf, the window, and the ceiling to extend the zone of daylighting. External
shading devices are typically installed on the bottom portion of the window to minimize glare and solar heat
gain during sunny periods. Light shelves are only effective at reducing energy usage when installed as part of
a designed daylighting system that utilizes dimmable lighting ballasts to lower the lighting power draw during
sunny periods (Wulnghoff, 1999).
Technical Assumptions for Implementing Measure in Reference Building
The baseline reference building is assumed to not have any exterior shading devices or interior light shelves.
The measure assumes exterior shading devices and interior light shelves are installed on the south windows. For
maximum energy savings to be achieved with this measure, it should be implemented in tandem with the ‘Add
daylight harvesting’ measure.
Energy Savings Results
Climate Zone
Electricity
Savings
(annual kWh)
Electric Demand
Savings
(peak kW)
Gas Savings
(annual therms)
Site EUI Savings
(kBtu/sf/yr)
Savings as % of
Total Site Usage
Hot & Humid 3,108 0 0 0.4 0.5%
Hot & Dry 6,458 2 (1) 0.9 1.0%
Marine 5,869 3 66 1.1 1.3%
Cold 3,142 1 34 0.6 0.7%
Very Cold 1,972 1 (5) 0.3 0.3%
Values presented in this table are total savings from the reference building baseline usage, not incremental savings from a
current code baseline.
Financial Analysis Results
Climate
Zone
Equipment
Cost
Install
Cost
Total
Cost
Total Annual
Energy Cost
Savings
Annual
O&M Cost
Savings
Total
Annual
$ Savings
Simple
Payback
(years)
NPV
Hot & Humid $14,355 $2,639 $16,994 $286 $0 $286 >20 $(14,095)
Hot & Dry $14,484 $3,782 $18,266 $652 $0 $652 >20 $(11,664)
Marine $15,000 $3,480 $18,480 $678 $0 $678 >20 $(11,613)
Cold $14,197 $4,574 $18,770 $382 $0 $382 >20 $(14,902)
Very Cold $14,140 $3,809 $17,949 $209 $0 $209 >20 $(15,836)
Values presented in this table are total costs and savings, not incremental costs and savings from a current code baseline.

10 APPENDIX
151
Retail Buildings
Advanced Energy Retrofit Guides
Implementation costs assume that the storefront or building façade is sufcient to support the shading device
without supplemental steel framing. The EUL of this measure is estimated at 20 years.
HVAC RETROFIT MEASURES
H10. Adjust Airside Economizer Damper Control
Technical Description
Airside economizers are used to increase the amount of outside air drawn into a building when outside conditions
are cool and the system requires cooling. When operating correctly, they reduce the amount of energy required
for mechanical cooling. For most retail buildings, outdoor climate and indoor climate requirements are the
main factors in determining whether or not to use an airside economizer cycle, and which type of control to use.
Ongoing maintenance costs can also be a factor in choosing which type of control to use. In the hot and humid
climate zone, economizer cycles are typically not used since outside conditions are not cool enough for enough
hours to make their use cost-effective. For other climates, many economizer control options exist, including
single point dry bulb temperature (OA), differential dry bulb temperature (OA & RA), single point enthalpy
(OA), and differential enthalpy (OA & RA) (Wulnghoff, 1999). This measure consists of upgrading the
economizer controls for more energy efcient operation and reduced maintenance costs.
Measure Special Considerations
While enthalpy-based economizer control may be more energy efcient than temperature-based control,
especially in more humid climates, enthalpy sensors are often inaccurate due to calibration drift of the relative
humidity sensors, even in new sensors. It is often more cost-effective to use temperature-based economizer
control when sensor error and maintenance costs are factored in (Taylor
, 2010).
Technical Assumptions for Implementing Measure in Reference Building
The reference building is thirty years old. It is assumed that airside economizer capability and controls were
installed when the building was rst constructed, and that the type of control has not changed over the life of the
building.
Baseline: no economizer in the hot and humid climate zone. Economizer based on xed outside air temperature
(70°F setpoint) in the hot & dry and marine climate zones. Economizer based on xed outside air enthalpy
(24 Btu/lb setpoint) in the cold and very cold climate zones.
Measure: no economizer in the hot and humid climate zone. Integrated economizer based on differential dry bulb
temperature in all other cities. (ASHRAE, 2009; Taylor, 2010).
The modeling software showed minimal savings for this measure. Therefore, savings and cost values are not
shown in the guide. However, this measure is worth considering for actual buildings, as there may be savings
opportunities depending on the given situation.
H11. Add Demand-controlled Ventilation
Technical Description
Adequate ventilation air, or outside air, is required to maintain acceptable indoor air quality. Generally, the
greater number of people in a space, the greater the amount of ventilation air required. This ventilation air can
increase the loads on the HVAC system due to the energy required to heat, cool, humidify, and dehumidify the
outside air, depending on the outdoor conditions and the needs of the space (Wulnghoff, 1999).

10 APPENDIX
152
Retail Buildings
Advanced Energy Retrofit Guides
Most HVAC systems, especially older systems, are designed to deliver a constant amount of ventilation air during
occupied periods, regardless of how many people are in the space. Energy savings can be realized by controlling
the amount of ventilation air provided based on the ventilation needs of the space. For retail buildings, this is
typically accomplished by sensing the CO
2
concentration in the space, and adjusting the amount of ventilation air
accordingly between preset maximum and minimum values. When using this method, it’s important to consult
and consider ventilation rate standards such as ASHRAE 62.1 – Ventilation for Acceptable Indoor Air Quality.
This standard covers demand controlled ventilation strategies.
Demand-controlled ventilation is most cost-effective in buildings that have highly variable occupancies or high
minimum outside airow rates.
Measure Special Considerations
Calculating the necessary ventilation rate is usually easier than controlling the HVAC system to maintain that
ventilation rate. It’s not as great a challenge with constant air volume systems (compared to VAV systems),
but it’s still something to consider. With constant volume systems, even though the minimum outside airow
rate should not vary signicantly, it’s important to recognize that the percent that the outside air damper is
open probably does not correlate directly with the outside airow percentage, due to damper performance
characteristics.
With VAV systems that use a xed minimum outside air damper position, the outside airow rate will change
depending on the amount of system supply and return airow. Directly measuring the outside airow rate is the
preferred method of maintaining minimum airow rates with VAV systems, even though this requires regular
calibration of the outside airow sensors.
Energy recovery ventilators, which transfer energy between the exhaust/relief and outside air streams, can help
reduce energy usage. These systems are more cost-effective in extreme climates, with hot, humid summer and/or
cold winters.
Technical Assumptions for Implementing Measure in Reference Building
For the baseline reference building, the outside air damper is xed at minimum position of 15% during non-
economizer operation. The measure resets the outside air damper position based on sensed CO
2
concentration in
the space. When low levels of CO
2
are detected, the outside air minimum position automatically reduces from the
original 15% minimum position.
For the retail reference building, energy savings from DCV was negligible when modeled in EnergyPlus. The
minimal impact is likely due to the original assumption that the outside air minimum damper position is set at
15%, which is quite low. This measure will likely produce more favorable savings if the percentage of outside air
is high.
H12. Replace RTUs with Higher Eciency Units
Technical Description
This measure involves replacing the original packaged roof top units with more efcient models. Direct
expansion, furnace and motor efciencies of RTUs have steadily increased over the last few decades due to
improvements in manufacturing and technologies. Minimum efciencies prescribed in building energy codes and
federal regulations are frequently increased to keep pace with these improved efciencies.

10 APPENDIX
153
Retail Buildings
Advanced Energy Retrofit Guides
Measure Special Considerations
Replacing a functioning RTU with a more efcient model for energy savings alone is not usually cost-effective
(Wulnghoff, 1999). However, older units that require signicant maintenance costs, units that are near the end
of their useful lives, or units that operate continuously might be good candidates for replacement.
Technical Assumptions for Implementing Measure in Reference Building
The RTUs in the reference building are assumed to be the original units. These units are over 30 years old and are
likely nearing the end of their useful life.
The baseline system has an EER rating range from 9.0 to 10.1, a heating efciency of 78% and standard
efciency motors.
The measure replacement recommends a unit with an EER of 13, higher heating efciencies than the baseline
equipment, and premium efcient motors.
Energy Savings Results
Climate Zone
Electricity
Savings
(annual kWh)
Electric Demand
Savings
(peak kW)
Gas Savings
(annual therms)
Site EUI Savings
(kBtu/sf/yr)
Savings as % of
Total Site Usage
Hot & Humid 39,061 13 0 5.4 5.8%
Hot & Dry 19,833 13 14 2.8 3.2%
Marine 9,108 12 100 1.7 2.1%
Cold 12,628 9 172 2.4 2.9%
Very Cold 7,436 5 329 2.4 2.8%
Values presented in this table are total savings from the reference building baseline usage, not incremental savings from a
current code baseline.
Financial Analysis Results
Climate
Zone
Equipment
Cost
Install
Cost
Total
Cost
Total Annual
Energy Cost
Savings
Annual
O&M Cost
Savings
Total
Annual
$ Savings
Simple
Payback
(years)
NPV
Hot & Humid $76,884 $19,699 $96,583 $4,032 $0 $4,032 >20 $(34,435)
Hot & Dry $65,409 $28,234 $93,643 $2,781 $0 $2,781 >20 $(44,972)
Marine $48,840 $25,976 $74,816 $1,212 $0 $1,212 >20 $(46,214)
Cold $56,163 $34,139 $90,302 $1,680 $0 $1,680 >20 $(53,518)
Very Cold $42,475 $28,433 $70,908 $1,133 $0 $1,133 >20 $(43,993)
Values presented in this table are total costs and savings, not incremental costs and savings from a current code baseline.
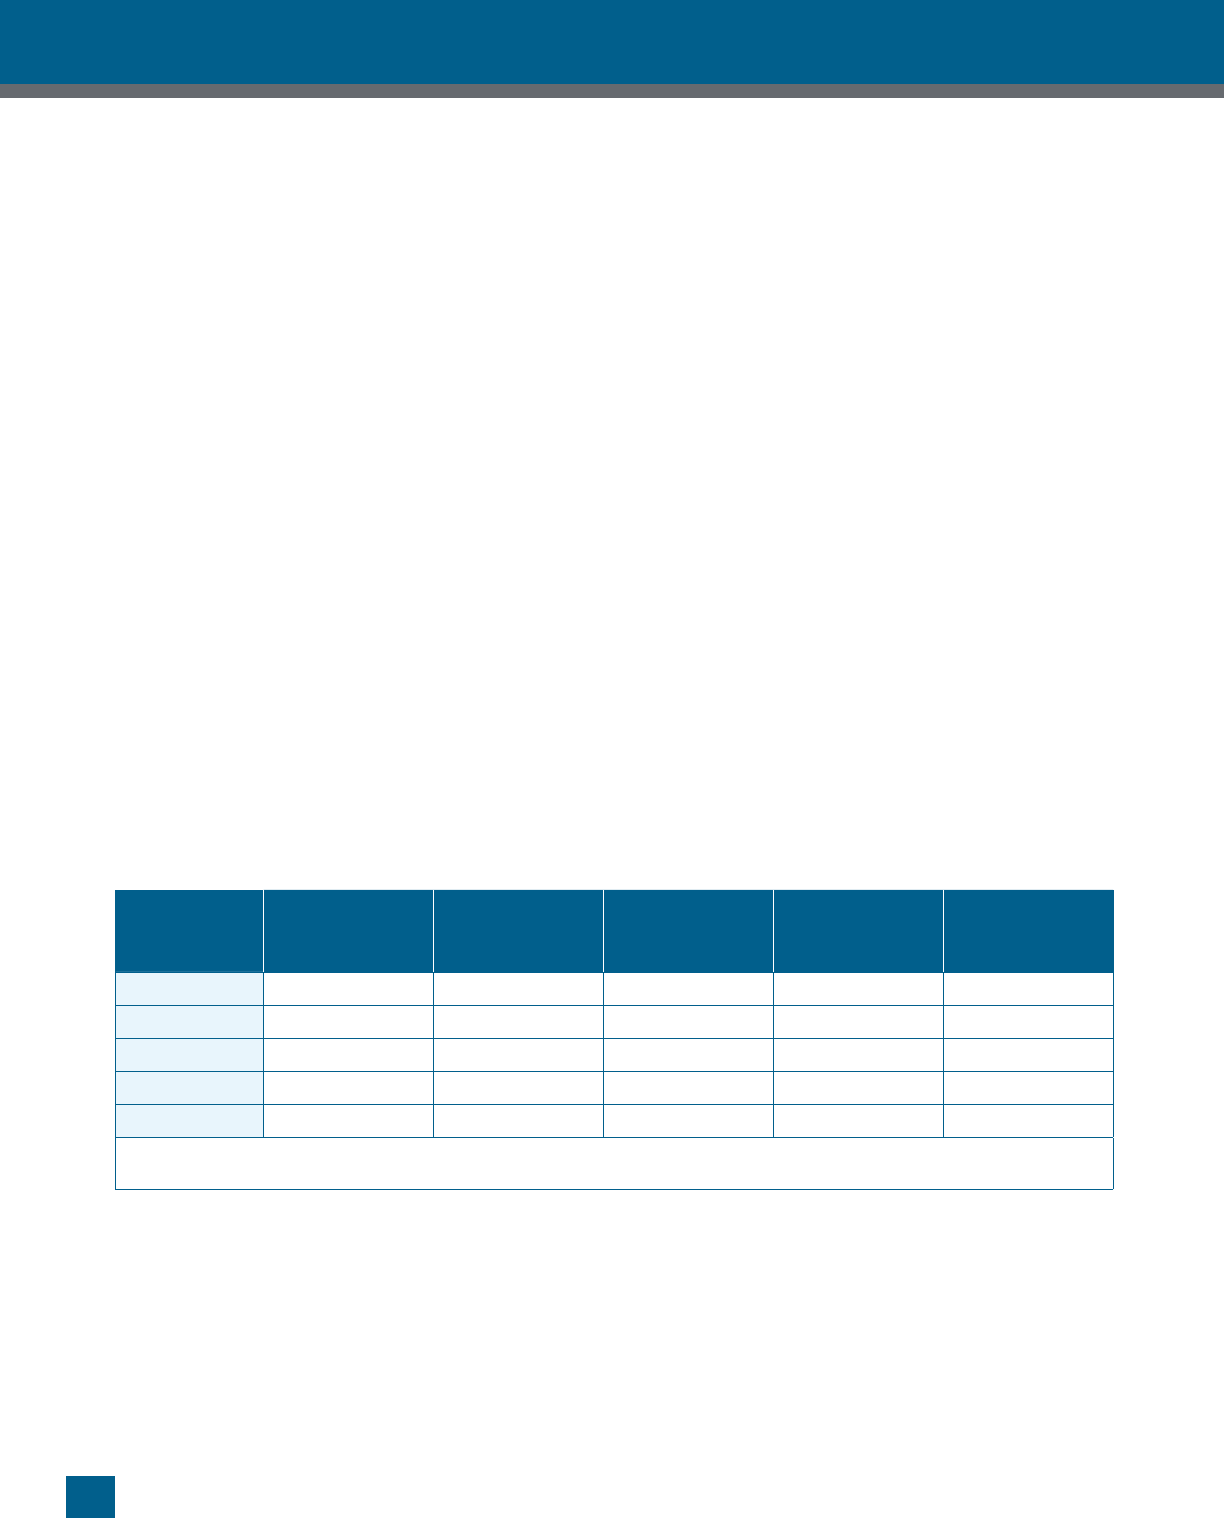
10 APPENDIX
154
Retail Buildings
Advanced Energy Retrofit Guides
Implementation costs are based on replacement of the existing units. Existing circuits, structure, piping are
assumed to be sufcient to accommodate the new unit. The EUL of this measure is estimated at 15 years
(WSDGA, 2006).
H13. Replace RTUs with Units that Use Evaporative Cooling
Technical Description
Evaporative cooling (EC) may provide an efcient replacement for traditional direct expansion air conditioning
in some climates. In drier climates, EC can save up to 70% of the energy and demand required by an equivalent
direct expansion (DX) system (ASHRAE 2008a). Direct EC works by evaporating water directly in the
airstream, either by spray or direct contact with a media. In addition to energy savings, EC improves air quality
and doesn’t require the use of refrigerants.
This measure involves replacing the baseline packaged RTUs with models capable of evaporative cooling.
Measure Special Considerations
Evaporative cooling works best in hot, dry climates. Many areas in the country would not receive the full benets
of an EC system.
Technical Assumptions for Implementing Measure in Reference Building
The RTUs in the reference building are assumed to be the original units. The RTUs are over 30 years old and are
likely nearing the end of their useful life.
The baseline system has an EER rating range from 9.0 to 10.1, a heating efciency of 0.78 and standard
efciency motors.
Energy Savings Results
Climate Zone
Electricity
Savings
(annual kWh)
Electric Demand
Savings
(peak kW)
Gas Savings
(annual therms)
Site EUI Savings
(kBtu/sf/yr)
Savings as % of
Total Site Usage
Hot & Humid (1,956) 0 0 (0.3) (0.3%)
Hot & Dry 4,458 9 0 0.6 0.7%
Marine (44) 2 0 0.0 0.0%
Cold (225) (1) 0 0.0 0.0%
Very Cold (72) 0 0 0.0 0.0%
Values presented in this table are total savings from the reference building baseline usage, not incremental savings from a
current code baseline.

10 APPENDIX
155
Retail Buildings
Advanced Energy Retrofit Guides
Financial Analysis Results
Climate
Zone
Equipment
Cost
Install
Cost
Total
Cost
Total Annual
Energy Cost
Savings
Annual
O&M Cost
Savings
Total
Annual
$ Savings
Simple
Payback
(years)
NPV
Hot & Humid $158,000 $39,500 $197,500 $(181) $0 $(181) - $(153,572)
Hot & Dry $124,000 $31,000 $155,000 $913 $0 $913 >20 $(113,928)
Marine $178,000 $44,500 $222,500 $7 $0 $7 >20 $(168,435)
Cold $208,000 $52,000 $260,000 $(28) $0 $(28) - $(194,196)
Very Cold $133,000 $33,250 $166,250 $(10) $0 $(10) - $(130,658)
Values presented in this table are total costs and savings, not incremental costs and savings from a current code baseline.
Implementation costs assume a direct replacement of the existing RTUs. The new evaporative units are assumed
to use the same wiring circuit. The existing breaker is replaced for smaller load. The EUL of this measure is
estimated at 15 years (WSDGA, 2006).
H14. Replace RTUs with High Eciency VAV Units
Technical Description
This measure involves replacing the original CAV packaged roof top units with VAV units that have higher
cooling and heating efciency. While CAV units deliver a constant volume of air whenever the units are on,
VAV units modulate the airow to meet the needs of the zones. Signicant fan energy savings can be realized
by using VAV units with VFD-controlled supply fans. They’re most suited for zones that have varying cooling
and heating loads.
RTU cooling and heating efciencies have steadily increased over the last few decades. Minimum efciencies
prescribed in building energy codes and federal regulations are frequently increased to keep pace with these
improved efciencies.
Measure Special Considerations
DX cooling coils require minimum airow for proper operation, to avoid coil freezing. Minimum airow rates
must be considered when selecting and operating VAV units with DX cooling.
The controls will need to be upgraded with the conversion from CAV
to VAV. VAV units are able to modulate
both the air volume and the supply temperature, which is more energy efcient at the expense of added controls
complexity. The controls should be set up to maximize the efciency of the system while still maintaining
comfort conditions in the zone (Wulnghoff, 1999).
Technical Assumptions for Implementing Measure in Reference Building
The RTUs in the reference building are assumed to be the original units – CAV single zone units, with standard
efciency DX cooling and gas-red heating. The RTUs are over 30 years old and are likely nearing the end of
their useful life.
The measure includes replacing the units with VAV single zone units, with higher efciency DX cooling and gas-
red heating and premium efciency motors.

10 APPENDIX
156
Retail Buildings
Advanced Energy Retrofit Guides
Energy Savings Results
Climate Zone
Electricity
Savings
(annual kWh)
Electric Demand
Savings
(peak kW)
Gas Savings
(annual therms)
Site EUI Savings
(kBtu/sf/yr)
Savings as % of
Total Site Usage
Hot & Humid 19,306 4 2 2.7 2.9%
Hot & Dry 23,158 4 47 3.4 3.9%
Marine 14,431 3 186 2.7 3.5%
Cold 18,578 3 327 3.9 4.6%
Very Cold 12,511 2 448 3.5 4.1%
Values presented in this table are total savings from the reference building baseline usage, not incremental savings from a
current code baseline.
Financial Analysis Results
Climate
Zone
Equipment
Cost
Install
Cost
Total
Cost
Total Annual
Energy Cost
Savings
Annual
O&M Cost
Savings
Total
Annual
$ Savings
Simple
Payback
(years)
NPV
Hot & Humid $115,527 $16,269 $131,796 $1,656 $(217) $1,439 >20 $(89,932)
Hot & Dry $100,923 $23,318 $124,241 $1,934 $(283) $1,651 >20 $(81,127)
Marine $80,760 $21,454 $102,214 $1,551 $(250) $1,301 >20 $(67,972)
Cold $88,702 $28,195 $116,897 $2,307 $(277) $2,030 >20 $(70,891)
Very Cold $71,037 $23,482 $94,519 $1,621 $(252) $1,368 >20 $(60,716)
Values presented in this table are total costs and savings, not incremental costs and savings from a current code baseline.
H15. Replace HVAC System with a Dedicated Outdoor Air System
Technical Description
A dedicated outdoor air system (DOAS) decouples the heating and cooling of the outside air from the space
heating and cooling. With this system, a dedicated outside air unit provides 100% outside air to a space, heated
and cooled to a neutral or slightly cool condition by the unit, while the other HVAC units operate in 100%
recirculation mode to heat and cool the space. A DOAS may be more energy efcient than a traditional system
that supplies ventilation air from each unit, especially since the RTUs in the reference building supply a common
area. DOAS also makes it more cost-effective to implement air-to-air energy recovery between outgoing
(exhaust) and incoming (outside air) airstreams, since all of the outside air is brought in at a central location.
Using a DOAS helps address the fact that sensible and latent cooling loads on cooling equipment do not peak at
the same time (Morris, 2003).
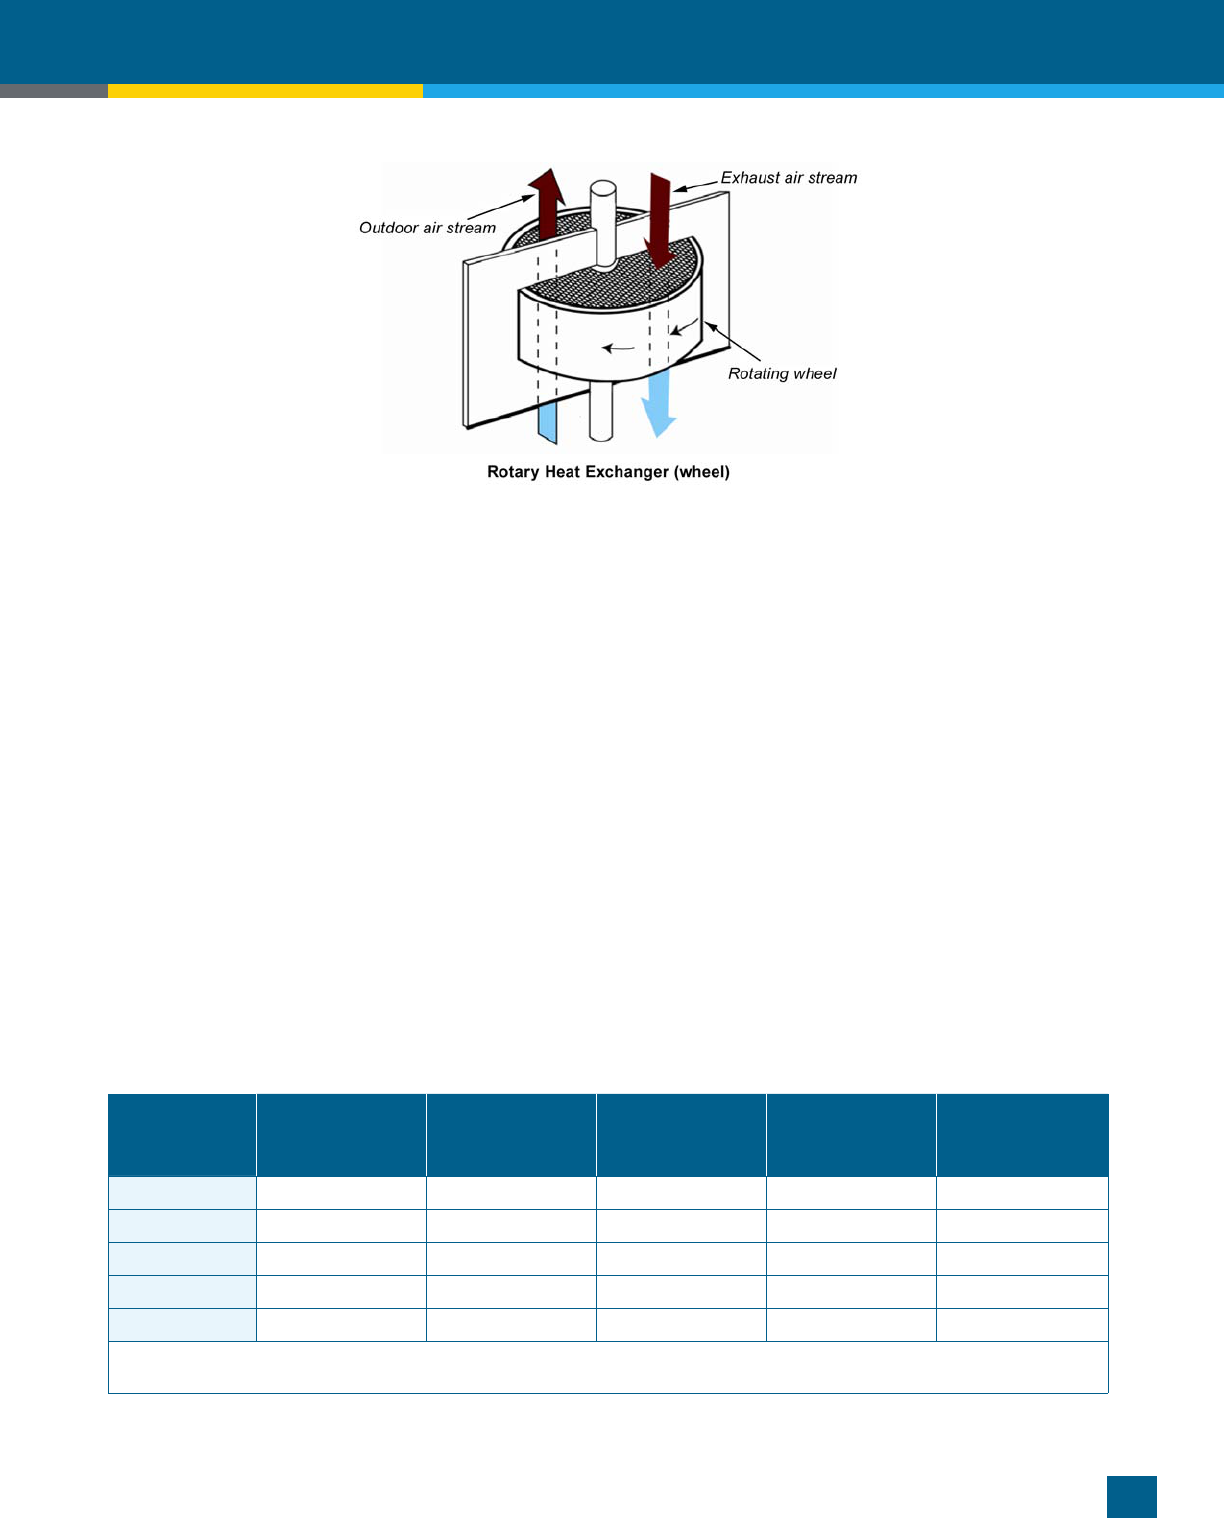
10 APPENDIX
157
Retail Buildings
Advanced Energy Retrofit Guides
Figure 10.4. Example of Energy Recovery Device
Reprinted from Advanced Energy Design Guide for Small to Medium Oce Buildings. © 2011, ASHRAE
Measure Special Considerations
Typically, air from the 100% outside air unit is ducted to each occupied space, while the other HVAC units serve
only their specic spaces. There may be more ductwork associated with DOAS than with conventional systems.
DOAS is most effective in hot, humid climates. When coupled with air-to-air energy recovery, it can be
cost-effective in all climates.
Technical Assumptions for Implementing Measure in Reference Building
The RTUs in the reference building are assumed to be the original units – CAV single zone units, with standard
efciency DX cooling and gas-red heating. The RTUs are over 30 years old and are likely nearing the end of
their useful life. Each unit provides minimum ventilation air to the building.
The measure includes replacing one of the RTUs with a 100% outside air unit sized to deliver ventilation air to
the building. This unit has a total energy recovery wheel, transferring energy between the incoming outside air
stream and the outgoing relief air stream. Demand-controlled ventilation controls were simulated on the 100%
OA system, which reduce the amount of ventilation air at times of low occupancy, as sensed by a CO
2
meter in
the occupied zone. The other RTUs remain as-is, and are adjusted to operate in 100% recirculation mode.
Energy Savings Results
Climate Zone
Electricity
Savings
(annual kWh)
Electric Demand
Savings
(peak kW)
Gas Savings
(annual therms)
Site EUI Savings
(kBtu/sf/yr)
Savings as % of
Total Site Usage
Hot & Humid 26,664 7 3 3.7 4.0%
Hot & Dry 15,575 8 147 2.7 3.1%
Marine 2,317 4 422 2.0 2.6%
Cold 2,556 3 800 3.6 4.2%
Very Cold (208) (1) 786 3.2 3.7%
Values presented in this table are total savings from the reference building baseline usage, not incremental savings from a
current code baseline.

10 APPENDIX
158
Retail Buildings
Advanced Energy Retrofit Guides
Financial Analysis Results
Climate
Zone
Equipment
Cost
Install
Cost
Total
Cost
Total Annual
Energy Cost
Savings
Annual
O&M Cost
Savings
Total
Annual
$ Savings
Simple
Payback
(years)
NPV
Hot & Humid $13,780 $7,660 $21,440 $2,819 $0 $2,819 8 $12,727
Hot & Dry $11,008 $10,978 $21,986 $2,464 $0 $2,464 9 $8,646
Marine $14,400 $10,100 $24,500 $886 $0 $886 >20 $(9,117)
Cold $19,308 $13,274 $32,582 $1,240 $0 $1,240 >20 $(11,422)
Very Cold $10,746 $11,055 $21,802 $641 $0 $641 >20 $(9,641)
Values presented in this table are total costs and savings, not incremental costs and savings from a current code baseline.
Implementation costs include the replacement of one existing RTU with a new DOAS and energy recovery.
Additional hardware includes no more than 50 linear feet of additional ductwork. No additional O&M impact
is estimated for this measure, since service of the energy recovery wheel is assumed to be covered under the
existing service contract. The EUL of this measure is estimated at 15 years (WSDGA, 2006).
H16. Replace RTUs with Air-to-Air Heat Pumps
Technical Description
Air-to-air heat pumps are different from standard electric (DX) cooling, gas heating units in that they use the
refrigerant cycle to provide both heating and cooling. They are typically all-electric units. Air-to-air heat pumps
use the refrigerant cycle to reject heat to the outdoors during cooling mode and extract heat from the outdoors in
heating mode, reversing the direction of the refrigerant depending on the operating mode (ASHRAE, 2008a).
Measure Special Considerations
Air-to-air heat pumps are most suited for mild climates. In heating mode, the heating efciency and capacity
decrease with decreasing outdoor air temperature. Similarly, in cooling mode, the cooling efciency and capacity
decrease with increasing outdoor air temperature.
In cold climates, supplemental heat may be required (e.g., electric duct heaters), since heat pumps cannot operate
in heating mode at cold outside air temperatures.
Technical Assumptions for Implementing Measure in Reference Building
The RTUs in the reference building are assumed to be the original units – CAV single zone units, with standard
efciency DX cooling and gas-red heating. The RTUs are over 30 years old and are likely nearing the end of
their useful life. Each unit provides minimum ventilation air to the building.
The measure includes replacing the RTUs with air-to-air heat pumps, in a similar zoning arrangement. The
simulation results for this measure indicate strong effects from fuel switching. Some minor whole building
energy savings were realized in colder climates, but all climate zones showed an energy cost penalty. For this
reason, a detailed cost-effectiveness analysis was not conducted.
H17. Replace HVAC System with Displacement Ventilation System
Technical Description
Traditional all-air HVAC systems supply air overhead, and mix the supply air with room air as it exits the
ductwork and is distributed to the zones. Displacement ventilation systems supply air near the oor, at lower

10 APPENDIX
159
Retail Buildings
Advanced Energy Retrofit Guides
velocities and warmer temperatures (in cooling mode), and contaminants and heat are carried upward through
the space by convective ows. Displacement ventilation systems have higher ventilation effectiveness than
overhead mixing systems, and are often times more energy efcient. They are most suited for spaces with high
ceilings (e.g., greater than 10 feet). Supplemental heating is usually required with displacement ventilation
systems (ASHRAE, 2009b).
Measure Special Considerations
Since displacement ventilation systems supply air near the oor, often times through perforated grilles oriented
vertically near the oor, the diffuser location and style needs to be closely coordinated with other building
elements.
Displacement ventilation systems require warmer supply air temperatures in cooling mode than traditional
overhead mixing systems, to maintain occupant comfort. This often translates to warmer return air temperatures
than mixing systems, due to the thermal plume inherent with displacement ventilation systems (ASHRAE,
2009b). As a result, airside economizer cycle operation is usually greater with displacement ventilation systems
than with overhead mixing systems (EDR, 2005).
In humid climates, dehumidication may be required to maintain comfort conditions in the zone. One way to
accomplish this in cooling mode is to cool the air to a point where sufcient dehumidication takes place (e.g.,
52°F), and then reheat the air to 65°F using re-circulated return air.
The unit controls must be sophisticated enough to provide warmer air during cooling mode (e.g., 65°F) than with
traditional overhead mixing systems (e.g., 55°F).
Technical Assumptions for Implementing Measure in Reference Building
The RTUs in the reference building are CAV single zone units serving an overhead mixed-air distribution system,
with the ductwork exposed near the ceiling / underside of the roof. This measure modies the distribution system
by installing displacement ventilation diffusers near the interior columns, and routing the ductwork to these
diffusers. The return air inlet remains near the underside of the roof. The controls must be modied to vary the
supply air temperature between 65°F in cooling mode, and 70°F in heating mode.
Costs and savings are not presented for this measure due to limitations in the modeling software used for
estimating the savings for this measure.
H18. Remove Heat from Front Entry
Technical Description
Many commercial buildings include a small vestibule at the main entrance, to minimize air inltration. Vestibules
are normally designed so that the interior and exterior doors do not need to be open at the same time for passage.
In fact, it’s desired that one set of doors be closed at all times, to minimize inltration. Vestibules act as a buffer
between the conditioned space (indoors) and outdoors. However, many vestibules are heated, effectively making
the vestibules conditioned space. Energy savings can be realized by removing the heat from vestibules, and
restoring them to their original purpose as a transition between the outdoors and the interior conditioned space.
Measure Special Considerations
If the heating system is removed from a vestibule, the re sprinkler piping may need to be modied. This
typically involves converting the wet pipe sprinklers serving the vestibule to dry pipe sprinklers to avoid
freezing issues.

10 APPENDIX
160
Retail Buildings
Advanced Energy Retrofit Guides
Technical Assumptions for Implementing Measure in Reference Building
The baseline reference building is assumed to have an electric heater serving the vestibule, maintaining 70°F
space temperature during occupied hours. Implementation of this measure involves removing this electric heater,
and converting the sprinkler(s) from wet pipe to dry pipe.
Energy Savings Results
Climate Zone
Electricity
Savings
(annual kWh)
Electric Demand
Savings
(peak kW)
Gas Savings
(annual therms)
Site EUI Savings
(kBtu/sf/yr)
Savings as % of
Total Site Usage
Hot & Humid 6 0 3 0.0 0.0%
Hot & Dry 256 0 99 0.4 0.5%
Marine 503 0 611 2.5 3.3%
Cold 814 0 904 3.8 4.4%
Very Cold 1,381 0 1,469 6.1 7.2%
Values presented in this table are total savings from the reference building baseline usage, not incremental savings from a
current code baseline.
Financial Analysis Results
Climate
Zone
Equipment
Cost
Install
Cost
Total
Cost
Total Annual
Energy Cost
Savings
Annual
O&M Cost
Savings
Total
Annual
$ Savings
Simple
Payback
(years)
NPV
Hot & Humid $2,067 $1,716 $3,783 $4 $0 $4 >20 $(3,694)
Hot & Dry $2,086 $2,460 $4,546 $115 $0 $115 >20 $(3,335)
Marine $2,160 $2,263 $4,423 $701 $0 $701 7 $2,739
Cold $2,044 $2,974 $5,019 $1,059 $0 $1,059 5 $5,788
Very Cold $2,036 $2,477 $4,513 $1,291 $0 $1,291 4 $8,629
Values presented in this table are total costs and savings, not incremental costs and savings from a current code baseline.
Implementation costs for this measure include a conversion to non-freeze sprinkler heads as well as additional
labor for any required patch and paint. The EUL for this measure is estimated at 20 years.
SERVICE HOT WATER RETROFIT MEASURES
S2. Increase Eciency of Service Hot Water System
Technical Description
On average, the energy used for heating domestic hot water in typical retail buildings makes up only about 0.7%
of the building’s total consumption. This is a relatively small amount in comparison to other end uses such as
HVAC and lighting (U.S. Energy Information Administration, 2006). Efforts at reducing overall facility energy
usage should target these larger energy consumers rst. That said, there are opportunities for increasing the
efciency of service hot water systems in retail buildings, including:
u
Inspect and repair pipe and tank insulation. This task can be included in a facility’s existing preventive
maintenance program.
u
Replace lavatory faucets with sensor controlled low-ow faucets. This measure will reduce water
consumption in addition to water heating usage.

10 APPENDIX
161
Retail Buildings
Advanced Energy Retrofit Guides
u Install a solar collector for pre-heating the cold water inlet. This measure is applicable for systems that use a
central water heater.
u
Replace the water heater with a more efcient model, such as a condensing boiler.
u Replace the water heater with a heat pump water heater. Pipe the waste cooling to a nearby server room, to
reduce the cooling load on the server room HVAC unit. This measure is applicable for systems that use a
central water heater.
u
Replace the water heater with point-of-use electric water heaters. This measure is applicable for systems that
use a central water heater. Many retail facilities may have limited piping between the boiler and the SHW
end-use. Therefore, heat loss though extensive hot water pipes might already be minimized. Point of use water
heaters may still reduce the standby tank losses.
Measure Special Considerations
For retail buildings that have food service preparations areas or other occupancy that uses a signicant amount of
domestic hot water, increasing the efciency of the domestic water heating system can yield substantial energy
savings.
For any system, the domestic hot water temperature should not be lowered below a level that will encourage
growth of legionellla pneumophilia. This dangerous bacteria colonizes in warm water temperatures below 115°F.
Typically, service hot water systems are kept at 140°F to inhibit growth of the bacteria (ASHRAE, 2007).
Technical Assumptions for Implementing Measure in Reference Building
For the reference building, the following measure is implemented to represent increasing the efciency of the
service hot water system:
u
Baseline: Gas-red tank-type water heater with 80% thermal efciency serving the lavatories, service sinks,
and break room sinks located throughout the building. A small pump circulates water around the building to
minimize the length of time it takes hot water to reach the xture when turned on.
u
Measure: Similar to the baseline system, except the water heater is a condensing-type water heater with 95%
efciency. The existing ue is replaced with a PVC ue.
Energy Savings Results
Climate Zone
Electricity
Savings
(annual kWh)
Electric Demand
Savings
(peak kW)
Gas Savings
(annual therms)
Site EUI Savings
(kBtu/sf/yr)
Savings as % of
Total Site Usage
Hot & Humid 0 0 19 0.1 0.1%
Hot & Dry 0 0 22 0.1 0.1%
Marine 0 0 25 0.1 0.1%
Cold 0 0 25 0.1 0.1%
Very Cold 0 0 28 0.1 0.1%
Values presented in this table are total savings from the reference building baseline usage, not incremental savings from a
current code baseline.

10 APPENDIX
162
Retail Buildings
Advanced Energy Retrofit Guides
Financial Analysis Results
Climate
Zone
Equipment
Cost
Install
Cost
Total
Cost
Total Annual
Energy Cost
Savings
Annual
O&M Cost
Savings
Total
Annual
$ Savings
Simple
Payback
(years)
NPV
Hot & Humid $6,775 $2,605 $9,381 $22 $0 $22 >20 $(8,978)
Hot & Dry $6,836 $3,734 $10,571 $22 $0 $22 >20 $(10,147)
Marine $7,080 $3,436 $10,516 $26 $0 $26 >20 $(10,046)
Cold $6,701 $4,515 $11,216 $27 $0 $27 >20 $(10,727)
Very Cold $6,674 $3,760 $10,434 $22 $0 $22 >20 $(10,013)
Values presented in this table are total costs and savings, not incremental costs and savings from a current code baseline.
Implementation costs include an added circuit for water heater within 50’ of panel. The EUL of this measure is
estimated at 12 years (WSDGA, 2006).
OTHER RETROFIT MEASURES
O1. Retrofit Electric Transformers with Higher Eciency Models
Technical Description
Transformers are used in retail buildings to reduce the voltage supplied by the utility to the building to a
level that can be used by certain end-uses. Typically, the utility supplies 480/277v power, and the building
transformers reduce a portion of the load to 208/120v for use by lighting, plug loads, and other 208/120v loads.
These transformers can be upgraded to higher efciency models to realize energy savings. Many high efciency
transformers reach their peak efciency at part load conditions, where most transformers operate (Thomas, 2002).
Measure Special Considerations
Upgrading transformers to higher efciency models is typically not a cost-effective measure unless the
transformer is at the end of its useful life. If they are replaced, or if new transformers are added as part of an
addition, it may be worth using a higher efciency transformer (Thomas, 2002).
Technical Assumptions for Implementing Measure in Reference Building
The reference building is assumed to have one main transformer near the utility service entrance, lowering the
voltage from 480/277v to 208/120v. The baseline transformer efciency is 95%, while the measure transformer
efciency is 98.5%.
Energy Savings Results
Climate Zone
Electricity
Savings
(annual kWh)
Electric Demand
Savings
(peak kW)
Gas Savings
(annual therms)
Site EUI Savings
(kBtu/sf/yr)
Savings as % of
Total Site Usage
Hot & Humid 17,750 2 0 2.5 2.9%
Hot & Dry 17,750 2 0 2.5 2.9%
Marine 17,750 2 0 2.5 2.9%
Cold 17,750 2 0 2.5 2.9%
Very Cold 17,750 2 0 2.5 2.9%
Energy savings estimates were calculated using a spreadsheet-based analysis. Values presented in this table are total savings
from the reference building baseline usage, not incremental savings from a current code baseline.

10 APPENDIX
163
Retail Buildings
Advanced Energy Retrofit Guides
Financial Analysis Results
Climate
Zone
Equipment
Cost
Install
Cost
Total
Cost
Total Annual
Energy Cost
Savings
Annual
O&M Cost
Savings
Total
Annual
$ Savings
Simple
Payback
(years)
NPV
Hot & Humid $19,063 $1,485 $20,548 $1,371 $0 $1,371 15 $(3,162)
Hot & Dry $19,234 $2,129 $21,363 $1,305 $0 $1,305 17 $(4,495)
Marine $19,920 $1,958 $21,878 $1,504 $0 $1,504 15 $(2,883)
Cold $18,854 $2,574 $21,427 $1,772 $0 $1,772 12 $181
Very Cold $18,777 $2,144 $20,921 $1,701 $0 $1,701 12 $(107)
Values presented in this table are total costs and savings, not incremental costs and savings from a current code baseline.
Implementation costs assume the standard efciency transformer is replaced with a high efciency transformer
(75 kVA). Incremental costs should be considered for this measure, for when the transformers are at the end of
their useful lives. Evaluating the measure on an incremental basis would increase the NPV values.
The EUL of
this measure is estimated at 30 years (WSDGA, 2006).
10.7 Technical References
ASHRAE (2004). Standard 55 - Thermal Environmental Conditions for Human Occupancy. American Society of
Heating, Refrigerating and Air-Conditioning Engineers, Inc.
ASHRAE (2007). ASHRAE Handbook – HVAC Applications. American Society of Heating, Refrigerating and
Air-Conditioning Engineers, Inc.
ASHRAE (2008a). ASHRAE Handbook – HVAC Systems and Equipment. American Society of Heating,
Refrigerating and Air-Conditioning Engineers, Inc.
ASHRAE (2008b). Advanced Energy Design Guide for Retail Buildings. American Society of Heating,
Refrigerating and Air-Conditioning Engineers, Inc.
ASHRAE (2009a). Standard 189.1 – Standard for the Design of High-Performance, Green Buildings Except
Low-Rise Residential Buildings. American Society of Heating, Refrigerating and Air-Conditioning
Engineers, Inc.
ASHRAE (2009b). ASHRAE Handbook – Fundamentals. American Society of Heating, Refrigerating and Air-
Conditioning Engineers, Inc.
California Energy Commission (2007), “Advanced Variable Air Volume System Design Guide,” www.
newbuildings.org/sites/default/les/A-11_LG_VAV_Guide_3.6.2.pdf.
Cowan, A. (2004), “Review of Recent Commercial Roof Top Unit Field Studies in the Pacic Northwest and
California,” www.peci.org/documents/NWPCC_SmallHVAC_Report_R3_.pdf.
Deru, M., et al. (2011), “U.S. Department of Energy Commercial Reference Building Models of the National
Building Stock,” National Renewable Energy Laboratory.
Doty, S., W. C. Turner (2009). Energy Management Handbook. The Fairmont Press, Inc.

10 APPENDIX
164
Retail Buildings
Advanced Energy Retrofit Guides
EDR (Energy Design Resources) (2005), “Design Brief: Displacement Ventilation”, www.energydesignresources.
com/resources/publications/design-briefs.aspx.
PECI (2009), “A Study on Energy Savings and Measure Cost Effectiveness of Existing Building
Commissioning,” www.peci.org/documents/annex_report.pdf.
Jacobs, P., et al. (2003), “Small Commercial Rooftops: Field Problems, Solutions and the Role of
Manufacturers,” 11th National Conference on Building Commissioning.
Levinson, R., H. Akbari (2009), “Potential benets of cool roofs on commercial buildings: conserving energy,
saving money, and reducing emission of greenhouse gases and air pollutants,” Energy Efciency Journal,
Vol. 3, No. 1.
Morris, W. (2003), “The ABCs of DOAs, Dedicated Outdoor Air Systems,” ASHRAE Journal, May, American
Society of Heating, Refrigerating and Air-Conditioning Engineers, Inc.
PG&E (Pacic Gas and Electric Company) (2009), “LED Parking Lot Lights,” www.pge.com/includes/docs/
pdfs/mybusiness/energysavingsrebates/incentivesbyindustry/fs_led_parkinglotlights.pdf.
RS Means (2009). Facilities Maintenance & Repair Cost Data. R.S. Means Company.
RS Means (2010). Building Construction Cost Data. R.S. Means Company.
Taylor, S. T., C. H. Cheng (2010), “Why Enthalpy Economizers Don’t Work,” ASHRAE Journal, November,
American Society of Heating, Refrigerating and Air-Conditioning Engineers, Inc.
Thomas, A. et al. (2002), “Replacing Distribution Transformers: A Hidden Opportunity for Energy Savings,”
American Council for an Energy-Efcient Economy.
U.S. Energy Information Administration (2006), “2003 Commercial Buildings Energy Consumption Survey,”
www.eia.doe.gov/emeu/cbecs/.
U.S. Department of Energy (2011), “Technology Specication Project: High Efciency Lighting for Parking
Structures,” apps1.eere.energy.gov/buildings/publications/pdfs/alliances/techspec_parkingstructure.pdf.
U.S. Energy Information Administration (2011a), “Natural Gas Prices” (website), accessed July 2011.
U.S. Energy Information Administration (2011b), “Annual Energy Outlook 2011,” www.eia.gov/forecasts/aeo/
pdf/0383(2011).pdf.
WSDGA (Washington State Department of General Administration) (2006), “Energy Use Simulation and
Economic Analysis” (website), www.ga.wa.gov/eas/elcca/simulation.html, accessed June 2011.
Wulnghoff, D. R. (1999). Energy Efciency Manual. Energy Institute Press. (Refrigerating and Air-
Conditioning Engineers, Inc.)

