
Resource Adequacy in the
Pacific Northwest
March 2019


© 2019 Energy and Environmental Economics, Inc.
© 2019 Copyright. All Rights Reserved.
Energy and Environmental Economics, Inc.
44 Montgomery Street, Suite 1500
San Francisco, CA 94104
415.391.5100
www.ethree.com
Project Team:
Zach Ming
Arne Olson
Huai Jiang
Manohar Mogadali
Nick Schlag
Resource Adequacy in the
Pacific Northwest
March 2019


© 2019 Energy and Environmental Economics, Inc.
Table of Contents
Executive Summary ................................................................................................... i
Background and Approach .......................................................................................... ii
Key Findings ................................................................................................................... ii
1 Introduction ......................................................................................................... 1
1.1 Study Background & Context ........................................................................... 1
1.2 Prior Studies ........................................................................................................ 2
1.3 Purpose of Study ................................................................................................ 2
1.4 Report Contents .................................................................................................. 3
2 Resource Adequacy in the Northwest ............................................................ 4
2.1 What is Resource Adequacy? .......................................................................... 4
2.2 Planning Practices in the Northwest ............................................................... 6
3 Modeling Approach ........................................................................................... 9
3.1 Renewable Energy Capacity Planning (RECAP) Model ............................. 9
3.2 Study Region ..................................................................................................... 14
3.3 Scenarios & Sensitivities ................................................................................. 16
3.4 Key Portfolio Metrics ........................................................................................ 18
3.5 Study Caveats ................................................................................................... 20
4 Key Inputs & Assumptions .............................................................................. 22
4.1 Load Forecast ................................................................................................... 22
4.2 Existing Resources........................................................................................... 24
4.3 Candidate Resources ...................................................................................... 31

4.4 Estimating Cost and GHG Metrics ................................................................ 35
5 Results ................................................................................................................ 36
5.1 Short-Term Outlook (2018) ............................................................................. 36
5.2 Medium-Term Outlook (2030) ........................................................................ 38
5.3 Long-Term Outlook (2050) ............................................................................. 41
6 Discussion & Implications ............................................................................... 67
6.1 Land Use Implications of High Renewable Scenarios .............................. 67
6.2 Reliability Standards ........................................................................................ 68
6.3 Benefits of Reserve Sharing ........................................................................... 71
7 Conclusions ....................................................................................................... 74
7.1 Key Findings ...................................................................................................... 75
Appendix A. Assumption Development Documentation ........................ A-1
Appendix B. RECAP Model Documentation ............................................. B-1
Appendix C. Renewable Profile Development .......................................... C-8

© 2019 Energy and Environmental Economics, Inc.
Study Sponsors
This study was sponsored by Puget Sound Energy, Avista, NorthWestern Energy, and the Public Generating
Pool (PGP). PGP is a trade association representing 10 consumer-owned utilities in Oregon and Washington:
Chelan County PUD, Clark Public Utilities, Cowlitz County PUD, Eugene Water and Electric Board, Klickitat
PUD, Grant County PUD, Lewis County PUD, Tacoma Power, Snohomish County PUD, and Benton PUD.
Acknowledgements
E3 thanks the staff of the Northwest Power and Conservation Council (NWPCC) for providing data and
technical review.
Conventions
The following conventions are used throughout this report:
All costs are reported in 2016 dollars.
All levelized costs are assumed to be levelized in real terms (i.e., a stream of payments over the
lifetime of the contract that is constant in real dollars).

Acronyms
CONE Cost of New Entry
DR Demand Response
EE Energy Efficiency
ELCC Effective Load Carrying Capability
EUE Expected Unserved Energy
FOR Forced Outage Rate
GENESYS NWPCC’s Generation Evaluation System Model
GHG Greenhouse Gas
ISO Independent System Operator
LOLE Loss-of-Load Expectation
LOLF Loss-of-Load Frequency
LOLP Loss-of-Load Probability
MISO Midwest Independent System Operator
MMT Million Metric Ton
MTTR Mean Time to Repair
NERC North American Electric Reliability Corporation
NREL National Renewable Energy Laboratory
NWPCC Northwest Power and Conservation Council
NWPP Northwest Power Pool
PNUCC Pacific Northwest Utilities Conference Committee
PRM Planning Reserve Margin
RA Resource Adequacy
RECAP E3’s Renewable Energy Capacity Planning Model
RPS Renewables Portfolio Standard
RTO Regional Transmission Operator
SPP Southwest Power Pool
WECC Western Electricity Coordinating Council

i | P a g e
© 2018 Energy and Environmental Economics, Inc.
Executive Summary
Executive Summary
The Pacific Northwest is expected to undergo significant changes to its electricity generation resource mix
over the next 30 years due to changing economics of resources and more stringent environmental policy
goals. In particular, the costs of wind, solar, and battery storage have experienced significant declines in
recent years, a trend that is expected to continue. Greenhouse gas and other environmental policy goals
combined with changing economics have put pressure on existing coal resources, and many coal power
plants have announced plans to retire within the next decade.
As utilities become more reliant on intermittent renewable energy resources (wind and solar) and energy-
limited resources (hydro and battery storage) and less reliant on dispatchable firm resources (coal),
questions arise about how the region will serve future load reliably. In particular, policymakers across the
region are considering many different policies – such as carbon taxes, carbon caps, renewable portfolio
standards, limitations on new fossil fuel infrastructure, and others – to reduce greenhouse gas emissions
in the electricity sector and across the broader economy. The environmental, cost, and reliability
implications of these various policy proposals will inform electricity sector planning and policymaking in
the Pacific Northwest.
This study finds that deep decarbonization of the Northwest grid is feasible without sacrificing reliable
electric load service. But this study also finds that, absent technological breakthroughs, achieving 100%
GHG reductions using only wind, solar, hydro, and energy storage is both impractical and prohibitively
expensive. Firm capacity – capacity that can be relied upon to produce energy when it is needed the most,
even during the most adverse weather conditions – is an important component of a deeply-decarbonized

ii | P a g e
Resource Adequacy in the Pacific Northwest
grid. Increased regional coordination is also a key to ensuring reliable electric service at reasonable cost
under deep decarbonization.
Background and Approach
This study builds on the previous Northwest Low-Carbon Scenario Analysis conducted by E3 for PGP in
2017-2018 by focusing on long-run reliability and Resource Adequacy. This study uses E3’s Renewable
Energy Capacity Planning (RECAP) model, a loss-of-load-probability model designed specifically to test the
Resource Adequacy of high-renewable electricity systems under a wide variety of weather conditions,
renewable generation, and forced outages of electric generating resources. Specifically, this study
examines four key questions:
How to maintain Resource Adequacy in the 2020-2030 timeframe under growing loads and
increasing coal retirements?
How to maintain Resource Adequacy in the 2050 timeframe under different levels of carbon
abatement goals, including zero carbon?
How much effective capacity can be provided by wind, solar, electric energy storage, and demand
response?
How much firm capacity is needed to maintain reliable electric service at various levels of carbon
reductions?
Key Findings
1. It is possible to maintain Resource Adequacy for a deeply decarbonized Northwest electricity grid,
as long as sufficient firm capacity is available during periods of low wind, solar, and hydro
production;
o Natural gas generation is the most economic source of firm capacity today;

iii | P a g e
© 2018 Energy and Environmental Economics, Inc.
Executive Summary
o Adding new gas generation capacity is not inconsistent with deep reductions in carbon
emissions because the significant quantities of zero-marginal-cost renewables will ensure
that gas is only used during reliability events;
o Wind, solar, demand response, and short-duration energy storage can contribute but
have important limitations in their ability to meet Northwest Resource Adequacy needs;
o Other potential low-carbon firm capacity solutions include (1) new nuclear generation,
(2) fossil generation with carbon capture and sequestration, (3) ultra-long duration
electricity storage, and (4) replacing conventional natural gas with carbon-neutral gas
such as hydrogen or biogas.
2. It would be extremely costly and impractical to replace all carbon-emitting firm generation
capacity with solar, wind, and storage, due to the very large quantities of these resources that
would be required;
o Firm capacity is needed to meet the new paradigm of reliability planning under deep
decarbonization, in which the electricity system must be designed to withstand prolonged
periods of low renewable production once storage has depleted; renewable overbuild is
the most economic solution to completely replace carbon-emitting resources but requires
a 2x buildout that results in curtailment of almost half of all wind and solar production.
3. The Northwest is expected to need new capacity in the near term in order to maintain an
acceptable level of Resource Adequacy after planned coal retirements.
4. Current planning practices risk underinvestment in the new capacity needed to ensure Resource
Adequacy at acceptable levels;
o Reliance on market purchases or front-office transactions (FOTs) reduces the cost of
meeting Resource Adequacy needs on a regional basis by taking advantage of load and
resource diversity among utilities in the region;
o Capacity resources are not firm without a firm fuel supply; investment in fuel delivery
infrastructure may be required to ensure Resource Adequacy even under a deep
decarbonization trajectory;

iv | P a g e
Resource Adequacy in the Pacific Northwest
o Because the region lacks a formal mechanism for ensuring adequate physical firm
capacity, there is a risk that reliance on market transactions may result in double-counting
of available surplus generation capacity;
o The region might benefit from and should investigate a formal mechanism to share
planning reserves on a regional basis, which may help ensure sufficient physical firm
capacity and reduce the quantity of capacity required to maintain Resource Adequacy.

1 | P a g e
Introduction
© 2018 Energy and Environmental Economics, Inc.
1 Introduction
1.1 Study Background & Context
The Pacific Northwest is expected to undergo significant changes to its electricity generation resource mix
over the next 30 years due to changing economics of resources and more stringent environmental policy
goals. In particular, the costs of wind, solar, and battery storage have experienced significant declines in
recent years, a trend that is expected to continue. Greenhouse gas and other environmental policy goals
combined with changing economics have put pressure on existing coal resources, and many coal power
plants have announced plans to retire within the next decade.
As utilities become more reliant on intermittent renewable energy resources (wind and solar) and energy-
limited resources (hydro and battery storage) and less reliant on dispatchable firm resources (coal),
questions arise about how the region will serve future load reliably. In particular, policymakers across the
region are considering many different policies – such as carbon taxes, carbon caps, renewable portfolio
standards, limitations on new fossil fuel infrastructure, and others – to reduce greenhouse gas emissions
in the electricity sector and across the broader economy. The environmental, cost, and reliability
implications of these various policy proposals will inform electricity sector planning and policymaking in
the Pacific Northwest.

2 | P a g e
Resource Adequacy in the Pacific Northwest
1.2 Prior Studies
In 2017-2018, E3 completed a series of studies
1
for PGP and Climate Solutions to evaluate the costs of
alternative electricity decarbonization strategies in Washington and Oregon. These studies were
conducted using E3’s RESOLVE model, which is a dispatch and investment model that identifies optimal
long-term generation and transmission investments in the electric system to meet various
decarbonization and renewable energy targets. The studies found that the least-cost pathway to reduce
greenhouse gases from electricity generation is to replace coal generation with a mix of energy efficiency,
renewables, and natural gas generation. While these studies examined in great detail the economics of
new resources needed to achieve decarbonization, including the type, quantity, and location of these
resources, they did not look in-depth at reliability and Resource Adequacy.
1.3 Purpose of Study
This study builds on the previous Northwest Low-Carbon Scenario Analysis conducted by E3 for PGP in
2017-2018 by focusing on long-run reliability and Resource Adequacy. This study uses E3’s Renewable
Energy Capacity Planning (RECAP) model, a loss-of-load-probability model designed specifically to test the
Resource Adequacy of high-renewable electricity systems under a wide variety of weather conditions,
renewable generation, and forced outages of electric generating resources. Specifically, this study
examines four key questions:
How to maintain Resource Adequacy in the 2020-2030 timeframe under growing loads and
increasing coal retirements?
How to maintain Resource Adequacy in the 2050 timeframe under different levels of carbon
abatement goals, including zero carbon?
1
https://www.ethree.com/projects/study-policies-decarbonize-electric-sector-northwest-public-generating-pool-2017-present/

3 | P a g e
Introduction
© 2018 Energy and Environmental Economics, Inc.
How much effective capacity can be provided by wind, solar, electric energy storage, and demand
response?
How much firm capacity is needed to maintain reliable electric service at various levels of carbon
reductions?
1.4 Report Contents
The remainder of this report is organized as follows:
Section 2 introduces Resource Adequacy and current practices in the Northwest
Section 3 describes the study’s modeling approach
Section 4 highlights key inputs and assumptions used in the modeling
Section 5 presents results across a variety of time horizons and resource portfolios
Section 6 discusses implications of the results
Section 7 summarizes the study’s conclusions and lessons learned

4 | P a g e
Resource Adequacy in the Pacific Northwest
2 Resource Adequacy in the Northwest
2.1 What is Resource Adequacy?
Resource adequacy is the ability of an electric power system to serve load across a broad range of weather
and system operating conditions, subject to a long-run standard on the maximum frequency of reliability
events where generation is insufficient to serve all load. The resource adequacy of a system thus depends
on the characteristics of its load—seasonal patterns, weather sensitivity, hourly patterns—as well as its
resources—size, dispatchability, outage rates, and other limitations on availability. Ensuring resource
adequacy is an important goal for utilities seeking to provide reliable service to their customers.
While utility portfolios are typically designed to meet specified resource adequacy targets, there is no
single mandatory or voluntary national standard for resource adequacy. Across North America, resource
adequacy standards are established by utilities, regulatory commissions, and regional transmission
operators, and each uses its own conventions to do so. The North American Electric Reliability Council
(NERC) and the Western Electric Coordinating Council (WECC) publish information about resource
adequacy but have no formal governing role.
While a variety of approaches are used, the industry best practice is to establish a standard for resource
adequacy using a two-step process:
Loss-of-load-probability (LOLP) modeling: LOLP modeling uses statistical techniques and/or
Monte Carlo approaches to simulate the capability of a generation portfolio to produce sufficient
generation to meet loads across a wide range of different conditions. Utilities plan the system to
meet a specific reliability standard that is measured through LOLP modeling such as the expected
frequency and/or size of reliability events; a relatively common standard used in LOLP modeling

5 | P a g e
Resource Adequacy in the Northwest
© 2018 Energy and Environmental Economics, Inc.
is “one day in ten years,” which is often translated to an expectation of 24 hours of lost load every
ten years, or 2.4 hours per year.
2
Planning reserve margin (PRM) requirements: Utilities then determine the required PRM
necessary to ensure that the system will meet the specific the reliability standard from the LOLP
modeling. A PRM establishes a total requirement for capacity based on the peak demand of an
electric system plus some reserve margin to account for unexpected outages and extreme
conditions; reserve margin requirements typically vary among utilities between 12-19% above
peak demand. To meet this need, capacity from resources that can produce their full power on
demand (e.g., nuclear, gas, coal) are typically counted at or near 100%, whereas resources that
are constrained in their availability or ability to dispatch (e.g., hydro, storage, wind, solar) are
typically de-rated below full capacity.
While LOLP modeling is more technically rigorous, most utilities perform LOLP modeling relatively
infrequently and use a PRM requirement to heuristically ensure compliance with a specific reliability
standard due to its relative simplicity and ease of implementation. The concept and application of a PRM
to measure resource adequacy has historically worked well in a paradigm in which most generation
capacity is “firm”; that is, the resource will be available to dispatch to full capacity, except in the event of
unexpected forced outages. Under this paradigm, as long as the system has sufficient capacity to meet its
peak demand (plus some reserve margin for extreme weather and unexpected forced outages), it will be
capable of serving load throughout the rest of the year as well.
However, growing penetrations of variable (e.g., wind and solar) and energy-limited (e.g., hydro, electric
energy storage, and demand response) resources require the application of increasingly sophisticated
modeling tools to determine the appropriate PRM and to measure the contribution of each resource
towards resource adequacy. Because wind and solar do not always generate during the system peak and
because storage may run out of charge while it is serving the system peak, these resources are often de-
2
Other common interpretations of the “one day in ten year” standard include 1 “event” (of unspecified duration) in ten years or “one hour in ten
years” i.e., 0.1 hrs/yr

6 | P a g e
Resource Adequacy in the Pacific Northwest
rated below the capability of a fully dispatchable thermal generator when counted toward meeting the
PRM.
2.2 Planning Practices in the Northwest
A number of entities within the Northwest conduct analysis and planning for resource adequacy within
the region. Under its charter to ensure prudent management of the region’s federal hydro system while
balancing environmental and energy needs, the Northwest Power and Conservation Council (NWPCC)
conducts regular assessments of the resource adequacy position for the portion of the Northwest region
served by the Bonneville Power Administration. The NWPCC has established an informal reliability target
for the region of 5% annual loss of load probability
3
—a metric that ensures that the region will experience
reliability events in fewer than one in twenty years—and uses GENESYS, a stochastic LOLP model with a
robust treatment of the resource’s variable hydroelectric conditions and capabilities, to examine whether
regional resources are sufficient to meet this target on a five-year ahead basis.
4
These studies provide
valuable information referenced by regulators and utilities throughout the region.
While the work of the Council is widely regarded as the most complete regional assessment of resource
adequacy for the smaller region, the Council itself holds no formal decision-making authority to prescribe
new capacity procurement or to enforce its reliability standards. Instead, the ultimate administration of
resource adequacy lies in the hands of individual utilities, often subject to the oversight of state
commissions. Most resource adequacy planning occurs within the planning and procurement processes
3
This Council’s standard, which focuses only on whether a reliability event occurred within a year, is unique to the Northwest and is not widely used
throughout the rest of the North America
4
The most recent of these reports, the Pacific Northwest Power Supply Adequacy Assessment for 2023, is available at:
https://www.nwcouncil.org/sites/default/files/2018-7.pdf (accessed January 18, 2019).

7 | P a g e
Resource Adequacy in the Northwest
© 2018 Energy and Environmental Economics, Inc.
of utilities: individual utilities submit integrated resource plans (IRPs) that consider long-term resource
adequacy needs and conduct resource solicitations to satisfy those needs.
Utilities rely on a combination of self-owned generation, bilateral contracts, and front-office transactions
(FOTs) to satisfy their resource adequacy requirements. FOTs represent short-term firm market purchases
for physical power delivery. FOTs are contracted on both a month-ahead, day-ahead and hour-ahead
basis. A survey of the utility IRPs in the Northwest reveals that most of the utilities expect to meet a
significant portion of their peak capacity requirements in using FOTs.
FOTs may be available to utilities for several potential reasons including 1) the region as a whole has a
capacity surplus and some generators are uncontracted to a specific utility or 2) natural load diversity
between utilities such that one utility may have excess generation during another’s peak load conditions
and vice versa. The use of FOTs in place of designated firm resources can result in lower costs of providing
electric service, as the cost of contracting with existing resources is generally lower than the cost of
constructing new resources.
However, as loads grow in the region and coal generation retires, the region’s capacity surplus is shrinking,
and questions are emerging about whether sufficient resources will be available for utilities to contract
with for month-ahead and day-ahead capacity products. In a market with tight load-resource balance,
extensive reliance on FOTs risks under-investment in the firm capacity resources needed for reliable load
service.

8 | P a g e
Resource Adequacy in the Pacific Northwest
Table 1: Contribution of FOTs Toward Peak Capacity Requirements in 2018 in the Northwest
Utility
Capacity
Requirement (MW)
Front Office
Transactions (MW)
% of Capacity
Requirement from FOTs
Puget Sound
5
6,100
1,800
30%
Avista
6
2,150
-
0%
Idaho Power
7
3,078
313
10%
PacifiCorp
8
11,645
462
4%
BPA
9
11,506
-
0%
PGE
10
4,209
106
3%
NorthWestern
11
1,205
503
42%
5
Figure 6-7: Available Mid C Tx plus Additional Mid-C Tx w/ renewals in PSE 2017 IRP: https://www.pse.com/-/media/PDFs/001-Energy-Supply/001-
Resource-Planning/8a_2017_PSE_IRP_Chapter_book_compressed_110717.pdf?la=en&revision=bb9e004c-9da0-4f75-a594-
6c30dd6223f4&hash=75800198E4E8517954C63B3D01E498F2C5AC10C2
6
Figure 6.1 (for peak load), Chapter 4 Tables for resources in Avista 2017 IRP: https://www.myavista.com/-/media/myavista/content-
documents/about-us/our-company/irp-documents/2017-electric-irp-final.pdf?la=en
7
Table 9.11 in Idaho Power 2017 IRP: https://docs.idahopower.com/pdfs/AboutUs/PlanningForFuture/irp/IRP.pdf
8
Table 5.2 in PacifiCorp 2017 IRP (Interruptible Contracts + Purchases):
https://www.pacificorp.com/content/dam/pacificorp/doc/Energy_Sources/Integrated_Resource_Plan/2017_IRP/2017_IRP_VolumeI_IRP_Final.pdf
9
Bottom of the page in BPA fact sheet: https://www.bpa.gov/news/pubs/GeneralPublications/gi-BPA-Facts.pdf
10
PGE 2016 IRP Table P-1 Spot Market Purchases (rounded from 106), Capacity Need : https://www.portlandgeneral.com/our-company/energy-
strategy/resource-planning/integrated-resource-planning/2016-irp
11
Table 2-2 for peak load and netted out existing resources (Ch. 8) @ 12%PRM from NorthWestern Energy 2015 IRP:
https://www.northwesternenergy.com/our-company/regulatory-environment/2015-electricity-supply-resource-procurement-plan

9 | P a g e
Modeling Approach
© 2018 Energy and Environmental Economics, Inc.
3 Modeling Approach
3.1 Renewable Energy Capacity Planning (RECAP) Model
3.1.1 MODEL OVERVIEW
This study assesses the resource adequacy of electric generating resource portfolios for different
decarbonization scenarios in the Northwest region using E3’s Renewable Energy Capacity Planning
(RECAP) model. RECAP is a loss-of-load-probability model developed by E3 that has been used extensively
to test the resource adequacy of electric systems across the North American continent, including
California, Hawaii, Canada, the Pacific Northwest, the Upper Midwest, Texas, and Florida.
RECAP calculates a number of reliability metrics which are used to assess the resource adequacy for an
electricity system with a given set of loads and generating resources.
Loss of Load Expectation (hrs/yr) – LOLE
o The total number of hours in a year where load + reserves exceeds generation
Expected Unserved Energy (MWh/yr) – EUE
o The total quantity of unserved energy in a year when load + reserves exceeds generation
Loss of Load Probability (%/yr) – LOLP
o The probability in a year that load + reserves exceeds generation at any time
Effective Load Carrying Capability (%) – ELCC
o The additional load met by an incremental generator while maintaining the same level of
system reliability (used for dispatch-limited resources such as wind, solar, storage, hydro,
and demand response). Equivalently, this is the quantity of perfectly dispatchable

10 | P a g e
Resource Adequacy in the Pacific Northwest
generation that could be removed from the system by an incremental dispatch-limited
generator
Planning Reserve Margin (%) – PRM
o The resource margin above a 1-in-2 peak load, in %, that is required in order to meet a
specific reliability standard (such as 2.4 hrs./yr. LOLE)
This study uses 2.4 hrs./yr. LOLE reliability standard which is based on a commonly accepted 1-day-in-10-
year standard. All portfolios that are developed by RECAP in this analysis for resource adequacy are
designed to meet a 2.4 hrs./yr. LOLE standard.
RECAP calculates reliability statistics by simulating the electric system with a specific set of generating
resources and loads under a wide variety of weather years, renewable generation years, and stochastic
forced outages of electric generation resources and imports on transmission. By simulating the system
thousands of times with different combinations of these factors, RECAP provides robust, stochastic
estimation of LOLE and other reliability statistics.
RECAP was specifically designed to calculate the reliability of electric systems operating under high
penetrations of renewable energy and storage. Correlations enforced within the model capture linkage
among load, weather, and renewable generation conditions. Time-sequential simulation tracks the state
of charge and energy availability for dispatch-limited resources such as hydro, energy storage, and
demand response.
3.1.2 MODEL METHODOLOGY
The steps of the RECAP modeling process are shown below in Figure 1. RECAP calculates long-run resource
availability through Monte Carlo simulation of electricity system resource availability using weather
conditions from 1948-2017. Each simulation begins on January 1, 1948 and runs hourly through December
31, 2017. Hourly electric loads for 1948-2017 are synthesized using statistical analysis of actual load
shapes and weather conditions for 2014-2017 combined with recorded historical weather conditions.

11 | P a g e
Modeling Approach
© 2018 Energy and Environmental Economics, Inc.
Then, hourly wind and solar generation profiles are drawn from simulations created by the National
Renewable Energy Laboratory (NREL) and paired with historical weather days through an E3-created day-
matching algorithm. Next, nameplate capacity and forced outage rates (FOR) for thermal generation are
drawn from various sources including the GENESYS database and the Western Electric Coordinating
Council’s Anchor Data Set. Hydro is dispatched based on the load net of renewable and thermal
generation. Annual hydro generation values are drawn randomly from 1929-2008 water years and shaped
to calendar months and weeks based on the Northwest Power and Conservation Council’s GENESYS
model. For each hydro year, we identify all the hydro dispatch constraints including maximum and
minimum power capacity, 2-hour to 10-hour sustained peaking limits, and hydro budget, specific to the
randomly-drawn hydro condition. For each x-hour sustained peaking limit (where x = 2, 4, and 10), RECAP
dispatches hydro so that the average capacity over consecutive x hours does not exceed the sustained
peaking capability. Overall, hydro is dispatched to minimize the post-hydro net load subject to the above
constraints. In other words, hydro is used within assumed constraints to meet peak load needs while
minimizing loss-of-load. Finally, RECAP uses storage and demand response to tackle the loss-of-load hours
and storage is only discharged during loss-of-load hours. A more detailed description of the RECAP model
is in Appendix B.2.

12 | P a g e
Resource Adequacy in the Pacific Northwest
Figure 1: Overview of RECAP Model
3.1.3 PORTFOLIO DEVELOPMENT
RECAP is used in this study to both test the reliability of the existing 2018 Greater Northwest electricity
system as well as to determine a total capacity need in 2030 and to develop portfolios in 2050 under
various levels of decarbonization that meet a 1-day-in-10-year reliability standard of 2.4 hrs./yr.
To develop each 2050 decarbonization portfolio, RECAP calculates the reliability of the system in 2050
after forecasted load growth and the removal of all fossil generation but the maintenance of all existing
carbon-free resources. Unsurprisingly, these portfolios are significantly less reliable than the required 2.4
hrs./yr. nor do they deliver enough carbon-free generation to meet the various decarbonization targets.
To improve the reliability and increase GHG-free generation of these portfolios, RECAP tests the

13 | P a g e
Modeling Approach
© 2018 Energy and Environmental Economics, Inc.
contribution of small, equal-cost increments of candidate GHG-free resources. The seven candidate
resources in this study are:
Northwest Wind (WA/OR)
Montana Wind
Wyoming Wind
Solar (based on an assumed diverse mix of resources from each state)
4-Hour Storage
8-Hour Storage
16-Hour Storage
The resource that improves reliability the most (as measured in loss-of-load-expectation) is then added
to the system. This process is repeated until the delivered GHG-free generation is sufficient to meet the
GHG target (e.g., 80% reduction) for each particular scenario. Once a portfolio has achieved the objective
GHG target, RECAP calculates the residual quantity of perfect firm capacity that is needed to bring the
portfolio in compliance with a reliability standard of 2.4 hrs./yr. This perfect firm MW capacity is converted
to MW of natural gas capacity by grossing up by 5% to account for forced outages. Natural gas capacity is
used because it is the most economic source of firm capacity. To the extent that other carbon-free
resources can substitute for natural gas capacity, this is reflected in deeper decarbonization portfolios
that have higher quantities of wind, solar, and storage along with a smaller residual requirement for firm
natural gas capacity.
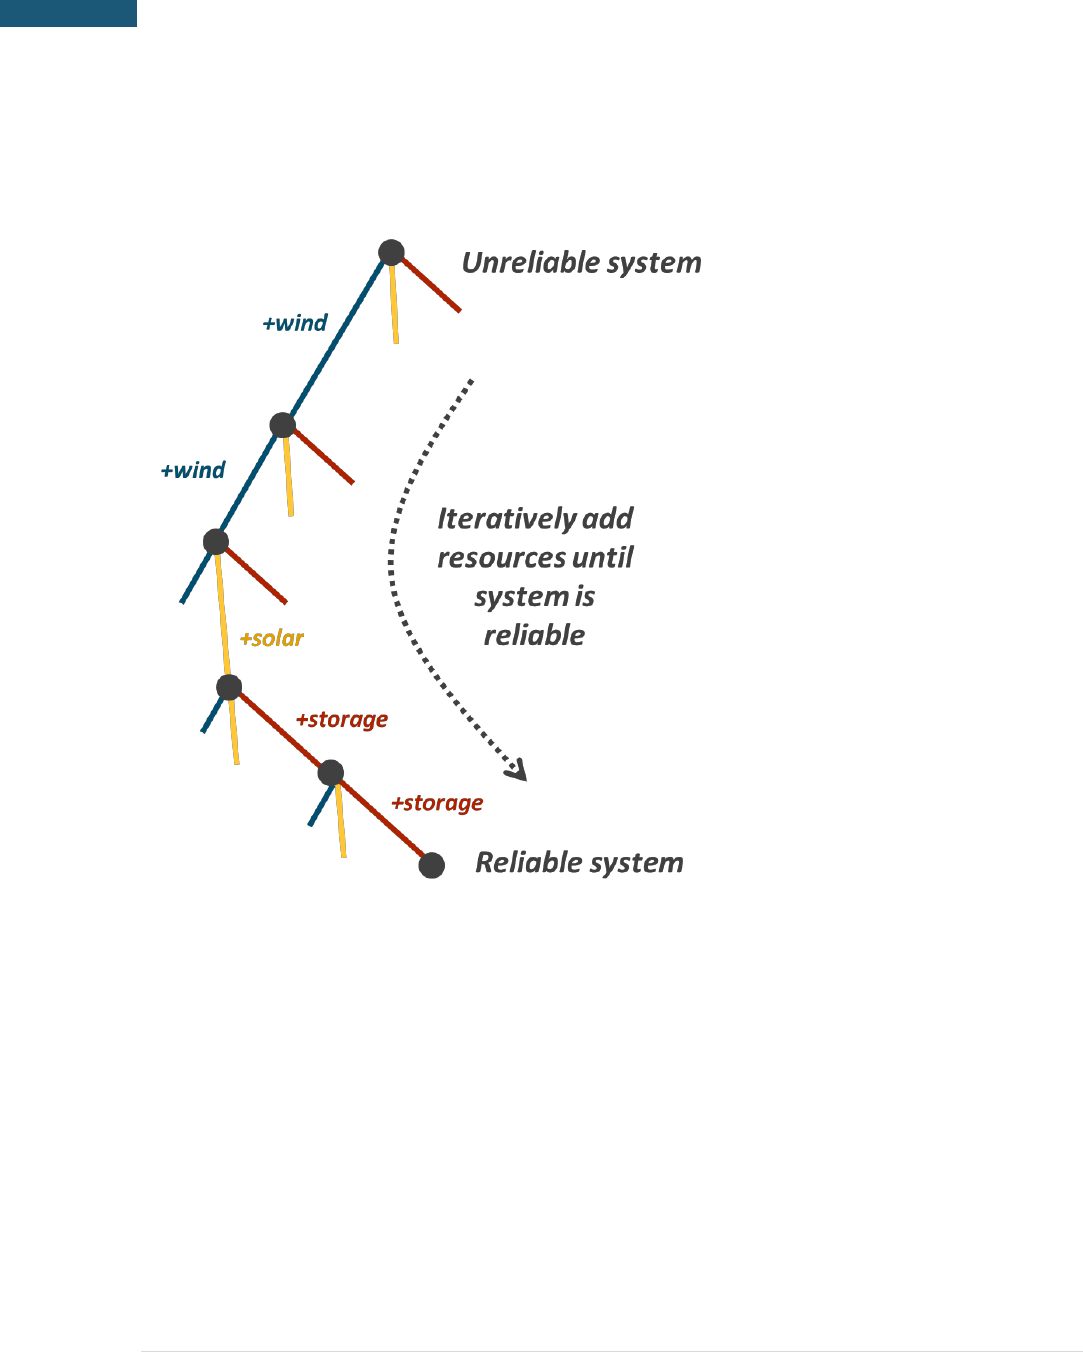
Figure 2 illustrates a simple example of this portfolio development process where RECAP has 3 candidate
resources: wind, solar, and storage. The model evaluates the contribution to reliability of equal-cost
increments of the three candidate resources and selects the resource that improves reliability the most.
From that new portfolio, the process is repeated until either the system reaches a reliability standard of
2.4 or a particular GHG target is achieved.
14 | P a g e
Resource Adequacy in the Pacific Northwest
Figure 2: RECAP Portfolio Development Process
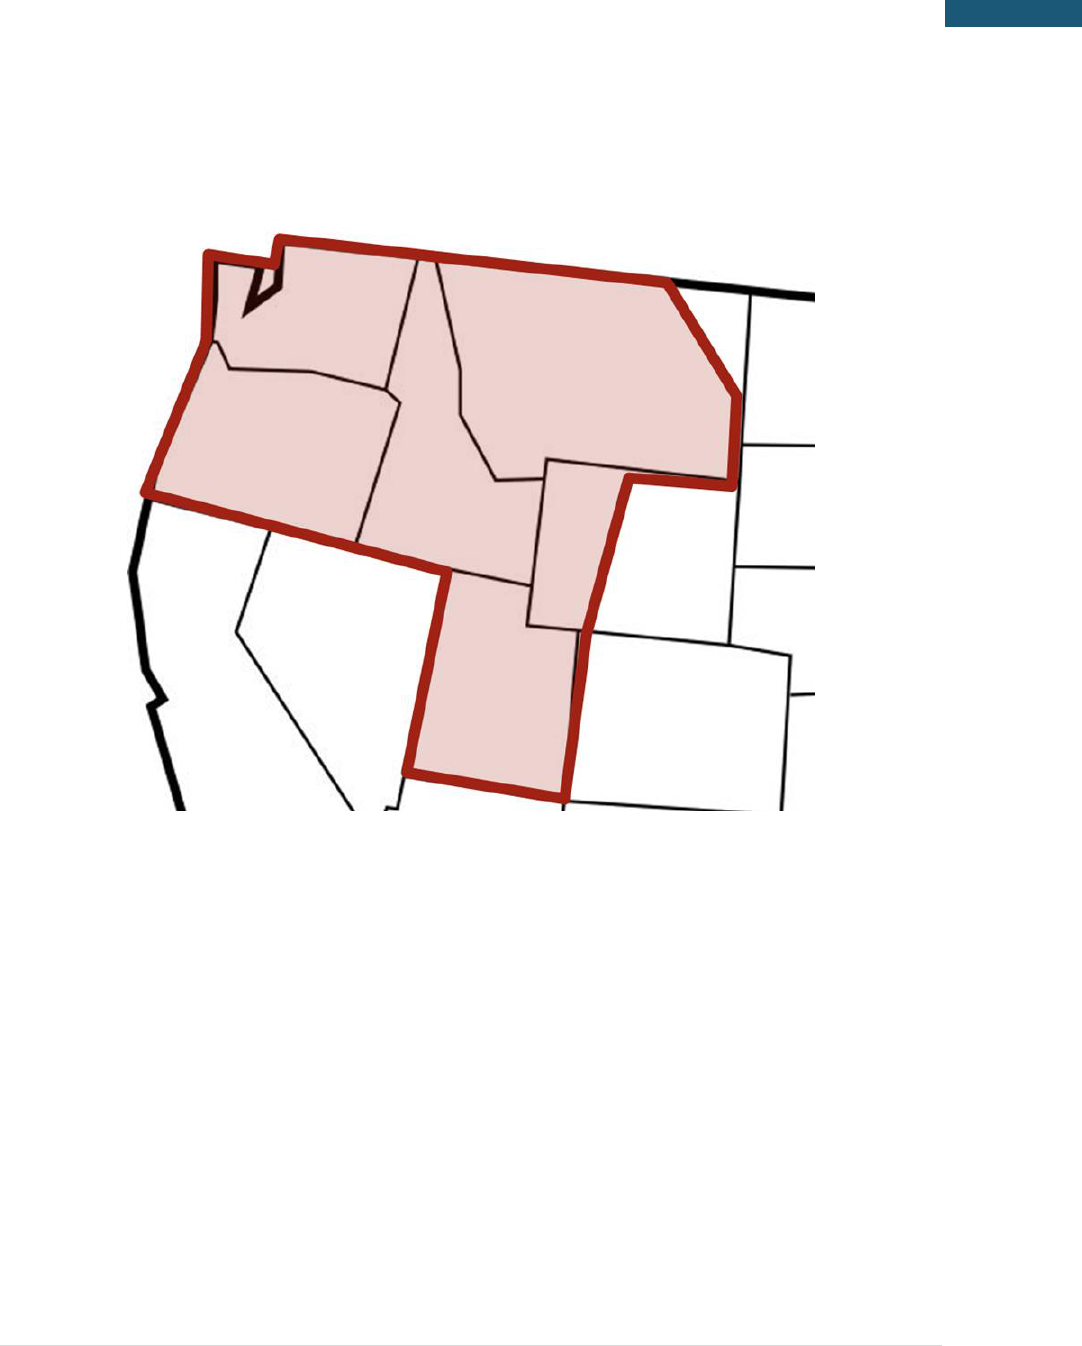
3.2 Study Region
The geographic region for this study consists of the U.S. portion of the Northwest Power Pool (NWPP),
excluding Nevada, which this study refers to as the “Greater Northwest”. This region includes the states
of Washington, Oregon, Idaho, Utah, and parts of Montana and Wyoming.
15 | P a g e
Modeling Approach
© 2018 Energy and Environmental Economics, Inc.
Figure 3: The study region - The Greater Northwest
It is important to note that this is a larger region than was analyzed in the prior E3 decarbonization work
in the Northwest which only analyzed a “Core Northwest” region consisting of Oregon, Washington,
northern Idaho and Western Montana. The larger footprint encompasses the utilities that have
traditionally coordinated operational efficiencies through programs under the Northwest Power Pool and
includes utilities that typically transact with each other to maintain resource adequacy and optimize
resource portfolios. The larger region also incorporates a footprint that allows for diversity of both load
and resources which minimizes the need for firm capacity. The Balancing Authority Areas (BAAs) that were
included in this Greater Northwest study region are listed in Table 2.

16 | P a g e
Resource Adequacy in the Pacific Northwest
Table 2: List of Balancing Authorities Included in Study
Balancing Authority Areas Included in Greater Northwest Study Region
Avista
Bonneville Power
Administration
Chelan County PUD
Douglas County PUD
Grant County PUD
Idaho Power
NorthWestern
PacifiCorp East
PacifiCorp West
Portland General
Electric
Puget Sound Energy
Seattle City Light
Tacoma Power
Western Area Power
Administration Upper
Great Plains
3.3 Scenarios & Sensitivities
This study examines the resource adequacy requirements of the Greater Northwest region across multiple
timeframes and decarbonization scenarios.
Near-term (2018) reliability statistics are calculated for today’s system based on 2018 existing
loads and resources. These results are presented to give the reader a sense of existing challenges
and as a reference for other scenario results.
Medium-term (2030) reliability statistics are calculated in 2030 for two scenarios: a Reference
scenario and a No Coal scenario. The Reference scenario includes the impact of expected load
growth and announced generation retirements, notably the Boardman, Centralia, and Colstrip
coal plants. The No Coal scenario assumes that all coal is retired.
Long-term (2050) reliability statistics are calculated in 2050 for multiple scenarios including a
Reference scenario and for a range of decarbonization targets. The Reference scenario includes
the impact of load growth, growth in renewable capacity to meet current RPS policy goals, and
the retirement of all coal. Decarbonization scenarios assume GHG emissions are reduced to 60%,
80%, 90%, 98% and 100% below 1990 GHG levels through the addition of wind, solar, and electric
energy storage.

17 | P a g e
Modeling Approach
© 2018 Energy and Environmental Economics, Inc.
These scenarios are summarized in Table 3.
Table 3: List of Scenarios and Descriptions
Analysis Period
Scenario
Description
Near-term (2018)
Reference
2018 Existing Loads and Resources
Medium-Term
(2030)
Reference
Includes load growth through 2030 and announced
generation retirements, notably the Boardman,
Centralia, and Colstrip coal plants
No Coal
Same as 2030 reference but all coal generation in
the region is retired (11 GW)
Long-Term (2050)
Reference
Includes load growth through 2050, renewable
capacity additions to meet RPS targets, and
retirement of all coal generation (11 GW)
60% GHG Reduction
Scenarios achieve specified greenhouse gas
reduction (relative to 1990 levels) through addition
of solar, wind, and energy storage; sufficient gas
generating capacity is maintained to ensure
reliability (except in 100% GHG Reduction)
80% GHG Reduction
90% GHG Reduction
98% GHG Reduction
100% GHG Reduction
This study further explores the potential resource adequacy needs of a 100% carbon free electricity
system in 2050 recognizing that emerging technologies beyond wind, solar, and electric energy storage
that are not yet available today may come to play a significant role in the region’s energy future. To better
understand how those technologies might impact the viability of achieving this ambitious goal, the study
includes several sensitivity analyses of the 100% GHG Reduction scenario that assume the wide-scale
availability of several such emerging technology options. These sensitivities are described in Table 4.

18 | P a g e
Resource Adequacy in the Pacific Northwest
Table 4: 100% GHG Reduction in 2050 Sensitivities
Sensitivity Name
Description
Clean Baseload
Assesses the impact of technology that generates reliable baseload
power with zero GHG emissions. This scenario might require a
technology such as a small modular nuclear reactor (SMR), fossil
generation with 100% carbon capture and sequestration, or other
undeveloped or commercially unproven technology.
Ultra-Long Duration Storage
Assesses the impact of an ultra-long duration electric energy storage
technology (e.g., 100’s of hours) that can be used to integrate wind
and solar. This technology is not commercially available today at
reasonable cost.
Biogas
Assesses the impact of a GHG free fuel (e.g., biogas, renewable natural
gas, etc.) that could be used with existing dispatchable generation
capacity.
3.4 Key Portfolio Metrics
Each of the scenarios is evaluated using several different metrics which are defined below:
3.4.1 CLEAN ENERGY METRICS
A number of metrics are used to characterize the greenhouse gas content of generation within the region
in each of the scenarios. These are:
Greenhouse Gas Emissions (MMT CO2): the annual quantity of greenhouse gas emissions
attributed to ratepayers of the Greater Northwest region, measured in million metric tons.
Greenhouse Gas Reduction (%): the reduction below 1990 emission levels (approximately 60
million metric tons) for the Greater Northwest region.
Clean Portfolio Standard (%): the total quantity of GHG-free generation (including renewable,
hydro, and nuclear) divided by retail electricity sales. Because this metric allows the region to
retain the clean attribute for exported electricity and offset in-region or imported natural gas

19 | P a g e
Modeling Approach
© 2018 Energy and Environmental Economics, Inc.
generation, this metric can achieve or exceed 100% without reducing GHGs to zero. This metric is
presented because it is a common policy target metric across many jurisdictions to measure clean
energy progress and is the near-universal metric used for state-level Renewables Portfolio
Standards. This metric is consistent with California’s SB 100 which mandates 100% clean energy
by 2045.
GHG-Free Generation (%): the total quantity of GHG-free generation, minus exported GHG-free
generation, divided by total wholesale load. For this metric, exported clean energy cannot be
netted against in-region or imported natural gas generation. When this metric reaches 100%, GHG
emissions have been reduced to zero.
3.4.2 COST METRICS
Renewable Curtailment (%): the total quantity of wind and solar generation that cannot be
delivered to loads in the region or exported, expressed as a share of total available potential
generation from wind and solar resources.
Annual Cost Delta ($B) is the annual cost in 2050 of decarbonization scenarios relative to the 2050
Reference scenario. While the 2050 Reference scenario will require significant costs to meet load
growth, this metric only evaluates the change in costs for each decarbonization scenario relative
to the Reference scenario. By definition, the 2050 Reference scenario has an annual cost delta of
zero. The annual cost delta is calculated by comparing the incremental cost of new wind, solar,
and storage resources to the avoided cost of natural gas capital and operational costs.
Additional Cost ($/MWh) is the total annual cost delta ($B) divided by total wholesale load, which
provides an average measure of the incremental rate impact borne by ratepayers within the
region. While this metric helps to contextualize the annual cost delta, it is important to note that
the incremental cost will not be borne equally by all load within the Greater Northwest region
and some utilities may experience higher additional costs.

20 | P a g e
Resource Adequacy in the Pacific Northwest
3.5 Study Caveats
3.5.1 COST RESULTS
The study reports the incremental costs of achieving various GHG targets relative to the cost of the
reference scenario. While the method used to estimate capital and dispatch costs is robust, it does not
entail optimization and the results should be regarded as high-level estimates. For this reason, a range of
potential incremental costs are reported rather than a point estimate. The range is determined by varying
the cost of wind, solar, energy storage and natural gas.
3.5.2 HYDRO DISPATCH
For this study, RECAP utilizes a range of hydro conditions based on NWPCC data covering the time period
1929 – 2008. Within each hydro year, hydroelectric energy “budgets” for each month are allocated to
individual weeks and then dispatched to minimize net load, subject to sustained peaking limit constraints
that are appropriate for the water conditions. Hydro resources are dispatched optimally within each week
with perfect foresight. There are many real-life issues such as biological conditions, flood control,
coordination between different project operators, and others that may constrain hydro operations further
than what is assumed for this study.
3.5.3 TRANSMISSION CONSTRAINTS
This analysis treats the Greater Northwest region as one zone with no internal transmission constraints
or transactional friction. In reality, there are constraints in the region that may prevent a resource in one
corner of the region from being able to serve load in another corner. To the extent that constraints exist,
the Greater Northwest region may be less resource adequate than is calculated in this study and additional
effective capacity would be required to achieve the calculated level of resource adequacy. It is assumed
that new transmission can be developed to deliver energy from new renewable resources to wherever it

21 | P a g e
Modeling Approach
© 2018 Energy and Environmental Economics, Inc.
is needed, for a cost that is represented by the generic transmission cost adder applied to resources in
different locations.
3.5.4 INDIVIDUAL UTILITY RESULTS
Cost and resource results in this study are presented from the system perspective and represent an
aggregation of the entire Greater Northwest region. These societal costs include all capital investment
costs (i.e., “steel in the ground”) and operational costs (i.e., fuel and operation and maintenance) that are
incurred in the region. The question of how these societal costs are allocated between individual utilities
is not addressed in this study, but costs for individual utilities may be higher or lower compared to the
region as a whole. Utilities with a relatively higher composition of fossil resources today are likely to bear
a higher cost than utilities with a higher composition of fossil-free resources.
Resource adequacy needs will also be different for each utility as individual systems will need a higher
planning reserve margin than the Greater Northwest region as a whole due to smaller size and less
diversity. The capacity contribution of renewables will be different for individual utilities due to
differences in the timing of peak loads and renewable generation production.
3.5.5 RENEWABLE RESOURCE AVALIBILITY AND LAND USE
The renewable resource availability assumed for this study is based on technical potential as assessed by
NREL. It is assumed wind and solar generation can be developed in each location modeled in this study up
to the technical potential. However, the land consumption is significant for some scenarios and it is not
clear whether enough suitable sites can be found to develop the large quantities of resources needed for
some scenarios. Land use is also a significant concern for the new transmission corridors that would be
required.

22 | P a g e
Resource Adequacy in the Pacific Northwest
4 Key Inputs & Assumptions
4.1 Load Forecast
The Greater Northwest region had an annual load of 247 TWh and peak load of 43 GW in 2017. This data
was obtained by aggregating hourly load data from the Western Electric Coordinating Council (WECC) for
each of the selected balancing authority areas in the Greater Northwest region.
This study assumes annual load growth of 1.3% pre-energy efficiency and 0.7% post-energy efficiency.
This assumption is consistent with the previous E3 decarbonization work for Oregon and Washington and
is benchmarked to multiple long-term publicly available projections listed in Table 5. The post-energy
efficiency growth rate includes the impact of all cost-effective energy efficiency identified by the NWPCC,
scaled up to the full Greater Northwest region and assumed to continue beyond the end of the Council’s
time horizon. Electrification of vehicles and buildings is only included to the extent that it is reflected in
these load growth forecasts. For example, the NWPCC forecast includes the impact of 1.1 million electric
vehicles by 2030.
In general, E3 believes these load growth forecasts are conservatively low because they exclude the effect
of vehicle and building electrification that would be expected in a deeply decarbonized economy. To the
extent that electrification is higher than forecasted in this study, resource adequacy requirements would
also increase. In this study, total loads increase 25% by 2050, whereas other studies
12
that have
comprehensively examined cost-effective strategies for economy-wide decarbonization include
12
https://www.ethree.com/wp-content/uploads/2018/06/Deep_Decarbonization_in_a_High_Renewables_Future_CEC-500-2018-012-1.pdf
23 | P a g e
Key Inputs & Assumptions
© 2018 Energy and Environmental Economics, Inc.
significant quantities of building, vehicle, and industry electrification that cause electricity-sector loads to
grow by upwards of 60% by 2050 even with significant investments in energy efficiency.
Table 5. Annual load growth forecasts for the Northwest
Source
Pre EE
Post EE
PNUCC Load Forecast
1.7%
0.9%
BPA White Book
1.1%
-
NWPCC 7
th
Plan
0.9%
0.0%
WECC TEPPC 2026 Common Case
-
1.3%
E3 Assumption
1.3%
0.7%
Hourly load profiles are assumed to be constant through the analysis period and do not account for any
potential impact due to electrification of loads or climate change. The Greater Northwest system is a
winter peaking system with loads that are highest during cold snaps on December and January mornings
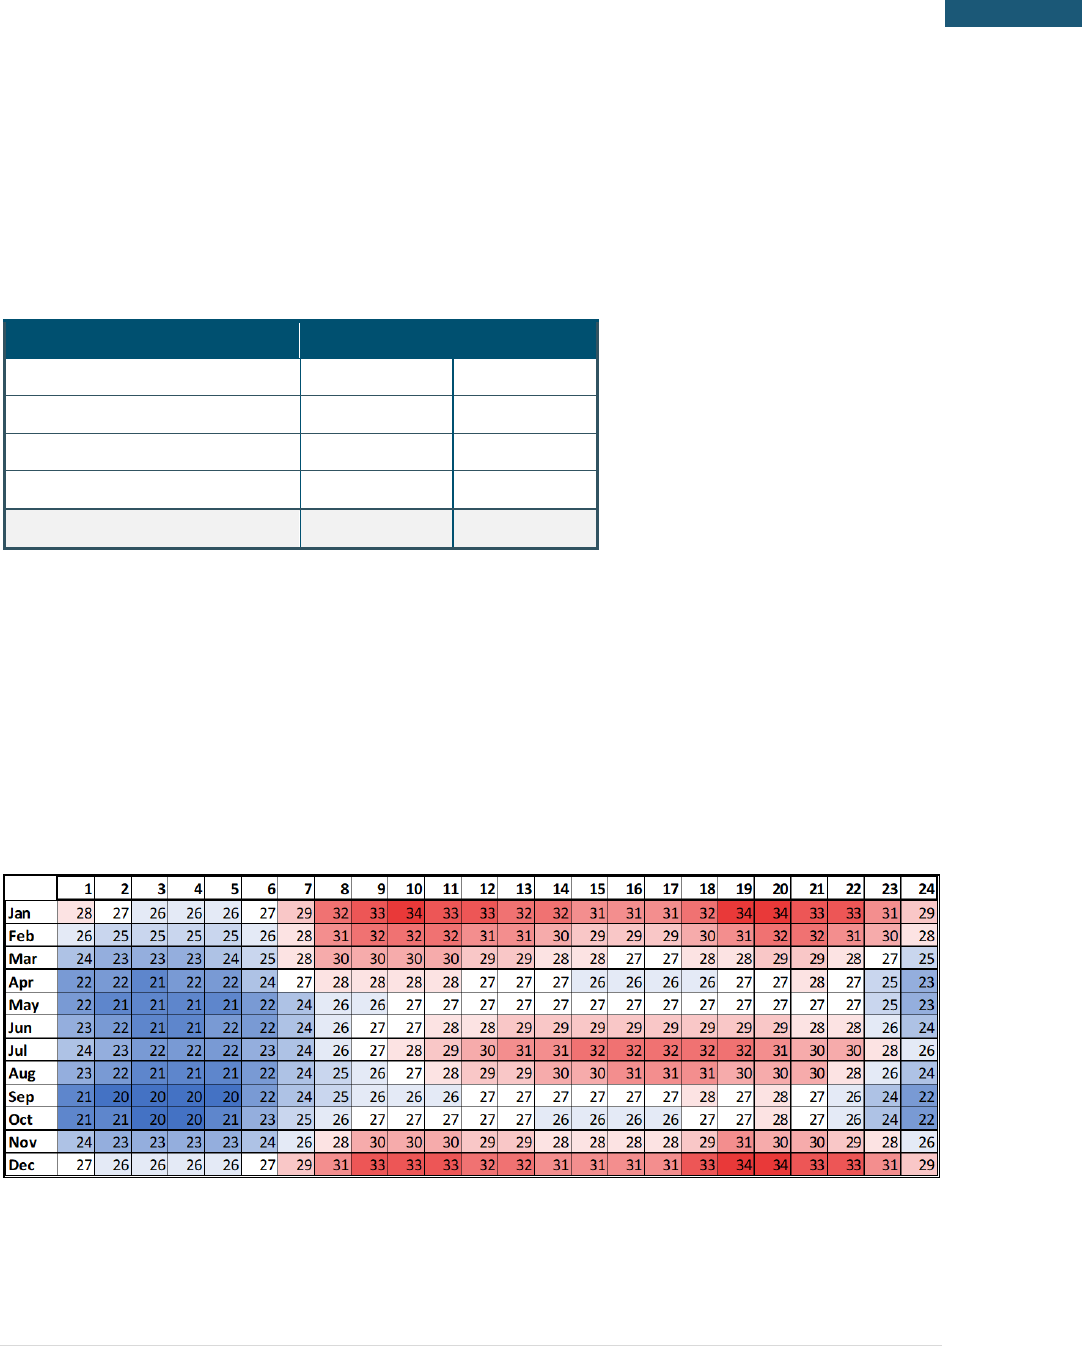
and evenings. An illustration of the average month/hour load profile for the Greater Northwest is shown
in Figure 4.
Figure 4: Month/Hour Average Hourly Load in the Greater Northwest (GW)
24 | P a g e
Resource Adequacy in the Pacific Northwest
Projecting these hourly loads using the post-energy efficiency load growth forecasts yields the following
load projections in 2030 and 2050.
Table 6. Load projections in 2030 and 2050 for the Greater NW Region
Load
2018
2030
2050
Median Peak Load (GW)
43
47
54
Annual Energy Load (TWh)
247
269
309
To evaluate the reliability of the Greater Northwest system under a range of weather conditions, hourly
load forecasts for 2030 and 2050 are developed over seventy years of weather conditions (1948-2017).
Historical weather data was obtained from the National Oceanic and Atmospheric Administration (NOAA)
for the following sites in the Greater Northwest region.
Table 7: List of NOAA Sites for Historical Temperature Data
City
Site ID
Billings, MT
USW00024033
Boise, ID
USW00024131
Portland, OR
USW00024229
Salt Lake City, UT
USW00024127
Seattle, WA
USW00024233
Spokane, WA
USW00024157
4.2 Existing Resources
A dataset of existing generating resources in the Greater Northwest was derived from two sources: 1) the
NWPCC’s GENESYS model, used to characterize all plants within the Council’s planning footprint; and 2)
25 | P a g e
Key Inputs & Assumptions
© 2018 Energy and Environmental Economics, Inc.
the WECC’s Anchor Data Set, used to gather input data for all existing plants in areas outside of the
NWPCC’s footprint. For each resource, the dataset contains:
Dependable capacity (MW)
Location
Commission and announced retirement date
Forced outage rate (FOR) and mean time to repair (MTTR)
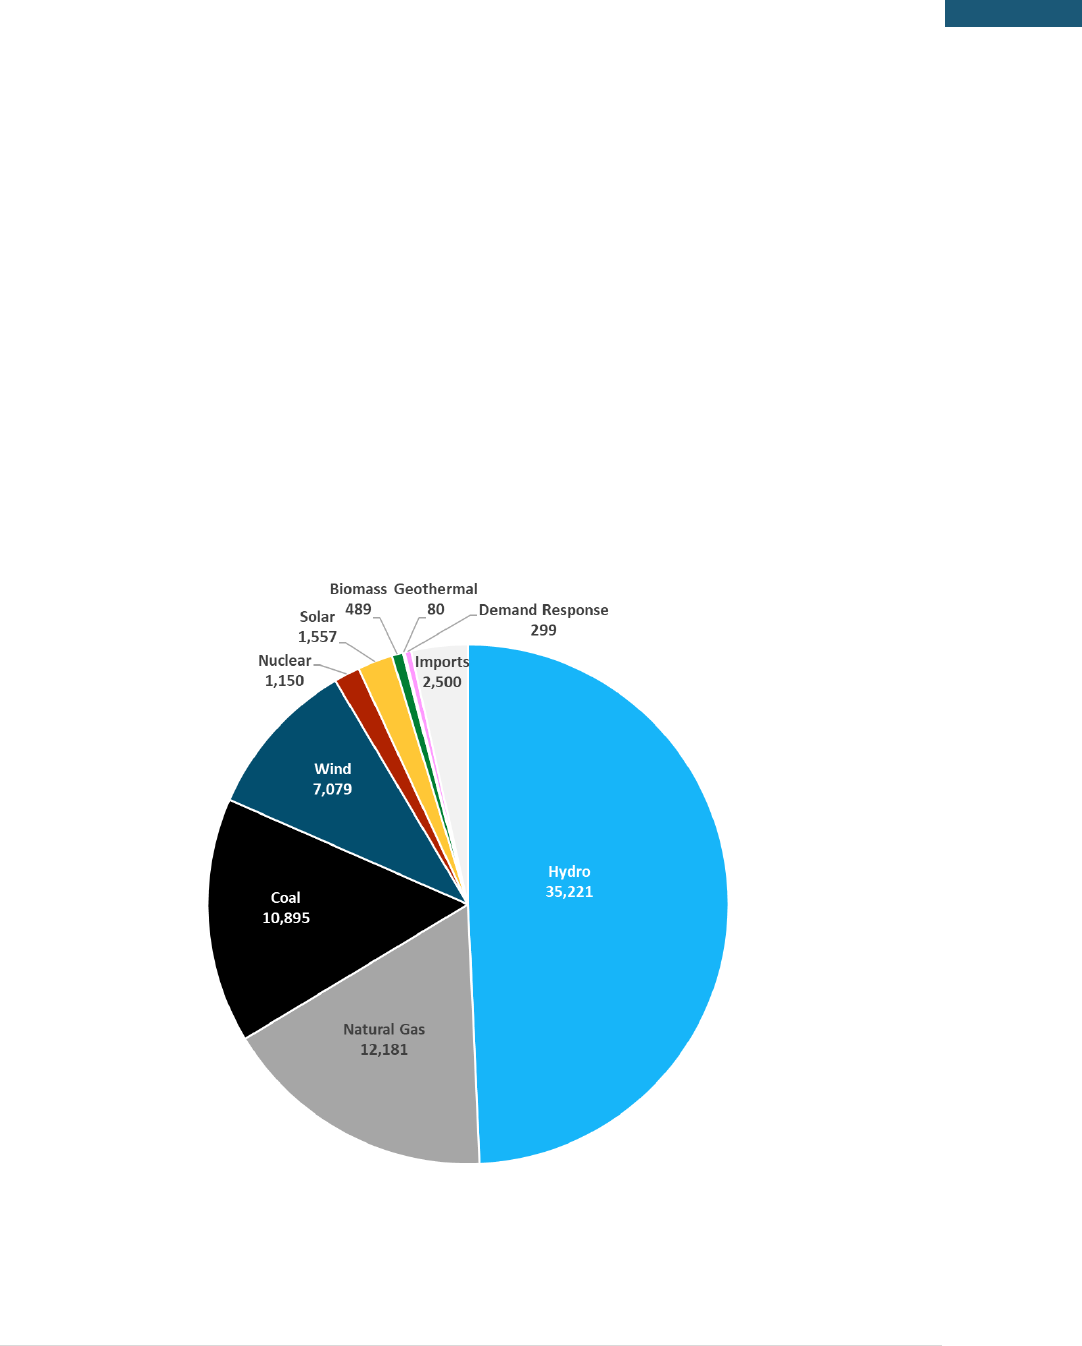
A breakdown of existing resources by type is shown in Figure 5.
Figure 5: Existing 2018 Installed Capacity (MW) by Resource Type

26 | P a g e
Resource Adequacy in the Pacific Northwest
Several power plants have announced plans to retire one or more units. The table below lists the notable
coal and natural gas planned retirements through 2030.
Table 8: Planned Coal and Natural Gas Retirements
Power Plant
Resource Type
Capacity (MW)
Boardman
Coal
522
Centralia
Coal
1,340
Colstrip 1 & 2
Coal
614
North Valmy
Coal
261
Naughton
Natural Gas
330
4.2.1 WIND AND SOLAR PROFILES
Hourly wind and solar data were collected for each existing resource in the combined dataset at the
location of the resource. For wind, NREL’s Wind Integration National Dataset Toolkit was used which
includes historical hourly wind speed data from 2007-2012. For solar, NREL’s Solar Prospector Database
was used which includes historical hourly solar insolation data from 1998-2012. These hourly wind speeds
and solar insolation values were then converted into power generation values using the NREL System
Advisor Model (SAM) under assumptions for wind turbine characteristics (turbine power curve and hub
height) and solar panel characteristics (solar inverter ratio). RECAP simulates future electricity generation
from existing wind and solar resources using the historical wind speed data and solar insolation data
respectively.
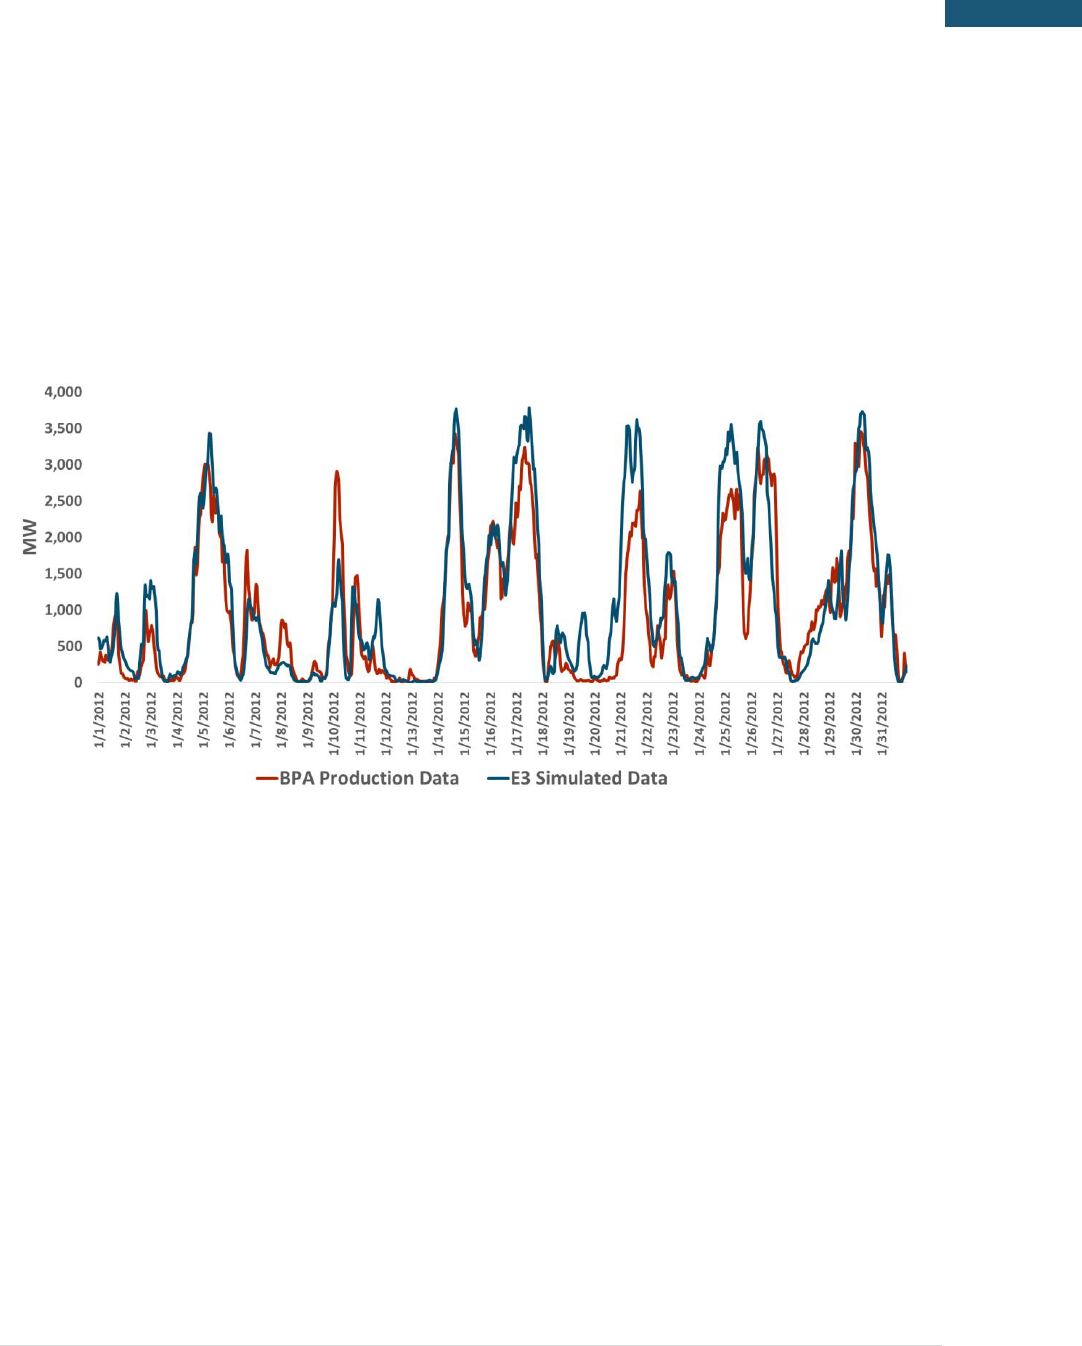
Simulated wind generation from existing wind plants within BPA territory was benchmarked to historical
wind production data
13
. To simulate wind generation from existing plants accurately, wind turbine
13
BPA publishes production from wind plants within its Balancing Authority Area in 5-min increments:
https://transmission.bpa.gov/Business/Operations/Wind/default.aspx
27 | P a g e
Key Inputs & Assumptions
© 2018 Energy and Environmental Economics, Inc.
technology (power curve and hub height) varies for each existing wind farm, based on the year of
installation. Figure 6 shows how the simulated wind production compares to historical wind production
in BPA territory in January 2012.
Figure 6: Comparison of historical wind generation to simulated wind production for January 2012
A detailed description of the renewable profile simulation process is described in Appendix C.
4.2.2 HYDRO
Hydro availability is based on a random distribution of the historical hydro record using the water years
from 1929-2008. This data was obtained from the NWPCC’s GENESYS model. Future electricity generation
from existing hydro resources is simulated using the historical hydro availability. Available hydro energy
is dispatched in RECAP subject to sustained peaking limits (1-hr, 2-hr, 4-hr, 10-hr) and minimum output
levels. The sustained peaking limits are based on detailed hydrological models developed by NWPCC.
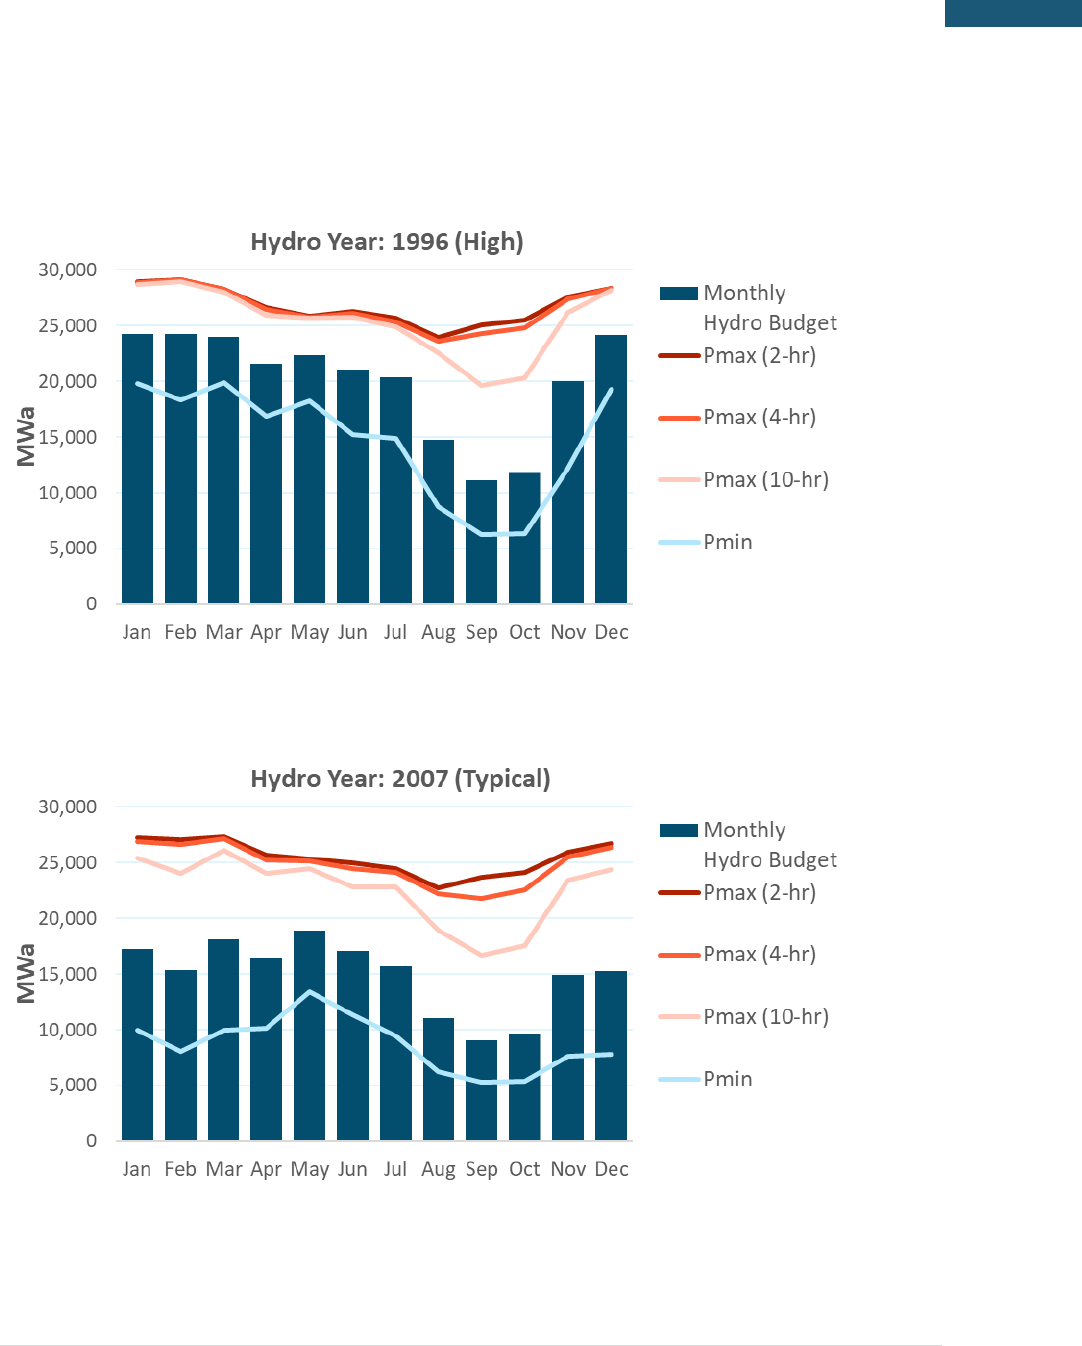
Available hydro budgets, sustained peaking limits, and minimum output levels are shown for three hydro
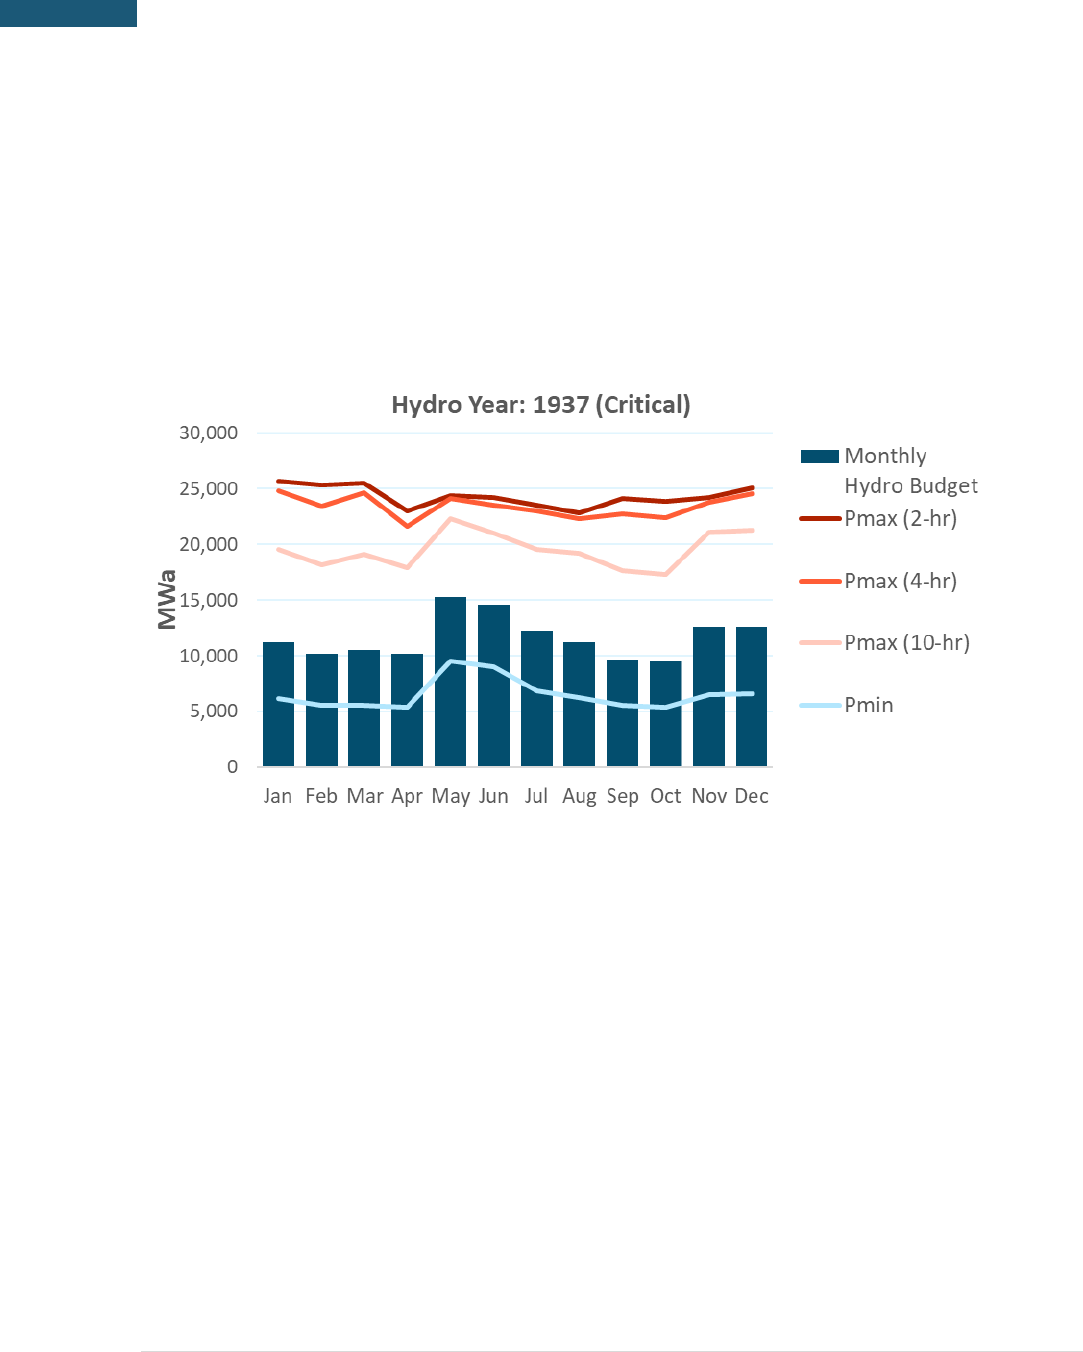
28 | P a g e
Resource Adequacy in the Pacific Northwest
years – 1937 (critical hydro year), 1996 (high hydro year), and 2007 (typical hydro year). The 10-hour
sustained peaking limits for each month represent the maximum average generation for any continuous
10-hour period within the month.
Figure 7: Monthly budgets, sustained peaking limits and minimum outputs levels for 1937 (critical hydro)
29 | P a g e
Key Inputs & Assumptions
© 2018 Energy and Environmental Economics, Inc.
Figure 8: Monthly budgets, sustained peaking limits and minimum outputs levels for 1996 (high hydro)
Figure 9: Monthly budgets, sustained peaking limits and minimum outputs levels for 2007 (typical hydro)
30 | P a g e
Resource Adequacy in the Pacific Northwest
4.2.3 IMPORTS/EXPORTS
The Greater Northwest region is treated as one zone within the model, but it does have the ability to
import and export energy with neighboring regions, notably California, Canada, Rocky Mountains, and the
Southwest. Import and export assumptions used in this model are consistent with the NWPCC’s GENESYS
model and are listed in Table 9. Monthly and hourly import availabilities are additive but in no hour can
exceed the simultaneous import limit of 3,400 MW. In the 100% GHG Reduction scenarios, import
availability is set to zero to prevent the region from relying on fossil fuel imports.
Table 9: Import Limits
Import Type
Availability
MW
Monthly Imports
Nov – Mar
2,500
Oct
1,250
Apr – Sep
-
Hourly Imports
HE 22 – HE 5
3,000
HE 5 – HE 22
-
Simultaneous Import Limit
All Hours
3,400
For the purposes of calculating the CPS % metric i.e., “clean portfolio standard”, the model assumes an
instantaneous exports limit of 7,200 MW in all hours.
Table 10: Export Limit
Export Type
Availability
MW
Simultaneous Export Limit
All Hours
7,200

31 | P a g e
Key Inputs & Assumptions
© 2018 Energy and Environmental Economics, Inc.
4.3 Candidate Resources
Candidate resources are used to develop portfolios of resources in 2050 to both achieve GHG reduction
targets or ensure acceptable reliability of 2.4 hrs./yr. LOLE. For a more detailed description of the portfolio
development process, see Section 3.1.3. The 7 candidate resources are:
Solar (geographically diverse across Greater Northwest)
Northwest Wind (WA/OR)
Montana Wind
Wyoming Wind
4-Hour Storage
8-Hour Storage
16-Hour Storage
Natural gas generation is also added as needed to meet any remaining reliability gaps after the GHG
reduction target is met. The new renewable candidate resources (solar, NW wind, MT wind, WY wind)
are assumed to be added proportionally across a geographically diverse footprint which has a strong
impact on the ability of variable renewable resources to provide reliable power that can substitute for
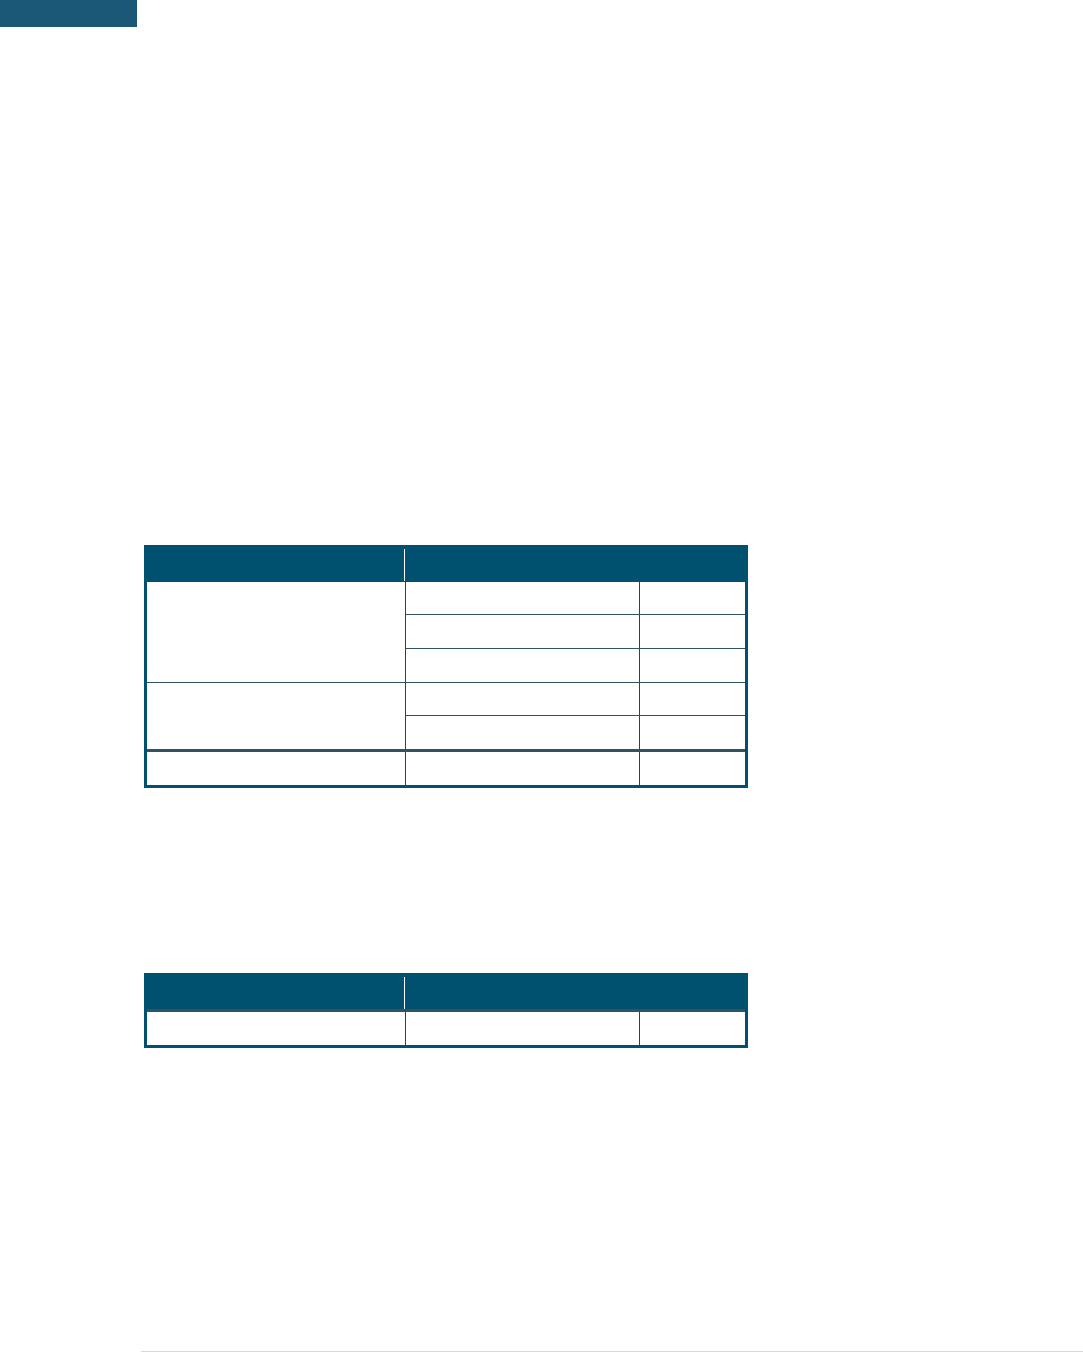
firm generation. Figure 10 illustrates the location of new candidate renewable resources. When a resource
is added, it is added proportionally at each of the locations shown in the figure below.
32 | P a g e
Resource Adequacy in the Pacific Northwest
Figure 10: New Renewable Candidate Resources
The generation output profile for each location was simulated by gathering hourly wind speed and solar
insolation data from NREL’s Wind Integration National Dataset Toolkit and Solar Prospector Database and
converting to power output using NREL’s System Advisor Model. The wind profiles used in this study are
based on 135 GW of underlying wind production data from hundreds of sites. The solar profiles used in
this study are based on 80 GW of underlying solar production data across four states. This process is
described in more detail in Appendix C.
New storage resources are available to the model in different increments of duration at different costs
which provide different value in terms of both reliability and renewable integration for GHG reduction.
Note that the model can choose different quantities of each storage duration which results in a fleet-wide
storage duration that is different than any individual storage candidate resource. Because storage is
modeled in terms of capacity charge/discharge and duration, many different storage technologies could
provide this capability. The cost forecast trajectory for Li-Ion battery storage was used to estimate costs,

33 | P a g e
Key Inputs & Assumptions
© 2018 Energy and Environmental Economics, Inc.
but any storage technology that could provide equivalent capacity and duration, such as pumped hydro
or flow batteries, could substitute for the storage included in the portfolio results of this study.
New renewable portfolios are within the bounds of current technical potential estimates published in
NREL.
Table 11. NREL Technical Potential (GW)
State
Wind Technical Potential (GW)
Washington
18
Oregon
27
Idaho
18
Montana
944
Wyoming
552
Utah
13
Total
1,588
4.3.1.1 Resource Costs
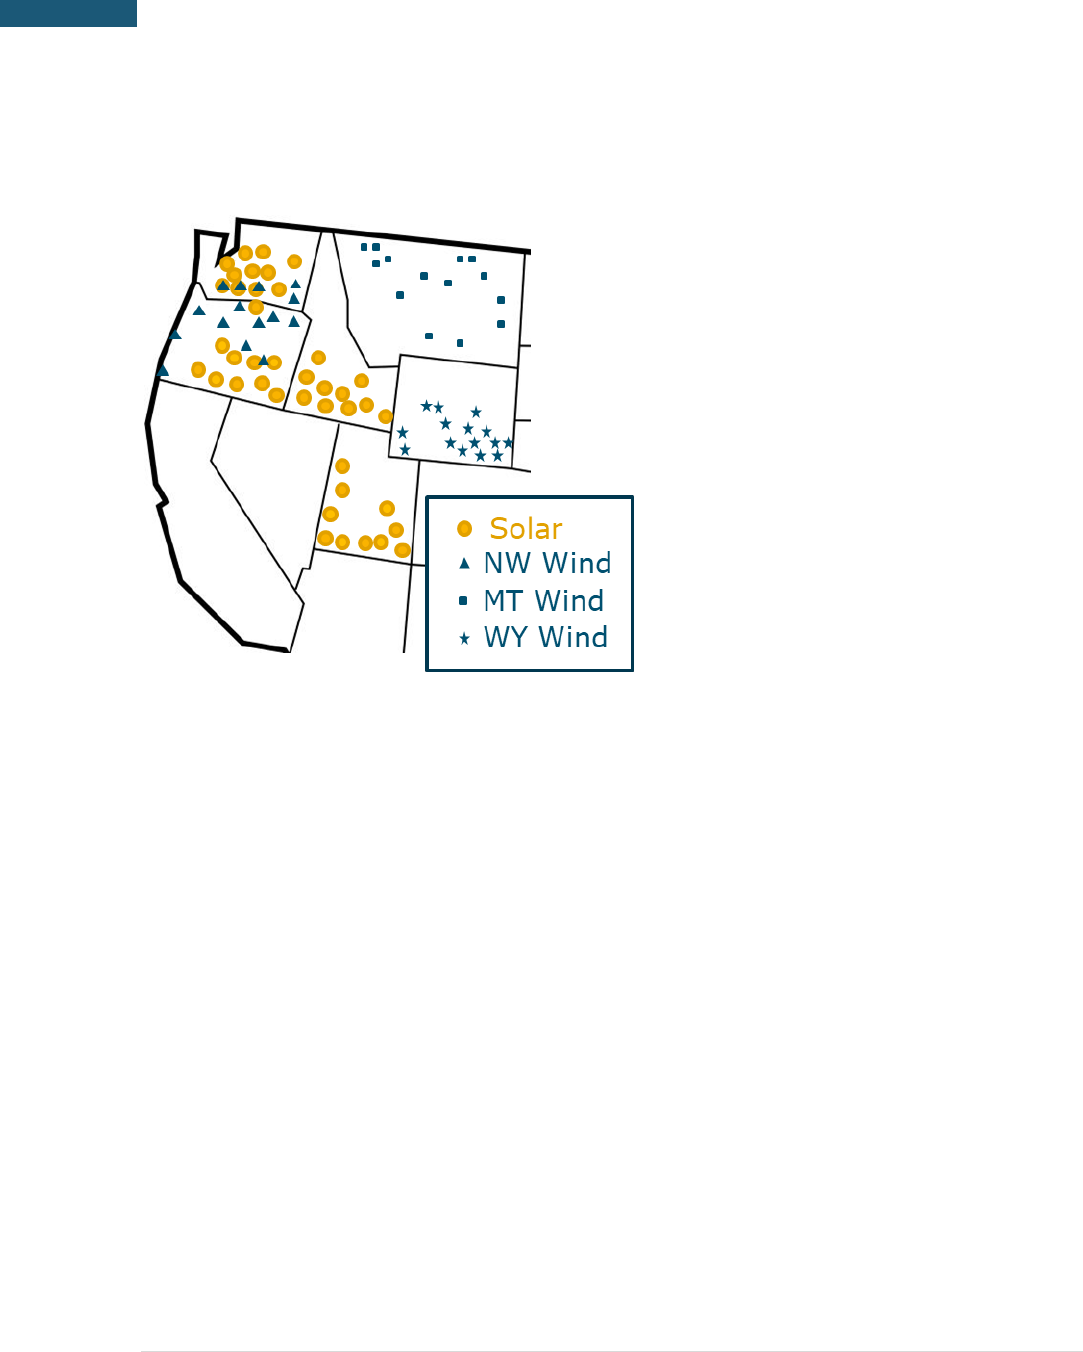
All costs in this study are presented in 2016 dollars. The average cost of each resource over the 2018-2050
timeframe is shown in Table 12 while the annual cost trajectories from 2018-2050 are shown in Figure 11.
Table 12. Resource Cost Assumptions (2016 $)
Technology
Unit
High
14
Low
15
Transmission
Notes
Solar PV
$/MWh
$59
$32
$8
Capacity factor = 27%
NW Wind
$/MWh
$55
$43
$6
Capacity factor = 37%
MT/WY Wind
$/MWh
$48
$37
$19
Capacity factor = 43%
4-hr Battery
$/kW-yr
$194
$97
14
Source for high prices: 2017 E3 PGP Decarbonization Study
15
Source for low prices: NREL 2018 ATB Mid case for wind and solar; Lazard LCOS Mid case 4.0 for batteries
34 | P a g e
Resource Adequacy in the Pacific Northwest
Technology
Unit
High
14
Low
15
Transmission
Notes
8-hr Battery
$/kW-yr
$358
$189
16-hr Battery
$/kW-yr
$686
$373
Natural Gas Capacity
$/kW-yr
$150
$150
7,000 Btu/kWh heat rate;
$5/MWh variable O&M
Gas Price
$/MMBtu
$4
$2
Biogas Price
$/MMBtu
$39
$39
Figure 11: Cost trajectories over the 2018-2050 timeframe (2016 $)

35 | P a g e
Key Inputs & Assumptions
© 2018 Energy and Environmental Economics, Inc.
4.4 Estimating Cost and GHG Metrics
The cost of the future electricity portfolios consists of (1) fixed capital costs for building new resources,
and (2) operating costs for running both existing and new resources. For new wind and new solar
resources, the cost of generation is calculated using their respective levelized costs (see Table 12). Cost of
electricity generation from natural gas plants includes both the capital cost for new natural gas plants and
the operating costs (fuel costs and variable operating costs). All the natural gas plants are assumed to
operate at a heat rate of 7,000 Btu/kWh, with the price of natural gas varying from $2 to $4 per MMBtu
(see Table 12). Storage resources are assumed to have only fixed cost, but no operating cost. All exports
are assumed to yield revenues of $30 per MWh.
In this study, annual GHG emissions are compared against 1990 emission levels, when the emissions for
the Greater Northwest region was 60 million metric tons. GHG emissions are calculated for each thermal
resource depending on the fuel type. For natural gas plants, an emission rate of 117 lb. of CO
2
per MMBtu
of natural gas is assumed, yielding 0.371 metric tons of CO
2
per MWh of electricity generated from natural
gas (assumed 7,000 Btu/kWh heat rate). For coal plants, an emission rate of 1.0 ton of CO
2
per MWh of
electricity generated from coal is assumed.

36 | P a g e
Resource Adequacy in the Pacific Northwest
5 Results
5.1 Short-Term Outlook (2018)
The 2018 system (today’s system) in the study region is supplied by a mix of various resources, as
described in Section 4.2. The annual electricity load for the study region is 247 TWh with a winter peak
demand of 43 GW. Hydro energy provides the plurality of generation capacity with significant
contributions from natural gas, coal and wind generation.
Resource adequacy conclusions vary depending on what metric is used for evaluation. The region has
sufficient capacity to meet the current standard used by the NWPCC of 5% annual loss of load probability
(LOLP). The region does not have sufficient capacity to meet the 2.4 hrs./yr. LOLE standard used in this
study. In other words, most loss of load is concentrated in a few number of years which matches intuition
for a system that is dependent upon the annual hydro cycle and susceptible to drought conditions. Full
reliability statistics for the Greater Northwest region are shown in Table 13.
Table 13. 2018 Reliability Statistics
Metric
Units
Value
Annual LOLP (%)
%
3.7%
Loss of Load Expectation (LOLE)
hrs/yr
6.5
Expected Unserved Energy (EUE)
MWh/yr
5,777
Normalized EUE
%
0.003%
1-in-2 Peak Load
GW
43
PRM Requirement
% of peak
12%
Total Effective Capacity Requirement
GW
48
37 | P a g e
Results
© 2018 Energy and Environmental Economics, Inc.
Table 14. 2018 Load and Resource Balance
In order to meet an LOLE target of 2.4 hrs./yr., a planning reserve margin (PRM) of 12% is required. The
PRM is calculated by dividing the quantity of effective capacity needed to meet the LOLE target by the
median peak load, then subtracting one. This result is lower than many individual utilities currently hold
within the region (typical PRM ~15%) due to the load and resource diversity across the geographically
large Greater Northwest region. As shown in Table 14, the total effective capacity (47 GW) available is
slightly lower than the total capacity requirement (48 GW) which is consistent with the finding that the
Load
Load GW
Peak Load
42.1
Firm Exports
1.1
PRM (12%)
5.2
Total Requirement
48.4
Resources
Nameplate GW
Effective %
Effective GW
Coal
10.9
100%
10.9
Gas
12.2
100%
12.2
Biomass & Geothermal
0.6
100%
0.6
Nuclear
1.2
100%
1.2
Demand Response
0.6
50%
0.3
Hydro
35.2
53%
18.7
Wind
7.1
7%
0.5
Solar
1.6
12%
0.2
Storage
0
—
0
Total Internal Generation
69.1
44.7
Firm Imports
3.4
74%
2.5
Total Supply
72.5
47.2
Surplus/Deficit
Capacity Surplus/Deficit
-1.2

38 | P a g e
Resource Adequacy in the Pacific Northwest
system is not sufficiently reliable to meet a 2.4 hrs./yr. LOLE target. The effective capacity percent
contributions from wind and solar are shown to be 7% and 12%, respectively. These relatively low values
stem primarily from the non-coincidence of wind and solar production during high load events in the
Greater Northwest region, notably very cold winter mornings and evenings.
It should be noted that the effectiveness of firm capacity is set to 100% by convention in calculating a
PRM. The contribution of variable resources is then measured relative to firm capacity, incorporating the
effect of forced outage rates for firm resources.
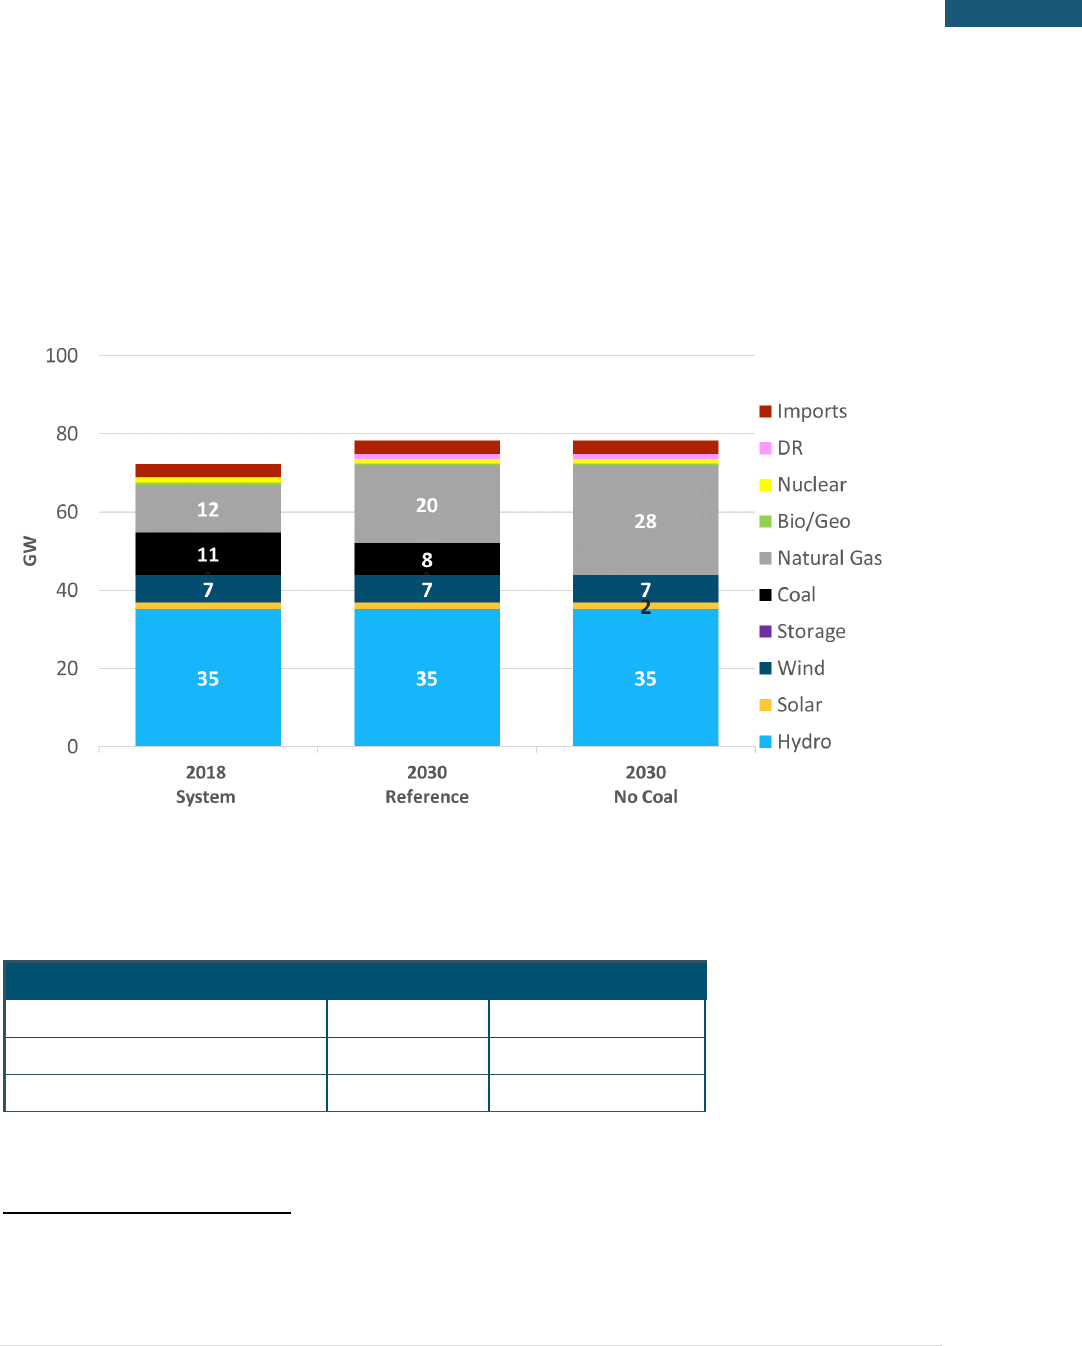
5.2 Medium-Term Outlook (2030)
The Greater Northwest system in 2030 is examined under two scenarios:
Reference
• Planned coal retirements; new gas gen for reliability
No Coal
• All coal retired; new gas gen for reliability
The resulting generation portfolios in both scenarios (both of which meet the 2.4 hrs./yr. LOLE reliability
standard) are shown in Figure 12 alongside the 2018 system for context. To account for the load growth
by 2030, 5 GW of net new capacity is required to maintain reliability. In the Reference Scenario where 3
GW of coal is retired, 8 GW of new firm capacity is needed by 2030 for reliability. Similarly, the No Coal
Scenario (where all 11 GW of coal is retired) results in 16 GW of new firm capacity need by 2030. The
study assumes all the new capacity in the 2030 timeframe need is met through additional natural gas
build. It should be noted that regardless of what resource mix is built to replace the retirement of coal,
the siting, permitting, and construction of these new resources will take significant time so planning for
39 | P a g e
Results
© 2018 Energy and Environmental Economics, Inc.
these resources needs to begin well before actual need. The portfolio tables for each scenario are
summarized in Appendix A.2.
Figure 12: Generation Portfolios in 2030
Table 15. 2030 Generation Portfolio: Key Metrics
Metric
2030 Reference
2030 No Coal
GHG-Free Generation (%)
61%
61%
GHG Emissions (MMT CO
2
/ year)
67
42
% GHG Reduction from 1990 Level
-12%
16
31%
16
Negative value for %GHG reduction from 1990 level indicates that emissions are above 1990 level
40 | P a g e
Resource Adequacy in the Pacific Northwest
As these metrics show, without either natural gas replacement of coal capacity or significant increase in
renewable energy, GHG emissions are forecasted to rise in the 2030 timeframe. However, repowering
coal with natural gas has the potential to reduce GHG emissions by 31% below 1990 levels.
In order to meet an LOLE target of 2.4 hrs/yr, the region requires a planning reserve margin (PRM) in 2030
of 12%.
Table 16. 2030 Load and Resource Balance, Reference Scenario
Load
Load MW
Peak Load
45.9
Firm Exports
1.1
PRM (12%)
5.8
Total Requirement
52.9
Resources
Nameplate MW
Effective %
Effective MW
Coal
8.2
100%
8.2
Gas
19.9
100%
19.9
Bio/Geo
0.6
100%
0.6
Nuclear
1.2
100%
1.2
DR
2.2
45%
1.0
Hydro
35.2
53%
18.7
Wind
7.1
9%
0.6
Solar
1.6
14%
0.2
Storage
0
—
0
Total Internal Generation
76.1
50.5
Firm Imports
3.4
74%
2.5
Total Supply
79.5
52.9
Surplus/Deficit
Capacity Surplus/Deficit
0.0

41 | P a g e
Results
© 2018 Energy and Environmental Economics, Inc.
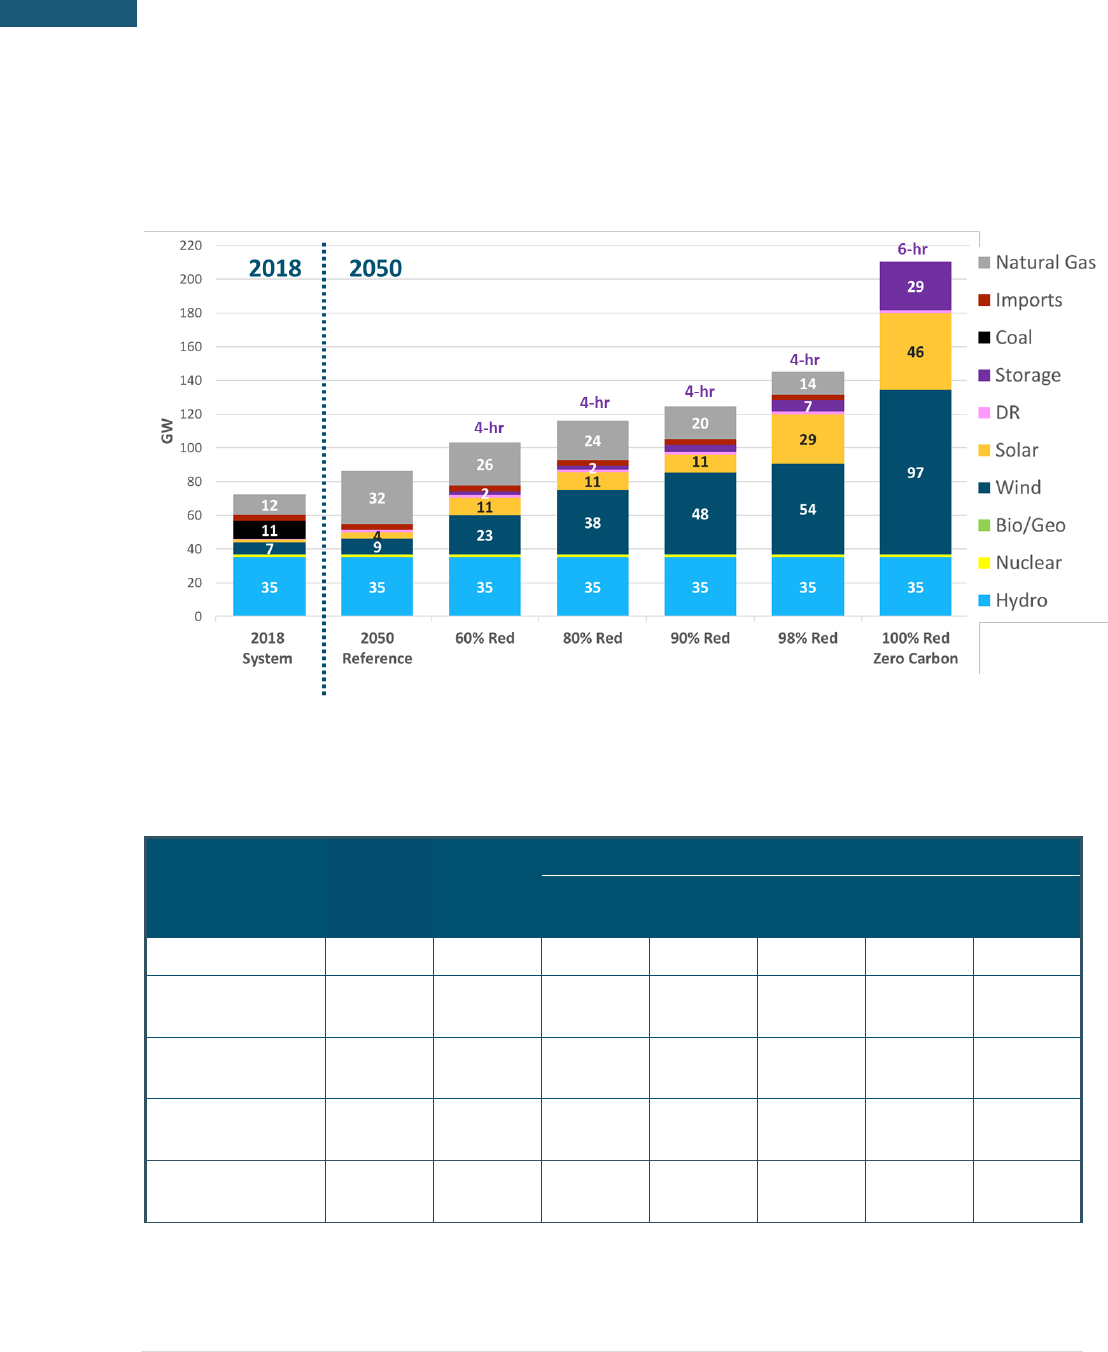
5.3 Long-Term Outlook (2050)
The Greater Northwest system in 2050 is examined under a range of decarbonization scenarios, relative
to 1990 emissions.
60% GHG Reduction
80% GHG Reduction
90% GHG Reduction
98% GHG Reduction
100% GHG Reduction
The portfolio for each decarbonization scenario was developed using the methodology described in
Section 3.1.3. To summarize this process, RECAP iteratively adds carbon-free resources (wind, solar
storage) to reduce GHG in a manner that maximizes the effective capacity of these carbon-free resources,
thus minimizing the residual need for firm natural gas capacity. Once a cost-effective portfolio of carbon-
free resources has been added to ensure requisite GHG reductions, the residual need for natural gas
generation capacity is calculated to ensure the entire portfolio meets a 2.4 hrs./yr. LOLE standard.
5.3.1 ELECTRICITY GENERATION PORTFOLIOS
All the 2050 decarbonization portfolios are shown together in Figure 13. Higher quantities of renewable
and energy storage are required to achieve deeper levels of decarbonization, which in turn provide
effective capacity to the system and allow for a reduction in residual firm natural gas capacity need,
relative to the reference case. Detailed portfolio results tables for each scenario are provided in Appendix
A.2.
42 | P a g e
Resource Adequacy in the Pacific Northwest
Figure 13: Generation Portfolios for 2050 Scenarios
Table 17. 2050 Decarbonization Scenarios: Key Generation Metrics
Metric
Reference
Scenario
GHG Reduction Scenarios
Units
60% Red.
80% Red.
90% Red.
98% Red.
100%
Red.
GHG Emissions
MMT/yr
50
25
12
6
1
0
GHG Reductions
% below
1990
16%
60%
80%
90%
98%
100%
GHG-Free
Generation
% of load
60%
80%
90%
95%
99%
100%
Clean Portfolio
Standard
% of sales
63%
86%
100%
108%
117%
123%
Annual Renewable
Curtailment
% of
potential
Low
Low
4%
10%
21%
47%

43 | P a g e
Results
© 2018 Energy and Environmental Economics, Inc.
Table 17 evaluates the performance of each decarbonization portfolio along several key generation
metrics that were described in detail in Section 3.4.
Analyzing the portfolio of each decarbonization scenario and resulting performance metrics yields several
interesting observations.
On retiring all 11 GW of coal by 2050 in the Reference scenario, the Greater Northwest system
requires 20 GW of new capacity in order to meet the 2.4 hrs./yr. LOLE standard used in the study.
This suggests that 9 GW of net new firm capacity is needed to account for load growth through
2050.
The integration of more renewables and conservation policies provides the energy needed to
serve loads in a deeply decarbonized future, but new gas-fired generation capacity is needed for
relatively short, multi-day events with low renewable generation, high loads, and low hydro
availability.
To reduce GHG emissions to 80% below 1990 levels, RECAP chooses to build 38 GW of wind, 11
GW of solar, and 2 GW of 4-hour storage. In addition to this renewable build, 12 GW of new firm
capacity is required for reliability (after retaining all the existing natural gas plants) which is
assumed to be met through natural gas build. The generation portfolio under 80% Reduction
Scenario results in a 100% clean portfolio standard and 90% GHG-free generation.
RECAP achieves deeper levels of decarbonization (GHG emissions 98% below 1990 level down to
1.0 MMT GHG/yr) by overbuilding renewables with 54 GW of wind, 29 GW of solar, and 7 GW of
4-hour storage. Annual renewable oversupply becomes significant (at 21%). Nevertheless, the
system still requires an additional gas build of 2 GW after retaining all existing natural gas plants,
to ensure reliability during periods of low renewable generation. The capacity factor for these gas
plants is extremely low (3%), underlining their importance for reliability.
The 100% GHG Reduction Scenario (Zero Carbon Scenario) results in no GHG emissions from the
electricity sector. The generation portfolio consists only of renewables (97 GW of wind and 46
GW of solar) and energy storage (29 GW of 6-hour storage). Ensuring a reliable system using only
renewables and energy storage requires a significant amount of renewable overbuild – resulting
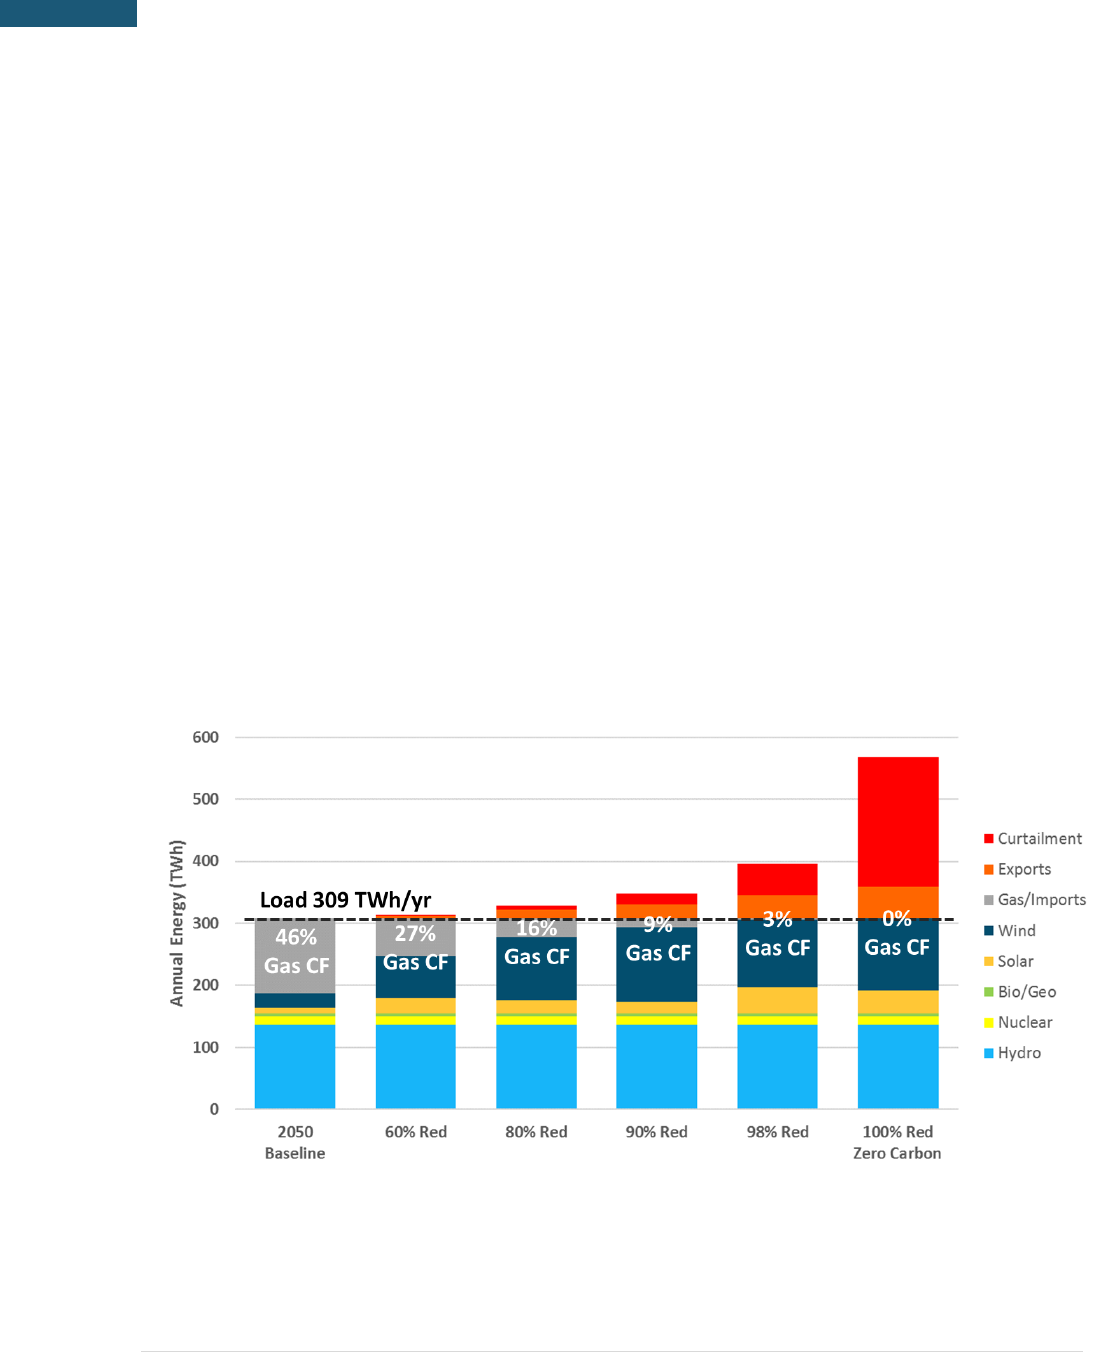
44 | P a g e
Resource Adequacy in the Pacific Northwest
in nearly half of all the generated renewable energy to be curtailed. Compared to the 98% GHG
Reduction Scenario (which results in 99% GHG-free generation), the Zero Carbon Scenario
requires almost double the quantity of renewables and even greater quantity of energy storage.
With increases in renewable generation, generation from natural gas plants decreases. Due to negligible
operating costs associated with renewable production, it is cost optimal to use as much renewable
generation as the system can. During periods of prolonged low renewable generation when energy
storage is depleted, natural gas plants can ramp up to provide the required firm capacity to avoid loss-of-
load events. In the deep decarbonization scenarios, gas is utilized sparingly and even results in very low
capacity factors (such as 9% and 3%). However, RECAP chooses to retain (and even build) natural gas as
the most cost-effective resource to provide reliable firm capacity. Renewable overbuild also results in
significant amounts of curtailment.
Figure 14: Annual generation mix across the scenarios
45 | P a g e
Results
© 2018 Energy and Environmental Economics, Inc.
A planning reserve margin of 7% to 9% is required to meet the 1-in-10 reliability standard in 2050
depending on the scenario. Accounting for a planning reserve margin, the total capacity requirement (load
plus planning reserve margin) in 2050 is 57-59 GW. As shown in Table 18, this capacity requirement is met
through a diverse mix of resources. Variable or energy-limited resources such as hydro, wind, solar and
storage contribute only a portion of their entire nameplate capacity (ELCC) towards resource adequacy.
Load and resource tables for the 80% and 100% Reduction scenarios are shown below.
Table 18. 2050 Load and Resource Balance, 80% Reduction scenario
Load
Load MW
Peak Load
52.8
Firm Exports
1.1
PRM (9%)
4.9
Total Requirement
58.8
Resources
Nameplate MW
Effective %
Effective MW
Coal
0
—
0
Gas
23.5
100%
23.5
Bio/Geo
0.6
100%
0.6
Nuclear
1.2
100%
1.2
DR
5.5
29%
1.6
Hydro
35.2
53%
18.7
Wind
38.0
19%
7.2
Solar
10.6
19%
2.0
Storage
2.2
73%
1.6
Total Internal Generation
116.8
56.3
Firm Imports
3.4
74%
2.5
Total Supply
120.2
58.8
Surplus/Deficit
Capacity Surplus/Deficit
0.0
46 | P a g e
Resource Adequacy in the Pacific Northwest
Table 19. 2050 Load and Resource Balance, 100% Reduction scenario
Load
Load MW
Peak Load
52.8
Firm Exports
1.1
PRM (7%)
4.0
Total Requirement
58.0
Resources
Nameplate MW
Effective %
Effective MW
Coal
0
—
0
Gas
0
—
0
Bio/Geo
0.6
100%
0.6
Nuclear
1.2
100%
1.2
DR
5.5
29%
1.6
Hydro
35.2
57%
20.1
Wind
97.4
22%
21.5
Solar
45.6
16%
7.3
Storage
28.7
20%
5.7
Total Internal Generation
214.2
58.0
Firm Imports
0
—
0
Total Supply
214.2
58.0
Surplus/Deficit
Capacity Surplus/Deficit
0.0

47 | P a g e
Results
© 2018 Energy and Environmental Economics, Inc.
5.3.2 ELECTRIC SYSTEM COSTS
System costs are estimated using the methodology and cost assumptions described in Section 4.3.1.1 and
Section 4.4. Electric system costs represent the cost of decarbonization relative to the 2050 Reference
scenario, and so by definition all annual and unit cost increases in this scenario are zero. The 2050
Reference scenario does require significant investment in new resources in order to reliably meet load
growth and existing RPS policy targets, so the zero incremental cost is not meant to make any assessment
on the absolute change (or lack thereof) in total electric system costs or rates by 2050.
Table 20 evaluates the performance of 2050 decarbonization scenarios along two cost metrics for both a
low and high set of cost assumptions.
Table 20: 2050 Decarbonization Scenarios: Key Cost Metrics
Metric
Reference
Scenario
GHG Reduction Scenarios
Units
60% Red.
80% Red.
90% Red.
98% Red.
100%
Red.
Annual Cost
Increase
Lo
$BB/yr
(vs. Ref)
—
$0
$1
$2
$3
$16
Hi
$2
$4
$5
$9
$28
Unit Cost
Increase
Lo
$/MWh
(vs. Ref)
—
$0
$3
$5
$10
$52
Hi
$7
$14
$18
$28
$89
Analyzing the cost results for each decarbonization scenario yields several interesting observations
To reduce GHG emissions to 80% below 1990 levels, a portfolio of wind/solar/storage can be
obtained at an additional annual cost of $1 to $4 billion ($3 to $14/MWh) after accounting for the
avoided costs of new gas build and utilization. Assuming an existing average retail rate of
$0.10/kWh, this implies an increase of 3%-14% in real terms relative to the Reference Scenario.
Because the 80% reduction scenario achieves a 100% clean portfolio standard (as shown in
Section 5.3.1), this scenario is compelling from both a policy perspective and a cost perspective in
balancing multiple objectives across the Greater Northwest region.

48 | P a g e
Resource Adequacy in the Pacific Northwest
Deep decarbonization (GHG emissions 98% below 1990 level down to 1.0 MMT GHG/yr) of the
Greater Northwest system can be obtained at an additional annual cost of $3 to $9 billion ($10 to
$28/MWh), i.e., the average retail rates increase 10%-28% in real terms relative to the Reference
Scenario. This suggests that deep decarbonization of the Greater Northwest system can be
achieved at moderate additional costs, assuming that natural gas capacity is available as a
resource option to maintain reliability during prolonged periods of low renewable production.
The 100% GHG Reduction Scenario requires a significant increase in wind, solar and storage to
eliminate the final 1% of GHG-emitting generation. An additional upfront investment of $100
billion to $170 billion is required, relative to the 98% GHG Reduction scenario. Compared to the
Reference Scenario, the Zero Carbon Scenario requires an additional annual cost of $16 to $28
billion ($52 to $89/MWh), i.e., the average retail rates nearly double.
Costs for individual utilities will vary and may be higher or lower than the region as a whole. This report
does not address allocation of cost between utilities.
As shown in Figure 15, the cost increases of achieving deeper levels of decarbonization become
increasingly large as GHG emissions approach zero. This is primarily due to the level of renewable
overbuild that is required to ensure reliability and the increasing quantities of energy storage required to
integrate the renewable energy.
49 | P a g e
Results
© 2018 Energy and Environmental Economics, Inc.
Figure 15: Cost of GHG reduction
The marginal cost of GHG reduction represents the incremental cost of additional GHG reductions at
various levels of decarbonization. Figure 16 and Figure 17 both show the increasing marginal cost of GHG
abatement at each level of decarbonization. At very deep levels of GHG reductions, the marginal cost of
carbon abatement greatly exceeds the societal cost of carbon emissions, which generally ranges from
$50/ton to $250/ton
17
, although some academic estimates range up to $800/ton
18
.
17
https://19january2017snapshot.epa.gov/climatechange/social-cost-carbon_.html
18
https://www.nature.com/articles/s41558-018-0282-y
50 | P a g e
Resource Adequacy in the Pacific Northwest
Figure 16: Marginal Cost of GHG Reduction: 60% Reduction To 98% Reduction
Figure 17: Marginal Cost of GHG Reduction: 60% Reduction to 100% Reduction
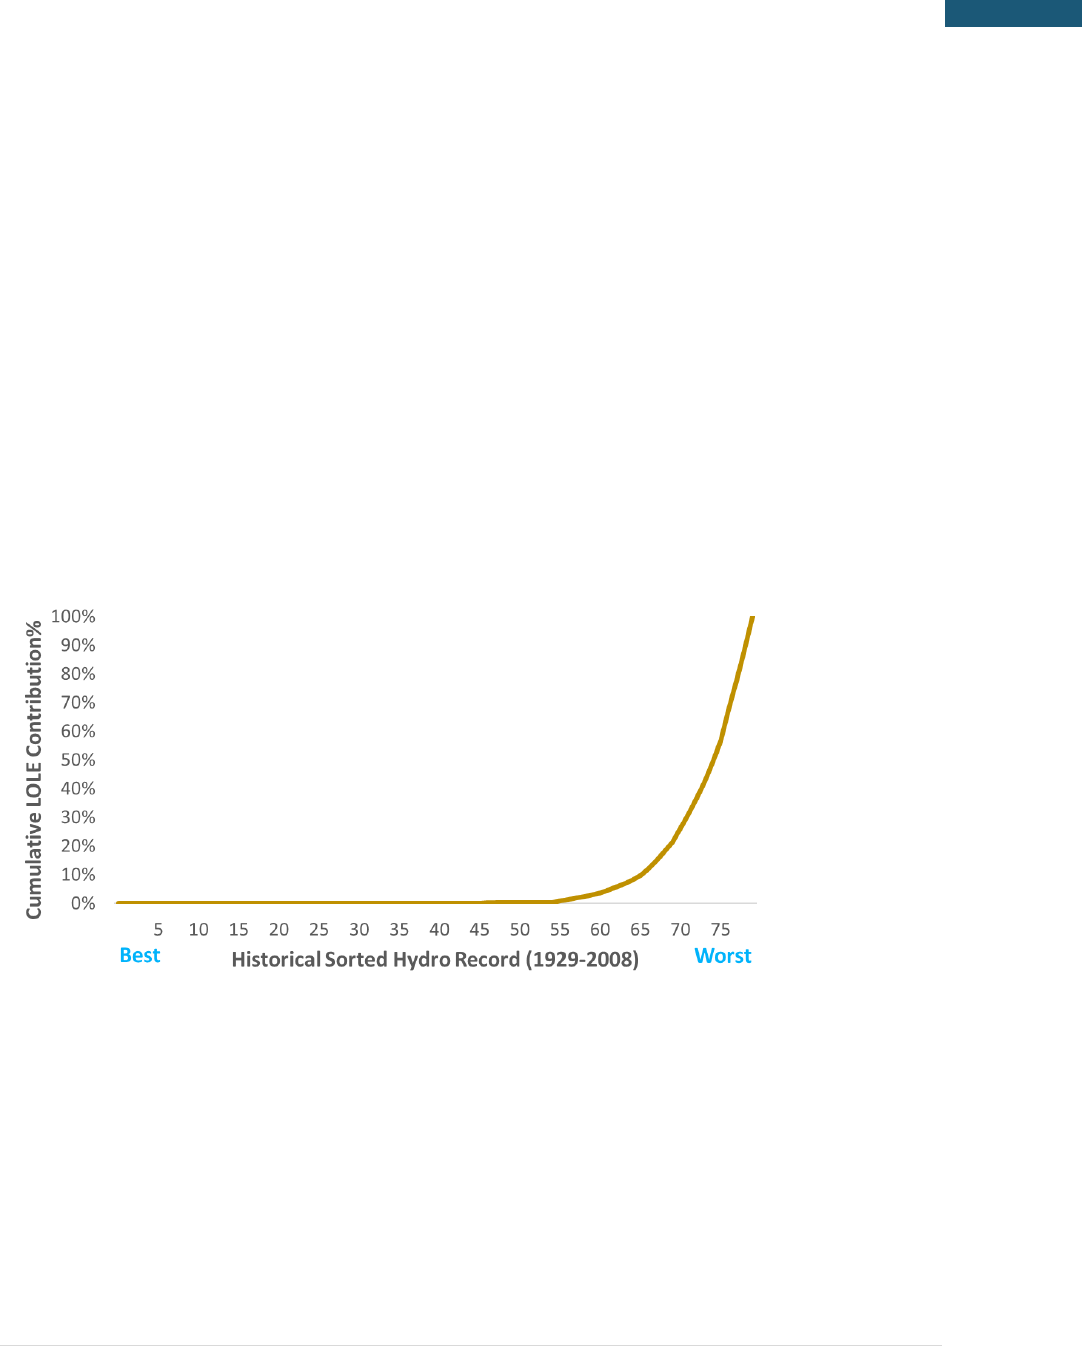
51 | P a g e
Results
© 2018 Energy and Environmental Economics, Inc.
5.3.3 DRIVERS OF RELIABILITY CHALLENGES
The major drivers of loss of load in the Greater Northwest system include high load events, prolonged low
renewable generation events, and drought hydro conditions. In today’s system where most generation is
dispatchable, prolonged low renewable generation events do not constitute a large cause of loss-of-load
events. Rather, the largest cause of loss-of-load events stem from the combination of high load events
and drought hydro conditions. This relationship between contribution to LOLE and hydro conditions is
highlighted in Figure 18 which shows nearly all loss of load events concentrated in the worst 25% of hydro
years.
Figure 18. 2018 System Loss-of-Load Under Various Hydro Conditions
At very high renewable penetrations, in contrast, prolonged low renewable generation events usurp
drought hydro conditions as the primary driver of reliability challenges. Figure 19 shows that at high levels
of GHG reductions, loss-of-load is much less concentrated in the worst hydro years as prolonged low
renewable generation events can create loss-of-load conditions in any year.
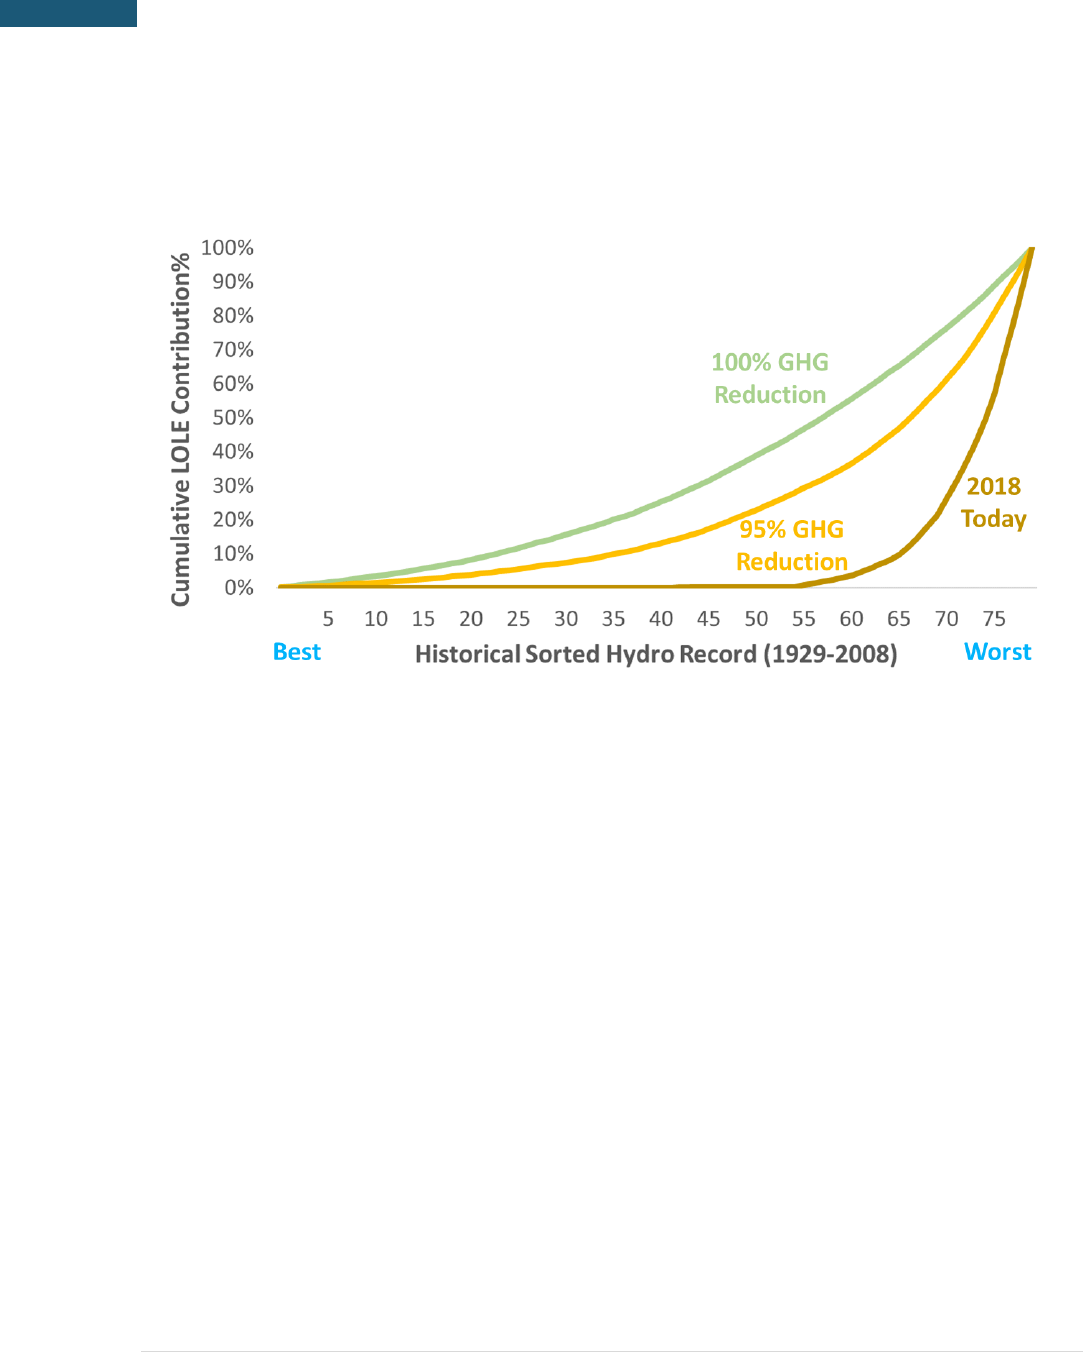
52 | P a g e
Resource Adequacy in the Pacific Northwest
Figure 19. 2018 System GHG Reduction Scenarios Loss-of-Load Under Various Hydro Conditions
In practice, these prolonged periods of low renewable output manifest via multi-day winter storms that
inhibit solar production over very wide geographic areas or large-scale high-pressure systems associated
with low wind output. Figure 20 presents an example of multiday loss-of-load in a sample week in 2050
in the 100% GHG Reduction scenario. In a system without available dispatchable resources to call during
such events, low solar radiation and wind speed can often give rise to severe loss-of-load events, especially
when renewable generation may be insufficient to serve all load and storage quickly depletes. As shown
in the example, over 100 GW of total installed renewables can only produce less than 10 GW of output in
some hours. It is the confluence of events like these that drive the need for renewable overbuild to
mitigate these events, which in turn leads to the very high costs associated with ultra-deep
decarbonization.
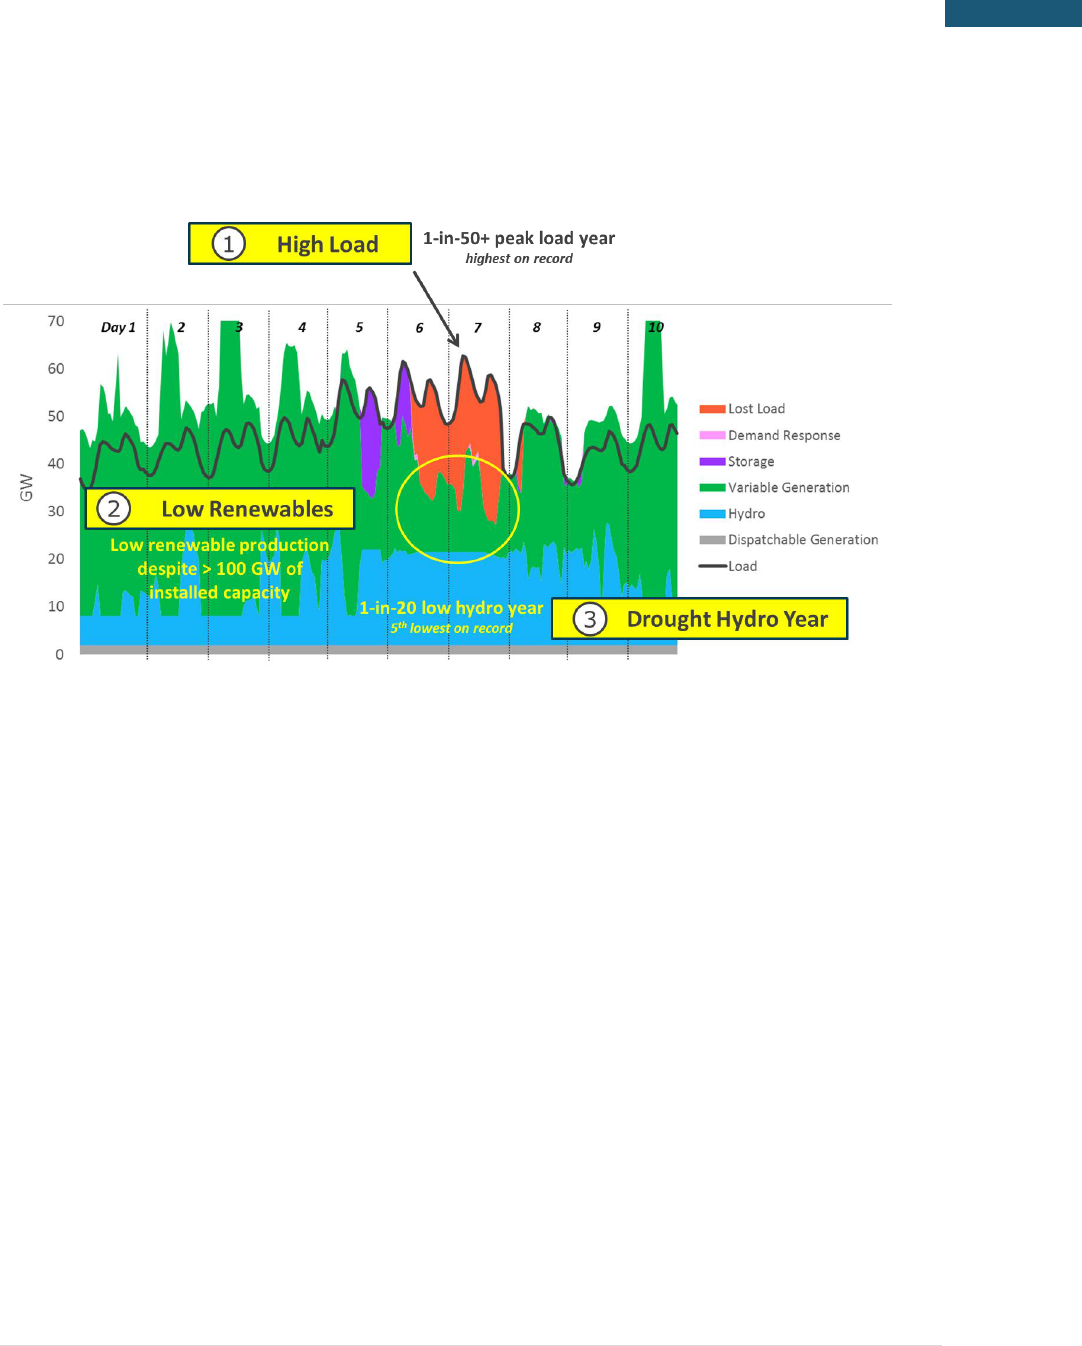
53 | P a g e
Results
© 2018 Energy and Environmental Economics, Inc.
Figure 20: Loss-of-load Example in a Sample Week
5.3.4 ROLE OF NATURAL GAS GENERATION CAPACITY
The significant buildout of renewables and storage to meet decarbonization targets contributes to the
resource adequacy needs of the system and reduces the need for thermal generation. However, despite
the very large quantities of storage and renewables in all the high GHG reduction scenarios, a significant
amount of natural gas capacity is still needed for reliability (except for the 100% GHG Reduction scenario
where natural gas combustion is prohibited). Even though the system retains significant quantities of gas
generation capacity for reliability, the capacity factor utilization of the gas fleet decreases substantially at
higher levels of GHG reductions as illustrated in Figure 21. It is noteworthy that all scenarios except 100%
GHG reductions require more gas capacity than exists in 2018, assuming all coal (11 GW) is retired.
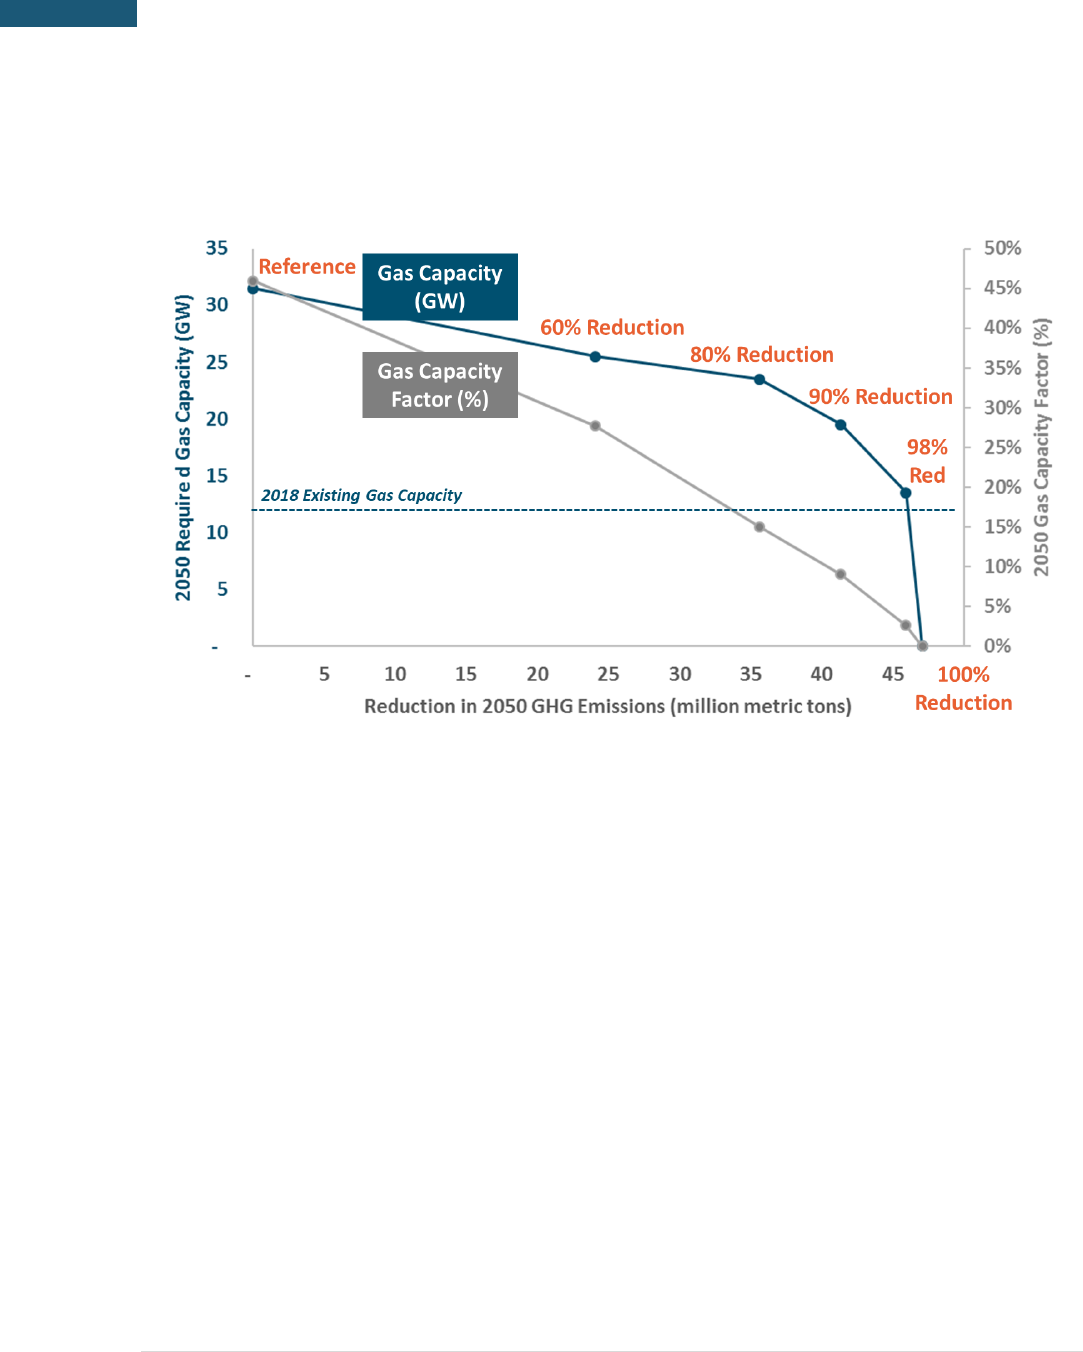
54 | P a g e
Resource Adequacy in the Pacific Northwest
Figure 21: Natural Gas Required Capacity in Different 2050 Scenarios
5.3.5 EFFECTIVE LOAD CARRYING CAPABILITY
Effective Load Carrying Capability (ELCC) is a metric used in the electricity industry to quantify the
additional load that can be met by an incremental generator while maintaining the same level of system
reliability. Equivalently, ELCC is a measure of ‘perfect capacity’ that could be replaced or avoided with
dispatch-limited resources such as wind, solar, storage, or demand response.
5.3.5.1 Wind ELCC
Wind resources in this study are grouped and represented as existing Northwest (Oregon and
Washington) wind, new Northwest wind, and new Wyoming and Montana wind. The ELCC curves of each
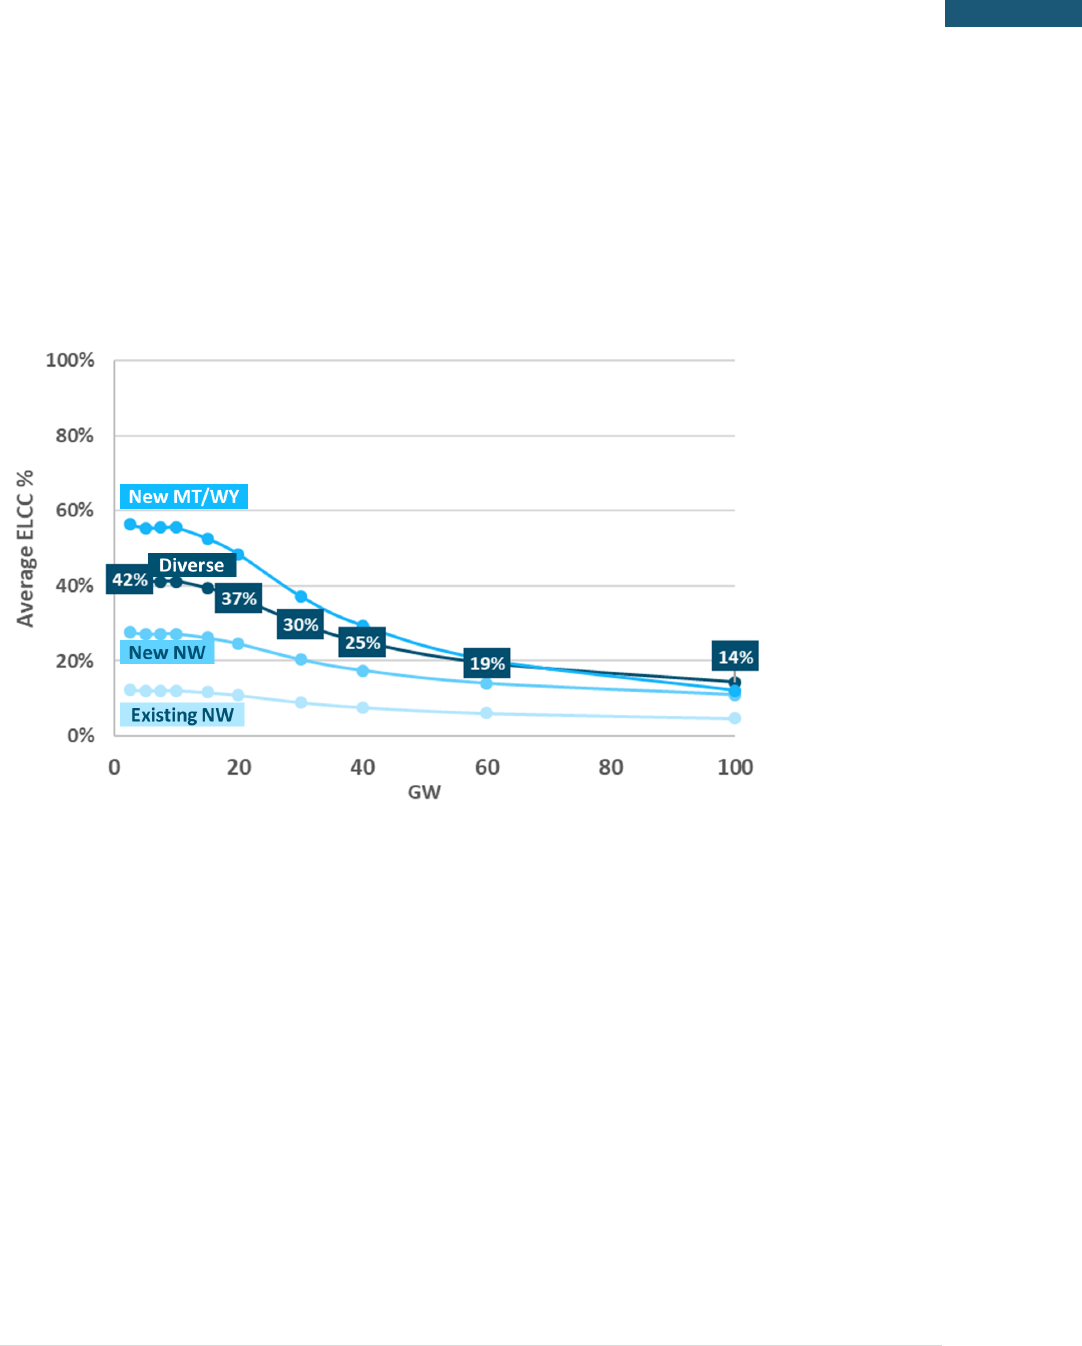
55 | P a g e
Results
© 2018 Energy and Environmental Economics, Inc.
representative wind resource and as well as the combination of all three resources (i.e., “Diverse”) are
shown in Figure 22.
Figure 22: Wind ELCC at Various Penetrations
These results are primarily driven by the coincidence of wind production and high load events. Existing
wind in the Northwest today, primarily in the Columbia River Gorge, has a strong negative correlation with
peak load events that are driven by low pressures and cold temperatures. Conversely, Montana and
Wyoming wind does not exhibit this same correlation and many of the highest load hours are positively
correlated with high wind output as illustrated in Figure 23.
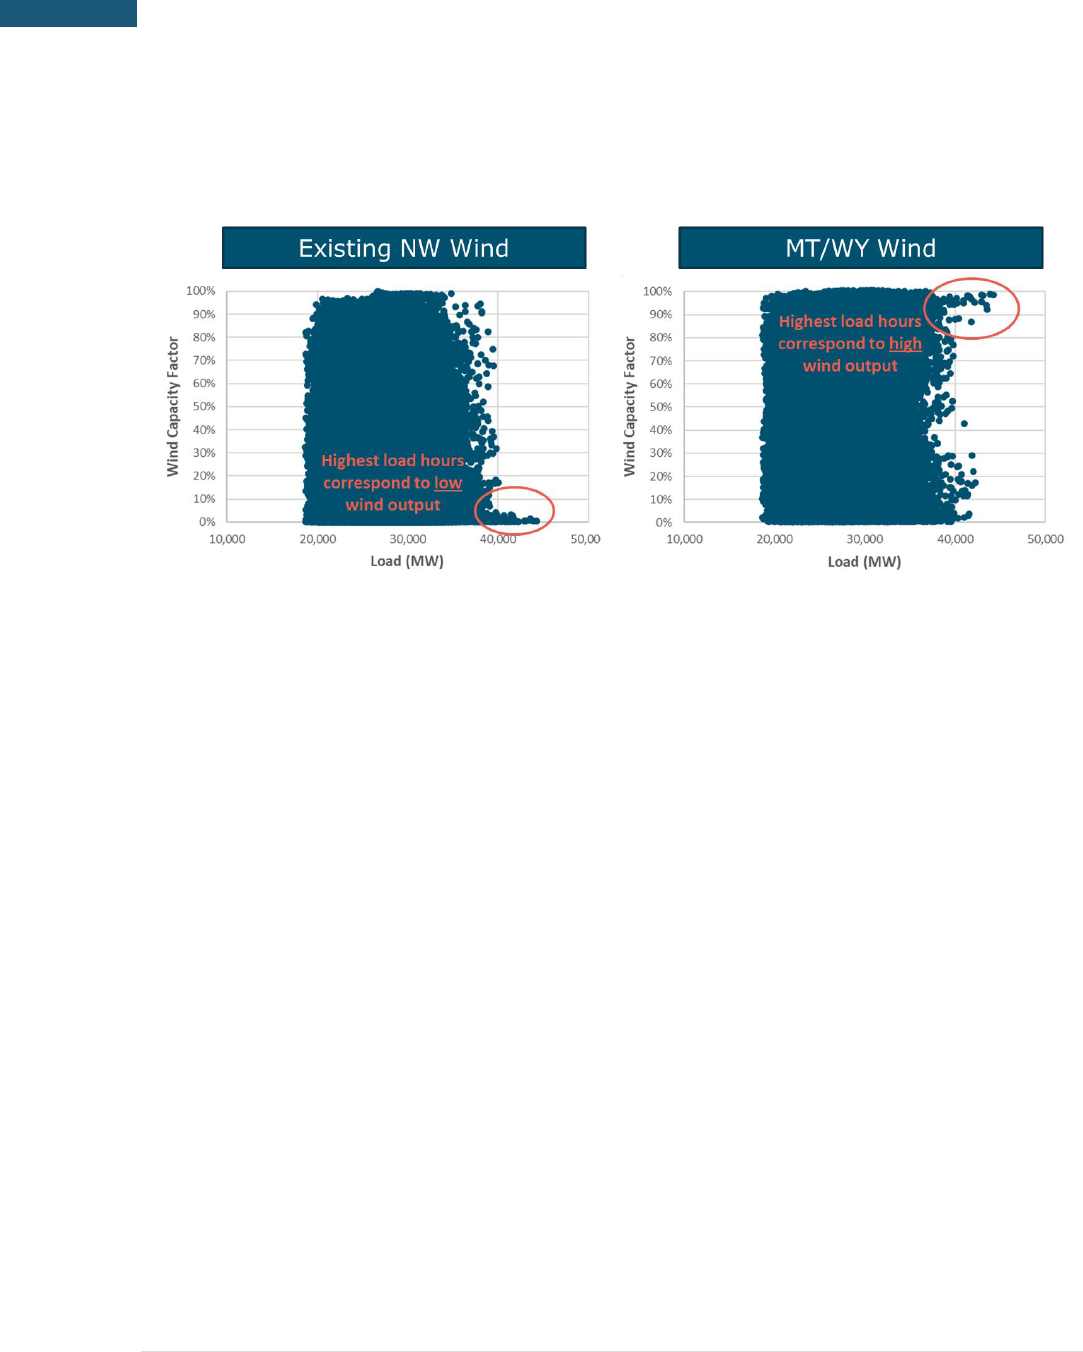
56 | P a g e
Resource Adequacy in the Pacific Northwest
Figure 23: Load and Wind Correlation (Existing NW Wind and New MT/WY Wind)
Comparing and contrasting the ELCC of different wind resources yields several interesting findings:
The wide discrepancy between the “worst” wind resource (existing NW) and the “best” wind
resource (new MT/WY) is primarily driven by the correlation of the wind production and peak
load events in Washington and Oregon. Existing NW wind is almost entirely located within the
Columbia River Gorge which tends to have very low wind output during the high-pressure weather
systems associated with the Greater Northwest cold snaps that drive peak load events.
Conversely, MY/WY wind is much less affected by this phenomenon due largely to geographic
distance, and wind output tends to be highest during the winter months when the Northwest is
most likely to experience peak load events.
All wind resources experience significant diminishing returns at high levels of penetration. While
wind may generate significant energy during the system peak, ultimately the net load peak that
drives ELCC will shift to an hour with low wind production and reduce the effectiveness with which
wind can provide ELCC. Diversity mitigates the rate of decline of ELCC.
New NW wind has notably higher ELCC values than existing NW wind due to both improvements
in turbine technology but also through larger geographic diversity of wind development within
the Northwest region but outside of the Columbia River Gorge.
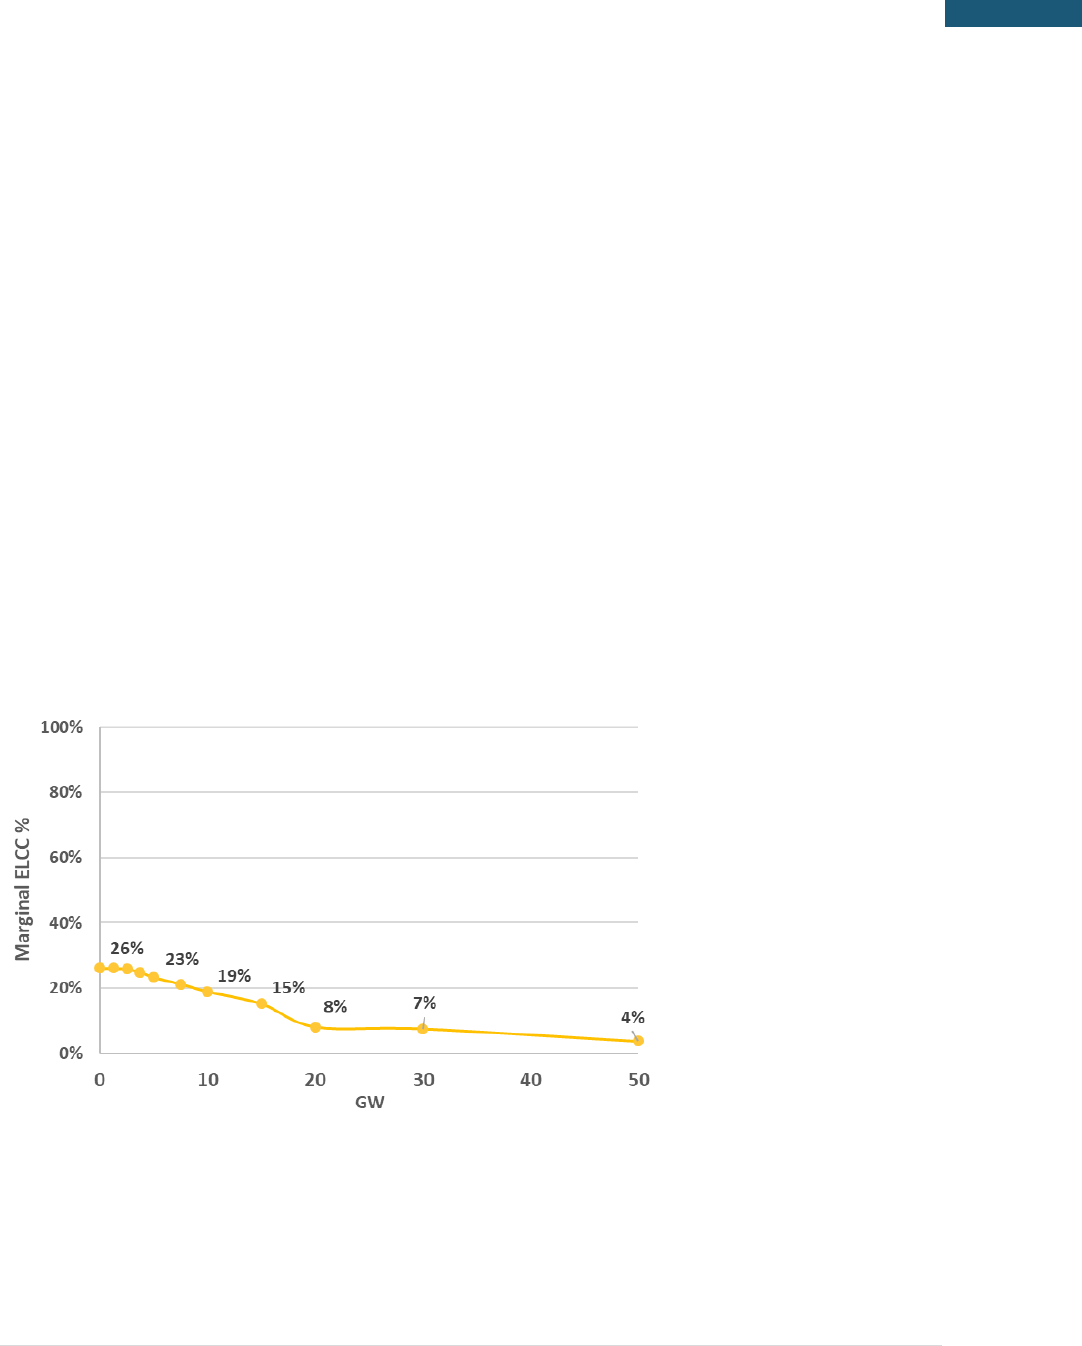
57 | P a g e
Results
© 2018 Energy and Environmental Economics, Inc.
Diverse wind (combination of all three wind groups) yields the highest ELCC values at high
penetrations. This is because even the best wind resources experience periods of low production
and additional geographic diversity can help to mitigate these events and improve ELCC.
5.3.5.2 Solar ELCC
Solar resources in this study are grouped and represented as existing solar and new solar which is built
across the geographically diverse area of Idaho, Washington, Oregon, and Utah. In general, solar provides
lower capacity value than wind due to the negative correlation between winter peak load events and solar
generation which tends to be highest in the summer. Like wind, solar ELCC also diminishes as more
capacity is added. Figure 24 shows this information for the ELCC of new solar in the Greater Northwest
region.
Figure 24: Solar ELCC at Various Penetrations
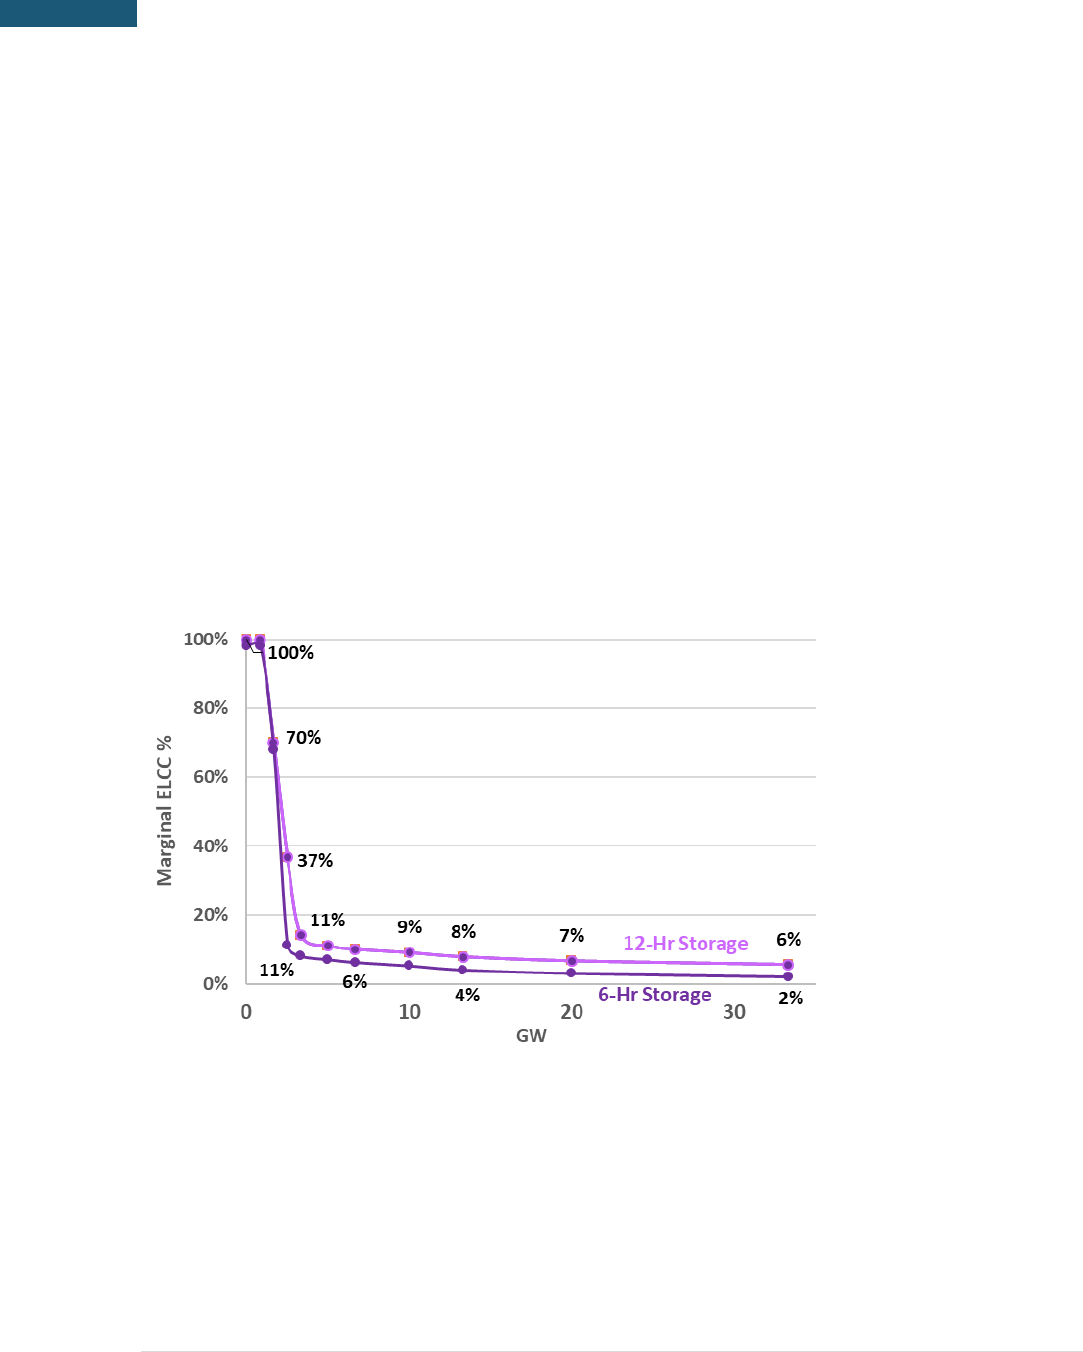
58 | P a g e
Resource Adequacy in the Pacific Northwest
5.3.5.3 Storage ELCC
At small initial penetrations, energy storage can provide nearly 100% ELCC as a substitute for peaking
generation that only needs to discharge for a small number of hours. However, at higher penetrations,
the required duration for storage to continue to provide ELCC to the system diminishes significantly. This
is primarily due to the fact that storage does not generate energy and ELCC is a measure of perfect capacity
which can reliably generate energy. This result holds true for both shorter duration (6-hr) and longer
duration (12-hr) storage which represents the upper end of duration for commercially available storage
technologies. Figure 25 highlights the steep diminishing returns of storage toward ELCC.
Figure 25: Storage ELCC at Various Penetrations
This steeply-declining ELCC value for diurnal energy storage is particularly acute in the Pacific Northwest.
This has to do with the fact that there is a significant quantity of energy storage implicit with the 35-GW
hydro system in the region. The Federal Columbia River Power System is already optimized over multiple
days, weeks and months within the bounds of non-power constraints such as flood control, navigation
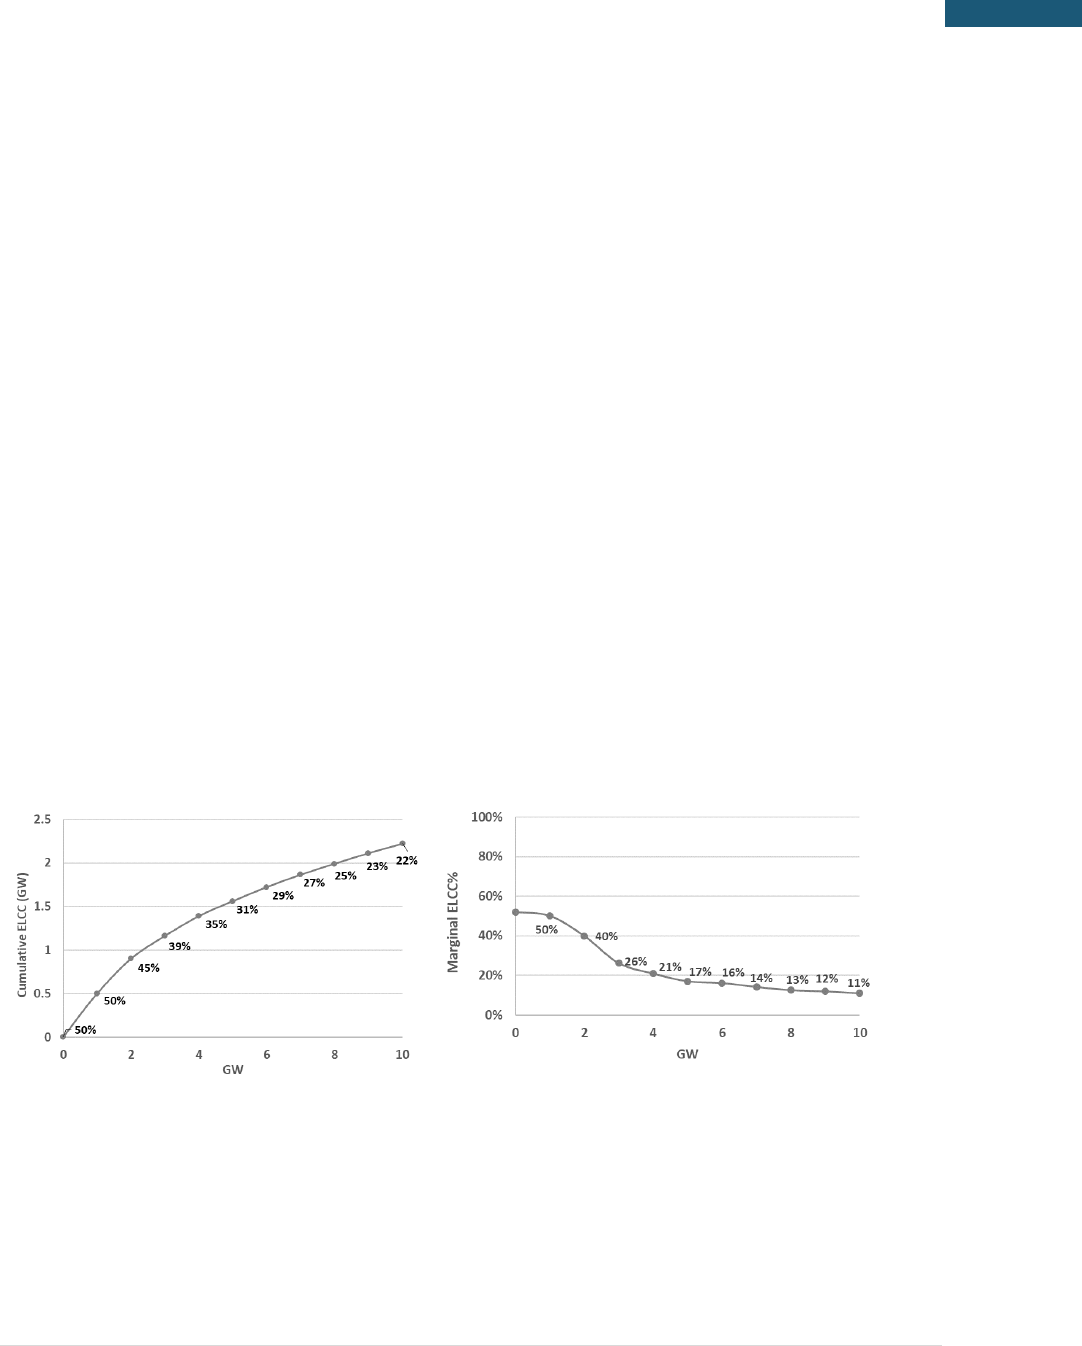
59 | P a g e
Results
© 2018 Energy and Environmental Economics, Inc.
and fish & wildlife protections. Significant quantities of energy are stored in hydroelectric reservoirs today
and dispatched when needed to meet peak loads. Thus, additional energy storage has less value for
providing resource adequacy in the Northwest than it does in regions that have little or no energy storage
today.
5.3.5.4 Demand Response ELCC
Demand response (DR) represents a resource where the system operator can call on certain customers
during times of system stress to reduce their load and prevent system-wide loss-of-load events. However,
DR programs have limitations on how often they can be called and how long participants respond when
they are called. DR in this study is represented as having a maximum of 10 calls per year with each call
lasting a maximum of 4 hours. This is a relatively standard format for DR programs, although practice
varies widely across the country. This study also assumes perfect foresight of the system operator such
that a DR call is never “wasted” when it wasn’t actually needed for system reliability.
Figure 26: Cumulative and Marginal ELCC of DR
Figure 26 shows the cumulative and marginal ELCC of DR at increasing levels of penetration. Due to the
limitations on the number of calls and duration of each call, DR has an initial ELCC of approximately 50%.
Similar to energy storage, conventional 4-hour DR has less value in the Pacific Northwest than in other

60 | P a g e
Resource Adequacy in the Pacific Northwest
regions due to the flexibility inherent in the hydro system. Also, the capacity value of DR declines as the
need for duration becomes longer and longer.
5.3.5.5 ELCC Portfolio Effects
Grouping different types of renewable resources, energy storage, and DR together often creates synergies
between the different resources such that the combined ELCC of the entire portfolio is more than the sum
of any resource’s individual contribution. For example, solar generation can provide the energy that
storage needs to be effective and storage can provide the on-demand dispatchability that solar needs to
be effective. This resulting increase in ELCC is referred to as the diversity benefit.
Figure 27 shows the average ELCC for each resource type both on a stand-alone basis and also with a
diversity allocation that accrues to each resource when they are added to a portfolio together.
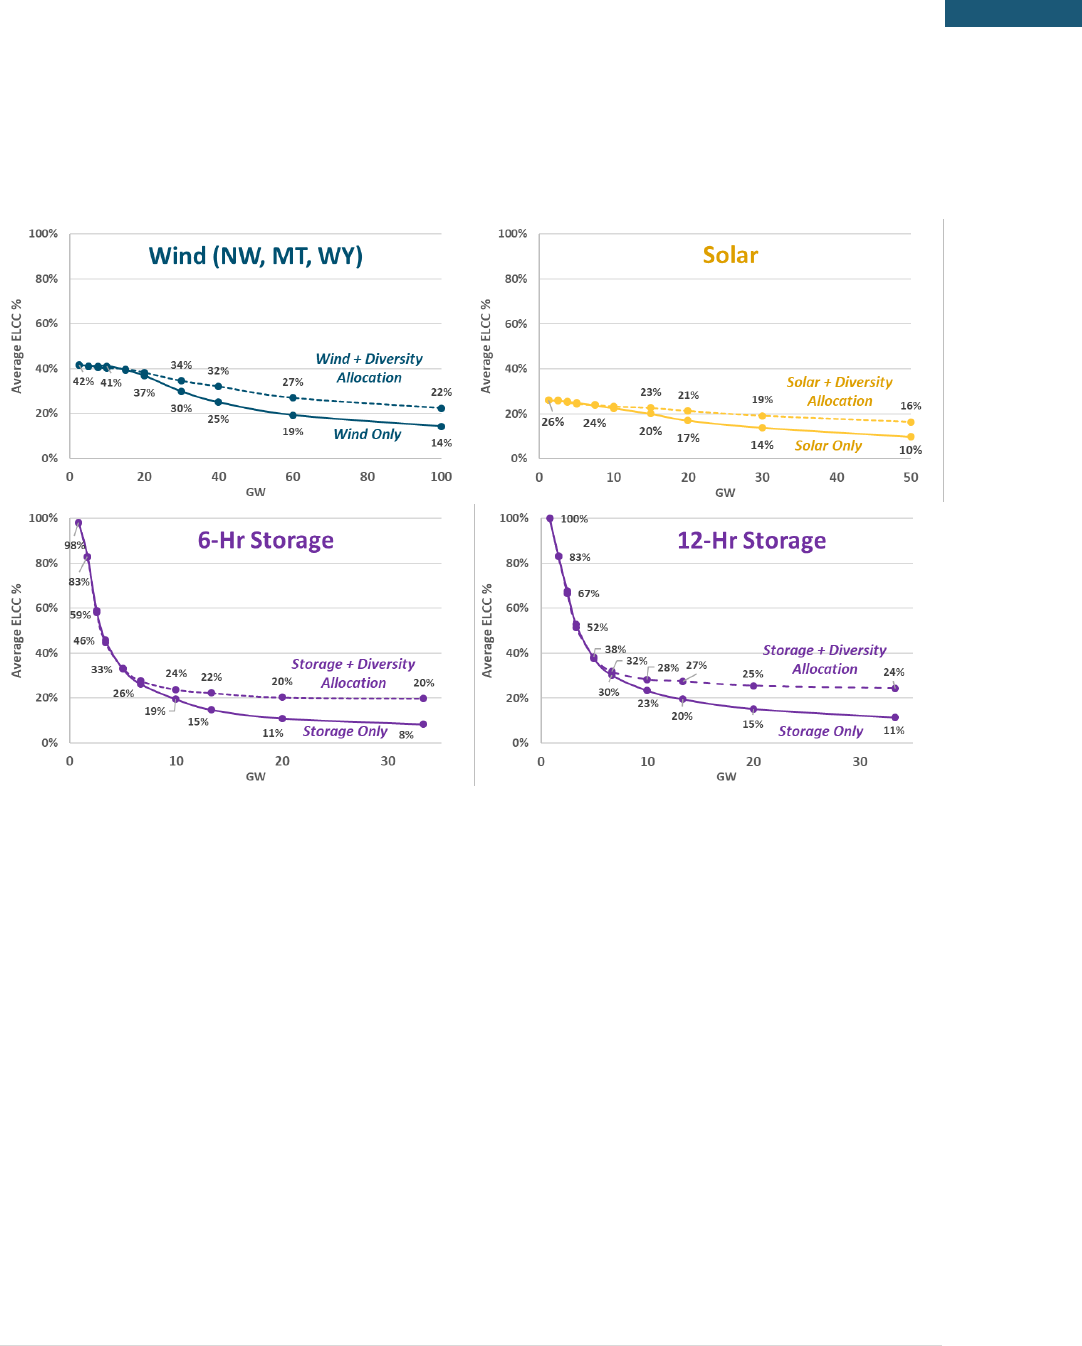
61 | P a g e
Results
© 2018 Energy and Environmental Economics, Inc.
Figure 27: ELCC of Solar, Wind, and Storage with Diversity Benefits
Figure 28 presents the cumulative portfolio ELCC of wind, solar, and storage up to the penetrations
required to reliably serve load in a 100% GHG Reduction scenario. At high penetrations of renewables and
storage, most of the ELCC is realized through diversity, although it still requires approximately 170 GW of
nameplate renewable and storage resources to provide an equivalent of 37 GW of firm ELCC capacity that
is required to retire all fossil generation. However, unlike adding these resources on a standalone basis, a
combined portfolio continues to provide incremental ELCC value of approximately 20% of nameplate even
at very high levels of penetration.
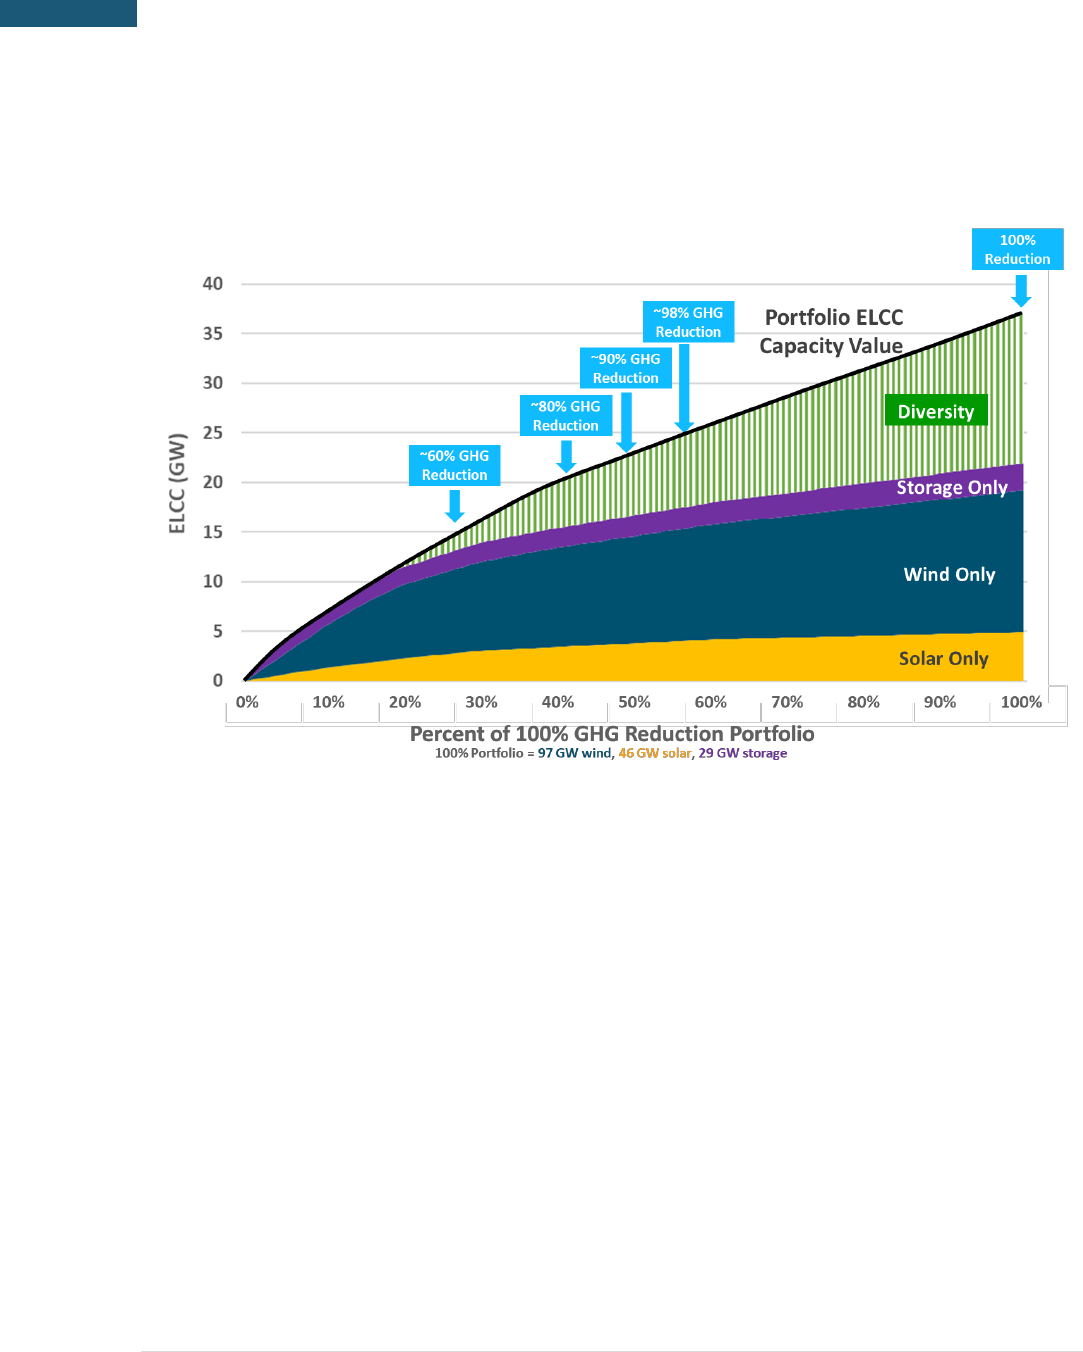
62 | P a g e
Resource Adequacy in the Pacific Northwest
Figure 28: ELCC of Different Portfolios in 2050
5.3.6 SENSITIVITY ANALYSIS
This study also explores the potential resource adequacy needs of a 100% GHG free electricity system
recognizing that emerging technologies beyond wind, solar, and electric energy storage that are not yet
available today may come to play a significant role in the region’s energy future. Specifically, the
alternative resources analyzed are: clean baseload, ultra-long duration storage, and biogas which are
further described in Table 21.

63 | P a g e
Results
© 2018 Energy and Environmental Economics, Inc.
Table 21: Sensitivity Descriptions
Sensitivity Name
Description
Clean Baseload
Assesses the impact of technology that generates reliable baseload
power with zero GHG emissions. This scenario might require a
technology such as a small modular nuclear reactor (SMR), fossil
generation with 100% carbon capture and sequestration, or other
undeveloped or commercially unproven technology.
Ultra-Long Duration Storage
Assesses the impact of an ultra-long duration electric energy storage
technology (e.g., 100’s of hours) that can be used to integrate wind
and solar. This technology is not commercially available today at
reasonable cost.
Biogas
Assesses the impact of a GHG free fuel (e.g., biogas, renewable natural
gas, etc.) that could be used with existing dispatchable generation
capacity.
All three of these alternative technology options have the potential to greatly reduce the required
renewable overbuild of the system as shown in Figure 29. This is achieved because each of these
technologies is dispatchable and can generate energy during prolonged periods of low wind and solar
production when short-duration energy storage would become depleted.
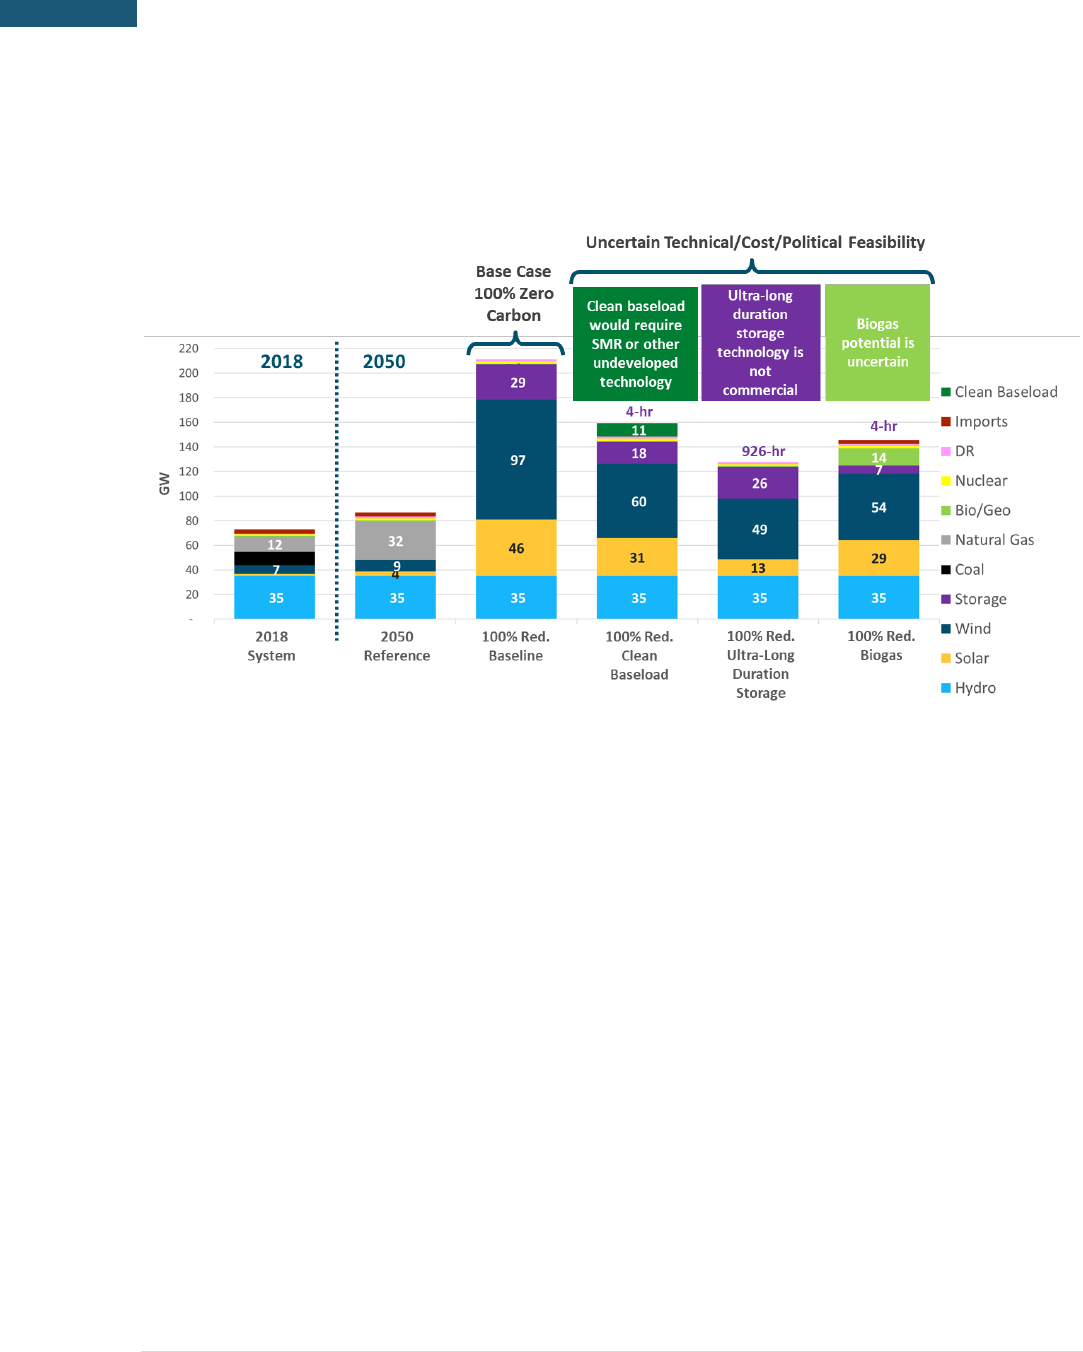
64 | P a g e
Resource Adequacy in the Pacific Northwest
Figure 29: 2050 100% GHG Reduction Sensitivity Portfolio Results
While these alternative technologies clearly highlight the benefits, there are significant technical
feasibility, economic, and political feasibility hurdles that stand in the way of large-scale adoption of these
alternatives at the present time. In particular, clean baseload would require some technology such as
small modular nuclear reactors which is not yet commercially available. Geothermal could provide a clean
baseload resources but is limited in technical potential across the region. Fossil generation with carbon
capture and sequestration (CCS) is another potential candidate, but the technology is not widely deployed,
the cost at scale is uncertain, and current CCS technologies do not achieve a 100% capture rate. Ultra-long
duration storage (926 hours) is not commercially available at reasonable cost assuming the technology is
limited to battery storage or other commercially proven technologies. Biogas potential is also uncertain
and there will be competition from other sectors in the economy to utilize what may be available. A
detailed table of installed nameplate capacity for each portfolio is summarized in Appendix A.2.

65 | P a g e
Results
© 2018 Energy and Environmental Economics, Inc.
Table 22 shows key cost metrics for the 100% GHG Reduction sensitivity scenarios. For consistency with
the base case scenarios, all costs are relative to the 2050 Reference scenario.
Table 22. 100% GHG Reduction Sensitivity Key Cost Metrics
Metric
100% GHG
Reduction
Baseline
100% GHG
Reduction
Clean
Baseload
100% GHG
Reduction
Ultra-Long
Duration
Storage
100% GHG
Reduction
Biogas
Carbon Emissions (MMT CO
2
/ year)
0
0
0
0
Annual Incremental Cost ($B)
$12- $28
$11-$22
$370-$920
$2 - $10
Annual Incremental Cost ($/MWh)
$39-$91
$36-$70
$1,200-$3,000
$5 - $32
Analyzing the portfolio and key cost metrics for each of the 100% GHG Reduction sensitivity cases yields
several notable observations.
In the Clean Baseload sensitivity, the availability of a carbon-free source of baseload generation
dramatically reduces the amount of investment in variable renewables and storage needed to
maintain reliability: adding 11 GW of clean baseload resource displaces a portfolio of 15 GW solar,
37 GW wind, and 11 GW of storage. In the context of a highly renewable grid, baseload resources
that produce energy round-the-clock—including during periods when variable resources are not
available—provide significant reliability value to the system. However, at an assumed price of
$91/MWh, the scenario still results in considerable additional costs to ratepayers of between $11-
22 billion per year relative to the Reference Scenario.
The Ultra-Long Duration Storage sensitivity illustrates a stark direct relationship between the
magnitude of renewable overbuild and the storage capability of the system: limiting renewable
curtailment while simultaneously serving load with zero carbon generation reliability requires
energy storage capability of a duration far beyond today’s commercial applications (this
relationship is further explored in Figure 30 below). Without significant breakthrough in storage
technologies, such a portfolio is beyond both technical and economic limits of feasibility.
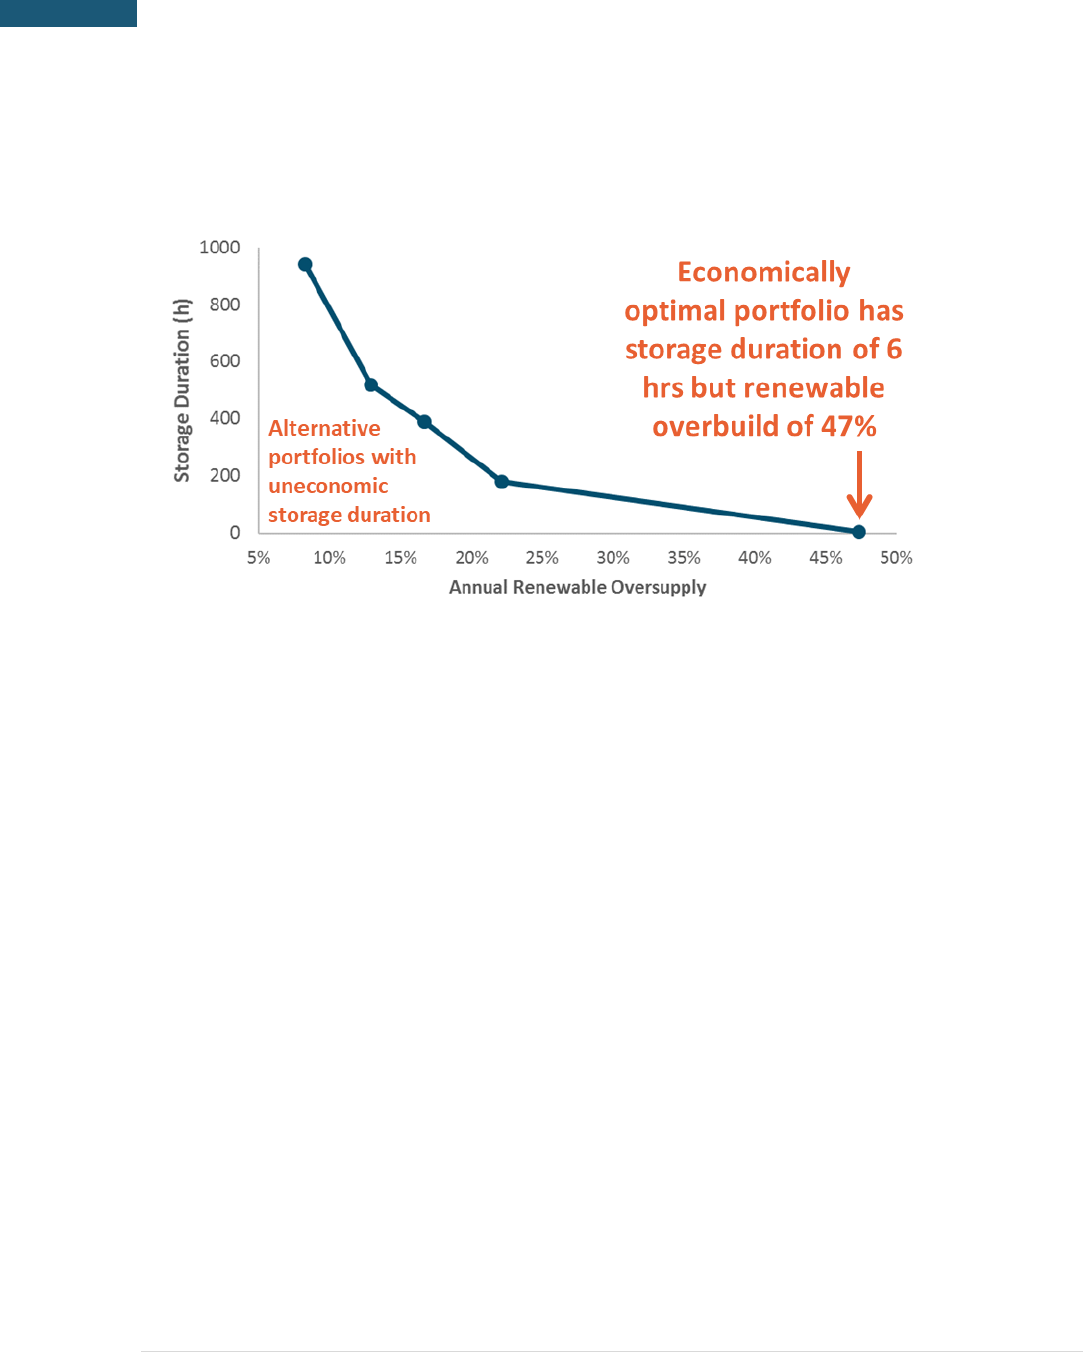
66 | P a g e
Resource Adequacy in the Pacific Northwest
Figure 30: Tradeoff between Renewable Curtailment and Storage Duration
The Biogas sensitivity demonstrates the relatively high value of the potential option to combust
renewable natural gas in existing gas infrastructure. In this scenario, 14 GW of existing and new
gas generation capacity is retained by 2050, serving as a reliability backstop for the system during
periods of prolonged low renewable output by burning renewable gas. This sensitivity offers the
lowest apparent cost pathway to a zero-carbon electric system because biogas generation does
not require significant additional capital investments. While the biogas fuel is assumed to be quite
expensive on a unit cost basis, the system doesn’t require very much fuel, so the total cost remains
reasonable. Moreover, biogas generation uses the same natural gas delivery and generation
infrastructure as the Reference Case, significantly reducing the capital investments required.
However, the availability of sufficient biomass feedstock to meet the full needs of the electric
sector remains an uncertainty. Moreover, there may be competing uses for biogas in the building
and industrial sectors that inhibit the viability of this approach.
67 | P a g e
Discussion & Implications
© 2018 Energy and Environmental Economics, Inc.
6 Discussion & Implications
6.1 Land Use Implications of High Renewable Scenarios
Renewables such as wind and solar generation require much greater land area to generate equivalent
energy compared to generation sources such as natural gas and nuclear. In the deep decarbonization
scenarios, significant amount of land area is required for renewable development. In the 100% GHG
Reduction Scenario, estimates of total land use vary from 3 million acres to 14 million acres which is
equivalent to 20 to 100 times the land area of Portland and Seattle combined. This is almost three times
the land use required under the 80% GHG Reduction scenario.
Table 23. Renewable Land Use in 2050
2050 Scenario
Units
Solar Total
Land Use
Wind – Direct
Land
19
Use
Wind – Total
Land
20
Use
80% GHG Reduction
Thousand acres
84
94
1,135 – 5,337
100% GHG Reduction
Thousand acres
361
241
2,913 – 13,701
Even though such vast expanses of land are available, achieving very high levels of decarbonization would
require extensive land usage for such large renewable development. Additionally, significant quantities of
land would be required to site the necessary transmission to deliver the renewable energy.
19
Direct land use is defined as disturbed land due to physical infrastructure development and includes wind turbine pads, access roads, substations
and other infrastructure
20
Total land use is defined as the project footprint as a whole and is the more commonly cited land-use metric associated with wind plants. They vary
with project and hence as presented as a range
Both direct and total land use for wind is sourced from NREL’s technical report: https://www.nrel.gov/docs/fy09osti/45834.pdf
Land use for solar is sourced from NREL’s technical report: https://www.nrel.gov/docs/fy13osti/56290.pdf
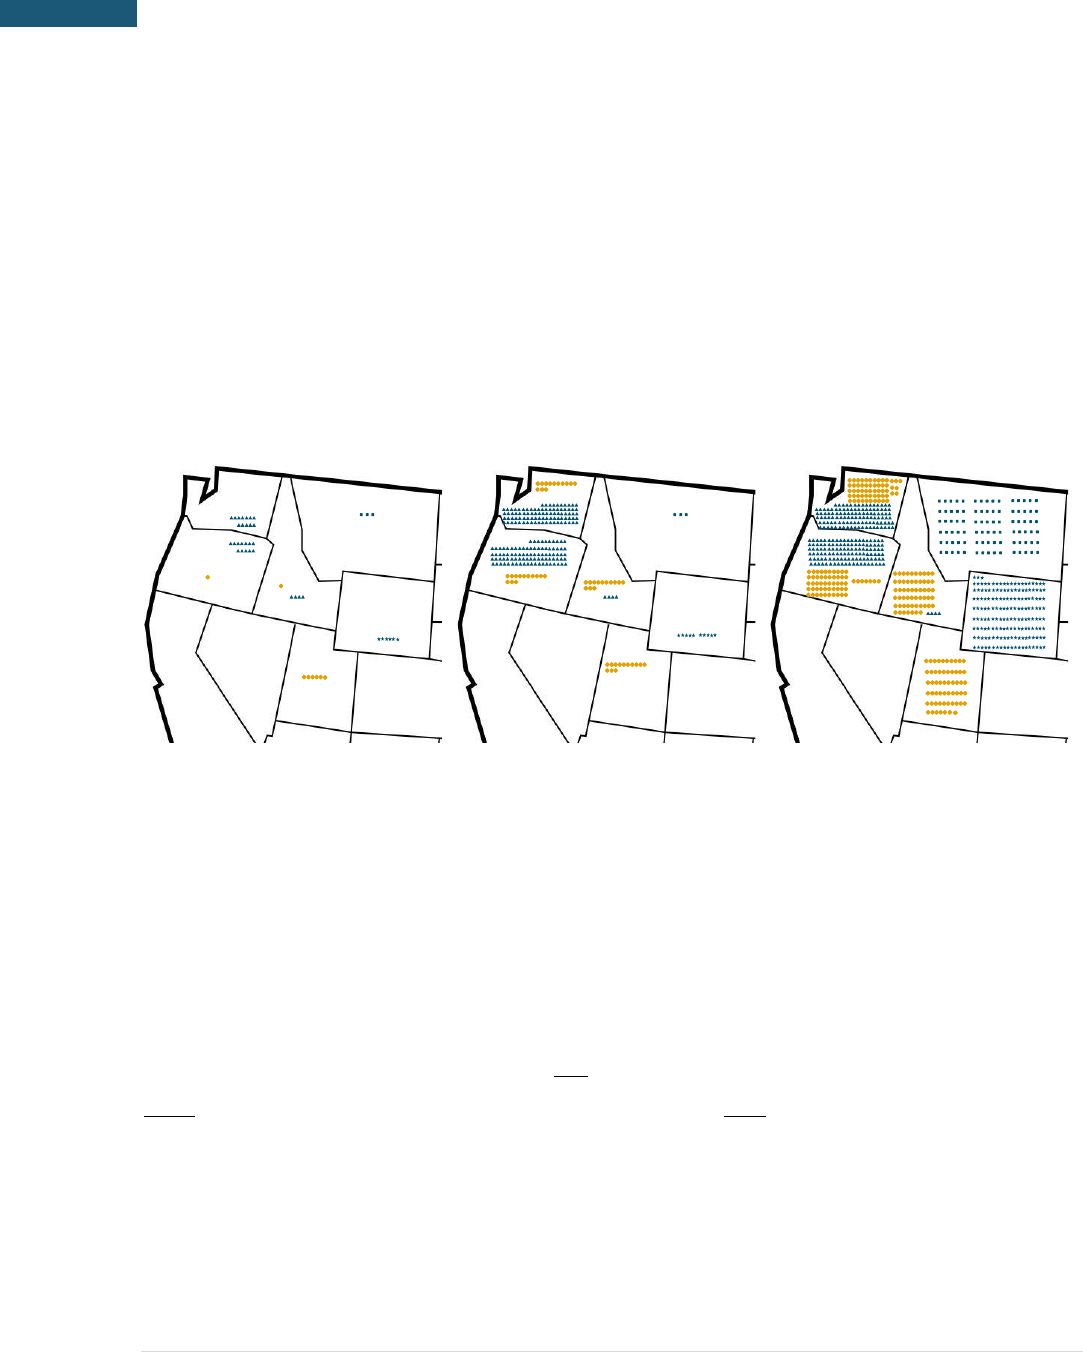
68 | P a g e
Resource Adequacy in the Pacific Northwest
Figure 31 highlights the scale of renewable development that would be required to achieve 100% GHG
reductions via only wind, solar, and storage. Each dot in the map represents a 200 MW wind or solar farm.
Note that sites are not to scale or indicative of site location.
Figure 31: Map of Renewable Land Use Today and in 80% and 100% GHG Reduction Scenario. Each dot
represents one 200 MW power plant (blue = wind, yellow = solar)
6.2 Reliability Standards
Determining the reliability standard to which each electricity system plans its resource adequacy is the
task of each individual Balancing Authority as there is no mandatory or voluntary national standard. There
are several generally accepted standards used in resource adequacy across North America, with the most
common being the “1-in-10” standard. There is, however, a range of significant interpretations for this
metric. Some interpret it as one loss-of-load day every ten years. Some interpret it as one loss-of-load
event every ten years. And some interpret it as one loss-of-load hour every ten years. The translation of
these interpretations into measurable reliability metrics further compounds inconsistency across
jurisdictions. However, the ultimate interpretation of most jurisdictions ultimately boils down to the use
of one of four reliability metrics:
Today 80% CO2 Reduction
100% CO2 Reduction

69 | P a g e
Discussion & Implications
© 2018 Energy and Environmental Economics, Inc.
Annual Loss of Load Probability (aLOLP)
• The probability in a year that load + reserves exceed generation at any time
Loss of Load Frequency (LOLF)
• The total number of events in a year where load + reserves exceed generation
Loss of Load Expectation (LOLE)
• The total number of hours in a year where load + reserves exceed generation
Expected Unserved Energy (EUE)
• The total quantity of unserved energy in a year when load + reserves exceed generation
Each of these metrics provides unique insight into the reliability of the electric system and provides
information that cannot be ascertained by simply using the other metrics. At the same time, each of the
metrics is blind to many of the factors that are ascertained through the other metrics.
The NWPCC sets reliability standards for the Pacific Northwest to have an annual loss of load probability
(aLOLP) to be below 5%. This would mean loss-of-load events occur, on average, less than once in 20
years. However, this metric does not provide any information on the number of events, duration of
events, or magnitude of events that occur during years that experience loss of load. While this metric has
generally served the region well when considering that the biggest reliability drive (hydro) was on an
annual cycle, this metric becomes increasingly precarious when measuring a system that is more and more
dependent upon renewables.
This study uses loss of load expectation (LOLE), because it is a more common metric that is used by utilities
and jurisdictions across the country. Unlike aLOLP, LOLE does yield insight on the duration of events which
can help to provide greater detail whether or not a system is adequately reliable.

70 | P a g e
Resource Adequacy in the Pacific Northwest
However, LOLE does not capture the magnitude of events when they occur and thus misses a potentially
large measure of reliability as compared to a metric such as EUE. EUE captures the total quantity of energy
that is expected to go unserved each year. While this metric is not perfect, it is likely the most robust
metric in terms of measuring the true reliability of an electric system, particularly in a system that is
energy-constrained. Despite these attributes, EUE is not commonly used as a reliability metric in the
industry today.
RECAP calculates all the aforementioned reliability metrics and can be used to compare and contrast their
performance across different portfolios. Table 24 shows the four reliability metrics across different 2050
decarbonization scenarios.
Table 24: Reliability Statistics Across 2050 Decarbonization Portfolios
Reliability Metric
Units
2050
Reference
80%
GHG Red.
100%
GHG Red.
aLOLP
%/yr
3.6%
8.1%
10.5%
LOLF
#/yr
0.16
0.29
0.13
LOLE
hrs/yr
2.4
2.4
2.4
EUE
GWh/yr
1.0
2.0
19.0
Because the portfolios were calibrated to meet a 2.4 hrs./yr. LOLE standard, all portfolios yield exactly this
result. However, this does not mean that all portfolios are equally reliable. Notably, the 100% GHG
Reduction scenario has nearly 20 times the quantity of expected unserved energy (EUE) as compared to
the reference scenario. The value of unserved energy varies widely depending on the customer type and
outage duration; studies typically put the value between $5,000 and $50,000/MWh. This means that the
economic cost of unserved energy in the 2050 Reference Scenario is between $5 million and $50 million
per year. However, in the 100% GHG Reduction Scenario, which meets the same target for LOLE, the value
of unserved energy could be nearly $1 billion annually.

71 | P a g e
Discussion & Implications
© 2018 Energy and Environmental Economics, Inc.
This gives an important insight to some of the qualities of a system that is highly dependent upon dispatch-
limited resources. For a traditional system that is composed mainly of dispatchable generation (coal,
natural gas, nuclear, etc.), the primary reliability challenge is whether there is enough capacity to serve
peak load. Even if the peak is slightly higher than expected or power plants experience forced outages and
are unavailable to serve load, the difference between available generation and total load should be
relatively small. Conversely, for a system that is highly dependent upon variable generation and other
dispatch limited generation, there is a much greater chance that the sum of total generation could be
significantly lower than total load. This phenomenon was highlighted in Section 5.3.3. The reliability
statistics above confirm this intuition by highlighting how aLOLP, LOLF, and LOLE are each uniquely
inadequate to fully capture the reliability of a system that is highly dependent upon variable renewable
energy. For a system that is heavily dependent on variable generation, EUE may be a more useful
reliability metric than the conventional LOLE metrics.
6.3 Benefits of Reserve Sharing
One of the simplifying assumptions made in this study to examine reliability across the Greater Northwest
is the existence of a fully coordinated planning and operating regime within the region. In reality, however,
responsibility for maintaining reliability within the system is distributed among individual utilities and
balancing authorities with oversight from state utility commissions. The current distributed approach to
reliability planning has two interrelated shortcomings:
1) Because the region’s utilities each plan to meet their own needs, they may not rigorously account
for the natural load and resource diversity that exists across the footprint. If each utility built
physical resources to meet its own need, the quantity of resources in the region would greatly
exceed what would be needed to meet industry standards for loss-of-load.

72 | P a g e
Resource Adequacy in the Pacific Northwest
2) As an informal mechanism for taking advantage of the load and resource diversity that exists in
the region, many utilities rely on front-office transactions (FOTs) or market purchases instead of
physical resources, as was discussed in Section 2. This helps to reduce costs to ratepayers of
maintaining reliability by avoiding the construction of capacity resources. However, as the region
transitions from a period of capacity surplus to one of capacity deficit, and because there is no
uniform standard for capacity accreditation, there is a risk that overreliance on FOTs could lead
to underinvestment in resources needed to meet reliability standards.
Formal regional planning reserve sharing could offer multiple benefits in the Greater Northwest by taking
advantage of load and resource diversity that exists across the region. A system in which each utility builds
physical assets to meet its own needs could result in overcapacity, because not every system peaks at the
same time. Planning to meet regional coincident peak loads requires less capacity than meeting each
individual utility’s peak loads. Further, surplus resources in one area could be utilized to meet a deficit in
a neighboring area. Larger systems require lower reserve margins because they are less vulnerable to
individual, large contingencies. A regional entity could adopt more sophisticated practices and computer
models than individual utilities and manage capacity obligation requirements independent from the
utilities.
Table 25 provides a high-level estimate of the benefits that could accrue if the Northwest employed a
formal planning reserve sharing system. The benefits are divided into (1) benefits due to switching from
individual utility peak to regional peak and (2) benefits due to lower target PRM.
A regional planning reserve sharing system could be established in the Greater Northwest. A regional
entity could be created as a voluntary organization of utilities and states/provinces. The regional entity
would perform loss-of-load studies for the region and calculate the regional PRM and develop accurate
methods for estimating capacity credit of hydro and renewables. The entity would create a forward
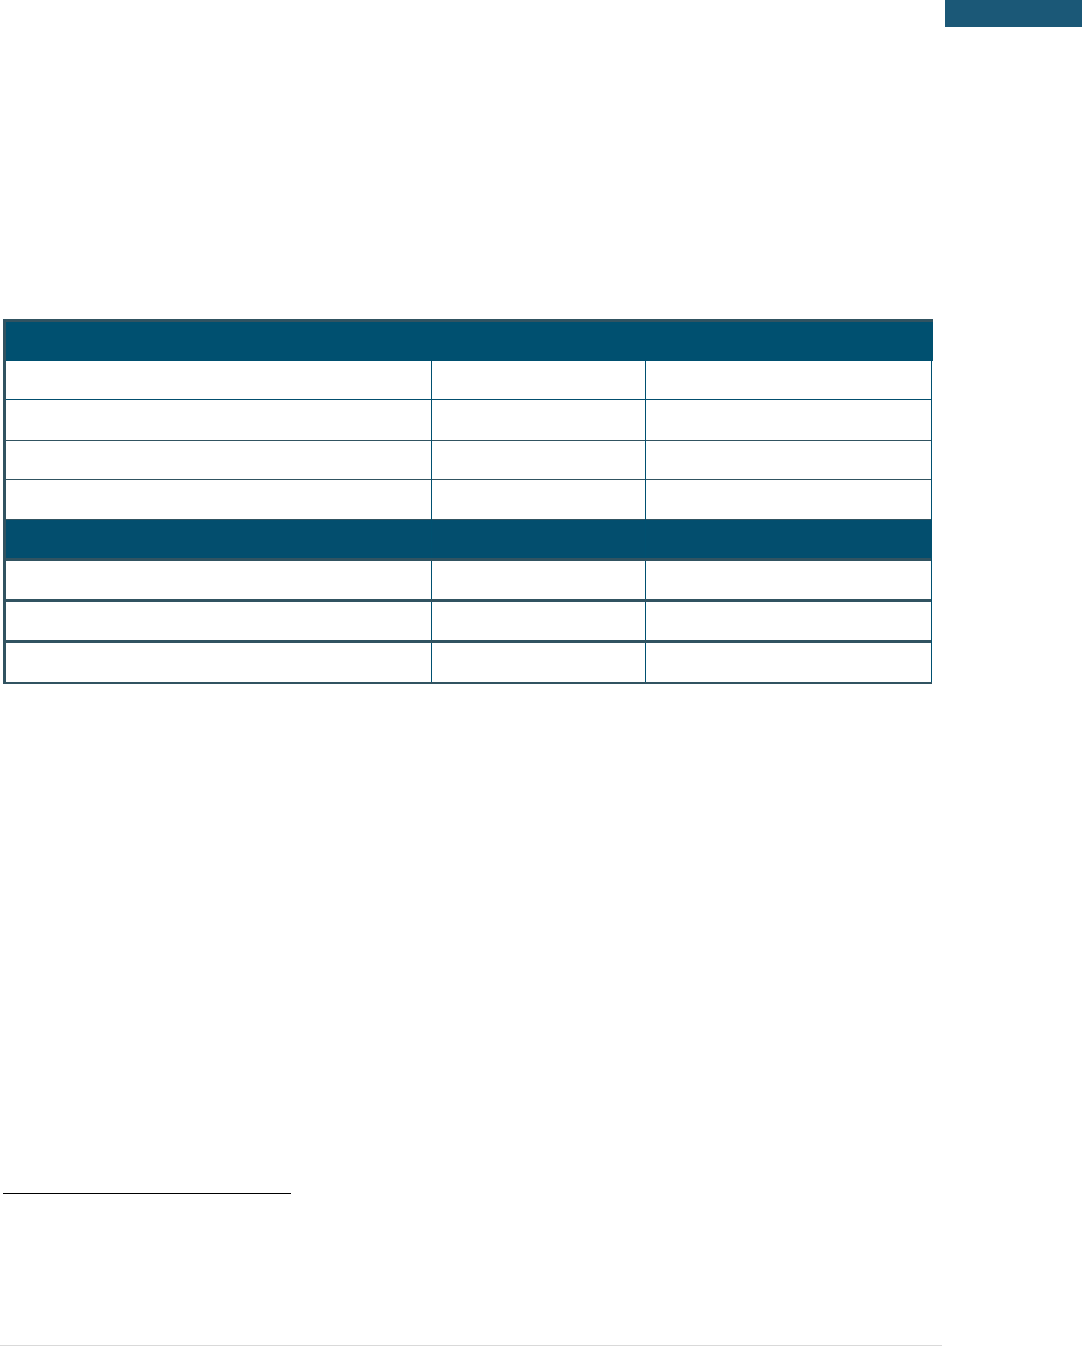
73 | P a g e
Discussion & Implications
© 2018 Energy and Environmental Economics, Inc.
capacity procurement obligation based on studies and allocate responsibility based on their share of the
regional requirement.
Table 25. Possible Benefits from a Regional Planning Reserve Sharing System in the Northwest
21
Capacity Requirement
BPA + Area
NWPP (US)
Individual Utility Peak + 15% PRM (MW)
33,574
46,398
Regional Peak + 15% PRM (MW)
32,833
42,896
Reduction (MW)
741
3,502
Savings ($MM/year)
$89
$420
BPA + Area
NWPP (US)
Regional Peak + 12% PRM (MW)
31,977
41,777
Reduction (MW)
1,597
4,621
Savings ($MM/year)
$192
$555
Rules similar to other markets could be made for standardized capacity accreditation of individual
resources such as dispatchable generation, hydro generation, variable generation, demand response and
energy storage. Tradable capacity products could be defined based on the accredited capacity.
A regional entity could be formed by voluntary association in the Greater Northwest. It could be governed
by independent or stakeholder board. Alternatively, new functionality could be added to the existing
reserve sharing groups such as Northwest Power Pool (NWPP) and Southwest Reserve Sharing Group,
which expand their operating reserve sharing to include planning reserve sharing. It would not require
setting up a regional system operator immediately and PRM sharing could be folded into a regional system
operator if and when it forms.
21
Calculated regional and non-coincident peaks using WECC hourly load data averaged over 2006-2012. Savings value estimated using capacity cost
of $120/kW-yr. Assumes no transmission constraints within the region. Ignores savings already being achieved through bilateral contracts

74 | P a g e
Resource Adequacy in the Pacific Northwest
7 Conclusions
The Pacific Northwest is expected to undergo significant changes to its electricity generation resource mix
over the next 30 years due to changing economics of resources and more stringent environmental policy
goals. In particular, the costs of wind, solar, and battery storage have experienced significant declines in
recent years, a trend that is expected to continue. Greenhouse gas and other environmental policy goals
combined with changing economics have put pressure on existing coal resources, and many coal power
plants have announced plans to retire within the next decade.
As utilities become more reliant on intermittent renewable energy resources (wind and solar) and energy-
limited resources (hydro and battery storage) and less reliant on dispatchable firm resources (coal),
questions arise about how the region will serve future load reliably. In particular, policymakers across the
region are considering many different policies – such as carbon taxes, carbon caps, renewable portfolio
standards, limitations on new fossil fuel infrastructure, and others – to reduce greenhouse gas emissions
in the electricity sector and across the broader economy. The environmental, cost, and reliability
implications of these various policy proposals will inform electricity sector planning and policymaking in
the Pacific Northwest.
This study finds that deep decarbonization of the Northwest grid is feasible without sacrificing reliable
electric load service. But this study also finds that, absent technological breakthroughs, achieving 100%
GHG reductions using only wind, solar, hydro, and energy storage is both impractical and prohibitively
expensive. Firm capacity – capacity that can be relied upon to produce energy when it is needed the most,
even during the most adverse weather conditions – is an important component of a deeply-decarbonized
grid. Increased regional coordination is also a key to ensuring reliable electric service at reasonable cost
under deep decarbonization.

75 | P a g e
Conclusions
© 2018 Energy and Environmental Economics, Inc.
7.1 Key Findings
1. It is possible to maintain Resource Adequacy for a deeply decarbonized Northwest electricity grid,
as long as sufficient firm capacity is available during periods of low wind, solar, and hydro
production;
o Natural gas generation is the most economic source of firm capacity today;
o Adding new gas generation capacity is not inconsistent with deep reductions in carbon
emissions because the significant quantities of zero-marginal-cost renewables will ensure
that gas is only used during reliability events;
o Wind, solar, demand response, and short-duration energy storage can contribute but
have important limitations in their ability to meet Northwest Resource Adequacy needs;
o Other potential low-carbon firm capacity solutions include (1) new nuclear generation,
(2) fossil generation with carbon capture and sequestration, (3) ultra-long duration
electricity storage, and (4) replacing conventional natural gas with carbon-neutral gas
such as hydrogen or biogas.
2. It would be extremely costly and impractical to replace all carbon-emitting firm generation
capacity with solar, wind, and storage, due to the very large quantities of these resources that
would be required;
o Firm capacity is needed to meet the new paradigm of reliability planning under deep
decarbonization, in which the electricity system must be designed to withstand prolonged
periods of low renewable production once storage has depleted; renewable overbuild is
the most economic solution to completely replace carbon-emitting resources but requires
a 2x buildout that results in curtailment of almost half of all wind and solar production.
3. The Northwest is expected to need new capacity in the near term in order to maintain an
acceptable level of Resource Adequacy after planned coal retirements.
4. Current planning practices risk underinvestment in the new capacity needed to ensure Resource
Adequacy at acceptable levels;

76 | P a g e
Resource Adequacy in the Pacific Northwest
o Reliance on market purchases or front-office transactions (FOTs) reduces the cost of
meeting Resource Adequacy needs on a regional basis by taking advantage of load and
resource diversity among utilities in the region;
o Capacity resources are not firm without a firm fuel supply; investment in fuel delivery
infrastructure may be required to ensure Resource Adequacy even under a deep
decarbonization trajectory;
o Because the region lacks a formal mechanism for ensuring adequate physical firm
capacity, there is a risk that reliance on market transactions may result in double-counting
of available surplus generation capacity;
o The region might benefit from and should investigate a formal mechanism to share
planning reserves on a regional basis, which may help ensure sufficient physical firm
capacity and reduce the quantity of capacity required to maintain Resource Adequacy

A-1 | P a g e
© 2018 Energy and Environmental Economics, Inc.
Assumption Development Documentation
Appendix A. Assumption Development
Documentation
A.1 Baseline Resources
Table 26. NW Baseline Resources Installed Nameplate Capacity (MW) by Year.
Category
Resource Class
2018
2030
2050
Thermal
Natural Gas
12,181
19,850
31,500
Coal
10,895
8,158
0
Nuclear
1,150
1,150
1,150
Total
24,813
29,745
33,237
Firm Renewable
Geothermal
79.6
79.6
79.6
Biomass
489.2
489.2
489.2
Variable Renewables
Wind
7,079
7,079
9,205
Solar
1,557
1,557
3,593
Hydro
Hydro
35,221
35,221
35,221
Storage
Storage
0
0
0
DR
Shed Demand Response
600
2,200
5,500
Imports
Imports*
3,400
3,400
3,400
*Imports consist of market purchases and non-summer firm imports. For more details, please refer to Imports
section.

A-2 | P a g e
Resource Adequacy in the Pacific Northwest
A.2 Portfolios of Different Scenarios
Table 27. Portfolios for 2030 scenarios – Installed Nameplate Capacity (GW) by Scenario
Resource Class
Reference
No Coal
Solar
1.6
1.6
Wind
7.1
7.1
DR
2.2
2.2
Hydro
35.2
35.2
Coal
8.2
-
Natural Gas
19.9
28.0
Nuclear
1.2
1.2
Bio/Geo
0.6
0.6
Storage
-
-
Imports
3.4
3.4
Table 28. Portfolios for 2050 scenarios – Installed Nameplate Capacity (GW) by Scenario
Resource Class
Reference
60% GHG
Reduction
80% GHG
Reduction
90% GHG
Reduction
98% GHG
Reduction
100% GHG
Reduction
Solar
3.6
10.6
10.6
10.6
29.2
45.6
Wind
9.2
22.9
38.0
48.2
53.8
97.4
DR
5.5
5.5
5.5
5.5
5.5
5.5
Hydro
35.2
35.2
35.2
35.2
35.2
35.2
Coal
-
-
-
-
-
-
Natural Gas
31.5
25.5
23.5
19.5
13.5
-
Nuclear
1.2
1.2
1.2
1.2
1.2
1.2
Bio/Geo
0.6
0.6
0.6
0.6
0.6
0.6
Storage
-
2.2
(4-hr)
2.2
(4-hr)
4.4
(4-hr)
6.7
(4-hr)
28.7
(6-hr)
Imports
3.4
3.4
3.4
3.4
3.4
-

A-3 | P a g e
© 2018 Energy and Environmental Economics, Inc.
Assumption Development Documentation
Table 29. Zero Carbon Sensitivity Portfolios in 2050– Installed Nameplate Capacity (GW) by Scenario
Resource Class
100% GHG Reduction
Renewables
100% GHG Reduction
Baseload Tech
100% GHG Reduction
Long Duration Storage
100% GHG Reduction
Biogas
Solar
45.6
30.7
13.5
29.2
Wind
97.4
60.5
49.2
53.8
DR
5.5
5.5
5.5
5.5
Hydro
35.2
35.2
35.2
35.2
Coal
-
-
-
-
Natural Gas
-
-
-
13.5
Nuclear
1.2
1.2
1.2
1.2
Bio/Geo
0.6
0.6
0.6
0.6
Storage
28.7
(6-hr)
18.0
(4-hr)
25.9
(926-hr)
6.7
(4-hr)
Clean Baseload
-
11.3
-
-
Imports
-
-
-
-

B-1 | P a g e
© 2018 Energy and Environmental Economics, Inc.
RECAP Model Documentation
Appendix B. RECAP Model
Documentation
B.1 Background
RECAP is a loss-of-load-probability model developed by E3 to examine the reliability of electricity systems
under high penetrations of renewable energy and storage. In this study, RECAP is used to assess reliability
using the loss-of-load expectation (LOLE) metric. LOLE measures the expected number of hours/yr when
load exceeds generation, leading to a loss-of-load event.
LOLE is one of the most commonly used metrics within the industry across North America to measure the
resource adequacy of the electricity system. LOLE represents the reliability over many years and does not
necessarily imply that a system will experience loss-of-load every single year. For example, if an electricity
system is expected to have two 5-hour loss-of-load events over a ten-year period, the system LOLE would
be 1.0 hr./yr LOLE (10 hours of lost load over 10 years).
There is no formalized standard for LOLE sufficiency promulgated by the North American Electric
Reliability Coordinating Council (NERC), and the issue is state-jurisdictional in most places expect in
organized capacity markets. In order to ensure reliability in the electricity system, the Northwest Power
and Conservation Council (NWPCC) set reliability standards for the Pacific Northwest. The current
reliability standard requires the electricity system to have an annual loss of load probability (annual LOLP)
to be below 5%. This would mean loss-of-load events occur, on average, less than once in 20 years.
However, in a system with high renewables, LOLE is a more robust reliability metric.

B-2 | P a g e
Resource Adequacy in the Pacific Northwest
B.2 Model Overview
RECAP calculates LOLE by simulating the electric system with a specific set of generating resources and
economic conditions under a wide variety of weather years, renewable generation years, hydro years,
and stochastics forced outages of generation and transmission resources, while accounting for the
correlation and relationships between these. By simulating the system thousands of times under different
combinations of these conditions, RECAP is able to provide a statistically significant estimation of LOLE.
B.2.1 LOAD
E3 modeled hourly load for the northwest under current economic conditions using the weather years
1948-2017 using a neural network model. This process develops a relationship between recent daily load
and the following independent variables:
Max and min daily temperature (including one and two-day lag)
Month (+/- 15 calendar days)
Day-type (weekday/weekend/holiday)
Day index for economic growth or other linear factor over the recent set of load data
The neural network model establishes a relationship between daily load and the independent variables
by determining a set of coefficients to different nodes in hidden layers which represent intermediate steps
in between the independent variables (temp, calendar, day index) and the dependent variable (load). The
model trains itself through a set of iterations until the coefficients converge. Using the relationship
established by the neural network, the model calculates daily load for all days in the weather record (1948-
2017) under current economic conditions. The final step converts these daily load totals into hourly loads.
To do this, the model searches over the actual recent load data (10 years) to find the day that is closest in
total daily load to the day that needs an hourly profile. The model is constrained to search within identical

B-3 | P a g e
© 2018 Energy and Environmental Economics, Inc.
RECAP Model Documentation
day-type (weekday/weekend/holiday) and +/- 15 calendar days when making the selection. The model
then applies this hourly load profile to the daily load MWh.
This hourly load profile for the weather years 1948-2017 under today’s economic conditions is then scaled
to match the load forecast for future years in which RECAP is calculating reliability. This ‘base’ load profile
only captures the loads that are present on the electricity system today and do not very well capture
systematic changes to the load profile due to increased adoption of electric vehicles, building space and
water heating, industrial electrification. Load modification through demand response is captured through
explicit analysis of this resource in Section 0.
Operating reserves of 1,250 MW are also added onto load in all hours with the assumption being that the
system operator will shed load in order to maintain operating reserves of at least 1,250 MW in order to
prevent the potentially more catastrophic consequences that might result due to an unexpected grid
event coupled with insufficient operating reserves.
B.2.2 DISPATCHABLE GENERATION
Available dispatchable generation is calculated stochastically in RECAP using forced outage rates (FOR)
and mean time to repair (MTTR) for each individual generator. These outages are either partial or full
plant outages based on a distribution of possible outage states developed using NWPCC data. Over many
simulated days, the model will generate outages such that the average generating availability of the plant
will yield a value of (1-FOR).
B.2.3 TRANSMISSION
RECAP is a zonal model that models the northwest system as one zone without any internal transmission
constraints. Imports are assumed to be available as mentioned in Imports Section 4.2.3.

B-4 | P a g e
Resource Adequacy in the Pacific Northwest
B.2.4 WIND AND SOLAR PROFILES
Hourly wind and solar profiles were simulated at all wind and solar sites across the northwest. Wind speed
and solar insolation data was obtained from the NREL Western Wind Toolkit
22
and the NREL Solar
Prospector Database
23
, respectively and transformed into hourly production profiles using the NREL
System Advisor Model (SAM). Hourly wind speed data was available from 2007-2012 and hourly solar
insolation data was available from 1998-2014.
A stochastic process was used to match the available renewable profiles with historical weather years
using the observed relationship for years with overlapping data i.e., years with available renewable data.
For each day in the historical load profile (1948-2017), the model stochastically selects a wind profile and
a solar profile using an inverse distance function with the following factors:
Season (+/- 15 days)
• Probability is 1 inside this range and 0 outside of this range
Load
• For winter peaking systems like the northwest, high load days tend to have low solar
output
Previous Day’s Renewable Generation
• High wind or solar days have a higher probability of being followed by a high wind or solar
day, and vice versa. This factor captures the effect of a multi-day low solar or low wind
event that can stress energy-limited systems that are highly dependent on renewable
energy and/or energy storage.
A graphic illustrating this process is shown in Figure 32
22
https://www.nrel.gov/grid/wind-toolkit.html
23
https://nsrdb.nrel.gov/
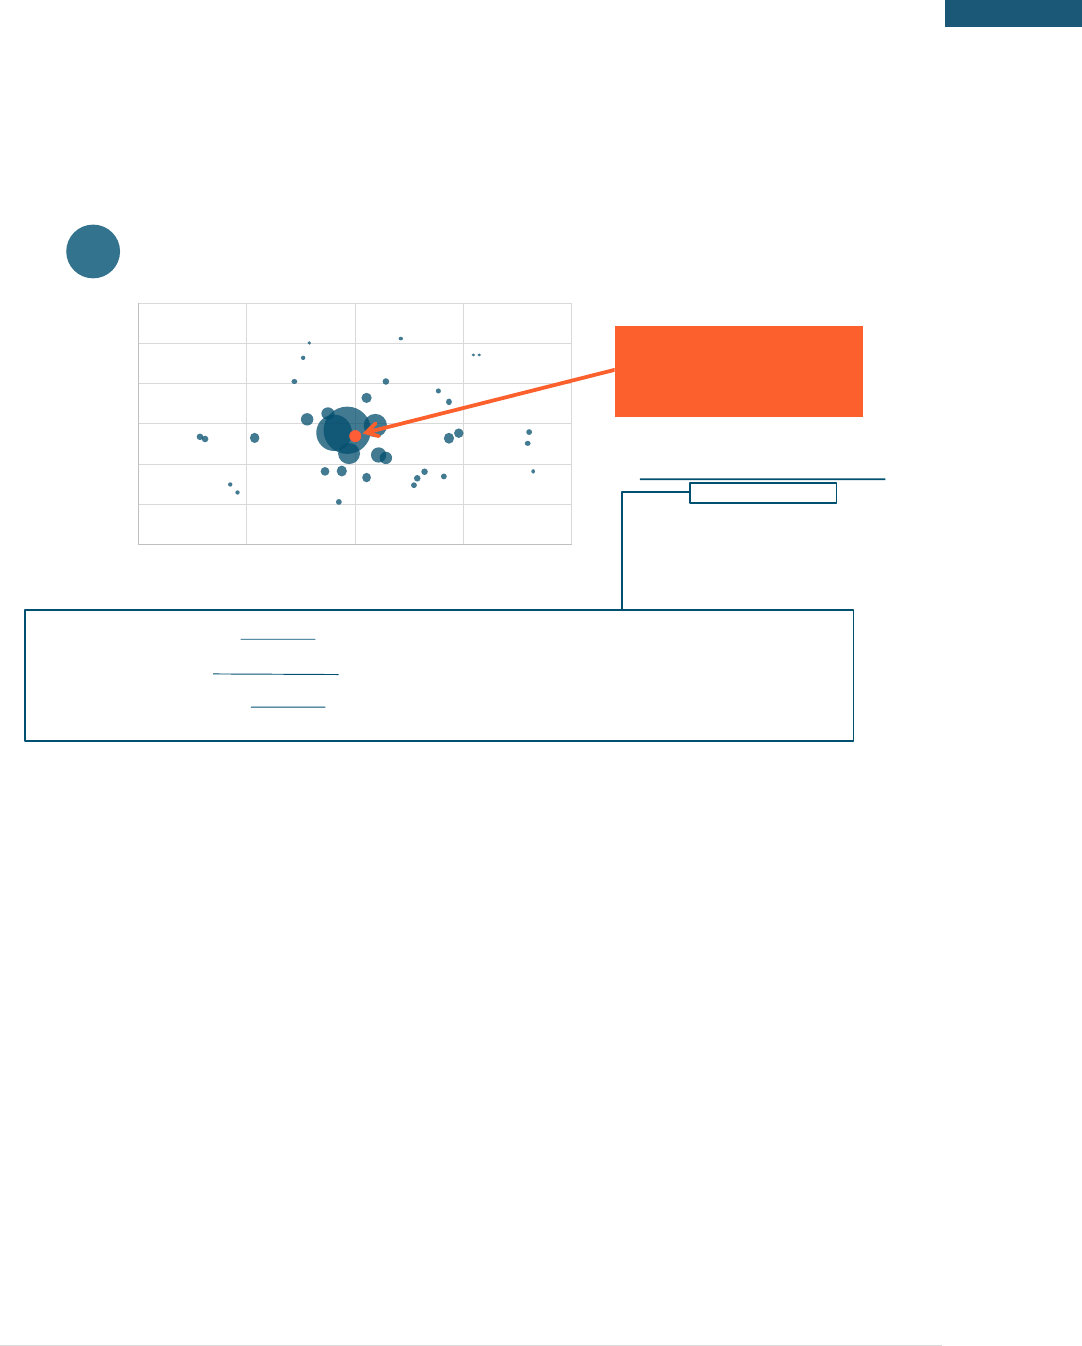
B-5 | P a g e
© 2018 Energy and Environmental Economics, Inc.
RECAP Model Documentation
Figure 32: Renewable Profile Selection Process
B.2.5 HYDRO DISPATCH
Dispatchable hydro generation is a hybrid resource that is limited by weather (rainfall) but can still be
dispatched for reliability within certain constraints. It is important to differentiate this resource from non-
dispatchable hydro such as many run-of-river systems that produce energy when there is hydro available,
similar to variable wind and solar facilities, especially in a system like northwest which has an abundance
of hydro generation.
To determine hydro availability, the model uses a monthly historical record of hydro production data from
NWPCC’s records from 1929 – 2008. The same data is used to model hydro generation in NWPCC’s
GENESYS model. For every simulated load year, a hydro year is chosen stochastically from the historical
database. The study assumes no significant hydro build in the future and no correlation with temperature,
0
10,000
20,000
30,000
40,000
50,000
60,000
70,000 75,000 80,000 85,000 90,000
Previous Day Renewable Generation
(MWh)
Today's Load (MWh)
❑ Each blue dot represents a day in the actual renewable generation sample
❑ Size of the blue dot represents the probability that the model chooses that day
based on the probability function
Day for which the
model is trying to
predict renewable
generation
abs[load
Aug 12
load
i
]/stderr
load
+
abs[renew
Aug 12
renew
i
]/stderr
renew
Probability Function Choices
Inverse distance
Square inverse distance
Gaussian distance
Multivariate normal
Probability of
sample i
being selected
=
Where
distance
i
=
Previous Day’s Daily
Renewable
Generation
(MWh)
Daily Load (MWh)

B-6 | P a g e
Resource Adequacy in the Pacific Northwest
load or renewable generation. Once the hydro year is selected, the monthly hydro budgets denote the
amount of energy generated from hydro resources in that month. Since RECAP optimizes the hydro
dispatch to minimize loss-of-load, providing only monthly budgets can dispatch hydro extremely flexibly.
For example, some of the hydro can be held back to be dispatched during generator outages. Such high
flexibility in hydro dispatch is not representative of the current northwest hydro system. Therefore, the
monthly budget is further divided into weekly budgets to ensure hydro dispatch is in line with operating
practices in the northwest.
In addition to hydro budgets, hydro dispatch has other upstream and downstream hydrological and
physical constraints that are modeled in a hydrological model by NWPCC. RECAP does not model the
complete hydrological flow but incorporates all the major constraints such as sustained peaking
(maximum generation and minimum generation) limits. Sustained peaking maximum generation
constraint results in the average hydro dispatch over a fixed duration to be under the limit. Similarly,
minimum generation constraints ensure average dispatch over a fixed duration is above the minimum
generation sustainable limits. Sustainable limits are provided over 1-hour, 2-hour, 4-hour and 10-hour
durations.
The weekly budgets and sustained peaking limits together make the hydro generation within RECAP
representative of the actual practices associated with hydro generation in the northwest. Output from
RECAP are benchmarked against hydro outputs from NWPCC’s GENESYS model.
B.2.6 STORAGE
The model dispatches storage if there is insufficient generating capacity to meet load net of renewables
and hydro. Storage is reserved specifically for reliability events where load exceeds available generation.
It is important to note that storage is not dispatched for economics in RECAP which in many cases is how
storage would be dispatched in the real world. However, it is reasonable to assume that the types of
reliability events that storage is being dispatched for (low wind and solar events), are reasonably

B-7 | P a g e
© 2018 Energy and Environmental Economics, Inc.
RECAP Model Documentation
foreseeable such that the system operator would ensure that storage is charged to the extent possible in
advance of these events. (Further, presumably prices would be high during these types of reliability events
so that the dispatch of storage for economics also would satisfy reliability objectives.)
B.2.7 DEMAND RESPONSE
The model dispatches demand response if there is still insufficient generating capacity to meet load even
after storage. Demand response is the resource of last resort since demand response programs often have
a limitation on the number of times they can be called upon over a set period of time. For this study,
demand response was modeled using a maximum of 10 calls per year, with each call lasting for a maximum
of 4 hours.
B.2.8 LOSS-OF-LOAD
The final step in the model calculates loss-of-load if there is insufficient available dispatchable generation,
renewables, hydro, storage, and demand response to serve load + operating reserves.

C-8 | P a g e
Resource Adequacy in the Pacific Northwest
Appendix C. Renewable Profile
Development
The electricity grid in the Greater Northwest consists of significant quantities of existing wind and solar
generation. Significant new renewable build is expected to be built in the future, as explored in this study.
Representing the electricity generation from both existing and future renewable (solar and wind) resources
is fundamental to the analysis in this study. In this appendix section, the process of developing these
renewable profiles for both existing and new renewable resources is elaborated.
C.1 Wind Profiles
C.1.1 SITE SELECTION
Existing wind site locations (latitude and longitude) in the study region are obtained from NWPCC’s
generator database and WECC’s Anchor Data Set. New candidate wind sites are identified based on the
highest average wind speed locations across the Greater Northwest region using data published by NREL
24
(see Figure 33).
24
https://maps.nrel.gov/wind-prospector/
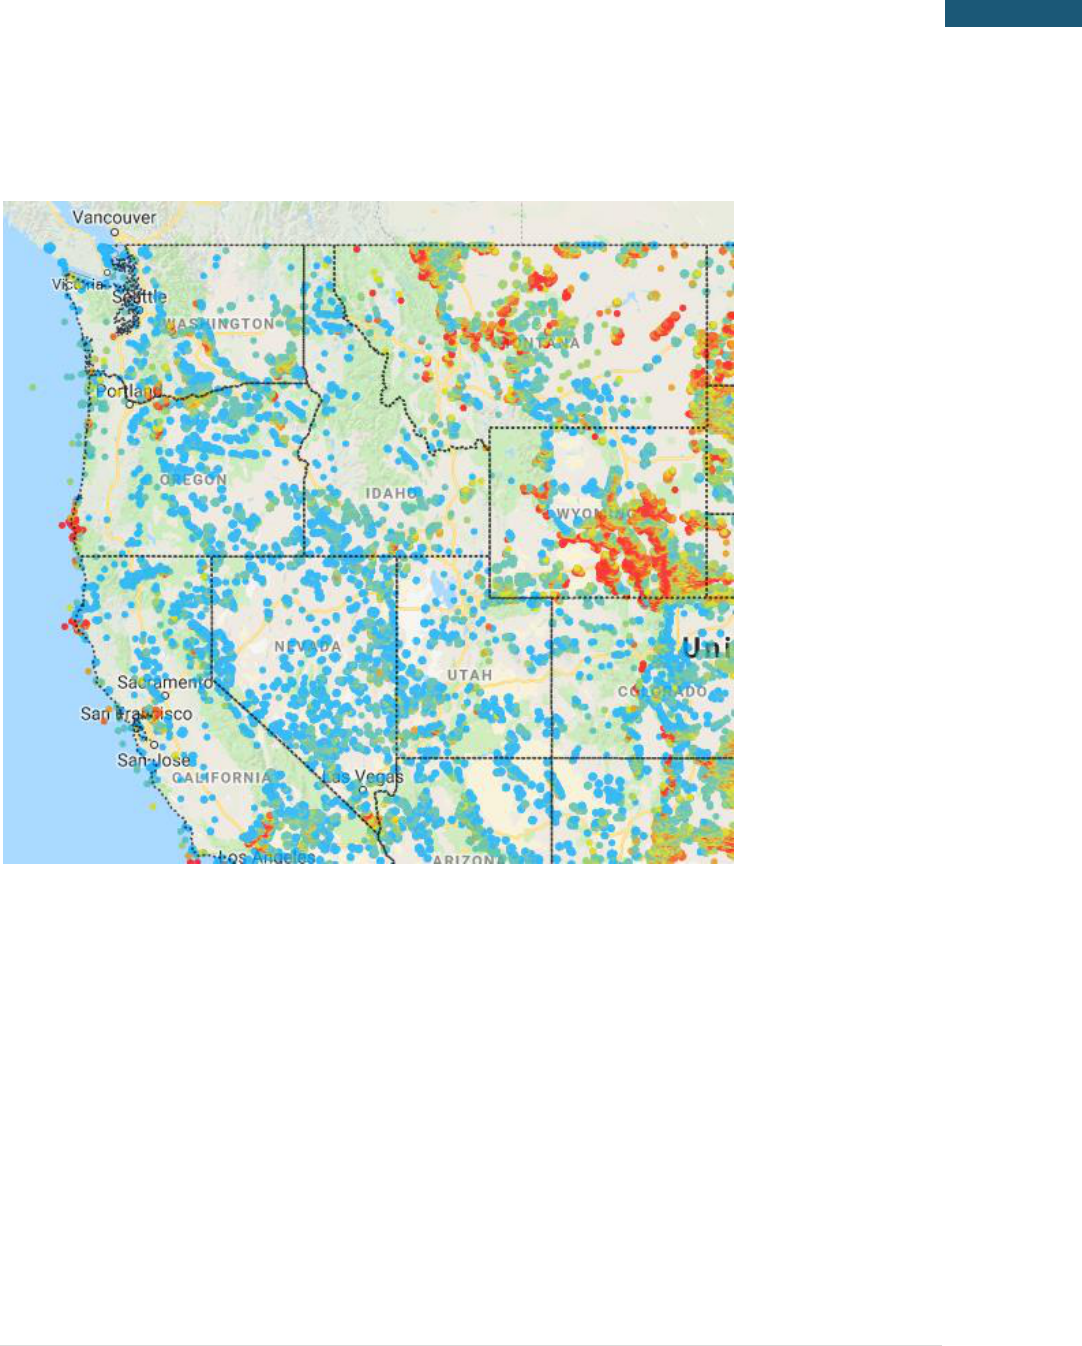
C-9 | P a g e
© 2018 Energy and Environmental Economics, Inc.
Renewable Profile Development
Figure 33: Wind speed data in the northwest (Source: NREL)
While striving to place new candidate wind sites in the windiest locations, the new candidate sites are spread
across each state in a way that they span a large geographical area in order to capture diversity in wind
generation (e.g. the likelihood that the wind will be blowing in one location even when it is not in another).
The new candidate sites used in this study are shown in Figure 34. New sites were aggregated geographically
into three single resources that were used in the study modeling: Northwest, Montana, and Wyoming. For
example, Montana wind in the study is represented as a single profile with new wind turbines installed
proportionally across the various “blue squares” shown in Figure 34.
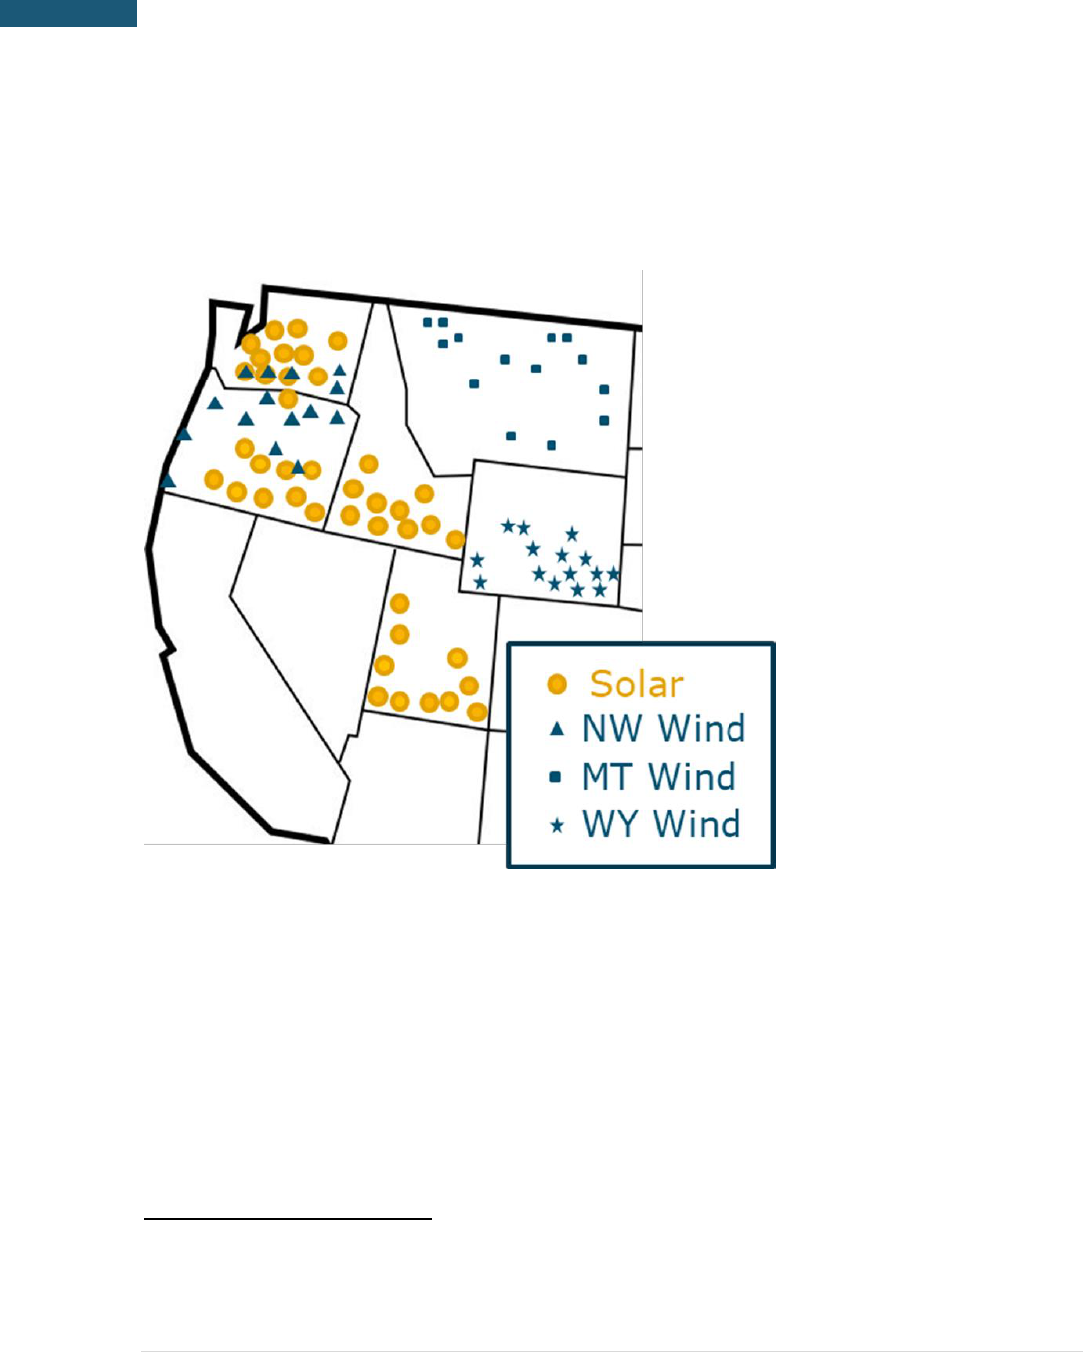
C-10 | P a g e
Resource Adequacy in the Pacific Northwest
Figure 34: New Candidate Solar and Wind Sites
C.1.2 PROFILE SIMULATION
NREL’s Wind Integration National Dataset (WIND) Toolkit
25
contains historical hourly wind speed data from
2007-2012 for every 2-km x 2-km grid cell in the continental United States. This data is downloaded for each
selected site location (both existing and new sites).
25
https://www.nrel.gov/grid/wind-toolkit.html
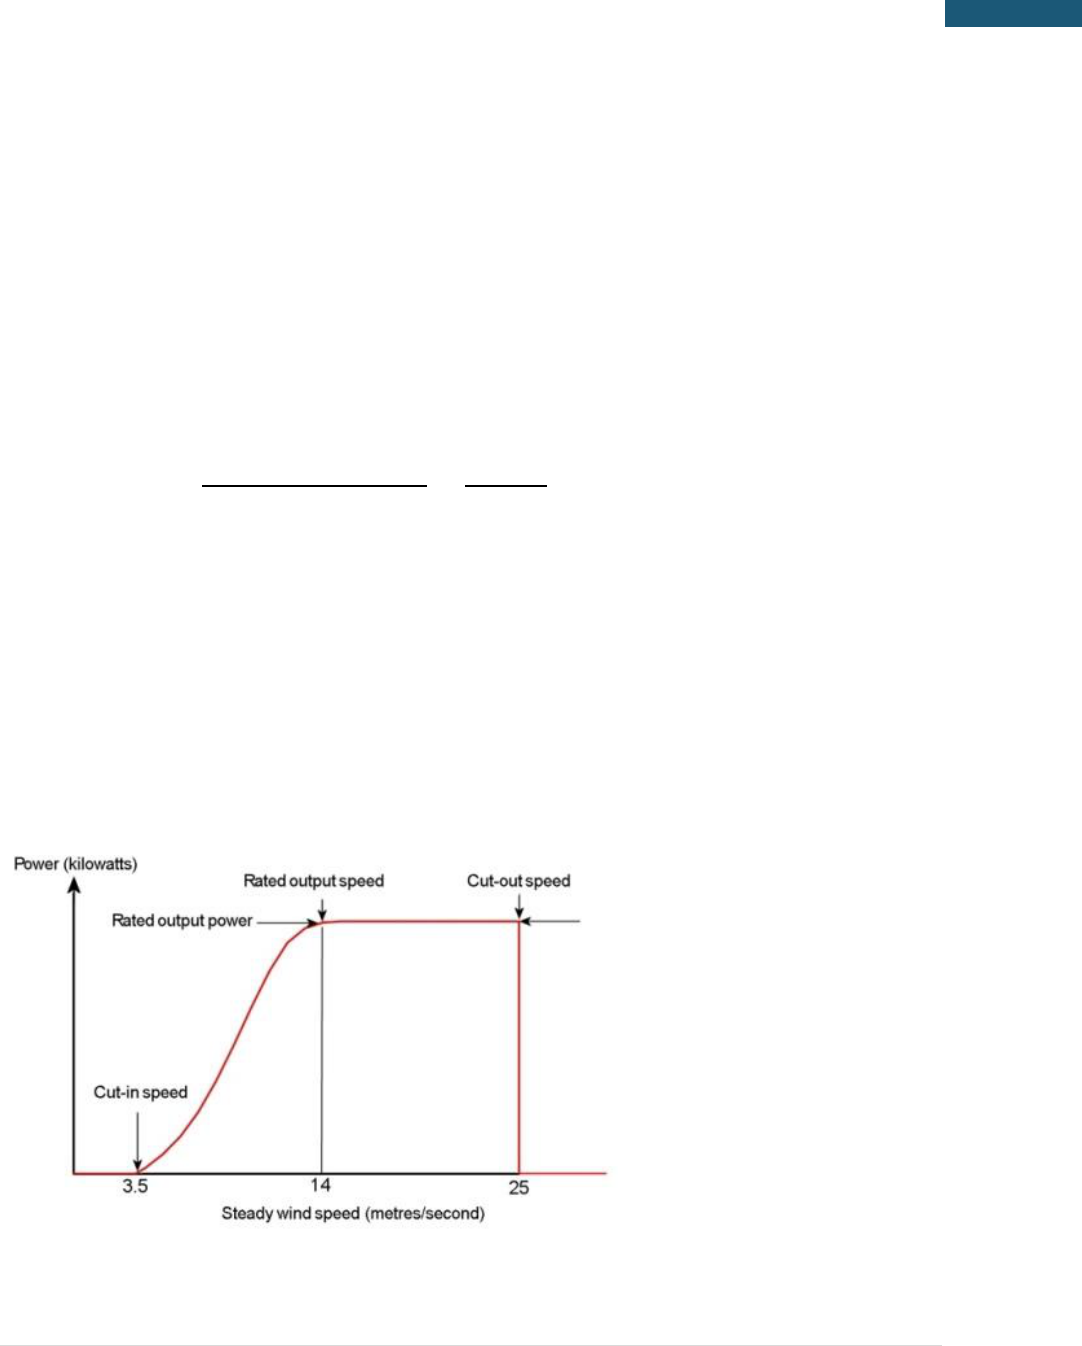
C-11 | P a g e
© 2018 Energy and Environmental Economics, Inc.
Renewable Profile Development
The amount of electricity generated from a wind turbine is a function of wind speed and turbine
characteristics, such as the turbine hub height (height above the ground), and the turbine power curve (the
mapping of the windspeed to the corresponding power output). Wind speeds increase with height above
the ground. Since all NREL WIND data is reported at 100-meters, the wind profile power law is used to scale
wind speeds to different heights, depending on the height of the turbine being modeled. This relationship is
modeled as:
A wind shear coefficient of 0.143 is used in this study.
A typical power curve is shown in Figure 35. Turbine power curves define the cut-in speed (minimum
windspeed for power generation), rated speed (minimum wind speed to achieve maximum turbine output),
cut-out speed (maximum wind speed for power generation) and power generation between the cut-in
speed and rated speed.
Figure 35: Typical Wind Turbine Power Curve
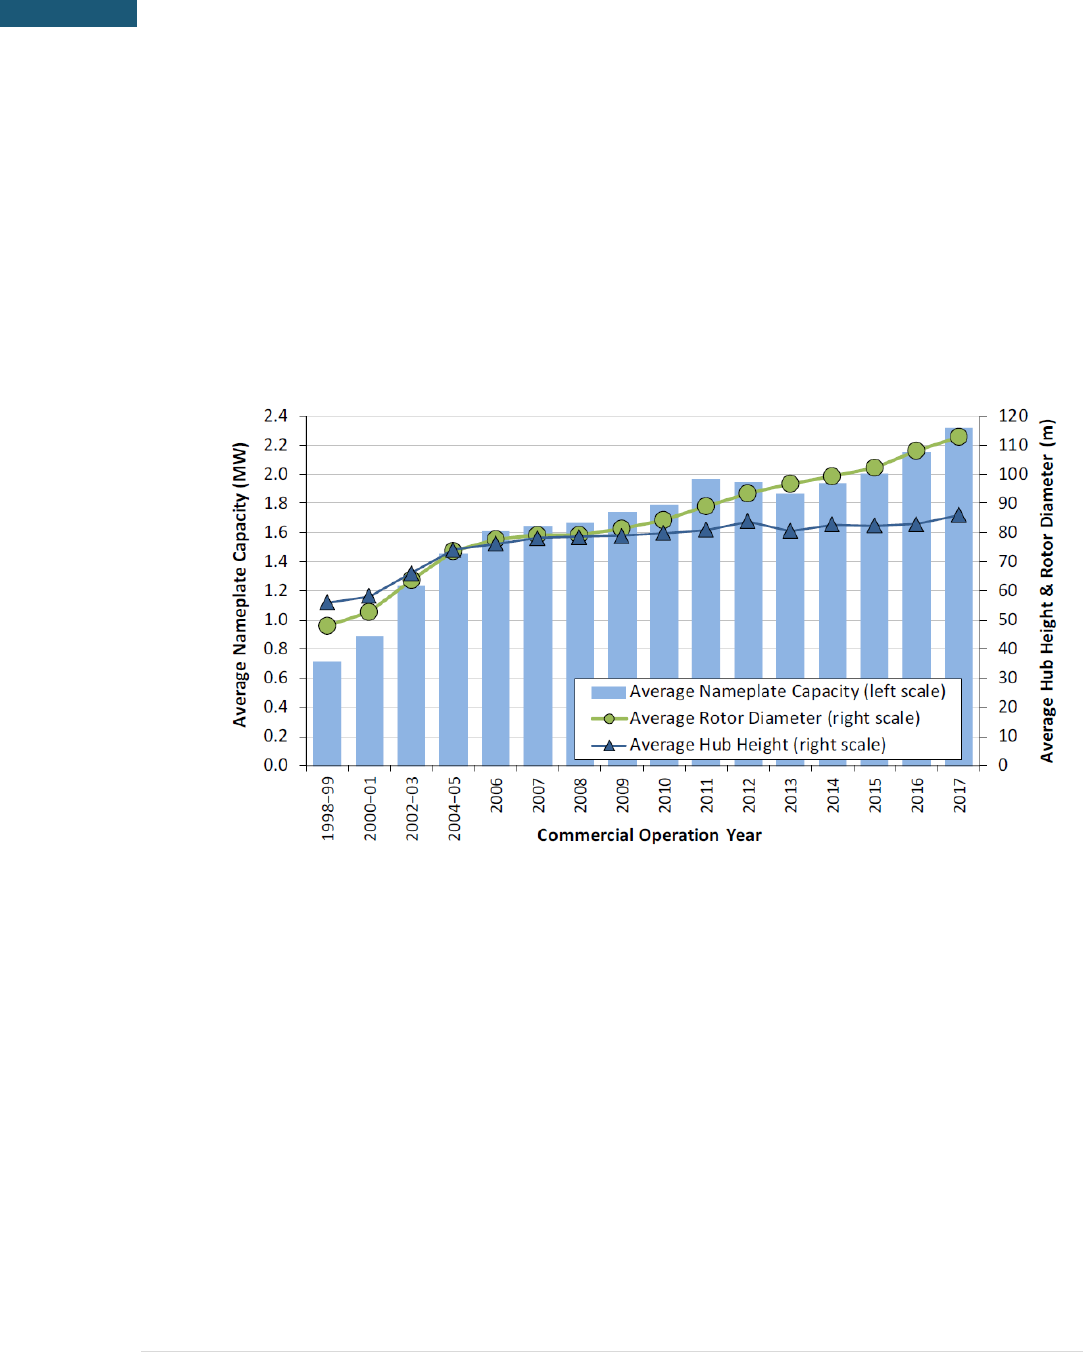
C-12 | P a g e
Resource Adequacy in the Pacific Northwest
With the advancement of wind turbine technology, hub heights have increased over the years (see Figure
36). For existing wind resources, the hub heights are assumed to be the annual average hub height based
on the install year. For new turbines, hub height is assumed to be 100 meters.
Figure 36: Average turbine nameplate capacity, rotor diameter and hub height for land-based wind
project in the US
For existing turbines, Nordic 1000 54m 1 MW (MT) turbine power curve generates wind profiles that
benchmark well to the historical generation profiles. The validation process of turbine power curve selection
is described in greater detail in Section C.1.3. For new turbines, NREL standard power turbine curves are
used to produce future wind profiles.
The wind generation profiles simulation process can be performed for each 2 km X 2 km grid cell and are
usually limited to maximum power of 8 - 16 MW due to land constraints and the number of turbines that
can fit within that area. However, each wind site that is selected as described in Section C.1.1 (shown in
Figure 34), was modeled as 3 GW of nameplate installed wind capacity and encompasses hundreds of

C-13 | P a g e
© 2018 Energy and Environmental Economics, Inc.
Renewable Profile Development
adjacent grid cells from the NREL WIND Toolkit database. Note that the actual installed wind capacity varies
by scenario in the study and so these 3 GW profiles were scaled up and down to match the installed capacity
of each specific scenario. The adjacent grid cells are chosen such that they are the closest in geographical
distance from the first wind site location (first grid cell). Representing a single wind site using hundreds of
grid cells represents wind production more accurately and irons out any local production spikes that are
limited to only a few grid cells in the NREL WIND Toolkit database.
C.1.3 VALIDATION
BPA publishes historical wind production data
26
in its service territory. This data is used to identify a turbine
power curve that best benchmarks wind energy production from existing projects as simulated using
historical wind speed data. Three turbine power curves were tested – GE 1.5SLE 77m 1.5mW (MG), Nordic
1000 54m 1Mw (MT), and NREL standard. Based on annual capacity factors and hourly generation matching,
Nordic 1000 54m 1Mw (MT) turbine was selected to represent existing wind turbines in the study. These
benchmarking results are illustrated in Figure 37 and Figure 38.
26
https://transmission.bpa.gov/business/operations/wind/
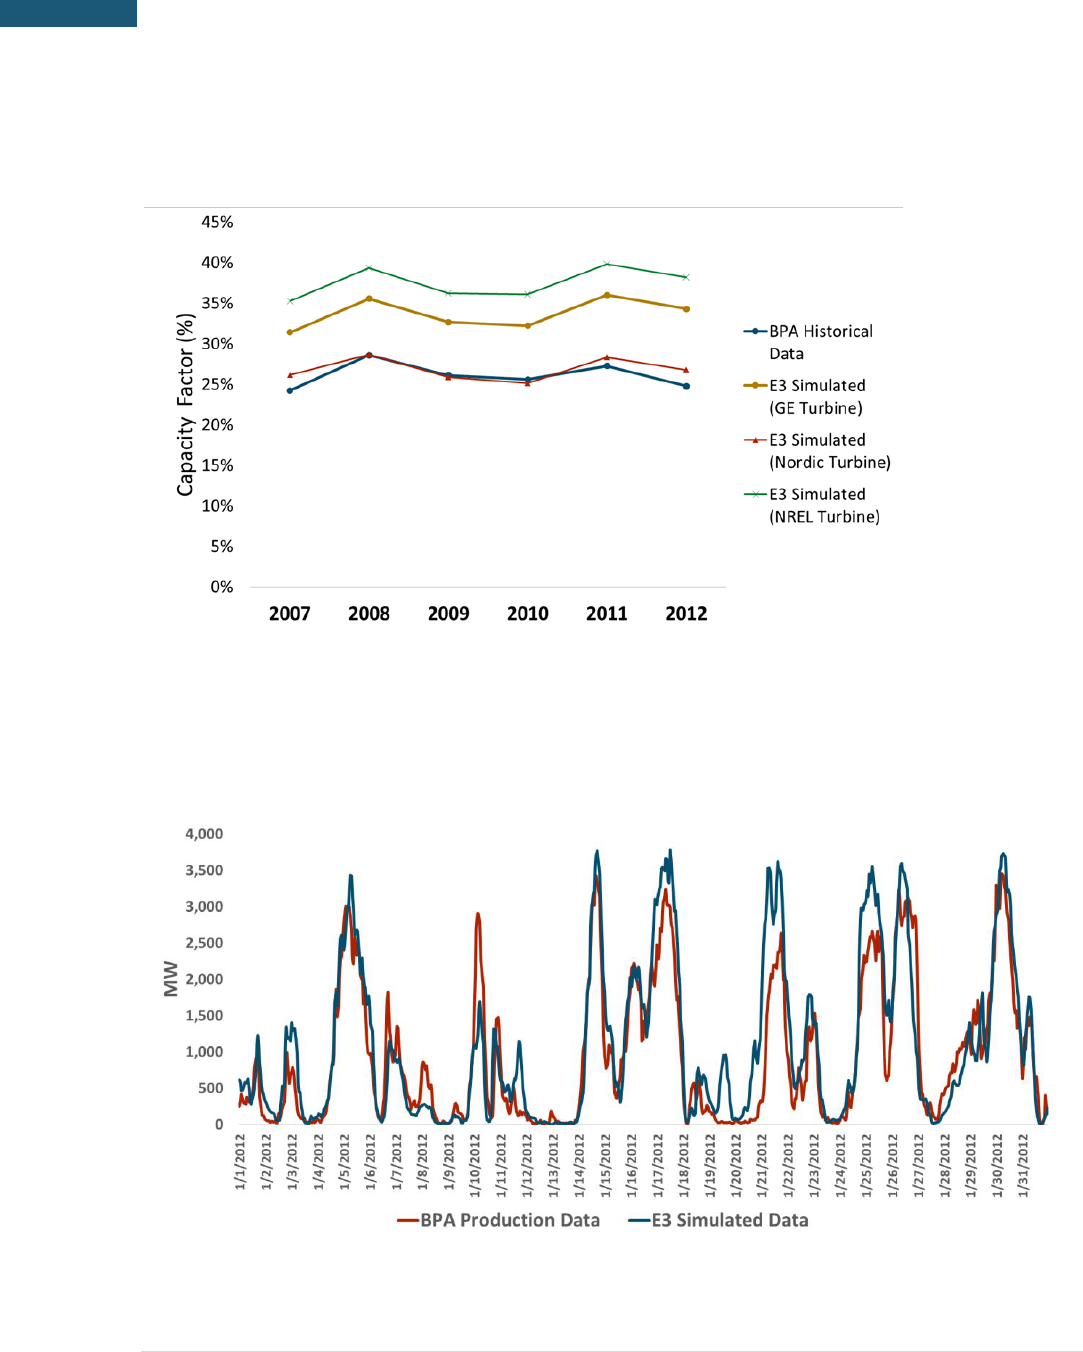
C-14 | P a g e
Resource Adequacy in the Pacific Northwest
Figure 37: Comparison of Annual Wind Capacity Factors for Benchmarking
Figure 38: Comparison of Hourly Historical Wind Generation to Simulated Wind Generation for January
2012

C-15 | P a g e
© 2018 Energy and Environmental Economics, Inc.
Renewable Profile Development
C.2 Solar Profiles
C.2.1 SITE SELECTION
Existing solar site locations (latitude, longitude) in the study region are obtained from NWPCC’s generator
database and WECC’s Anchor Data Set. To build new candidate solar resources in the future, the best solar
sites in the region are identified based on the highest insolation from the solar maps published by NREL
27
(see Figure 39). While striving to place new candidate wind sites in the sunniest locations, the new candidate
sites are spread across each state in a way that they span a large geographical area in order to capture
diversity in solar generation (e.g. the likelihood that the sun will be shining in one location even when it is
not in another). The future solar sites used in this study are shown in Figure 34.
27
https://maps.nrel.gov/nsrdb-viewer/
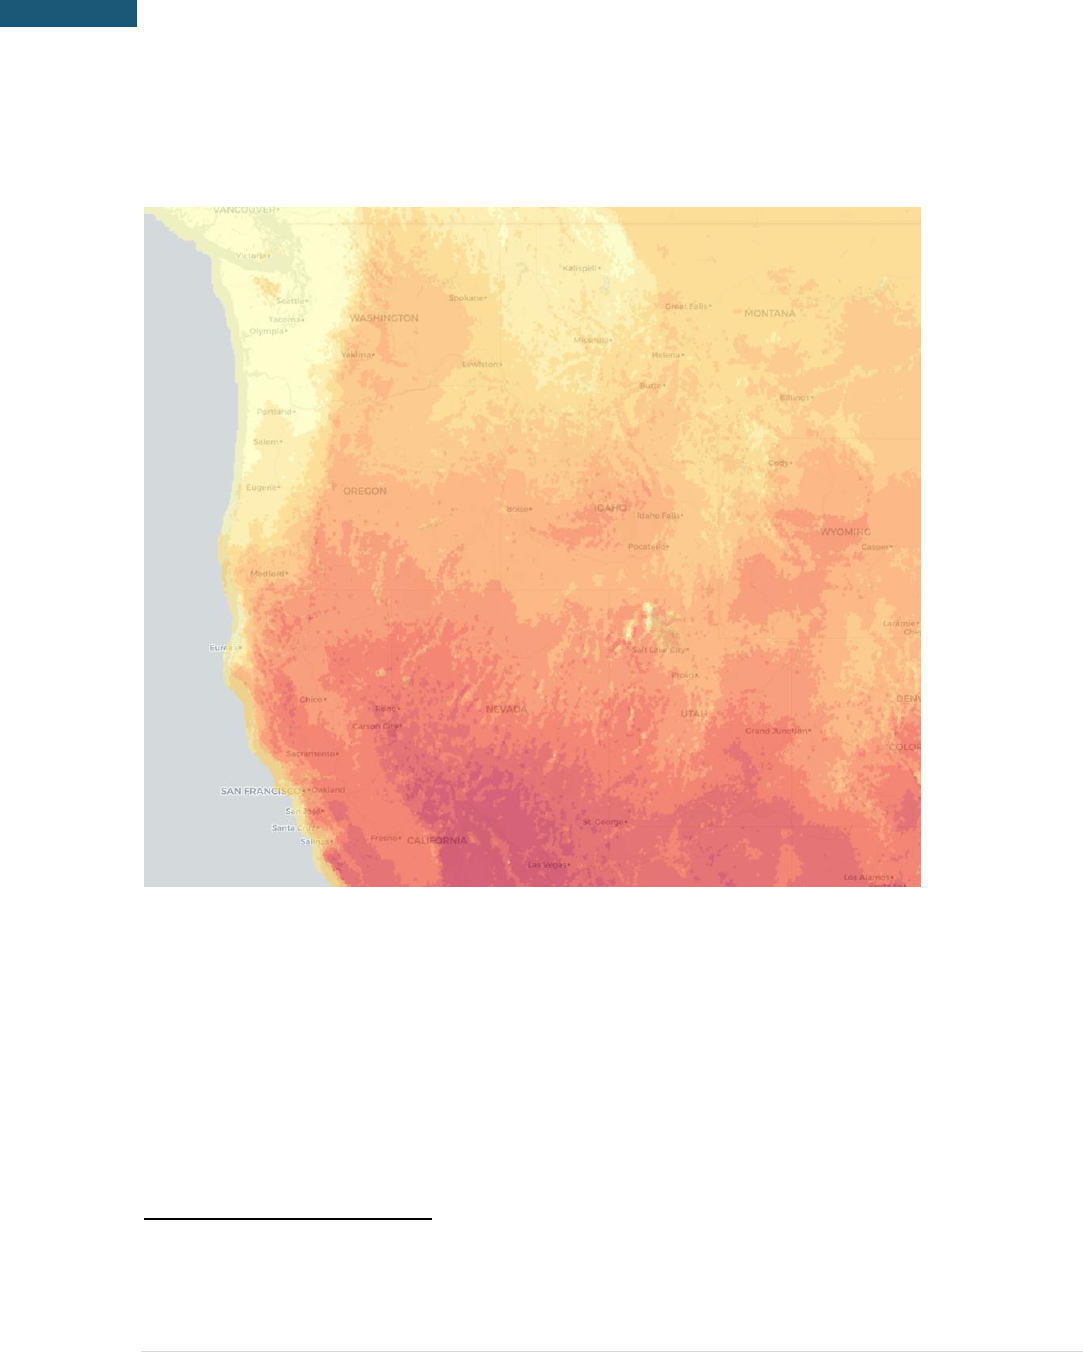
C-16 | P a g e
Resource Adequacy in the Pacific Northwest
Figure 39: Solar insolation data in the northwest (Source: NREL)
C.2.2 PROFILE SIMULATION
NREL Solar Prospector Database
28
includes historical hourly solar insolation data: global horizontal
irradiance (GHI), direct normal irradiance (DNI), diffuse horizontal irradiance (DHI), and solar zenith angle
from 1998-2014. This data is downloaded for all each selected site location (both existing and new).
28
https://nsrdb.nrel.gov/

C-17 | P a g e
© 2018 Energy and Environmental Economics, Inc.
Renewable Profile Development
The hourly insolation data is then converted to hourly production profiles using the NREL System Advisor
Model (SAM) simulator. Additional inputs used are tilt, inverter loading ratio and tracking type. All panels
are assumed to have a tilt equal to the latitude of their location. The study assumes an inverter loading ratio
of 1.3 and that all solar systems are assumed to be single-axis tracking. The NREL SAM simulator produces
an hourly time series of generation data that is used to represent the electricity generation from the solar
sites in this study.
Forty sites are aggregated to represent the solar candidate resource used in this study. These sites are evenly
distributed in the four states of Oregon, Washington, Idaho, and Utah as shown in Figure 34.
