THE NAACP OPPORTUNITY AND DIVERSITY REPORT CARD: THE HOTEL AND RESORT INDUSTRY 1
EAO12
THE NAACP OPPORTUNITY AND
DIVERSITY REPORT CARD:
THE HOTEL & RESORT INDUSTRY
THE NAACP OPPORTUNITY AND DIVERSITY REPORT CARD: THE HOTEL AND RESORT INDUSTRY 2
THE NAACP OPPORTUNITY AND DIVERSITY REPORT CARD:
THE HOTEL AND RESORT INDUSTRY
NAACP NATIONAL HEADQUARTERS
4805 Mt. Hope Drive
Baltimore, MD 21215
NAACP FINANCIAL FREEDOM CENTER
1816 12th Street, NW
Washington, DC 20009
Roslyn M. Brock, Chairman
Benjamin Todd Jealous, President and CEO
Dedrick Muhammad, Senior Director of Economic Department
Lillian Bowie, Director of Economic Research and Strategic Partnerships
Dawn Chase, Manager of Diversity and Inclusion
Nicole Kenney, Economic Program Specialist
www.naacp.org/econ
COPYRIGHT © 2012

THE NAACP OPPORTUNITY AND DIVERSITY REPORT CARD: THE HOTEL AND RESORT INDUSTRY 3
Table of Contents
Page 5 Report Overview
Page 6 Executive Summary
Page 7 Lodging Industry Prole
Page 10 Career Opportunities in the Hospitality Sector
Page 13 Hospitality and Management Training Institutions
Page 14 Opportunity and Inclusion Practices
Page 17 Methodology
Page 19 2012 Analysis of Lodging Leaders’ Racial Diversity and
Inclusion Practices
Page 31 Discussion and Report Summary
Page 33 Data Limitations
Page 34 Appendix: Race by Gender Intersectional Analysis of
Employment Data

THE NAACP OPPORTUNITY AND DIVERSITY REPORT CARD: THE HOTEL AND RESORT INDUSTRY 4
Acknowledgments
Executive Summary
The NAACP Economic Programs staff would like to thank MWM Consulting Group, LLC and Economic
Department research interns for their research, design, analysis, and development of this
report.
The NAACP Economic Department acknowledges the leadership of the National Board of
Directors’ Economic Development Committee, chaired by Leonard James, III.
The NAACP would also like to thank the hotels that volunteered to participate in this effort:
Hilton Worldwide
Hyatt Hotels Corporation
Marriott International, Inc.
Starwood Hotels and Resorts Worldwide, Inc.
Wyndham Hotel Group
Finally the NAACP thanks Michael Roberts, Chairman & CEO, The Roberts Company; Greg
DeShields, Managing Director, Business Development, Temple University; Andy Ingram,
President & CEO, National Association of Black Hotel Owners, Operators & Developers; the Latino
Hotel & Restaurant Association; and the Asian American Hotel Owners Association.
“
To be a poor man is hard, but to be a poor race in a land of dollars
is the very bottom of hardships.”
-W.E.B. Dubois
Acknowledgements

THE NAACP OPPORTUNITY AND DIVERSITY REPORT CARD: THE HOTEL AND RESORT INDUSTRY 5
Acknowledgements
Report Overview
Equal opportunity for people of color in the United States has remained an unrealized goal. With
the country on track to become minority-majority by 2050, racial economic inequality increasingly
impedes the country’s economic advancement.
During this period of high unemployment and declining wealth, Americans need living wage
jobs with long-term career tracks now more than ever. Given these economic demands, the
NAACP has developed a focused analysis of diversity and inclusion for selected industries in
our Opportunity and Diversity Report Card. We selected industries with the greatest potential
to inuence job creation and wealth building in the African American community and other
communities of color. The NAACP recognizes the need to diversify major U.S. industries and
seeks to move the country beyond the racial divides that continue to shape its current economy.
Through our Opportunity and Diversity Report Card, we will regularly examine the current state
of diversity and inclusion in various U.S. economic sectors, highlighting the ones that exhibit
the greatest potential for African Americans and other people of color. Furthermore, the NAACP
will partner with industry leaders to advance best practices for racial and ethnic inclusion and
diversity.
Focusing on specic industries and their issues will permit greater collaboration between the
NAACP and industry leaders to advance best practices in inclusion and ensure opportunities for
diverse groups. We believe this strategy aligns with the NAACP Economic Program’s objective
to “ensure that government and industry are knowledgeable and committed to bridging racial
inequality, particularly as it relates to employment, wealth, lending and business ownership.”
In The NAACP Opportunity and Diversity Report Card: The Hotel and Resort Industry, the
rst in a series of reports based on our former Economic Reciprocity Initiative: NAACP Consumer
Choice Guide, we analyze the lodging industry’s inclusion and diversity practices as they pertain
to the race and ethnicity of its workforce, management and suppliers. The report card assesses
the performance of the top ve highest-grossing U.S. companies in the industry in recognition that
they possess the greatest potential to inuence industry trends, policies and practices. In addition,
it will inform the public about career opportunities and realities in the hotel and resort industry as
the nation strives to strengthen its economy.

THE NAACP OPPORTUNITY AND DIVERSITY REPORT CARD: THE HOTEL AND RESORT INDUSTRY 6
Executive Summary
The NAACP Opportunity and Diversity Report Card: The Hotel and Resort Industry
examines the representation of African Americans and people of color as a whole in the
industry’s workforce, supplier diversity, and hotel ownership. We found that supplier diversity and
board diversity were among the least inclusive areas in the hotel industry. For example, of the
corporations graded in this report who provided signicant property data, out of total dollars spent
for goods and services only 8% went to companies owned by people of color, despite the fact
that adults of color ages 18 - 64 comprise 36 percent of the U.S. population. Moreover, these
corporations average a dismal 1% for supplier contracts with African American owned companies,
despite individuals in this group ages 18-64 comprising 12% of the population. For these reasons
and many more, much work remains to be done in the lodging industry to mitigate the racial
economic inequality that threatens the future of this country.
The NAACP Opportunity and Diversity Report Card: The Hotel and Resort Industry grades
hotels against the standard rate of industry inclusion to identify leaders in diversity. The letter
grades are based on three main criteria: 1) hiring and job advancement, 2) contracting and
procurement, and 3) ownership (if and where applicable).
Marriott International received a B grade—the highest rating out of the ve industry leaders we
reviewed. This grade indicates an overall performance that exceeds industry norms in inclusion.
No corporate leader received an overall A rating, which would indicate that the corporation greatly
exceeded the industry norm. Since the industry rate of inclusion for people of color is quite low
in governing body representation, management, property ownership, and supplier diversity, it is
clear that corporate leaders in the hotel and resort industry—along with leaders in many other
industries—still have far to go to ensure their workforce, leadership and suppliers adequately
reect the demographics of the United States.
This report card not only highlights the lack of inclusion and diversity in the lodging industry,
but also calls attention to relevant programs and opportunities that enable people of color to
excel in this industry. The report highlights hospitality programs at historically black colleges
and universities; inclusion and opportunity advocacy organizations such as the National Society
of Minorities in Hospitality and the National Association of Black Hotel Owners, Operators &
Developers; and the diversity and career pipeline initiatives of the industry leaders whom we
interviewed for this report.
We realize that The NAACP Opportunity and Diversity Report Card: The Hotel and Resort
Industry is not the end, but rather the beginning of ongoing work for the NAACP Economic
Programs to advance economic opportunity and diversity. As the United States rapidly transitions
to a minority-majority country, we implore all corporate leaders to recognize racialized economic
inequality as a profound threat and ongoing barrier to sustainable, widespread economic growth.
We also ask that these leaders commit to revising the industry’s corporate practices to help bridge
the racial economic divide. The NAACP will collaborate with corporate leaders and diversity
advocates over the next several years to advance industry inclusion so that it better reects the
nation’s diversity. The release of this report card helps moves us forward in that direction.
Executive Summary

THE NAACP OPPORTUNITY AND DIVERSITY REPORT CARD: THE HOTEL AND RESORT INDUSTRY 7
Lodging Industry Prole
Lodging Industry Revenue Base
In 2009, the lodging industry, a subset of the travel and tourism industry, generated total revenue of
approximately $123 billion based on an average daily room rate of approximately $97.51.
1
It earned a pre-
tax income of approximately $14 billion. In 2011, revenue increased to $137.5 billion (at an average daily
room rate of $101.70), up from $127.7 billion in 2010. Pre-tax income in 2011 rose to about $21.6 billion
from $18 billion in 2010—a 20% increase and the largest percentage change in the past decade.
2
Overview of the Lodging Sector Domestic Workforce
Employment in the leisure and hospitality sector has surpassed pre-recession levels in nearly half of the
nation’s major markets. Forty-four of the 100 biggest metropolitan areas employed more leisure and
hospitality workers in February 2012 than during the same month in 2008, according to the U.S. Bureau of
Labor Statistics.
3
The U.S. Bureau of Labor Statistics also estimates that nearly
1 Basham, M. and Kwon, E. (2010). Lodging & gaming. Standard & Poor’s Industry Surveys.
2 American Hotel & Lodging Association. (2012). 2012 Lodging industry prole. Retrieved from http://www.ahla.com/
content.aspx?id=34706.
3 U.S. Department of Labor. (2010.) Career guide to industries, 2010-11 edition: Hotels and other accommodations.
Washington, DC: U.S. Department of Labor, Bureau of Labor Statistics. Retrieved from
http://www.bls.gov/oco/cg/cgs036.htm.

THE NAACP OPPORTUNITY AND DIVERSITY REPORT CARD: THE HOTEL AND RESORT INDUSTRY 8
4.5 million people comprised the lodging industry’s domestic workforce in 2010 with an expected
increase of 8% over the next 10 years.
Service Sector Occupations
Two out of three (65%) lodging industry employees work in the service sector and it is projected
that its ve largest occupations – food preparation and serving workers, janitors, waiters and
waitresses, restaurant cooks, and housekeeping cleaners – will add more than one million jobs
this decade.
4,5
Like other service industries, hotels employ many low-wage, part-time/seasonal
workers.
Although African Americans comprise the largest percentage of travelers of color in the United
States (with both the Latino and Asian travel markets emerging proportionately), and while the
lodging and hotel industry is largely staffed by workers of color, racial and ethnic minorities remain
inequitably disbursed throughout the lodging workforce. They overpopulate entry-level and lower-
wage positions while being underrepresented in higher-level, more lucrative positions, such as that
of general manager.
6
The lodging industry offers several entry-level opportunities for those entering or re-entering the
workforce. Many of these entry-level service occupations in the lodging industry do not require
formal schooling or postsecondary education, providing opportunity to gain work experience
and foundational skills important for advancement in the lodging industry, or attain jobs in other
industries.
7,8
4 Achsah, C. (2011 August 8). Employment projections for hospitality and tourism, 2010-2020. Retrieved from
http://ctetrailblazers.blogspot.com/2012/04/employment-projections-for-hospitality.html
5 National Institute for Occupational Safety and Health, Division of Applied Research and Technology. (2012).
Economic factors. Retrieved from http://www.cdc.gov/niosh/programs/pps/economics.html.
6 Berta, D & Prewitt, M. (2007 August 20). Multicultural food service & hospitality alliance confab examines disparity
of diversity in industry’s executive ranks. Nation’s Restaurant News.
7 U.S. Department of Labor. (2010). Career guide to industries 2010-2011: Hotel and other accommodations.
Washington, DC: Bureau of Labor Statistics. Retrieved from http://www.bls.gov/oco/cg/cgs036.htm.
8 Boatman, C. & Seegert, V. & Schroeder, J. (2007 October). Beyond the front desk of the hospitality industry.
InContext. Retrieved from http://www.incontext.indiana.edu/2007/october/2.asp.

THE NAACP OPPORTUNITY AND DIVERSITY REPORT CARD: THE HOTEL AND RESORT INDUSTRY 9
Managerial and Executive Occupations
To advance beyond the plentiful lower-wage and entry-level positions in the lodging industry,
workers must be educated about advancement opportunities. Hotels typically establish career
tracks in marketing, public relations, law, accounting, architecture, and hotel operations.
9
To
qualify for a managerial or executive position, job candidates must acquire and develop business
and operational skills. Phillip Cunningham, general manager at Williamsburg Lodge (Virginia),
states, “[Simply] having great customer skills no longer promotes you to the top.”
10
Cunningham
emphasizes that African Americans have historically struggled to achieve the same level of industry
success as their nonminority counterparts due to a lack of corporate mentors.
11
The National
Society of Minorities in Hospitality (NSMH) is one of several organizations attempting to address
this issue by linking people of color with hospitality company sponsors, industry representatives,
hospitality organizations, advisors, and mentors to support the leadership pipeline for people of
color in the industry.
The hospitality industry’s reputation with people of color is another barrier to diversity in hotel
management. On the website The Black Collegian, Flora Gailliard states, “Although African
Americans have had a wealth of experience in hospitality, it has not always been positive.”
12
In
the past, African Americans were relegated to solely low-level positions “in back-of-house …
departments such as the kitchen and housekeeping.”
13
Over the past several decades, hotel chains
have attempted to reach out to communities of color through multiple diversity recruitment and
retention programs. These programs enable hotel companies to diversity and have led to a higher
retention of staff.
14
However, with the recession, many hotels have reduced resources for diversity
recruitment, retention programs, and diversity-based initiatives. Still, hospitality associations for
people of color—such as the National Association of Black Hotel Owners, Operators & Developers
(NABHOOD); the Hispanic Hotel Owners Association (HHOA); and the Asian American Hotel
Owners Association (AAHOA)—continue to advocate for these programs and resources even as
diversity in the lodging industry has improved.
15
Out of all jobs in the lodging industry, hotel owner positions show the greatest lack of diversity.
Michael Roberts, an African American hotelier, thinks expanding minority hotel ownership could
have a major impact on the industry: “African Americans’ ability to own produces job opportunities
in leadership roles for other African Americans.”
16
9 Towes, G. (2007 January). The lodging industry reaches out to minorities. The Network Journal. Retrieved from
www.tnj.com/archives/2007/january/lodging-industry-diversity-push.
10 Gailliard, F. The hospitality industry. The Black Collegian. Retrieved from
http://www.black-collegian.com/career/hospitality-199806.shtml.
11 Ibid.
12 Ibid.
13 Gong, Y. (2008). Managing cultural diversity in hospitality industry. (Master’s thesis). Retrieved from
http://digitalcommons.library.unlv.edu/thesesdissertations/480/.
14 Richwine, E. (2008 July/August). Be their guest.Minority Business Entrepreneur.
15 National Association of Black Hotel Owners, Operators & Developers (NABHOOD); Hispanic Hotel Owners Associ-
ation (HHOA); and Asian American Hotel Owners Association (AAHOA), personal interview, August 10 –12, 2010.
16 Evans, I. (2010 April 22). Black multi-millionaires buy Dallas hotel.Sun Reporter.

THE NAACP OPPORTUNITY AND DIVERSITY REPORT CARD: THE HOTEL AND RESORT INDUSTRY 10
Career Opportunities in the Hospitality Industry
People of color make up one-third (34%) of our nation. As this population grows, so too does the
imperative to eliminate racial barriers to career advancement and wealth development. At the height
of American power in the 1950s, the manufacturing industry created well-paying job opportunities
for workers without advanced educations, laying the foundation for a robust American middle
class.
17
After the manufacturing decline of the 1970s, hiring in that sector has steadily decreased
as service sector hiring has increased. In fact, economists predict that the 21st-century economy
will depend on the service sector, which currently accounts for three-fourths of all jobs in the United
States. However, unlike the manufacturing industry, service sector jobs do not typically offer a
middle-class living wage and benets package for lower-skilled and entry-level positions. Thus, as
the service sector becomes an increasingly signicant national employer, it is crucial that this sector
provide stronger wages, affordable healthcare, job security, and other benets so that the American
middle class can expand in communities that are disproportionately economically disenfranchised.
Increasingly, securing employment that leads to long-term career options with strong middle class
wages and benets is a serious challenge.
18
Though the majority of jobs in the hotel and lodging
industry are lower-skilled, there are a number of career and employment pathways that can lead
to management-level careers. As with most other industries, a college degree in the lodging
sector is an important stepping-stone for promotion—a college degree in elds of study such as
hospitality management will open many doors for advancement. Shadowing experiences, mentoring
relationships, and internships also provide valuable “on-the-job” experience that helps candidates
stand out.
Below is a categorical list of job opportunities within the lodging industry, ranging from entry-level
positions to mid- and senior-management positions.
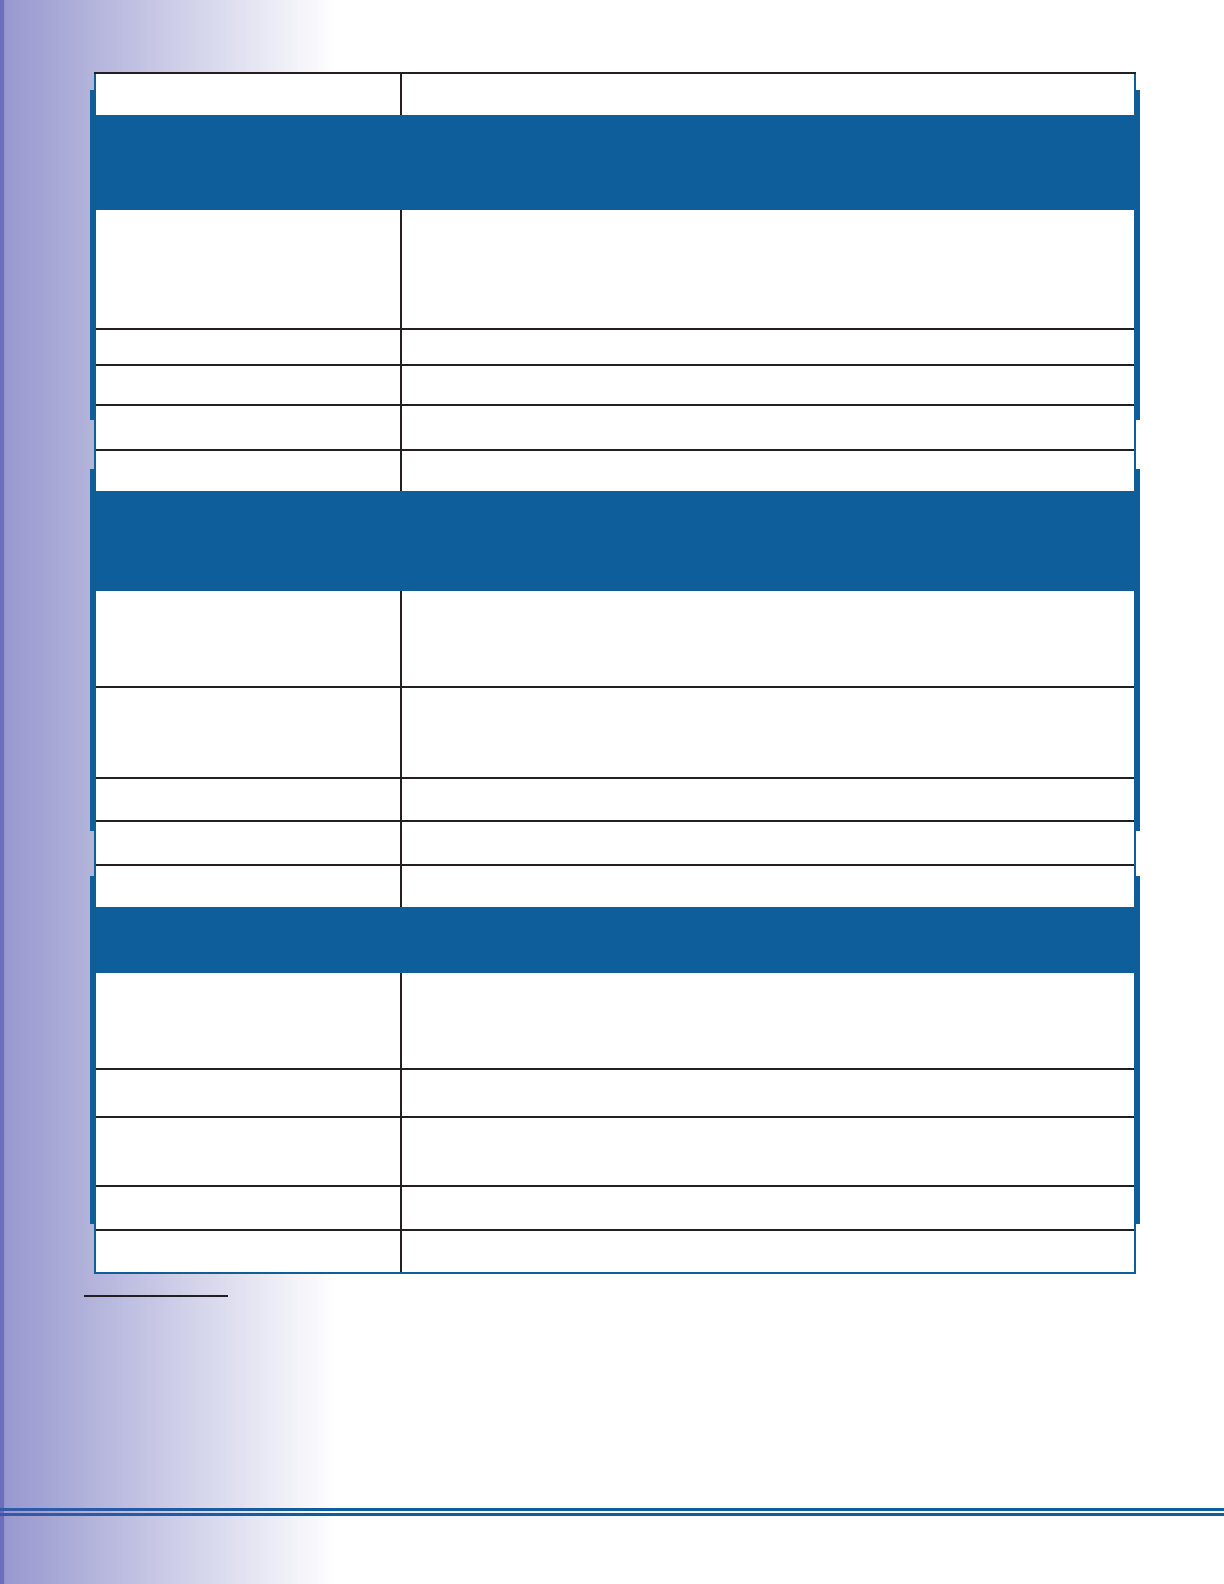
Hotel General Manager
19
Responsibilities Directs hotel operation and nances; creates standards for personnel
administration and performance, service, room rates, advertising,
publicity, and food.
Entry-Level of Education High school diploma or equivalent (college degree recommended)
US Average Salary $76,800 per year
$146,00 per year (top pay)
Number of Jobs 121,000
17 Blackburn, B & Noll, E. (2011 February 27). Made in America: A brief history of U.S. manufacturing. ABC News.
http://abcnews.go.com/Business/made-america-middle-class-built-manufacturing-jobs/story?id=12916118.
18 Gailliard, F. The hospitality industry. The Black Collegian. Retrieved from
http://www.black-collegian.com/career/hospitality-199806.shtml.
19 U.S. Department of Labor. (2012). Occupational Outlook Handbook, 2012-13 Edition: Lodging Managers. Wash-
ington, DC: Department of Labor, Bureau Labor of Statistics. Retrieved from http://www.bls.gov/ooh/management/
lodging-managers.htm; Best jobs in America. CNN Money. Retrieved from http://money.cnn.com/magazines/moneymag/
bestjobs/2009/snapshots/32.html.
THE NAACP OPPORTUNITY AND DIVERSITY REPORT CARD: THE HOTEL AND RESORT INDUSTRY 11
Job Outlook, 2006-2016 12% increase
Meeting and Convention Planner
20
Responsibilities Plans meetings and special events of various sizes; coordinates
such logistics as budgets, speakers, entertainment, transportation,
facilities, technology, equipment, printing, food and beverage, and
other related issues.
Entry-Level of Education Bachelor’s degree
US Average Salary $45,260 per year
Number of Jobs 71,600
Job Outlook, 2010-2020 44% increase (Much faster than average)
Information Clerk
21
Responsibilities Performs a range of services for hotel guests, such as guest check-
in and checkout, assigning rooms, and answering inquiries to hotel
services.
Entry-Level of Education A high school diploma is enough for most positions, but some
employers prefer workers who have some education beyond high
school.
US Average Salary $29,990 per year
Number of Jobs 1,605,300
Job Outlook, 2006-2016 7% increase (Slower than average but growing)
Concierge
22
Responsibilities Assists guests with making restaurant reservations, acquiring
tickets to special events, and helping with travel arrangements and
tours.
Entry-Level of Education High school diploma or equivalent
US Average Salary $31,870 per year
Number of Jobs 82,800
Job Outlook, 2010-2020 10% increase (About as fast as average)
20 U.S. Department of Labor. (2012). Occupational outlook handbook, 2012-13 edition: Meeting, convention, and event planners.
Washington, DC: U.S. Department of Labor, Bureau Labor of Statistics. Retrieved from http://www.bls.gov/ooh/business-and-nan-
cial/meeting-convention-and-event-planners.htm
21 U.S. Department of Labor. (2012). Occupational Outlook Handbook, 2012-13 Edition, Information Clerks. Washington,
DC: Department of Labor, Bureau of Labor Statistics. Retrieved from http://www.bls.gov/ooh/ofce-and-administrative-sup-
port/information-clerks.htm.
22 U.S. Department of Labor. (2012). Occupational outlook handbook, 2012-13 edition: Concierge. Washington, DC:
U.S. Department of Labor, Bureau Labor of Statistics. Retrieved from http://www.bls.gov/oes/current/oes396012.htm.

THE NAACP OPPORTUNITY AND DIVERSITY REPORT CARD: THE HOTEL AND RESORT INDUSTRY 12
Executive Chef
23
Responsibilities Oversees all kitchen activity, such as menu creation and staff
management; utilizes food surpluses; tracks popularity of various
dishes; estimates customer food consumption; tests quality of
cooked foods; creates special dishes and recipes.
Entry-Level of Education High school diploma or equivalent
US Average Salary $40,630 per year
Number of Jobs 100,600
Job Outlook, 2010-2020 -1% (slight decrease or no change)
23 U.S. Department of Labor. (2012). Occupational outlook handbook, 2012-13 edition: Chefs and head cooks. Washington,
DC: U.S. Department of Labor, Bureau of Labor Statistics. Retrieved from
http://www.bls.gov/ooh/food-preparation-and-serving/chefs-and-head-cooks.htm.
THE NAACP OPPORTUNITY AND DIVERSITY REPORT CARD: THE HOTEL AND RESORT INDUSTRY 13
Hospitality and Management Training
Institutions
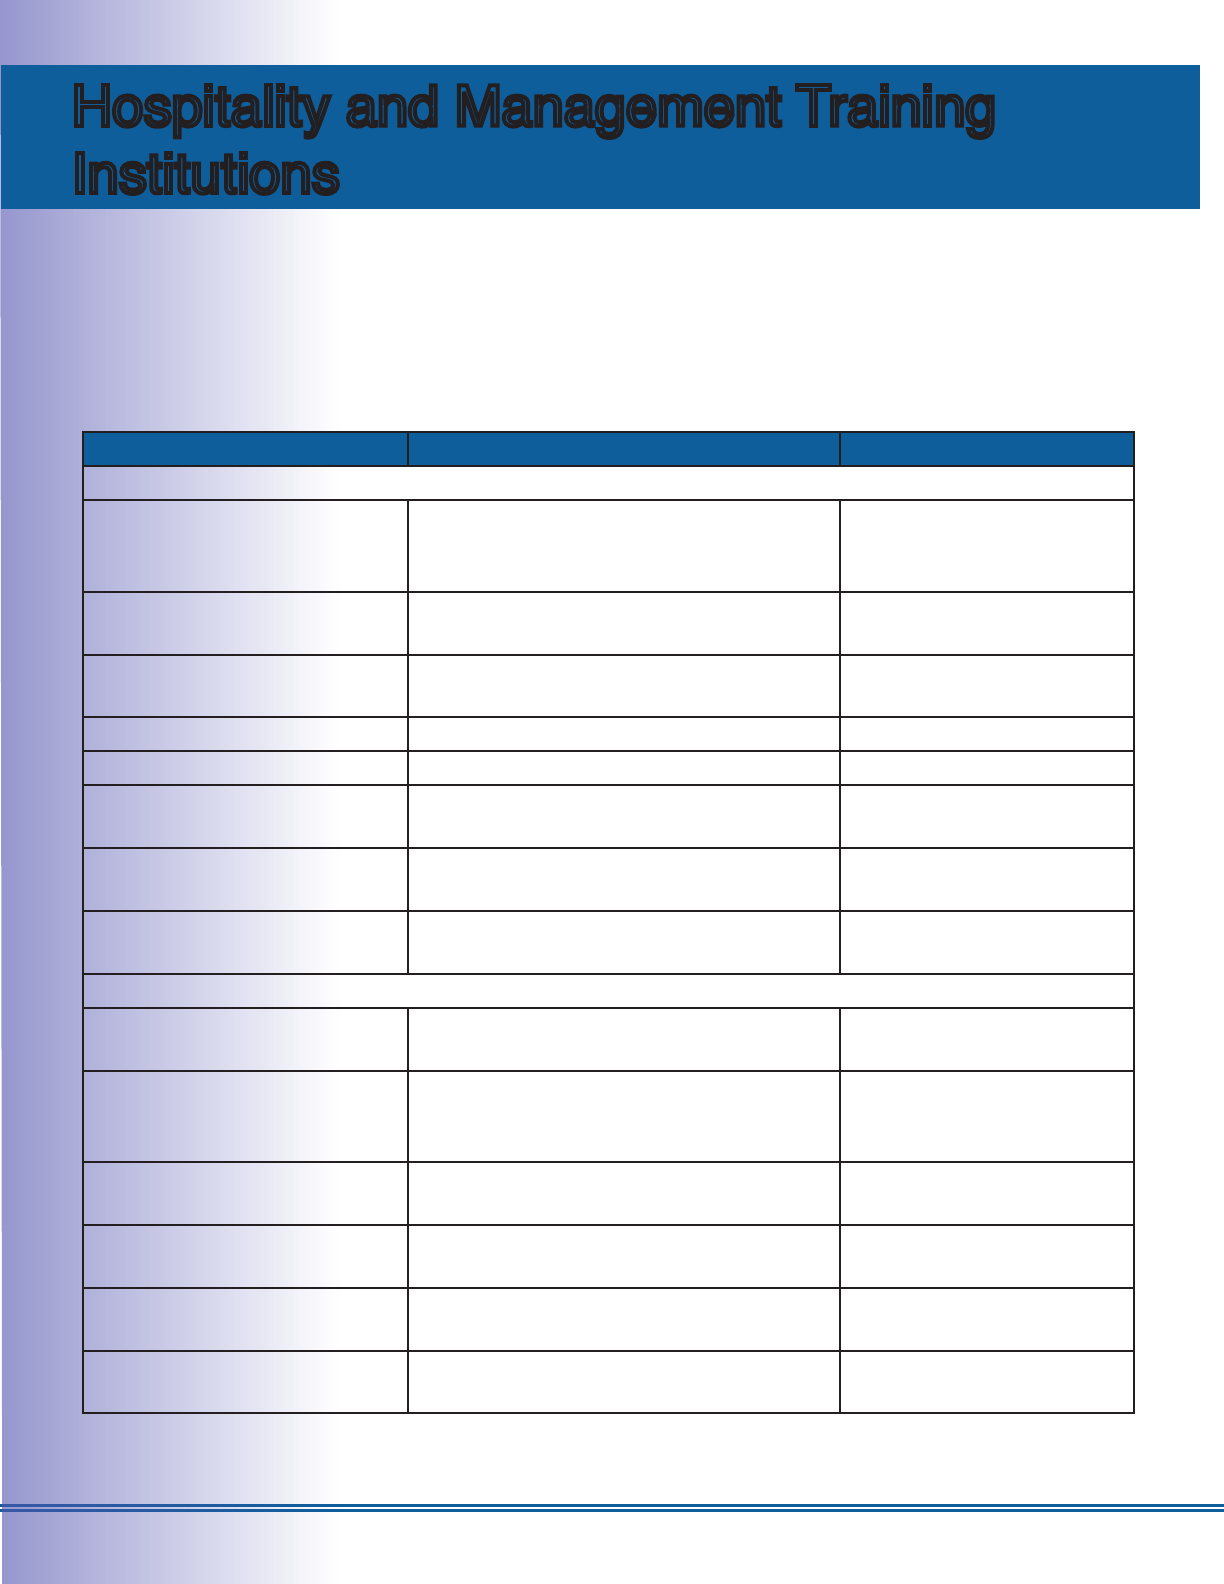
To encourage the number of African Americans in key positions within the hospitality management
industry, historically black colleges and universities (HBCUs) and a few highly regarded programs
at non-HCBUs play a critical role in educating the workforce in this eld. Below is a list of higher
education programs that provide a good foundation for those interested in a career in the hospitality
and lodging industry.
Educational Institution Description of Program City/State
Historically Black Colleges and Universities
Alabama A&M University Family and Consumer Sciences
includes a hospitality management
track
Huntsville, AL
Bethune-Cookman
University
College of Business Daytona Beach, FL
Delaware State University College of Business with a focus in
hospitality management
Dover, Delaware
Grambling State University College of Business Grambling, Louisiana
Howard University College of Business Washington, DC
Morgan State University College of Business with a focus in
hospitality management
Baltimore, MD
Temple University School of Hospitality and Tourism with
research opportunities
Philadelphia,
Pennsylvania
Tuskegee University College of Business with a focus in
hospitality management
Tuskegee, Alabama
Non-Historically Black Colleges and Universities
Boston University Hospitality program with study abroad
opportunities
Boston, MA
Cornell University Hotel management program includes
on-campus hotel and active faculty
researchers
Ithaca, NY
George Washington
University
Hospitality program with an emphasis
on international tourism
Washington, DC
Johnson & Wales University Hospitality programs available on four
campuses
Providence, RI
Michigan State University Student hospitality association
produces annual hospitality events
East Lansing, MI
Ohio State University Hospitality program combines learning
with internships
Columbus, OH
THE NAACP OPPORTUNITY AND DIVERSITY REPORT CARD: THE HOTEL AND RESORT INDUSTRY 14
Educational Institution Description of Program City/State
Pennsylvania State
University
Hospitality program with a goal for
undergrads to reach senior-level
executive positions
University Park, PA
Purdue University Research centers and laboratories in
tourism, food service, and lodging
West Lafayette, IN
Texas Tech University Hospitality program with experiential-
learning at nearby hotel
Lubbock, TX
University of Arkansas Family and Consumer Sciences Fayetteville, Arkansas
University of Delaware Hospitality program with two degree
options and experiential-learning at
two on-campus hospitality venues
Newark, DE
University of Denver Hospitality program with a focus on
business education, experiential-
learning, and career placement
Denver, CO
University of Houston Hospitality program includes
experiential-learning at an on-campus,
name-brand hotel
Houston, TX
University of Nevada, Las
Vegas
Gaming management concentration for
students who want to work in casinos
Las Vegas, NV
Opportunity and Inclusion Practices
Professional Pipeline Initiatives
Professional pipeline programs strengthen diversity and opportunities in the lodging industry. Training
programs benet not only the employee, but also the employer—recruiters can attract more qualied
entry-level candidates by outlining career paths and showing examples of managers who have worked
their way up from entry-level positions.
24
Professional pipeline programs, specically with respect to
general management positions, must develop “operationally skilled yet business-oriented” managers.
25
Food and beverage managers, responsible for a substantial portion of the hotel’s business, are crucial
to the overall success and reputation of a hotel.
26
Their organizational experience and skillset thus
translate particularly well to a general manager position. While recent research suggests that younger
general managers do not perceive the food and beverage manager position to be an important career
stepping stone toward becoming a general manager, it (or a nancial and sales managerial position)
allows for more rapid advancement than other mid-level management positions.
27
The advancement outlook for chefs and cooks relative to other occupations in the service sector is
24 International Society of Hospitality Consultants. (2006 November 29). Top 10 issues in hospitality industry for 2007.
HospitalityNet. Retrieved from http://www.hospitalitynet.org/news/154000320/4029554.html.
25 Harper, S & Brown, C & Irvine, W. (Issue 17, 2005: 51–65). Qualications: A fast-track to hotel general manager? Inter-
national Journal of Contemporary Hospitality Management.
26 Starwood Hotels. Career paths. Retrieved on August 2, 2012 from www.starwoodhotels.com/luxury/careers/paths/de-
scription.html?category=200000269.
27 Harper, S & Brown, C & Irvine, W. (Issue 17, 2005: 51–65).

THE NAACP OPPORTUNITY AND DIVERSITY REPORT CARD: THE HOTEL AND RESORT INDUSTRY 15
particularly promising, with opportunities to move up to higher-level positions that include executive
chef, restaurant manager, or food service manager. In addition, advancement opportunities are greater
for entry-level service employees who move to other departments. Employees who excel in customer
service can advance to other jobs that involve interacting with the public, including public relations,
advertising, sales, and management. However, it is important to note that education (both two- and
four-year degrees) is increasingly becoming a requirement for advancement opportunities, particularly
at the managerial level.
28
Formal qualications (e.g., a degree in hospitality management, business,
or both), considered “far more benecial [than informal training] in developing functional
management skills,”
29
are integral for career development.
Professional associations, individual hotels, and community organizations can also provide
development and educational opportunities. There are hospitality associations for people of color who
own hotels, such as the National Association of Black Hotel Owners, Operators & Developers
(NABHOOD), the Hispanic Hotel Owners Association (HHOA), and the Asian American Hotel
Owners Association (AAHOA). Many hotels also offer manager trainee internships, which serve as
an opportunity for students to obtain hands-on experience, shadowing opportunities, and access to
mentoring and professional development. In addition to hospitality management programs, several
community initiatives, organizations, and professional associations educate and train people of color
in hospitality. For instance, the Multicultural Affairs Congress (Philadelphia) conducts a program
that educates teenagers about long-term career opportunities and options available in hospitality. Each
year, the National Society of Minorities in Hospitality (NSMH) hosts a national conference and
career fair that establishes working relationships between the hospitality industry and students of color
to support their career advancement. Additionally, several hotels and diversity lodging associations
have executive recruitment programs and management trainee programs that identify people of color
with a promising future in the industry and train them for management positions in the eld.
Inclusive Business Practices: Supplier Diversity
Tarun Kapoor, professor of hotel management at the Collins School of Hospitality Management at
California State Polytechnic University, Pomona, advises: “To improve the state of diversity within
the hospitality industry, it is necessary to improve the state of diversity at the franchise, nance,
and supplier level.”
30
From 2002 to 2007, the total number of rms owned by people of color in the
U.S.
31
increased by 46% to 5.8 million.
32
Yet despite minority business growth, equal participation
in contracting and procurement opportunities in all industries remains an ongoing challenge for
the minority business community. David A. Hinson, national director of the Minority Business
Development Agency, states, “While the number of minority-owned businesses continues to grow,
they are still smaller in size and scale compared to non-minority-owned rms.”
33
According to the
Insight Center for Community Economic Development, supplier diversity programs are mutually
benecial for hotel chains and small businesses owned by people of color because they “transform
the nature of the purchasing body with diverse suppliers who benet the hotel (product quality and
28 U.S. Department of Labor. Career Guide to Industries 2010–11 Edition: Hotels and Other Accommodations. Washing-
ton, DC: U.S. Department of Labor, Bureau of Labor Statistics. Retrieved from http://www.bls.gov/iag/tgs/iag721.htm.
29 Ibid.
30 Tsering, L. (2004 March 14). Is the industry recruiting racially diverse workforce? India West.
31 The total number of minority-owned rms is not specic to the lodging industry but includes all industries.
32 U.S. Census Bureau. (2007 June). 2007 Survey of Business Owners: Company Summary. Retrieved from http://www.
census.gov/econ/sbo/.
33 U.S. Department of Commerce. (2010 July 19). Number of minority-owned businesses increases but economic parity
remains elusive. Washington, DC: U.S. Department of Commerce, Minority Business Development Agency. Retrieved from
http://www.mbda.gov/pressroom/press-releases/number-minority-owned-businesses-increases-economic-parity-remains-
elusive.

THE NAACP OPPORTUNITY AND DIVERSITY REPORT CARD: THE HOTEL AND RESORT INDUSTRY 16
public image of purchaser), thereby increasing the opportunities for a diverse pool of rms, suppliers, and
contractors.”
34
Additionally, rms owned by people of color benet the community by fueling its economy,
which leads to the creation of more jobs, an expanded tax base, community benets, and global
competitiveness.
35
Hotel chains’ supplier diversity programs enable hotels to invest directly in communities of color by
“building family and community assets and assisting them in overcoming the racial wealth gap.”
36
Overall, the lodging industry still needs to develop more effective partnerships with minority vendors and
suppliers to bridge that gap.
Inclusive Business Practices: Ownership
Hotel ownership is consistently cited as the greatest challenge for diversity in the hospitality industry.
37
In 2010, African American- and Latino-owned hotels represented less than 2% of all hotels in the nation.
As previously mentioned, hotel ownership by people of color can spur job creation for other people of
color, particularly at the management level. For instance, Asian Americans own approximately 40% of
the nation’s franchised hotels, produce over 500,000 hotel jobs per year,
38
and have representation as
general managers nearly proportional to their presence in the population.
39
In addition, hotel ownership
creates a strong entrepreneurial network and widens the base of intellectual capital, which results in
generational wealth. On the topic of African American hotel ownership, Michael Roberts states: “[African
Americans] need legacy. We have to have examples of successes in order for us to be able to let the
generations to come know that many of the successes that occurred by African Americans in this country
can be seen and pointed out and can be emulated.”
40
Lack of experience and access to capital are the most signicant barriers to hotel ownership for people
of color.
41
The presidents of afnity associations in the lodging industry emphasize that established
hotels need to do more to level the playing eld of hotel ownership and assist potential hotel owners of
color in overcoming these barriers.
42
Associations have initiated efforts to improve minorities’ knowledge
of the hospitality business by offering seminars, boot camps, and workshops, along with connecting
potential owners with experienced owners. Nonetheless, capital is the key to hotel ownership. Many
lenders, especially in the current economy, prefer to invest in franchisees that have existing or previous
hospitality experience, and many potential hotel owners of color are rst-time buyers.
43
In dealing with
this challenge, afnity associations are reaching out to people of color who own successful franchises in
other arenas, such as fast food restaurants or auto dealerships.
34 Cooper, C. & Russell, S. (2008 July 20-22). Evaluating and articulating the benets of supplier diversity and M/WBE pro-
grams. Presented at Insight Center for Community Economic Development meeting in Kansas City, MO.
35 U.S. Department of Commerce. (2010 July 19). Number of minority-owned businesses increases but economic parity re-
mains elusive. Washington, DC: U.S. Department of Commerce, Minority Business Development Agency. Retrieved from http://
www.mbda.gov/pressroom/press-releases/number-minority-owned-businesses-increases-economic-parity-remains-elusive.
36 Cooper, C. & Russell, S.
37 National Association of Black Hotel Owners, Operators & Developers (NABHOOD); Hispanic Hotel Owners Association
(HHOA); and Asian American Hotel Owners Association (AAHOA), personal interview, August 10 –12, 2010.
38 Asian American Hotel Owners Association. (2010 May 27). New survey showcases unprecedented impact of AAHOA
members. Retrieved from http://www.aahoa.com/AM/Template.cfm?Section=Home&TEMPLATE=/CM/ContentDisplay.
cfm&CONTENTID=4717.
39 Tsering, L. (2004 March 14). Is the industry recruiting racially diverse workforce? India West.
40 Lavandera, E. & Drash, W. (2009 August 24). Two Brothers, No Fears and $1 Billion Empire. CNN. Retrieved from http://
www.cnn.com/2009/LIVING/08/24/black.donald.trumps/index.html.
41 (2005 August 2). Blacks in the hotel business. The Miami Times.
42 National Association of Black Hotel Owners, Operators & Developers (NABHOOD); Hispanic Hotel Owners Association
(HHOA); and Asian American Hotel Owners Association (AAHOA), personal interview, August 10 –12, 2010.
43 Ibid.
THE NAACP OPPORTUNITY AND DIVERSITY REPORT CARD: THE HOTEL AND RESORT INDUSTRY 17
Presently, most of the largest national hotel corporations have hotel franchise development and owner
programs that are, in some capacity, aimed at attracting diverse entrepreneurs interested in hotel
ownership. According to NABHOOD president Andy Ingraham, a number of major brands are starting
to recognize the importance of having owner diversity, allocating more resources to help grow these
segments.
44
Diverse owners give hotels a competitive edge by drawing from their perspective and
background to appeal to an increasingly diverse client base.
45
The afnity associations acknowledge
that some programs are more successful than others, and that much work still needs to be done to level
the playing eld for owners of color. Therefore, more resources—specically incentives and collecting
more diversity data (particularly for franchises)—must be used to ensure that the industry provides
ample opportunities for people of color to compete in this market.
The Methodology of the NAACP Opportunity
and Diversity Report Card
The NAACP analyzed data from the ve largest hotel and resort corporations in the United States:
Hilton Worldwide; Hyatt Hotels Corporation; Marriott International, Inc.; Starwood Hotels & Resorts
Worldwide, Inc.; and Wyndham Hotel Group. Each corporation was asked to report on the percentage
of African Americans and other people of color comprising its governing body (such as Board of
Directors), its employees at multiple levels (from top management to unskilled workers), the number of
employees hired or promoted, its suppliers providing goods and services, and its property owners and
managers.
-Responses from the corporations were compared to industry averages. These industry averages were
taken from research completed by the U.S. Equal Employment Opportunity Commission, the U.S.
Census Bureau, and the Alliance for Board Diversity.
-For each question, corporations were rated on a scale that included A+, A, B, C, D, and F. A grade of C
indicates an average performance, meeting the industry average. Higher grades corresponded to higher
levels of diversity.
-Each corporation received an overall grade based on its performance in ve sections. The sections were
weighted as follows: Governing Body – 10%; Workforce Diversity – 40%; Employee Transition – 10%, Supplier
Diversity – 20%; Property Ownership/Management – 20%.
• Governing Body – 10%
• The governing body consists of elite members who jointly oversee the activities of the
company. In a public company, this is typically a Board of Directors. In private organizations,
the governing body might be organized under a different title, such as Executive Committee.
• Workforce Diversity – 40%
• Workforce diversity details the diversity of employees at many levels. In this report, we
assessed ve categories:
• Top management, which includes chief ofcers like the CEO, who direct the corporation
strategically and tactically on a day-to-day basis
• Low/mid management, which includes all managers below the top management level
• Highly skilled workers, which includes positions that need signicant training
• Semi-skilled workers, which includes positions that need moderate training
44 (2007 August 1). Hotels owned by blacks growing. The Mississippi Link.
45 Fortier, B & Ford, M. (2011 June). Diversity in hospitality franchising: Making good business sense. International Franchise
Association. Retrieved from http://franchise.org/IFA_NEWS/Diversity_in_Hospitality_Franchising__Making_Good_Business_
Sense/.

THE NAACP OPPORTUNITY AND DIVERSITY REPORT CARD: THE HOTEL AND RESORT INDUSTRY 18
• Unskilled workers, which includes positions that need minimal to no skill. In the lodging
industry, jobs requiring fewer skills are far more plentiful.
46
• Employee Transition – 10%
• Employee transition reviews the diversity of employees newly hired or promoted in 2011.
• Supplier Diversity – 20%
• Supplier diversity records the percentage of contracts for goods and services (e.g.,
everything from repairing buildings to providing linens) to businesses owned by African
Americans and other people of color. This question is used in part to measure opportunities
for the creation of wealth within diverse communities.
• Property Ownership/Management – 20%
• This section conveys the percentage of African Americans and other people of color who own
franchised properties or hold general manager positions at properties that each corporation
owns or manages. This question is used in part to measure opportunities for the creation of
wealth within diverse communities.
For each rating, the score for the corporation was compared to an industry average. These industry
averages were pulled from the following sources for each variable:
• Governing Body – scores were compared to the diversity of members of Fortune 500 Boards of
Directors, as detailed in an Alliance for Board Diversity report from 2011.
47
• Workforce Diversity – all ve sections (Top Management, Mid/Lower Management,
Highly Skilled Positions, Semi-skilled Positions, and Unskilled Positions) were compared to
corresponding job categories in the 2010 EEO-1 reports for the hotel and motel sector published
by the U.S. Equal Employment Opportunity Commission.
48
• Employee Transition – new hires were compared to the overall diversity in the hotel and
motel sector as detailed in the 2010 EEO-1 report published by the U.S. Equal Employment
Opportunity Commission.
49
Promotions were compared to the national working age population
(ages of 18-64) as detailed in the 2010 Census published by the U.S. Census Bureau.
50
• Supplier Diversity – scores were compared to the proportion of business ownership in the
United States, weighted to take account of business size, as reported in the 2007 Survey of
Business Owners published by the U.S. Census Bureau.
51
• Property Ownership/Management – for this variable, scores were compared to hotel and
motel sector ownership statistics from the 2007 Survey of Business Owners published by the
U.S. Census Bureau
52
, and hotel and motel sector management statistics from the 2010 EEO-1
report published by the U.S. Equal Employment Opportunity Commission.
53
46 These ve workforce diversity categories were created utilizing the following EEO-1 job categories: top management con-
sists of Executive/Senior Level Ofcials & Managers; middle/lower management consists of First/Mid Level Ofcials & Managers;
highly skilled workers consists of Professionals, Technicians, and Craft Workers; semi-skilled workers consists of Sales Workers,
Ofce & Clerical Workers, and Operatives; and unskilled workers consists of Laborers and Service Workers.
47 Alliance for Board Diversity. 2011. Missing Pieces: Women and Minorities on Fortune 500 Boards. Retrieved from http://the-
abd.org/ABD_report.pdf.
48 Data retrieved from http://www1.eeoc.gov/eeoc/statistics/employment/jobpat-eeo1/2010/index.cfm, NAICS-5 code 72111:
Hotels (except Casino Hotels) and Motels.
49 Ibid.
50 U.S. Census Bureau, 2010 Census: Summary File 2, Tables PCT3 and PCT4.
51 U.S. Census Bureau, 2007 Survey of Business Owners: Statistics for All U.S. Firms by Industry, Gender, Ethnicity, and Race
for the U.S., States, Metro Areas, Counties, and Places: 2007
52 Ibid.
53 Data retrieved from http://www1.eeoc.gov/eeoc/statistics/employment/jobpat-eeo1/2010/index.cfm, NAICS-5 code 72111:
Hotels (except Casino Hotels) and Motels.
THE NAACP OPPORTUNITY AND DIVERSITY REPORT CARD: THE HOTEL AND RESORT INDUSTRY 19
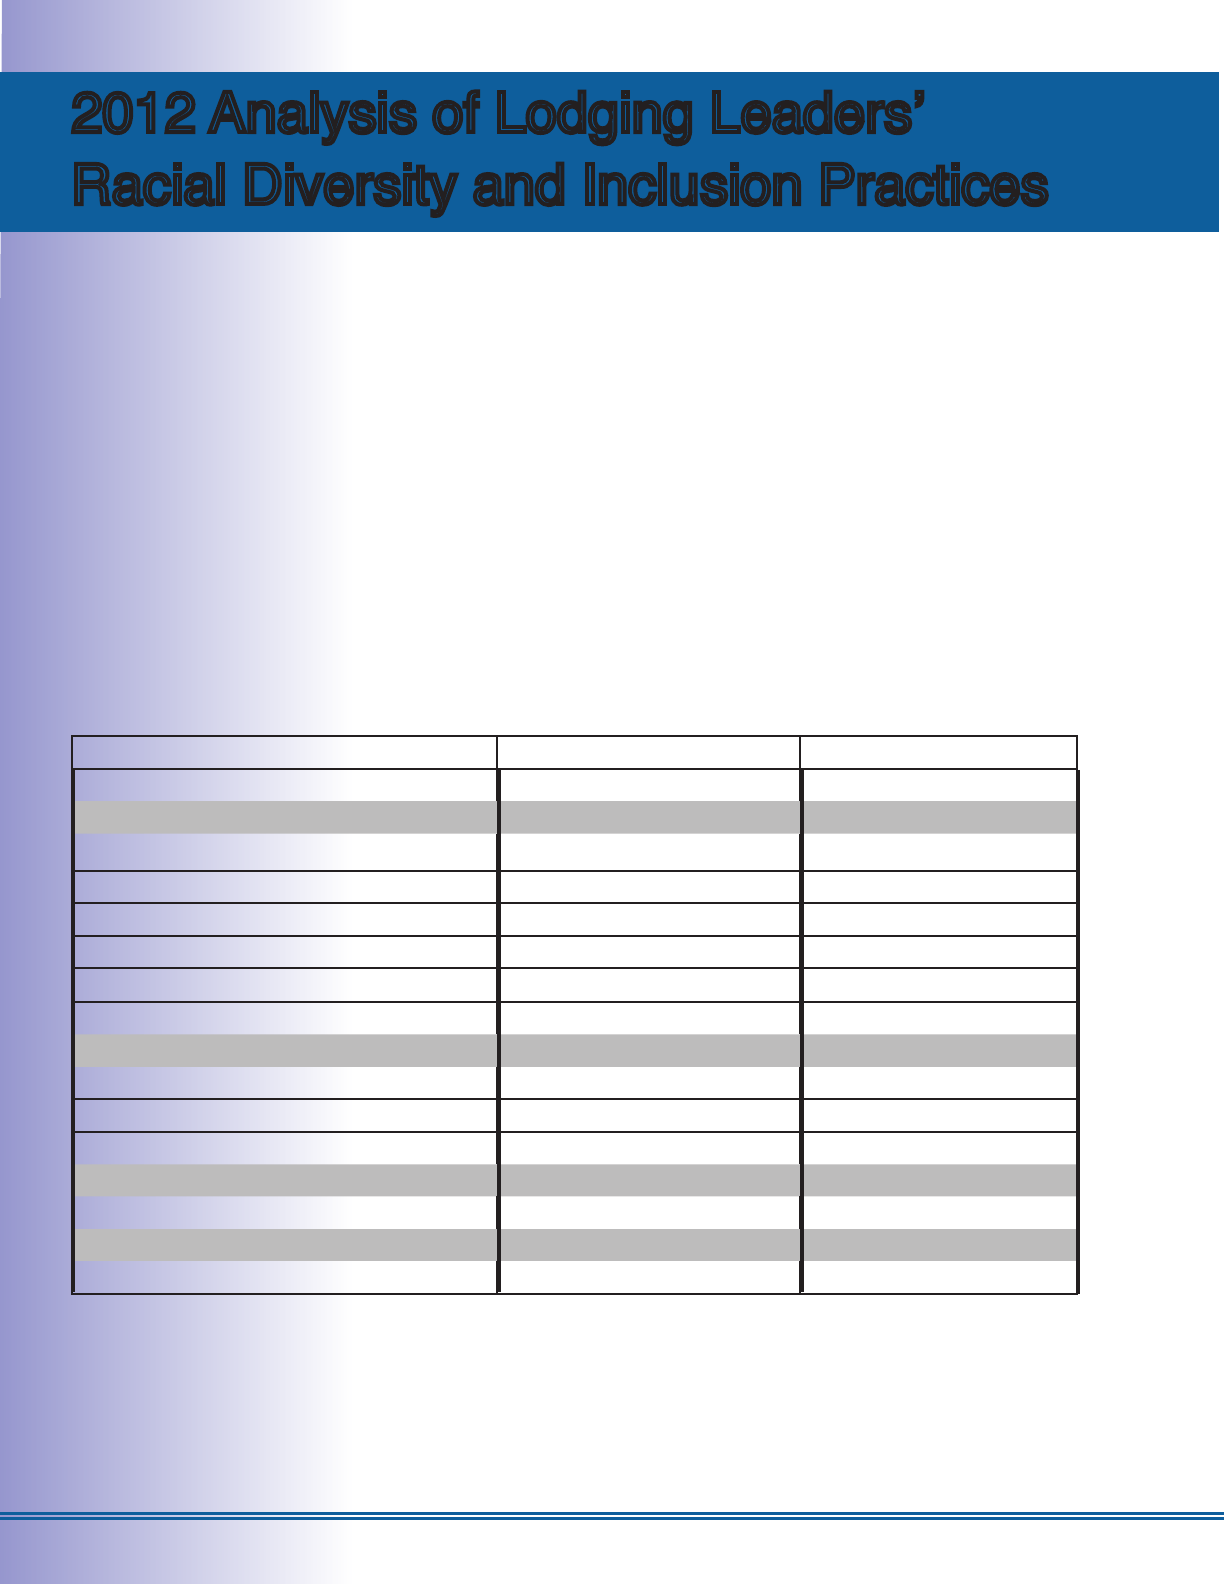
2012 Analysis of Lodging Leaders’
Racial Diversity and Inclusion Practices
Overview of Industry Wide Trends and Averages
Corporation-specic report cards of the ve largest hotel companies will be more meaningful when
analyzed in the context of the entire lodging industry and general population. By comparing the industry-
wide averages to the population, we can examine the amount of inclusion that exists for African Americans
and other people of color in the lodging sector. These trends do not specically focus on the ve selected
corporations, but instead reect the current state of the industry.
In the following table, the industry average for each variable is listed. Each of these averages can be
compared to the percentage of African Americans and other people of color in the working age population,
ages 18-64. According to the 2010 U.S. Census, the working age population in the United States was 12.3%
African American and 35.6% people of color. When the rate of inclusion of African Americans and other
people of color is higher than or equal to these percentages, the score is listed in green, indicating high
levels of diversity. However, when inclusion falls below the working age population, the percentage is listed
in red, indicating low levels of diversity.
Industry Averages Relative to Population
African Americans People of Color
Governing Body 7.6% 12.8%
Workforce Diversity
Top Management 3.8% 19.4%
Mid/Lower Management 9.2% 30.7%
Highly Skilled 12.1% 45.5%
Semi-skilled 16.7% 46.5%
Unskilled 18.6% 63.0%
Employee Transition
New Hires 16.8% 55.7%
Promotions 12.3% 35.6%
Supplier Diversity 0.9% 6.4%
Property Ownership/Management 2.0% 16.7%
• Red numbers indicate inclusion at levels below the working age population
• Green numbers indicate inclusion at levels equal to or higher than the working age population
On the non-management level, African Americans and other racial minorities are well represented.
Inclusion increases as the skill level of the job decreases. African Americans are proportionately represented
in highly skilled positions, while showing even more representation in semi-skilled and unskilled positions.

THE NAACP OPPORTUNITY AND DIVERSITY REPORT CARD: THE HOTEL AND RESORT INDUSTRY 20
Similar trends are seen for people of color.
However, African Americans and other people of color are poorly represented in upper
management positions and governing body membership. Industry averages are lowest in the
categories that best generate wealth: supplier diversity and hotel ownership/management.

THE NAACP OPPORTUNITY AND DIVERSITY REPORT CARD: THE HOTEL AND RESORT INDUSTRY 21
Industry Report Cards
In the following analysis, the data for each corporation will be compared with industry averages. As
noted, for African Americans and other people of color, governing body membership, management
positions, supplier diversity, and hotel ownership have industry-wide percentages that are often
dramatically lower than their share of the United States population. Thus, a favorable rating above
C indicates rates that are more inclusive relative to the rest of the industry, but does not necessarily
indicate the absence of disparity and discrimination.
On the other hand, some variables in the industry, such as unskilled and semi-skilled positions,
have dramatically higher percentages for African Americans and other people of color than their
representation in the United States population.
Currently, the lodging corporations included in this report do not include franchises in most of their
diversity planning or even data collection. Thus, despite the number of total properties under each
corporate umbrella, only a portion of those properties are included in the following report cards. We
will note the portion of properties included in the following analyses.
Hilton Worldwide
Overall Grade: C+
African Americans People of Color
Governing Body F D
Workforce Diversity
Top Management D F
Mid/Lower Management C C
Highly Skilled C A
Semi-skilled C B
Unskilled B A+
Employee Transition
New Hires B C
Promotions C A+
Supplier Diversity C C
Property Ownership/Management B A+
At the end of 2011, Hilton Worldwide had 3,866 properties in 91 countries, with 3,271 properties in
the United States. This includes such brands as Doubletree, Embassy Suites, and the eponymous
Hilton Hotels and Resorts. 92% of Hilton’s properties are franchises. Hilton provided employment

THE NAACP OPPORTUNITY AND DIVERSITY REPORT CARD: THE HOTEL AND RESORT INDUSTRY 22
and supplier diversity data for the remaining 8% of its properties, in addition to a small number of
additional locations, such as corporate headquarters.
For its small, select percentage of reported properties, Hilton received the second highest grade
in this report. Hilton’s performance was, on average, better for people of color than African
Americans.
Notable Areas of Performance
Hilton earned excellent scores in hotel ownership/management, scoring highly for African
Americans and exceedingly well—an A+ grade—for people of color. Hilton also performed very
well in its non-managerial workforce, with high marks for people of color for its highly skilled, semi-
skilled, and unskilled positions, as well as for new hires and promotions. For unskilled positions
and new hires among African Americans, Hilton exceeded the industry average.
Opportunities for Improvement
Although Hilton is one of the largest hotel corporations in the country, it reports diversity and
inclusion data for only a little over 300 of its properties—an unacceptably low percentage that
greatly hinders proper analysis of its diversity and inclusion. Hilton’s poor grades in its governing
body are another cause for concern, receiving an F for African American inclusion and a D for
people of color inclusion. Additionally, Hilton received only fair to poor scores for its management
positions and supplier diversity in reported properties.
Diversity Initiatives
For supplier diversity, Hilton has instituted a purchasing policy that requires diverse suppliers be
included on larger bids at all supplier levels. The company gives diverse suppliers the opportunity
to meet decision-makers to better prepare for future contracts.
For workforce diversity, Hilton recruits diverse talent using a variety of resources, including
recruiting at historically black colleges and universities (HBCUs) with hospitality programs, and at
the National Society of Minorities chapters at a number of schools. Hilton also collaborates with
a minority executive search rm. Additionally, Hilton has established Team Members Resource
Groups for diverse employees, which benet from the sponsorship of an executive (Senior Vice
President or higher). Hilton also selects 20 team members to be mentored for 18 months by
executives to assist with leadership and career development for diverse employees.
The organization collects and segments data by brand at all levels, enabling a targeted analysis
and response. Additionally, Hilton sends out and analyzes employee surveys to examine team
member experiences for racial bias or discrimination.
THE NAACP OPPORTUNITY AND DIVERSITY REPORT CARD: THE HOTEL AND RESORT INDUSTRY 23
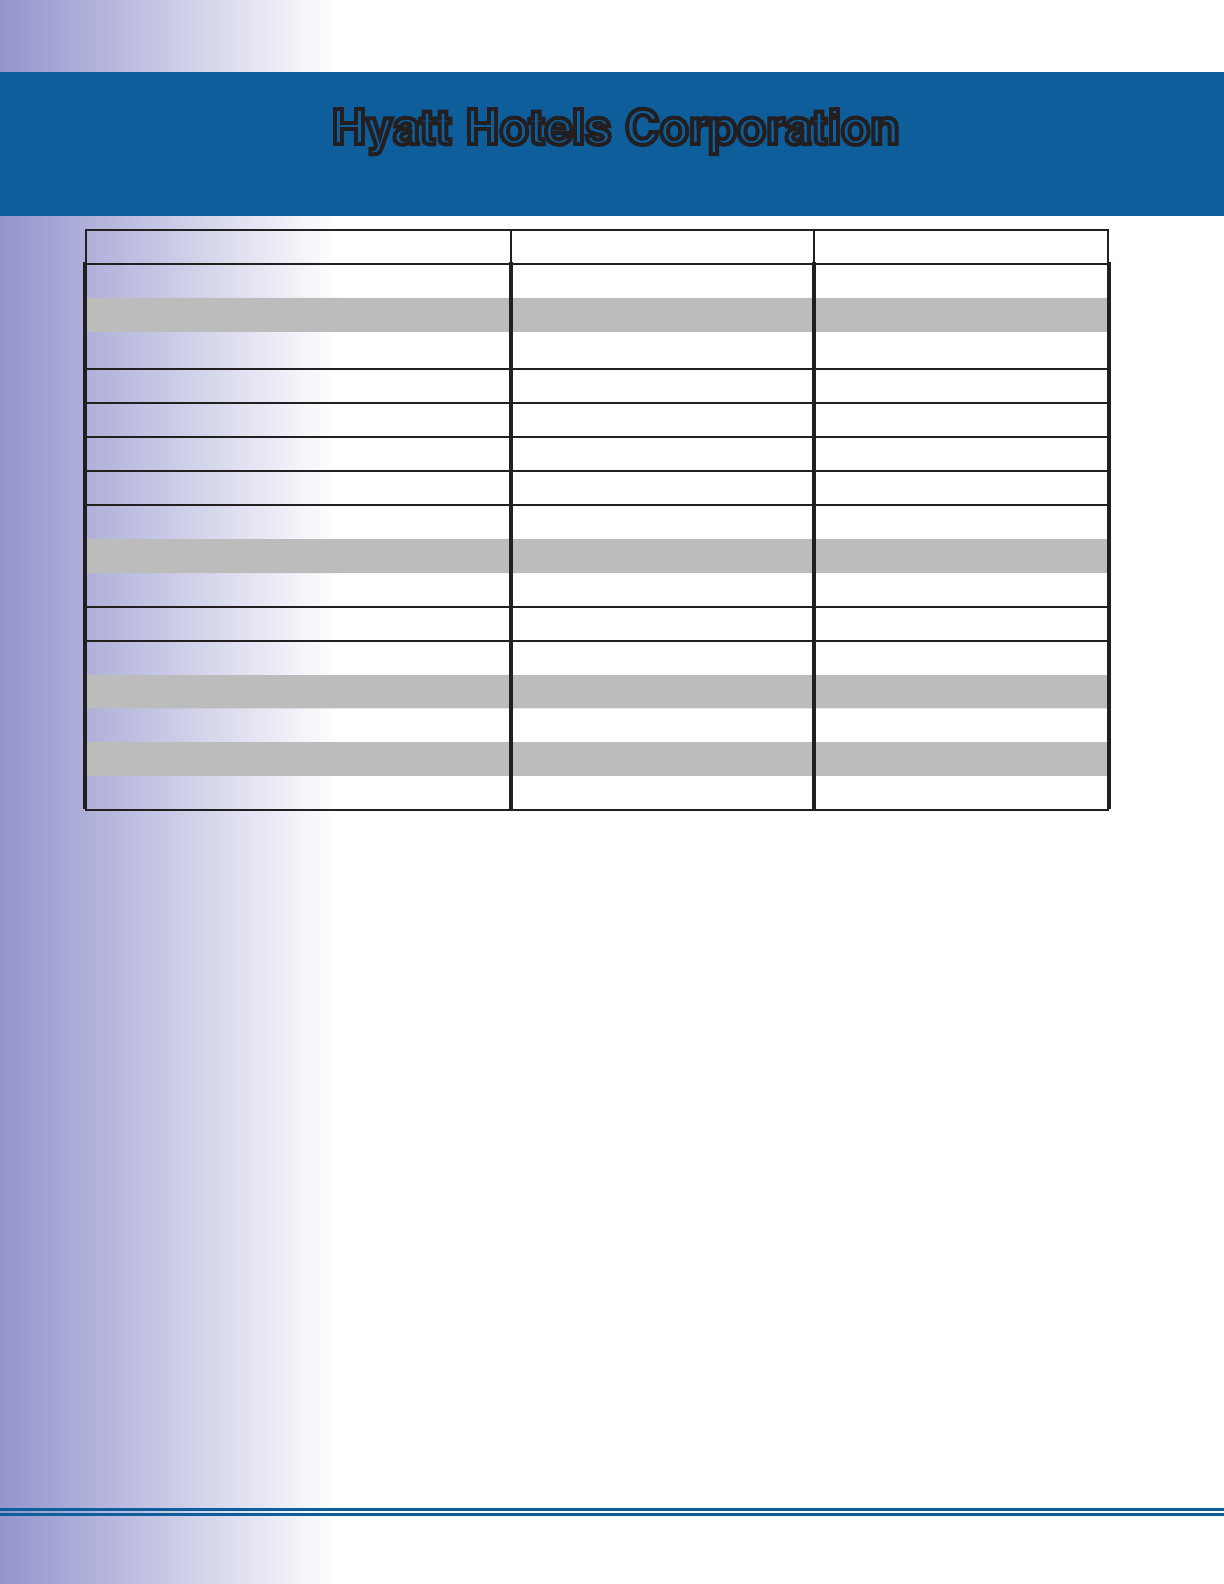
Hyatt Hotels Corporation
Overall Grade: C
African Americans People of Color
Governing Body C F
Workforce Diversity
Top Management F F
Mid/Lower Management C B
Highly Skilled D C
Semi-skilled D C
Unskilled C A+
Employee Transition
New Hires C F
Promotions C B
Supplier Diversity C B
Property Ownership/Management C C
At the end of 2011, Hyatt Hotels Corp had 483 properties in 45 countries, with 350 properties in the United
States. This includes such brands as Hyatt Regency, Grand Hyatt, and the eponymous Hyatt. 40% of Hyatt’s
properties are franchises. Hyatt provided employment and supplier diversity data for all of its corporately
owned and managed properties (60% of total U.S. properties) in addition to a small number of other
locations, such as corporate headquarters.
Hyatt’s C grade indicates performance at the industry average. Overall, Hyatt performed a little
better for people of color than for African Americans.
Notable Areas of Performance
Hyatt well exceeded the industry average for unskilled workers of color in reported properties, and
performed fairly well in mid/lower management and supplier diversity for people of color in their
reported properties. Hyatt also exceeded the industry average for promotions among people of
color.
Opportunities for Improvement
Though Hyatt is the only hotel in the survey that collects diversity and inclusion data for the majority
of its properties, it still needs to collect diversity and inclusion data for its franchised properties. At the
top of the corporate owchart, Hyatt’s governing body had poor diversity for people of color. Hyatt also
fails in diversity and inclusion for top management for both African Americans and other people of color.

THE NAACP OPPORTUNITY AND DIVERSITY REPORT CARD: THE HOTEL AND RESORT INDUSTRY 24
Additionally, Hyatt only met the low industry average in a number of categories, including property
ownership/management for both African Americans and other people of color, as well as mid/lower
management, supplier diversity, and governing body for African Americans. In these vital areas, Hyatt
should strive to exceed these already-low industry averages.
Diversity Initiatives
For employment, Hyatt has a number of pipeline efforts and partnerships, including the Hyatt
Hotel Fund for Minority Lodging Management Students, which has awarded over 300 scholarships
totaling more than $500,000. However, Hyatt strives to actively participate in partnerships that
go beyond mere monetary support. To that end, Hyatt recently launched Employee Network
Groups to facilitate personal and professional development among diverse employees. This
includes mentoring and networking opportunities that share best practices and ensure corporate
accountability.
Hyatt uses data for benchmarking purposes, including providing a summary to its Board of
Directors. The corporate ofce works closely with hotel properties on afrmative action goals,
including good faith efforts to hire diverse employees. Finally, a Diversity and Inclusion Council is
now actively implementing changes at the hotel level.

THE NAACP OPPORTUNITY AND DIVERSITY REPORT CARD: THE HOTEL AND RESORT INDUSTRY 25
Marriott International, Inc.
Overall Grade: B
African Americans People of Color
Governing Body A+ A+
Workforce Diversity
Top Management C F
Mid/Lower Management C C
Highly Skilled B A
Semi-skilled B B
Unskilled B A+
Employee Transition
New Hires B C
Promotions A A+
Supplier Diversity C B
Property Ownership/Management B B
At the end of 2011, Marriott International, Inc. had 3,718 properties in 73 countries, with 3,072
properties in the United States. This includes such brands as the Ritz-Carlton, Renaissance
Hotels, and the eponymous Marriott Hotels and Resorts. 76% of Marriott’s properties are
franchises. Marriott provided employment and supplier diversity data for the remaining 24% of its
properties in addition to a small number of additional locations, such as corporate headquarters.
Marriott earned a B—the highest grade for reported properties in this report. A key component
of this overall grade is a high score for African Americans in a number of categories. On average,
Marriott performed nearly as well with African Americans as they did with people of color, whereas
the other four corporations were inclined to receive worse scores for African Americans.
Notable Areas of Performance
One area of note was Marriott’s exceptionally diverse governing body, receiving the highest marks
for both African Americans and other people of color. Marriott also performed well in the area of
promotions for reported properties.
Marriott received fair to better than average scores in property ownership/management and
supplier diversity, two especially problematic areas in which we challenge corporations to meet
and exceed low industry averages.

THE NAACP OPPORTUNITY AND DIVERSITY REPORT CARD: THE HOTEL AND RESORT INDUSTRY 26
Marriott’s non-managerial workforce scored well for African Americans and particularly well for
people of color for reported properties.
Opportunities for Improvement
Marriott’s weakness lay at the top of its employment structure, receiving only average to failing
marks for management positions.
Diversity Initiatives
For employment, Marriott provides extensive support that helps students of color reach higher
status positions in the lodging industry. For instance, Marriott has a Career Acceleration Program
that promotes career advancement for high-potential leaders of color. Marriott also openly strives
to promote from within, providing hourly associates with promotion opportunities. This is reected
in Marriott’s excellent grades in the area of promotions, although we note that there is still much
room for improvement in reaching management positions.
For supplier diversity, Marriott runs a Supplier Diversity Council staffed by key leaders in different
departments. Marriott provides training and resources to diverse suppliers.
Marriott’s CEO is heavily involved in promoting diversity and inclusion efforts, reviews diversity
metrics and progress, and personally signs off on executive compensation tied to diversity.
Management and executive performance reviews and compensation are tied to diversity results
in both employment and procurement.
The Committee for Excellence, which includes three board members and seven senior
executives, oversees Marriott’s diversity efforts. This committee establishes diversity goals and
monitors progress via a diversity scorecard. Additionally, the Global Diversity and Inclusion
Council, chaired by Marriott’s CEO, helps coordinate diversity and inclusion efforts. Marriott also
has regional councils that focus on diversity efforts in smaller geographic areas.

THE NAACP OPPORTUNITY AND DIVERSITY REPORT CARD: THE HOTEL AND RESORT INDUSTRY 27
Starwood Hotels and Resorts Worldwide, Inc.
Overall Grade: C
African Americans People of Color
Governing Body C B
Workforce Diversity
Top Management F C
Mid/Lower Management D C
Highly Skilled D C
Semi-skilled C B
Unskilled B A+
Employee Transition
New Hires C B
Promotions C A+
Supplier Diversity C D
Property Ownership/Management D B
At the end of 2011, Starwood Hotels and Resorts Worldwide, Inc. had 1,090 properties in 100
countries, with 484 properties in the United States. This includes such brands as the Le Méridien, W
Hotels, and Sheraton. 70% of Starwood’s properties are franchises. Starwood provided employment
and supplier diversity data for the remaining 30% of its properties along with a small number of
additional locations, such as corporate headquarters.
Starwood earned a C, indicating an average performance. Overall, Starwood performed far better with
people of color than with African Americans.
Notable Areas of Performance
For reported properties, Starwood received high marks for its unskilled workforce, and very high marks
for promotions among people of color. Starwood’s governing body also received average to above
average grades. Starwood’s property ownership/management for people of color was also above
average, despite having a high number of luxury brands that have relatively high start-up costs.
Opportunities for Improvement
Starwood received fair to poor scores for both its highly skilled workforce and upper and mid/lower
management for reported properties. Starwood also received mediocre grades for its supplier diversity
program in reported properties, particularly for people of color. Overall, Starwood’s grades were relatively low
for African Americans, suggesting that attention should be paid to African Americans in particular.

THE NAACP OPPORTUNITY AND DIVERSITY REPORT CARD: THE HOTEL AND RESORT INDUSTRY 28
Diversity Initiatives
For employment, Starwood has instituted Diverse Recruitment Slate goals to ensure that people of color
are included for all hiring decisions, particularly senior-level positions. High-potential employees of color
are rotated through different positions to gain experience needed for a lateral move or promotion. The
Human Resources Department has also created a review process to determine if there are differences
in the work experience for people of color compared to white employees.
Starwood’s CEO personally signs off on executive compensation tied to diversity, including diversity
metrics and progress in both employment and supplier diversity. A Diversity Council that includes key
members of leadership meets quarterly and is driven by established diversity and inclusion metrics.

THE NAACP OPPORTUNITY AND DIVERSITY REPORT CARD: THE HOTEL AND RESORT INDUSTRY 29
Wyndham Hotel Group
Overall Grade: C
African Americans People of Color
Governing Body A A+
Workforce Diversity
Top Management C F
Mid/Lower Management F D
Highly Skilled F F
Semi-skilled D D
Unskilled C A+
Employee Transition
New Hires B D
Promotions F F
Supplier Diversity B A
Property Ownership/Management F A+
By the end of 2011, Wyndham Hotel Group had 7,206 properties in 70 countries, with 5,821
properties in the United States. This includes such brands as Days Inn, Ramada Worldwide, and
the eponymous Wyndham Hotel and Resorts. 99.7% of Wyndham’s properties are franchises.
Wyndham provided employment and supplier diversity data for the remaining 0.3% of its properties
in addition to a small number of additional locations, such as corporate headquarters.
Notable Areas of Performance
Although this NAACP report card does not punish corporations for their business model or
corporate structure, the high number of franchises under the Wyndham umbrella complicates the
analysis of Wyndham’s performance. Despite having the largest number of U.S. properties of all
the corporations included in this report card, Wyndham only provided data for 20 non-franchise
properties, or less than 1% of the properties under their corporate umbrella. This unacceptably low
percentage of data greatly obstructs our ability to assess Wyndham’s diversity and inclusion.
Wyndham’s most impressive scores come from a factor not inuenced by its franchise structure—
its governing body, which is exceptionally diverse for both African Americans and other people of
color. Additionally, Wyndham scores highly for property ownership/management, which includes
franchise ownership, with people of color.
Wyndham’s supplier diversity program, though small, has made signicant progress and has now
resulted in Wyndham working with a diversity of contractors and suppliers above the industry average
for reported properties. Wyndham also scores very highly for unskilled workers of color, and scores above

THE NAACP OPPORTUNITY AND DIVERSITY REPORT CARD: THE HOTEL AND RESORT INDUSTRY 30
average for African American new hires.
Opportunities for Improvement
When looking at job categories in reported properties, Wyndham’s workforce statistics represent a
lack of diversity. This is particularly noteworthy at the highly skilled worker level and in management
positions. Diversity in promotions was also lacking, and although Wyndham’s property ownership/
management was diverse for people of color, African Americans were poorly represented.
Diversity Initiatives
Based on employee requests, Wyndham hosts Associate Business Groups, including SPECTRUM,
which represents African Americans via networking and education. These workers have goals to
guide their development and their success is tracked via new hire and promotion data.
For supplier diversity, Wyndham aids businesses owned by people of color through the bidding
process and relies on numerous factors in decision-making, not just cost, to promote businesses
owned by people of color. Wyndham connects business owners of color to larger prime contractors
and other business development resources.
Wyndham highlights diversity and inclusion as one of its top ve strategic objectives. Wyndham
maintains a scorecard to set goals and track results, which is reviewed by top leadership. The
compensation of procurement associates is tied to diversity goals.

THE NAACP OPPORTUNITY AND DIVERSITY REPORT CARD: THE HOTEL AND RESORT INDUSTRY 31
Discussion and Report Summary
Opportunities for the Hotel and Resort Sector
In summary, the current report nds that the hotel and resort industry has substantial inclusion
and opportunity for people of color and African Americans. However, much of the inclusion occurs
in lower-level positions. For these lower-level positions, African Americans and other people of
color are vastly overrepresented relative to their share of the working age population ages 18-
64. The importance of gainful employment is hard to overstate. However, the overrepresentation
of employees of color and African Americans in lower status, lower paying jobs is a real point of
concern when they continue to be vastly underrepresented in management. Additionally, African
Americans are also less likely to own, run, or provide goods and services to a lodging property, or
be represented on the governing bodies of these corporations.
Supplier diversity and hotel ownership exhibited the lowest level of African American inclusion
industry-wide, while supplier and board diversity were the least inclusive categories for people
of color as a whole. In the important area of supplier diversity—that is, the inclusiveness of the
businesses with which hotels contract for goods and services—the industry average is poor,
at only 6.4% (with people of color making up 35.6% of the population ages 18-64). For African
Americans, supplier diversity is a meager 0.9% (with African Americans making up 12.3% of the
population ages 18-64). Much work remains to be done in the lodging industry to avoid deepening
the racial economic inequality that threatens the future of this country.
The disparities that occur in employment, ownership, and procurement occur not just at the
hotels and resorts selected for this report card, but throughout the entire hotel and resort industry.
Moving forward, hotel and resort corporations must continue to advance their equal opportunity
efforts, focusing on encouraging the inclusion of African Americans and other people of color
among higher-skilled workers, management, governing bodies, property owners, and suppliers.
Given the high level of representation of African Americans and other people of color in semi-
skilled and unskilled positions in this industry, determining ways to encourage progression towards
higher-skilled and management positions is an important step to remedy the disparity at higher
levels. Many of these efforts are detailed in the earlier section “Professional Pipeline Initiatives”
and are noted for individual corporations detailed in the previous section.
Prevalent Diversity and Inclusion Practices
Policies and programs put into place by the corporations contacted by the NAACP demonstrate
their recognition of the importance of inclusion. It is common to have high-level ofcers that focus
exclusively on diversity—or sometimes even supplier diversity alone. Most corporations also have
high-level committees that are focused on diversity. They also work with and support a variety of
diversity advocacy groups.
The use of data and research is also valuable. A number of the corporations mentioned data initiatives,
including creating scorecards for internal use and making results available to all employees. Goal setting
was also frequently mentioned.

THE NAACP OPPORTUNITY AND DIVERSITY REPORT CARD: THE HOTEL AND RESORT INDUSTRY 32
For supplier diversity, corporations typically send representatives to events geared toward helping small,
minority- and women-owned businesses succeed by teaching these businesses how to contract with the
company. However, national research conrms that these efforts need to be more than just supercial
to be effective. Some organizations mentioned pipeline programs that work to advance new or small
minority businesses, or encouraging successful minority businesses to work in the lodging sector.
On the workforce level, the lodging corporations included in this report demonstrated the many
ways in which they address diversity. For example, some corporations noted that they recruit top
employees using executive search rms that have a focus on diversity, or recruit through relevant
minority business associations. All corporations mentioned training for their own employees, though
corporations should ensure these trainings are effective.
Recommendations – Elevations of Noteworthy Practices
Particularly noteworthy initiatives emerged from a review of the corporations’ diversity and inclusion
programs and initiatives.
• Some corporations use metrics and goals not only to measure progress and performance,
but also to make needed changes and corrections. Furthermore, some corporations dive
deeply into the analyses, looking for ways to improve their business practices and provide
better experiences for their workers, business partners, and customers.
• Some corporations enforce accountability through various measures, including tying
diversity and inclusion results to performance evaluations and compensation.
• Some corporations ensure that diverse candidates have a chance to be considered and
compete for both employment and supplier contracts. They do this by requiring executive-
level positions or contracts to include people of color in their pool of candidates.
• Some corporations have active leadership that not only promote diversity and inclusion
goals when speaking to groups interested in these topics, but also make diversity and
inclusion a top priority. This includes chief ofcers and governing body members actively
participating in groups dedicated to diversity and inclusion.
Recommendations – New Initiatives
In The NAACP Opportunity and Diversity Report Card: The Hotel and Resort Industry, the
NAACP chose to focus on the ve largest corporations because they have the largest potential
impact on diversity and inclusion. However, in all cases, only a portion of the properties under
each corporation’s umbrella were included. In all cases, franchises were not included. Though the
corporations point out that these franchises are separate entities, they still include them in their
corporate umbrella, reach revenue deals with them, and hold them to national brand standards. In
most cases, franchising enables these corporations to enjoy nationwide visibility and growth across
the United States. The average consumer does not make a distinction between a hotel’s franchise
and non-franchise properties—as far as he or she is concerned, the diversity and inclusion
standards that help boost the hotel’s brand should apply to all properties that carry the company’s
name.
We understand that corporations are under no legal obligation to provide diversity and inclusion efforts
from their franchise properties. However, with relatively minimal effort, the corporations could collect the
EEO-1 diversity surveys that franchises submit to the federal government each year. These surveys contain
the same data used in this report to examine workforce diversity in non-franchises.
THE NAACP OPPORTUNITY AND DIVERSITY REPORT CARD: THE HOTEL AND RESORT INDUSTRY 33
We ask that all ve of the leading hotel and lodging corporations evaluated in this report collect EEO-1
surveys from all corporately branded hotels. We also encourage anyone hosting major events at hotels
to request the hotel’s EEO-1 survey. It is important that all major consumers make diversity and inclusion
an important factor in their decision-making process. The NAACP Economic Department will work with
our units and our national staff to ensure that diversity and inclusion data is reviewed before deciding on
future contracts with hotels.
Another goal is to include franchises in supplier diversity planning and data collection efforts. If the
franchises are not already utilizing and collecting supplier diversity data, this may take longer to
implement, but the value of such an undertaking would be high.
Some corporations receive diversity and inclusion data from their franchises. For example, the
food services corporation Domino’s Pizza provides a Workforce Availability Analysis to franchise
owners that compares its staff to the available local workforce and helps set diversity goals for
each store. McDonald’s also provides data on the diversity of its franchise staff. These are some of
the promising models that the lodging industry could adopt to promote diversity throughout all its
properties. Reecting the diversity of the communities being served is a necessary mark of a good
business in an increasingly diverse nation, which includes franchised properties under corporate
brands.
Data Limitations
Data disaggregation was limited in this analysis. For example, the NAACP was not able to
collect data by state or region. We are therefore unable to account for regional differences in the
racial and ethnic composition of the workforce or business ownership.
By using industry averages as comparison gures, we cannot fully account for the impact
of discrimination in these gures. A high mark in areas such as top management, governing
body membership, supplier diversity, or property ownership does not indicate representation
proportional to the country’s population. Accounting for the impact of discrimination, including
structural racism and implicit bias, is beyond the scope of the current analysis.
The ranking system can magnify small differences, particularly for smaller groups. For
example, the inclusion of one African American or person of color in a small group, such as in a
governing body, can have a large effect on the ranking.
Reliance on self-reported totals provided by corporations is not ideal. While we did not
receive the raw data used to create the statistics in this report, or have the ability to verify its
accuracy, we trust the integrity of the data provided by the corporations.
Despite these limitations, this report provides valuable information for consumers and advocates
interested in advancing fairness and racial diversity among the nation’s leading corporations in
the lodging sector. By using multiple methodologies, the NAACP was able to examine trends that
advanced diversity and inclusion while highlighting opportunities for improvement.

THE NAACP OPPORTUNITY AND DIVERSITY REPORT CARD: THE HOTEL AND RESORT INDUSTRY 34
Appendix: Race by Gender Intersectional
Analysis of Employment Data
In this appendix, we examine the intersection of race and gender in the lodging sector. We examine
employment data separately for women and men—once for African American men and women, and
once for men and women of color in total.
Industry-wide Figures Used as Comparison Group
Industry-wide gures were obtained from 2010 EEO-1 reports for the hotel and motel sector
published by the U.S. Equal Employment Opportunity Commission used in the main body of this
report card. The below table examines the percentage of men and women of color and African
American men and women employed in each of the ve employment categories.
Employment Percentages, by Race and Gender
Top
Management
Middle/Lower
Management
Highly
Skilled
Semi-skilled Unskilled
African American Men 2.1% 4.7% 8.9% 5.5% 9.0%
African American Women 1.6% 4.5% 3.1% 11.3% 9.5%
Men of Color 11.6% 16.2% 35.5% 15.8% 30.6%
Women of Color 7.8% 14.4% 10.0% 30.7% 32.3%
The next table presents the gender imbalance between men and women. Higher numbers (labeled
in blue) indicate higher employment of men and negative numbers (labeled in pink) indicate higher
levels of employment of women.
Gender Imbalance, by Race
Top
Management
Middle/Lower
Management
Highly
Skilled
Semi-skilled Unskilled
African American 0.5% 0.3% 5.8% -5.8% -0.5%
People of Color 3.9% 1.8% 25.5% -14.9% -1.7%
• Blue numbers indicate higher rates of male employment
• Pink numbers indicate higher rates of female employment
From these data, it is evident that both African American men and men of color are more likely to
be hired for management and highly skilled positions. On the other hand, African American women
and women of color are more likely to be hired for semi-skilled and unskilled positions.
For male-dominated positions, the clearest trend of higher rates for male employment occurred at the
highly skilled level, which includes skilled crafts such as construction. For female-dominated positions,
the clearest trend of higher rates for female employment occurred at the semi-skilled level, which includes
administrative support positions. Though African American men and men of color were more likely to be
employed at the mid/lower management level and African American women and women of color were
more likely to be employed at the unskilled level, these differences were relatively small.

THE NAACP OPPORTUNITY AND DIVERSITY REPORT CARD: THE HOTEL AND RESORT INDUSTRY 35
Comparing Each Corporation to the Industry Average
The tables below indicate whether each corporation employed more men and women of color and African
American men and women relative to industry-wide averages obtained from EEO-1 reports. Each time the
corporation met or exceeded the industry average, they received a mark.
Hilton Worldwide
Top
Management
Middle/Lower
Management
Highly
Skilled
Semi-skilled Unskilled
African American Men
African American Women
Men of Color
Women of Color
Hyatt Hotels Corporation
Top
Management
Middle/Lower
Management
Highly
Skilled
Semi-skilled Unskilled
African American Men
African American Women
Men of Color
Women of Color
Marriott International, Inc.
Top
Management
Middle/Lower
Management
Highly
Skilled
Semi-skilled Unskilled
African American Men
African American Women
Men of Color
Women of Color
Starwood Hotels and Resorts Worldwide, Inc.
Top
Management
Middle/Lower
Management
Highly
Skilled
Semi-skilled Unskilled
African American Men
African American Women
Men of Color
Women of Color

THE NAACP OPPORTUNITY AND DIVERSITY REPORT CARD: THE HOTEL AND RESORT INDUSTRY 36
Wyndham Hotel Group
Top
Management
Middle/Lower
Management
Highly
Skilled
Semi-skilled Unskilled
African American Men
African American Women
Men of Color
Women of Color
Hilton beat the industry average in 14 out of 20 categories, meeting or exceeding the industry
average in 7 out of 10 categories for both African Americans and people of color. Overall, Hilton’s
most noticeable area of weakness lay in its management-level positions.
Hyatt beat the industry average in only 8 out of 20 categories. Hyatt met or exceeded the industry
average in 3 out of 10 categories for African Americans and 5 out of 10 categories for people of
color.
Marriott had the best performance of all corporations. Marriott beat the industry average in 17 out
of 20 categories. Marriott bested the industry average in all 10 out of 10 categories for African
Americans and 7 out of 10 categories for people of color.
Starwood beat the industry average in 11 out of 20 categories. Though only meeting or exceeding
the industry average in 4 out of 10 categories for African Americans, Starwood beat the industry
average in 7 out of 10 categories for people of color.
Wyndham beat the industry average in only 8 out of 20 categories. Wyndham met or exceeded the
industry average in 4 out of 10 categories for both African Americans and people of color.
In total, when comparing the corporations to the industry averages for African American men and
women and men and women of color, there were no ubiquitous gender differences. These trends
point to an industry-wide need to examine the intersection of race and gender for people of color,
and African Americans specically.

THE NAACP OPPORTUNITY AND DIVERSITY REPORT CARD: THE HOTEL AND RESORT INDUSTRY 37
