
Action Plan
Diabetes
June 2020

Dear Maryland Partners,
In some way, diabetes affects every Marylander. You may have
diabetes or know someone who does. You may have lost a loved one
to complications from the disease. You may be a parent seeking to
adopt healthy food and activity habits. You may be a health care or
program provider in the community treating or helping people with
diabetes. You may be an employer concerned about how diabetes
affects productivity and health insurance costs. Or you may be a
taxpayer considering how to reduce the diabetes burden to our
State’s vitality and economy. Regardless of where you live in our State,
diabetes takes a toll, but it is a disease we can prevent or mitigate.
Diabetes is the sixth leading cause of death in Maryland. According
to the federal government, the number of US adults diagnosed with
diabetes has more than doubled in the past 20 years. And in Maryland,
over a third of all adults have prediabetes, the condition that often
leads to diabetes.
There are many reasons for all Marylanders to get involved against this
preventable disease. To that end, the Maryland Department of Health
and others have created the State’s inaugural 2019-2024 Diabetes Action
Plan. The Plan provides information on the disease burden in Maryland,
and best practices for the State and its partners to implement to
prevent and manage diabetes. It will serve as the State’s guide by
which we will set specific goals and measure our successes. These
actions address all Marylanders:
• People who are at a healthy weight, to prevent the onset of
overweight and obesity;
• People who are overweight and obese, to achieve a healthy weight;
• People with prediabetes and gestational diabetes, to participate in
prevention programs to halt disease progression; and
• People with diabetes, to get the care they need to control their disease
and enjoy optimum health.
Informed by extensive input and comment from many partners,
the strategies in this Plan are far-reaching. We are grateful for the
enthusiastic support which was offered by so many as we developed
this Plan. Success in defeating diabetes requires broad and strong
collaboration between communities, organizations, businesses, local
governments and individuals across the State. We encourage you to
use the Plan to identify steps you can take to prevent and manage
diabetes. And, most importantly, let us know how you think your
group or community can get involved.
This is our shared call to action: to take steps today to build a Healthy
Maryland for ourselves and for future generations. We look forward to
working with you to improve the health of all Marylanders.
Yours in good health,
Frances B. Phillips, RN, MHA
Deputy Secretary for Public
Health Services
Robert R. Neall
Secretary

Maryland Diabetes Action Plan 20201
In Maryland, over 10 percent of the adult
population has diabetes. An additional 34
percent of adults are estimated to have
prediabetes, a condition of high blood sugar
not quite high enough to be diabetes.
Diabetes is the sixth leading cause of death
in Maryland, and the fifth leading cause of
death for Black Marylanders in 2018. Diabetes
is also a major risk factor for developing
cardiovascular disease, the number one cause
of death for Marylanders. It is imperative to
launch a coordinated and meaningful initiative
to address the prevention and management
of diabetes in Maryland. The leading cause of
diabetes is overweight and obesity, the rate of
which has steadily increased to over 64 percent
of Maryland adults. Sedentary lifestyle is also a
risk; only 50 percent of Marylanders said they
participated in 150 minutes or more of physical
activity per week in 2017. Additionally, there are
disparities in how diabetes and its risk factors
affect Marylanders with racial/ethnic minorities,
those with less education, lower income, and
various disabilities disproportionately affected.
Diabetes and its complications cost the State
over $4.92 billion per year, and an additional
$2 billion in lost productivity.
The Maryland Diabetes Action Plan (the Plan)
includes details on the current burden of
diabetes and the factors impacting diabetes
risk. The Plan presents action steps that
organizations and partners can implement
to prevent and manage diabetes in Maryland.
These actions steps are categorized using a
systems change model approach, working
upstream to people at a healthy weight, then
progressing as the risk increases with people
who are overweight and obese, followed by
those with prediabetes or history of gestational
diabetes, and finally includes steps to improve
outcomes in those identified with diabetes
and diabetes complications.
Our vision is that an array of all Maryland
partners, across multiple sectors, will identify
opportunities, act in their areas of influence
in ways that align efforts, resources, and
Executive Summary
Action Plan
Diabetes

funds to reduce the burden of diabetes.
The Plan includes action tables that contain
strategies and action steps targeted to
support people across the continuum
of diabetes:
1. Keeping people at a healthy weight goal:
By 2024, 32 percent of Maryland adults will
be of healthy weight. The two objectives are
to increase access to healthy nutrition and
achieve and maintain recommended
physical activity levels for all Marylanders.
2. People who are overweight and obese goal:
By 2024, maintain the percentage of adults
with a BMI >25 at 66.5 percent; and reduce
by 10 percent the BMI >85th percentile in
high school students. The two objectives
are to improve clinical care services for
overweight and obese children and adults
and improve the availability of health lifestyle
options for overweight and obese children
and adults.
3. People with prediabetes and gestational
diabetes goal: By 2024, increase the
prevalence of Maryland adults who know
their prediabetes status by 30 percent.
The two objectives are to improve
prediabetes outcomes and reduce risk
of diabetes in women with a history of
gestational diabetes.
4. People with diabetes goal: By 2024, reduce
the age-adjusted diabetes mortality by 5
percent. The first objective is to improve the
use of standardized quality of care for people
with diabetes at all levels of the health care
system by increasing the number of
health systems statewide that utilize the
chronic care model (CCM) framework, as
recommended by the American Diabetes
Association’s 2019 Standards of Medical Care
in Diabetes. The second objective is to
reduce the number of hospitalizations and
emergency department visits each by
5 percent for people with diabetes in the
state of Maryland.
In preparation of this Diabetes ActionPlan, a
process was completed to inventory obesity,
prediabetes, and diabetes programs in
Maryland. The aim of the inventory is to assess
the availability of programs across Maryland
that address diabetes prevention, care, and
management. While the required level of
service provision across the state cannot be
determined through the inventory alone, the
Maryland Department of Health aims to use
this process to begin to identify resource gaps
and opportunities to expand efforts to address
diabetes moving forward. The scope of the
inventory is all programs serving Marylanders,
including those that serve Medicaid enrollees,
Medicare enrollees, commercial and small
business health insurance enrollees, and
the uninsured population.
MDH published an online draft of the plan and
encouraged the public and partners to provide
feedback. Over 30 responses were submitted
by institutions and individuals. MDH worked to
integrate the feedback into this final version.
As Maryland seeks to prevent and better
manage diabetes, all partners are encouraged
to implement action steps, while also sharing
innovative and best practices for expansion
across the state that aligns with the Diabetes
Action Plan and improves the health of
all Marylanders.
2Maryland Diabetes Action Plan 2020

3
EXECUTIVE SUMMARY .........................................................................................................................................................................................1
I. The Burden and Consequences of Diabetes in Maryland ...................................................................................... 6
What is Diabetes? ................................................................................................................................................................................................... 6
How Common is Diabetes in Maryland? .................................................................................................................................................7
Adults with Diagnosed Diabetes and Its Precursor Conditions in Maryland ............................................................7
Geographic Distribution of Diabetes in Maryland ...................................................................................................................... 8
How Serious are the Consequences of Diabetes for Maryland? ............................................................................................ 9
Diabetes as a Cause of Death .................................................................................................................................................................... 9
Complications of Diabetes ........................................................................................................................................................................ 10
Utilization Rates and Costs for Diabetes ............................................................................................................................................11
Diabetes-related hospital discharges in Maryland ..............................................................................................................11
Diabetes-related Prevention Quality Indicators (PQIs).....................................................................................................11
Diabetes Inpatient Hospital Charges ...........................................................................................................................................12
Diabetes Emergency Department Visits ..................................................................................................................................12
Utilization Differences for Medicaid Enrollees with Diabetes vs. Without Diabetes...................................13
Cost Burden of Diabetes in Maryland .........................................................................................................................................13
Medicaid Costs of Diabetes in Maryland .................................................................................................................................. 14
II. Determinants and Risk Factors for Diabetes: Opportunities for Intervention ...........................................15
Diabetes by Age and Sex ..................................................................................................................................................................................15
Diabetes and Weight ..........................................................................................................................................................................................17
Adult Prevalence of Excess Weight in Maryland .........................................................................................................................18
Overweight/Obesity in Women of Childbearing Age .............................................................................................................. 19
Excess Weight among Children .............................................................................................................................................................21
Diabetes and Physical Activity ..................................................................................................................................................................... 22
Diabetes and Tobacco .......................................................................................................................................................................................24
Diabetes and Oral Health ................................................................................................................................................................................ 25
Diabetes and Income .........................................................................................................................................................................................26
Diabetes and Level of Education ...............................................................................................................................................................27
Diabetes and Health Literacy .......................................................................................................................................................................28
Diabetes and Disability .....................................................................................................................................................................................29
Diabetes and Mental Health .........................................................................................................................................................................30
Gestational Diabetes ...........................................................................................................................................................................................31
Prediabetes ................................................................................................................................................................................................................31
Social Determinants of Health and Diabetes Risk ......................................................................................................................... 32
Diabetes and Health Equity ...........................................................................................................................................................................33
Table of Contents
Maryland Diabetes Action Plan 2020

4
Figure 1: Diabetes Risk Continuum ..............................................................................................................................................................7
Figure 2: Age-adjusted Adult Prevalence of Diagnosed Diabetes by Race/Ethnicity (R/E), ..................................
Maryland 2015-17 (BRFSS) ............................................................................................................................................................................7
Figure 3: Map of Age-Adjusted Adult Prevalence of Diagnosed Diabetes by Jurisdictions, ............................... 8
Figure 4: Age-adjusted Adult Prevalence of Diagnosed Diabetes by Jurisdiction, ................................................... 8
Figure 5: Age-adjusted Adult Prevalence of Diagnosed Diabetes by Race and
Jurisdiction, Maryland 2015-17 (BRFSS) ............................................................................................................................................. 9
Figure 6: Age-Adjusted Death Rate for Diabetes, by Race/Ethnicity, Maryland 2009-2018 ............................... 10
Figure 7: Age-adjusted Death Rate for Diabetes, Maryland and the United States,
2009-2018 ............................................................................................................................................................................................................ 10
Figure 8: Diabetes Composite (PQI 93) per 100,000 Population Aged 18+ in Maryland .......................................12
Figure 9: Adult Prevalence of Doctor-Diagnosed Diabetes, by Age and Sex, Maryland
2015-17 (BRFSS) ................................................................................................................................................................................................. 15
Figure 10: Age-adjusted Adult Incidence Rate of Diagnosed Diabetes, by Sex, U.S.,
1980 to 2017 (National Health Interview Survey)........................................................................................................................16
Figure 11: Age-adjusted Adult Prevalence of Doctor-Diagnosed Diabetes, by
Race/Ethnicity and Weight Status, Maryland 2015-17 (BRFSS) ........................................................................................17
Figure 12: Age-adjusted Adult Obesity Prevalence by Jurisdiction, Maryland
2015-17 (BRFSS) .................................................................................................................................................................................................18
Figure 13: Weight Category Distribution of Women of Childbearing Age, by Race .................................................19
III. Intervention Strategies and Actions Steps for Diabetes Prevention and Control................................. 34
Rationale Behind Four Risk Populations for Diabetes ................................................................................................................34
Interventions for the Healthy Weight Population .......................................................................................................................... 36
Interventions for the Overweight and Obese Populations ...................................................................................................... 37
Interventions for the Gestational Diabetes and Prediabetes Populations ...................................................................38
Interventions for Managing Diabetes and Diabetes Complications ................................................................................40
Managing and Controlling Diabetes ........................................................................................................................................................41
IV. Action Tables for Diabetes Prevention and Control ............................................................................................ 43
V. Inventory of Diabetes-related Resources/Appendices ....................................................................................... 54
Development of a Diabetes Program Inventory .............................................................................................................................54
Diabetes Prevention and Care .....................................................................................................................................................................55
HealthChoice Diabetes Prevention Program (HealthChoice DPP) .............................................................................55
Investing in Prevention Programs.............................................................................................................................................................55
Acronyms ....................................................................................................................................................................................................................56
Contributors ..............................................................................................................................................................................................................57
Table of Figures
Maryland Diabetes Action Plan 2020

5
Figure 14: Crude Adult Prevalence of Diagnosed Diabetes by Physical Activity
Status and Race, Maryland 2011-13 (BRFSS) .................................................................................................................................22
Figure 15: Age-adjusted Prevalence of 150 Minutes per Week of Physical Activity .................................................23
Figure 16: Age-adjusted Adult Prevalence of Diagnosed Diabetes by Smoking Status ......................................24
Figure 17: Age-adjusted Adult Prevalence of Current Smoking, by Diabetes
Status, Maryland 2017 (BRFSS) .............................................................................................................................................................24
Figure 18: Age-adjusted Prevalence of Doctor Diagnosed Diabetes, By Income and
BMI Status (Maryland BRFFS 2015-2017) ........................................................................................................................................26
Figure 19: Age-adjusted Adult Prevalence of Doctor Diagnosed Diabetes, by Income
and Race, Maryland 2015-17 (BRFSS) ................................................................................................................................................26
Figure 20: Distribution of Household Income by Black or White Race ........................................................................... 27
Figure 21: Age-adjusted Adult Prevalence of Diagnosed Diabetes, by Education
and Black or White Race, Maryland 2015-17 (BRFSS) ............................................................................................................27
Figure 22: Distribution of Education Level, for NH Black and NH White Adults,
Maryland 2011-13 (BRFSS) ..........................................................................................................................................................................28
Figure 23: Age-adjusted Adult Prevalence of Doctor Diagnosed Diabetes, By Presence
or Absence of Selected Disabilities (Maryland BRFSS 2015-2017) ................................................................................. 29
Figure 24: Age-Adjusted Percent of Adults Ever Diagnosed with Depression,
by Diagnosed Diabetes Status, Maryland 2017 (BRFSS) .....................................................................................................30
Figure 25: Social Determinants of Health .............................................................................................................................................32
Figure 26: Diabetes Systems Thinking Model ...................................................................................................................................35
Figure 27: Three Buckets of Prevention .................................................................................................................................................35
Table 1: Diabetes-related Hospital Discharge Count and Rate per 1,000
Adult Marylanders ........................................................................................................................................................................................... 11
Table 2: PQI 93 Discharge Frequency and Rate per 1,000 Adult Marylanders .............................................................. 11
Table 3: Diabetes-related ED Visit Count and Rate per 1,000 Population ....................................................................... 12
Table 4: Admission, ED Visit, and Ambulatory Visit Prevalence and Rates; and Average
Payments Comparing Medicaid Enrollees with and without Diabetes, Maryland, 2017...............................13
Table 5: Trend in Age-adjusted Adult Prevalence of Weight Classification (BMI groups),
Maryland 2013-2017 ........................................................................................................................................................................................18
Table 6: Pre-pregnancy BMI of Active Pregnant Women as of October 7, 2019 ........................................................20
Table 7: Prevalence of Weight Classes Among Children Participating in WIC
in Maryland (by Jurisdiction, July-December 2018; 40,935 Total Children) ............................................................ 22
Table of Tables
Maryland Diabetes Action Plan 2020

Action Plan
Diabetes
6
Section I:
The Burden and Consequences of Diabetes in Maryland
Diabetes is a chronic disease that affects the
way the body handles glucose, which is the
sugar in the blood used by the body for
energy. An inability of cells to properly absorb
glucose, due to inadequate insulin production
or a resistance of cells to the action of insulin,
or both, results in high blood glucose levels,
which is called diabetes. There are several types
of diabetes, the most common of which is type
2 diabetes. The other major types are type 1
diabetes, which usually has onset during
childhood and adolescence, and gestational
diabetes, which occurs during pregnancy.
1
Type 1 diabetes results from an autoimmune
attack against the cells in the pancreas that
produce insulin. This leads to an almost
complete lack of insulin, early severe
symptoms, and a dependence on insulin
treatment to sustain life. About 4 percent
of diabetes in the United States is type 1
diabetes.
2
The risk factors and interventions
discussed in this plan may not all apply to
type 1 diabetes.
Type 2 diabetes results in most cases from a
resistance to the action of insulin on cells.
This insulin resistance is related to overweight
and obesity, particularly fat located in the
abdomen. The degree to which the insulin
resistance manifests as high blood sugar
depends on how well, and for how long,
the pancreas can overproduce insulin to
compensate for the insulin resistance in the
cells. A decline in the insulin production
capacity with older age is one reason that type
2 diabetes often emerges at older ages. Type 2
diabetes can exist without symptoms for
years, which is why approximately 24 percent
of persons with diabetes don’t know that they
have it.
3
About 95 percent of diabetes in the
United States is type 2 diabetes. The risk factors
and most interventions discussed in this plan
are designed for type 2 diabetes.
Most public health surveillance data do
not distinguish between type 1 and type 2
diabetes but refer to the two combined.
However, since type 2 diabetes is 95 percent
of the total, patterns seen in the surveillance
data are the patterns of type 2 diabetes.
4
Public health data also often only measure
persons who know that they have diabetes,
which means that true diabetes prevalence
may be approximately one quarter higher
than the estimates of diagnosed
diabetes prevalence.
What is Diabetes?
Diabetes Care. January 01 2019; volume 42 issue Supplement 1.
2
ADA website https://www.diabetes.org/resources/statistics/statistics-about-diabetes
3
Id fn 2
4
Id fn 2
Maryland Diabetes Action Plan 2020

7
Prediabetes is a condition where blood
sugar levels are higher than normal, but not
high enough to be considered diabetes.
Prediabetes is a precursor condition on the
pathway from normal glucose levels to type 2
diabetes; the development of type 1 diabetes is
usually so rapid that there is no “prediabetes”
state that precedes type 1 diabetes. A fasting
glucose level of 100 to 125 mg/dL, a hemoglobin
A1C level of 5.7 percent to 6.4 percent, or a
two-hour glucose level in an oral glucose
tolerance test of 140 to 199 mg/dL
defines prediabetes.
5
Prediabetes often goes unrecognized by both
individuals and their health care providers;
nine of 10 adults who have prediabetes do
not know they have it.
6
CDC estimates that
34 percent of U.S. adults have prediabetes.
7
Diabetes and prediabetes are serious
conditions that can lead to complications
including heart disease and stroke,
blindness, amputations, nerve damage,
and kidney disease.
A disease is important to public health
if it is both common and has serious
consequences. Diabetes is both common
and serious in Maryland.
https://www.cdc.gov/diabetes/basics/getting-tested.html
6
https://www.cdc.gov/diabetes/basics/prediabetes.html
7
Centers for Disease Control and Prevention. National Diabetes Statistics Report, 2017. Atlanta, GA: Centers for Disease Control and Prevention, U.S. Dept of Health and Human Services; 2017.
8
Maryland Behavioral Risk Factor Surveillance System (BRFSS), 2017.
9
United States Census, 2017.
10
Diabetes Care. January 01 2019; volume 42 issue Supplement 1.
11
Based on Maryland Adult Population, sources: US 2017 Census; 2017 Maryland BRFSS; and Centers for Disease Control and Prevention. National Diabetes Statistics Report, 2017. Atlanta, GA: Centers for Disease
Control and Prevention, U.S. Dept of Health and Human Services; 2017.
12
Based on Maryland Adult Population, sources: US 2017 Census; 2017 Maryland BRFSS; and Centers for Disease Control and Prevention. National Diabetes Statistics Report, 2017. Atlanta, GA: Centers for Disease
Control and Prevention, U.S. Dept of Health and Human Services; 2017. Categories are not equal, percentages in this figure do not equal 100.
Adults with Diagnosed Diabetes and Its
Precursor Conditions in Maryland
An estimated 10.5 percent of the adult
population in Maryland, or 488,942 adults,
have diabetes.
8,9
In Maryland an estimated
1.6 million adults or 34 percent of the adult
population have prediabetes (see Figure
1 on this page).
10,11
The adult prevalence of diagnosed diabetes is
highest in Non-Hispanic (NH) Blacks, followed
by Non-Hispanic Asians and Hispanics, and
lowest in Non-Hispanic Whites, as shown in
Figure 2 on this page.
How Common is Diabetes in Maryland?
Diabetes Risk Continuum
12
Figure 1
Healthy
Population
1,351,479
(32%)
Overweight
and Obese
2,799,259
(66.2%)
Prediabetes
1,575,829
(33.9%)
Diagnosed
Diabetes and
Diabetes with
Complications
488,942
(10.5%)
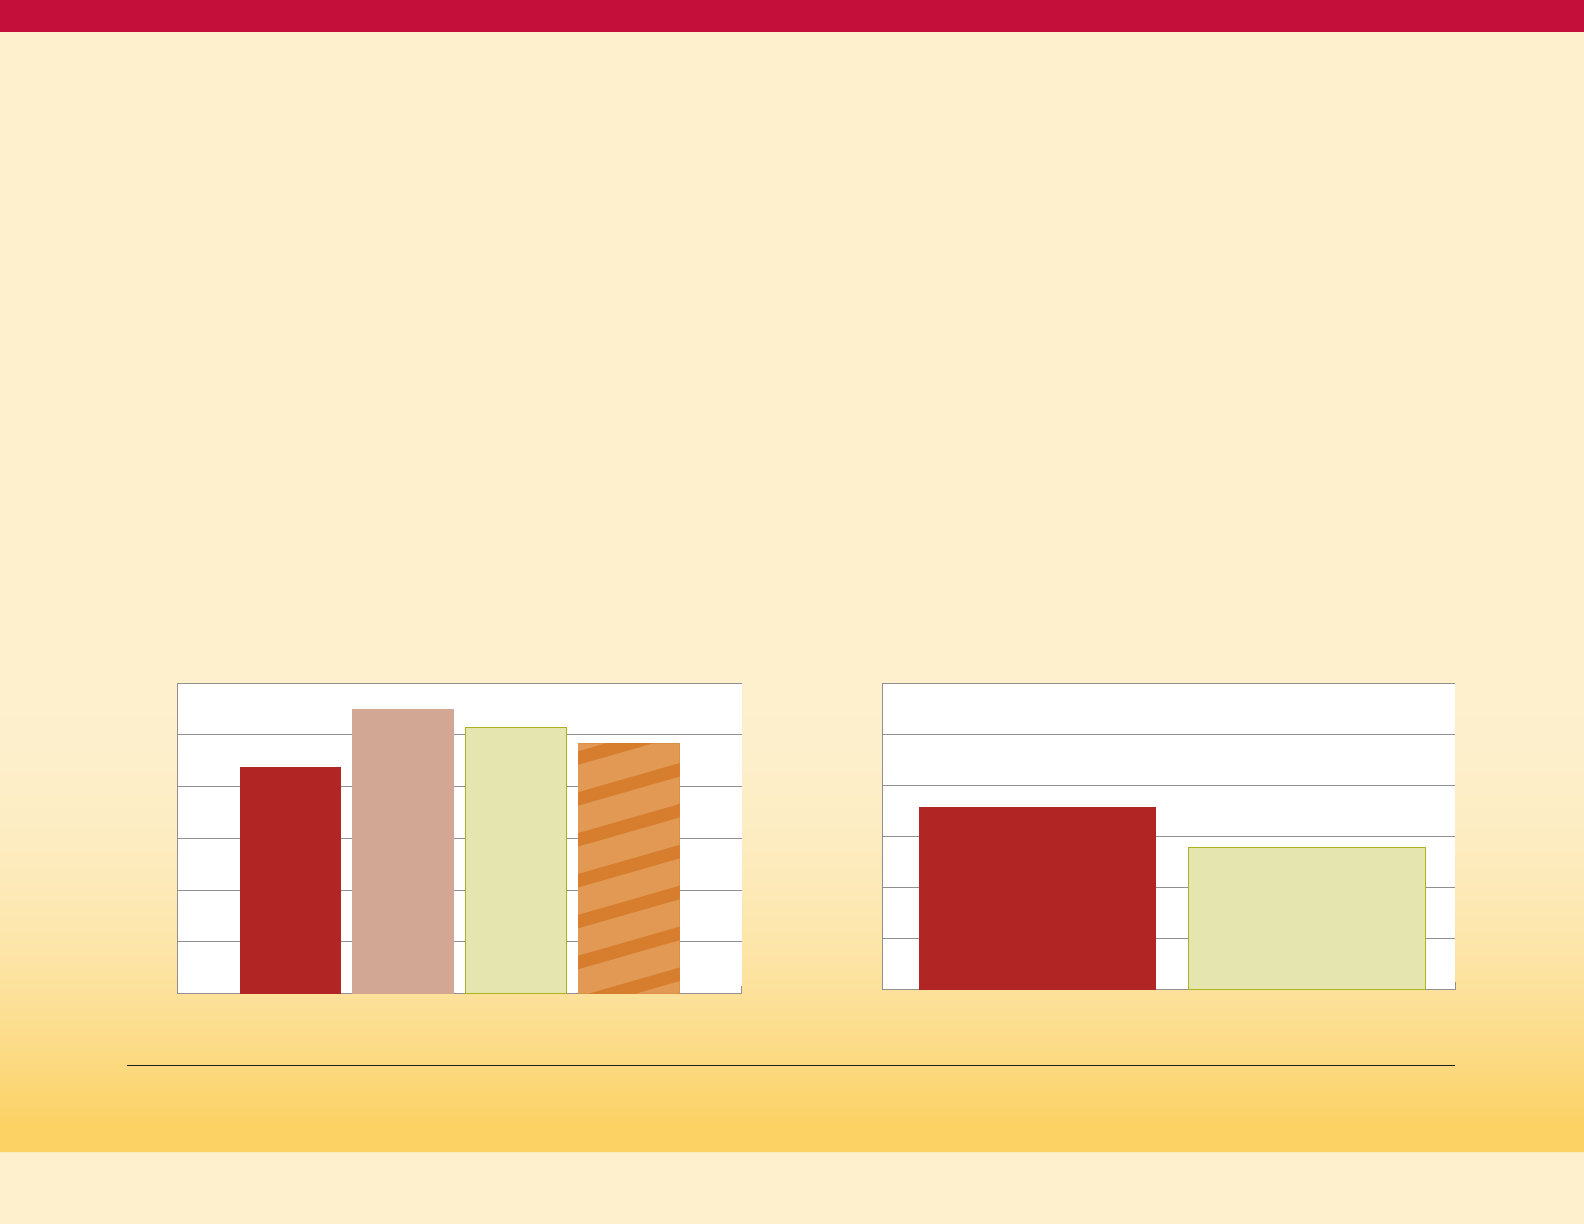
Age-adjusted Adult Prevalence of Diagnosed Diabetes
by Race/Ethnicity (R/E), Maryland 2015-17 (BRFSS)
Figure 2
15%
12%
9%
6%
3%
0%
8.0%
NH White
13.3%
NH Black
9.7%
NH Asian
9.4%
Hispanic
9.7%
All R/E
Maryland Diabetes Action Plan 2020
8
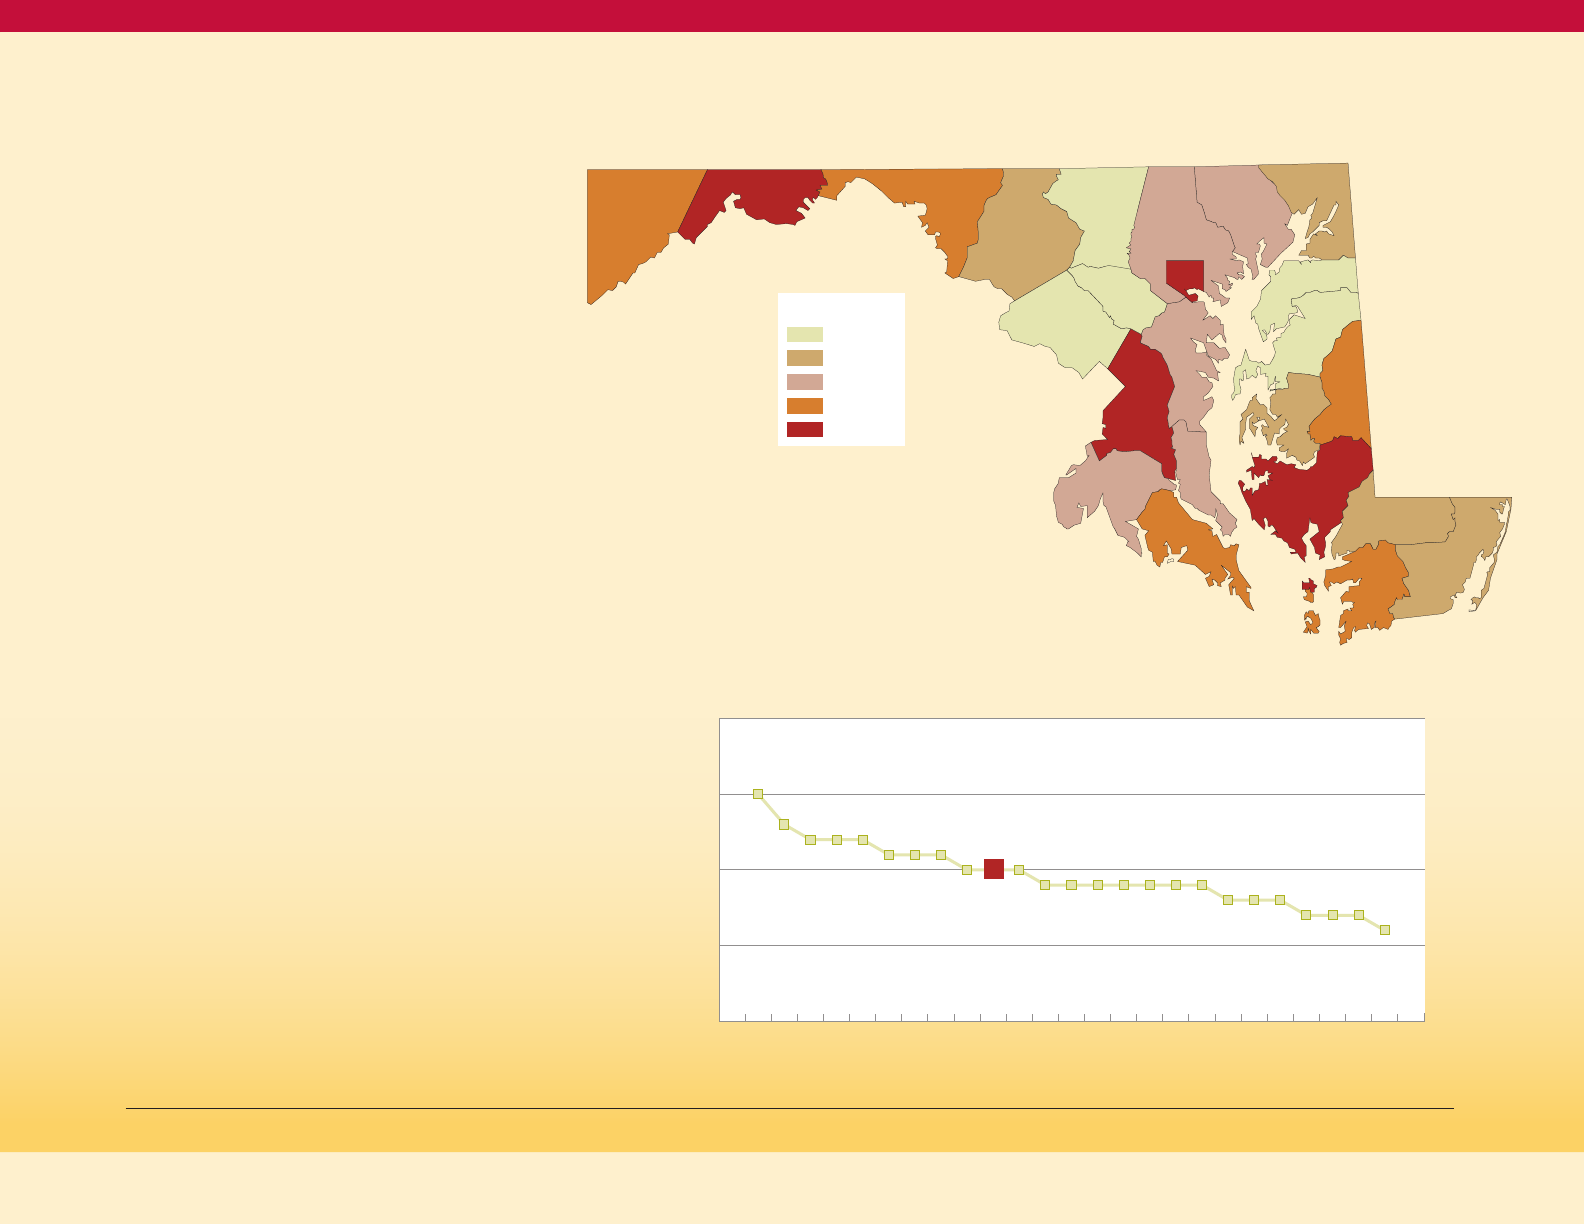
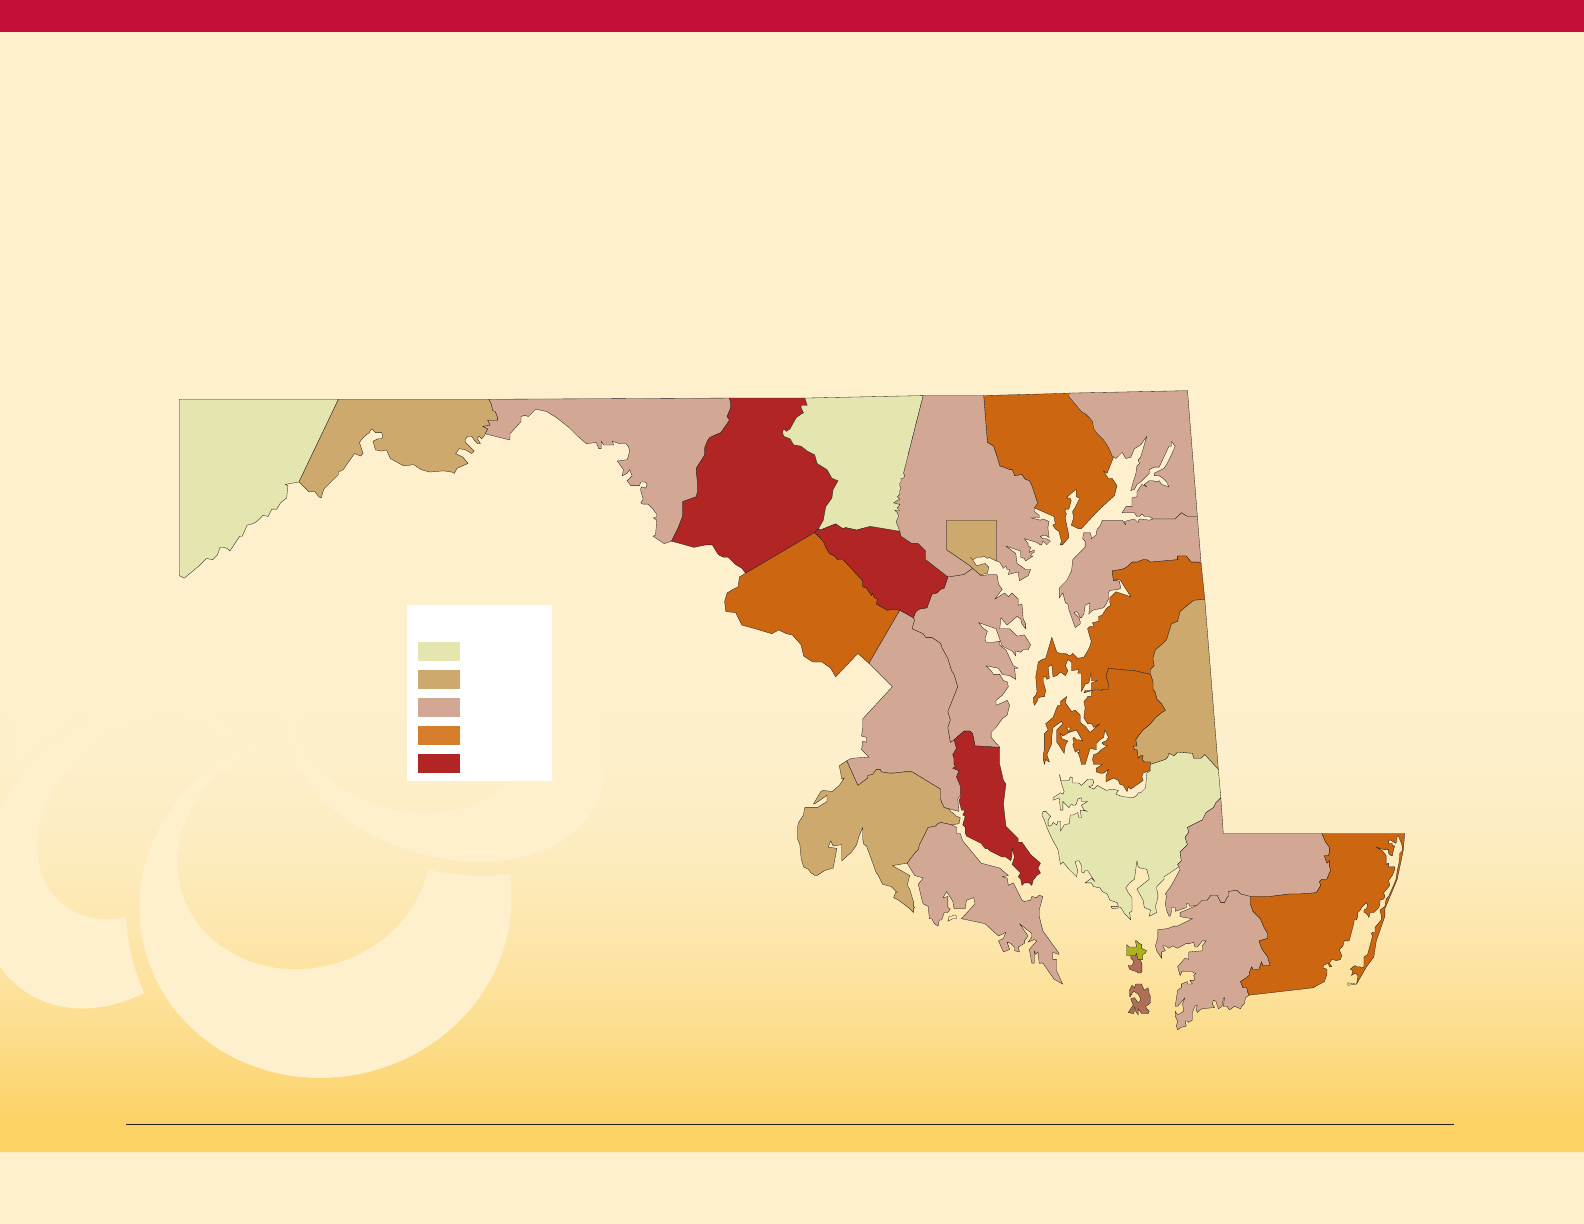
Geographic Distribution of Diabetes
in Maryland
Adult prevalence of diagnosed diabetes is
mapped in Figure 3 on this page. As shown in
Figure 4 on this page, the jurisdictions with
prevalence rates of adults with diagnosed
diabetes that exceed the Maryland Statewide
rate are Dorchester, Allegany, Prince George’s,
Garrett, Washington, Somerset, and Caroline
Counties and Baltimore City.
13
These high rates
of diabetes are seen in jurisdictions with high
minority populations (Baltimore City, Prince
George’s County) and in certain rural
jurisdictions in Western and Southern
Maryland and on the Eastern Shore. Notably,
all three jurisdictions in Western Maryland are
among the six highest prevalence rates.
There are several reasons for the high
diabetes prevalence rates in rural jurisdictions.
Many rural residents experience risk factors
for diabetes and may lack access to services
to prevent diabetes or manage their diabetes.
Rural residents, as well as the urban poor,
experience barriers to adequate physical
activity and healthy eating.
14
Additional
challenges revolve around access to health
care, including resource shortages of
physicians and providers located in rural
areas. Workforce shortages in rural areas
may decrease provider referral to National
DPP, Diabetes Self-Management Education
and Support (DSMES) programs, Chronic
Disease Self-Management programs and
nutrition programs, as well as the availability
of these programs. Other challenges include
limited access to transportation to travel to
appointments with primary care or specialty
care providers.
Map of Age-Adjusted Adult Prevalence of Diagnosed
Diabetes by Jurisdictions, Maryland, 2015-2017 (BRFSS)
Figure 3
13
Maryland BRFSS, 2015-2017.
14
O'Connor A and Wellinius G. Rural-urban disparities in the prevalence of diabetes and coronary heart disease. Public Health. October 2015, vol. 126: 813-820
Garrett
Allegany
Washington
Frederick
Carroll
Montgomery
Prince
Georges
Charles
St. Mary’s
Calvert
Anne
Arundel
Harford
Cecil
Kent
Queen
Anne’s
Caroline
Talbot
Dorchester
Wicomico
Worchester
Somerset
Baltimore
County
Howard
Balt.
City
Age-adjusted Adult Prevalence of Diagnosed Diabetes
by Jurisdiction, Maryland 2015-17 (BRFSS)
Figure 4
% with diagnosed diabetes
Dorch
Alleg
Prince G
B City
Garrett
Wash
Somer
St. Mary
Caroline
Maryland
Anne A
Calvert
Balt Co
Charles
Harford
Worc
Wico
Cecil
Fred
Talbot
Kent
Queen A
Howard
Mont
Carroll
15%
20%
10%
5%
0%
15%
13%
12%12%12%
11% 11% 11%
10%
10%
10%
9% 9% 9% 9% 9% 9% 9%
8% 8% 8%
7% 7% 7%
6%
Maryland Diabetes Action Plan 2020
≤ 8.27%
≤ 9.13%
≤ 9.5%
≤ 11.53%
≤ 15.13%
Legend
9
The range of adult diabetes prevalence rates
becomes even greater when rates by race
and jurisdiction are examined, as shown in
Figure 5. The Non-Hispanic White rate in
Dorchester County is particularly high at 14
percent, with other Non-Hispanic White rates
ranging from 5 percent to 12 percent. The Black
rates start at a low of about 11 percent in
Howard and Montgomery counties and rise
to a high of 20 percent and 24 percent in
Dorchester and Talbot counties respectively
(among the jurisdicitons where the
Non-Hispanic Black rate is reportable).
Of note, Dorchester County has the highest
Non-Hispanic White rate, and the second
highest Non-Hispanic Black rate.
These data indicate that diagnosed diabetes is
common in Maryland, and that the burden of
diabetes prevalence varies by race and place.
The consequences of diabetes for Maryland are
presented below.
How Serious are the Consequences of Diabetes for Maryland?
Diabetes is the sixth leading cause of death
in Maryland; in 2018, 2.8 percent of all deaths
in the State were due to diabetes.
15
Diabetes
is also a risk factor for heart disease (leading
cause of death in Maryland) and stroke (third
leading cause of death in Maryland), and so
contributes to even more deaths in Maryland
than those specifically attributed to diabetes
on death certificates.
16
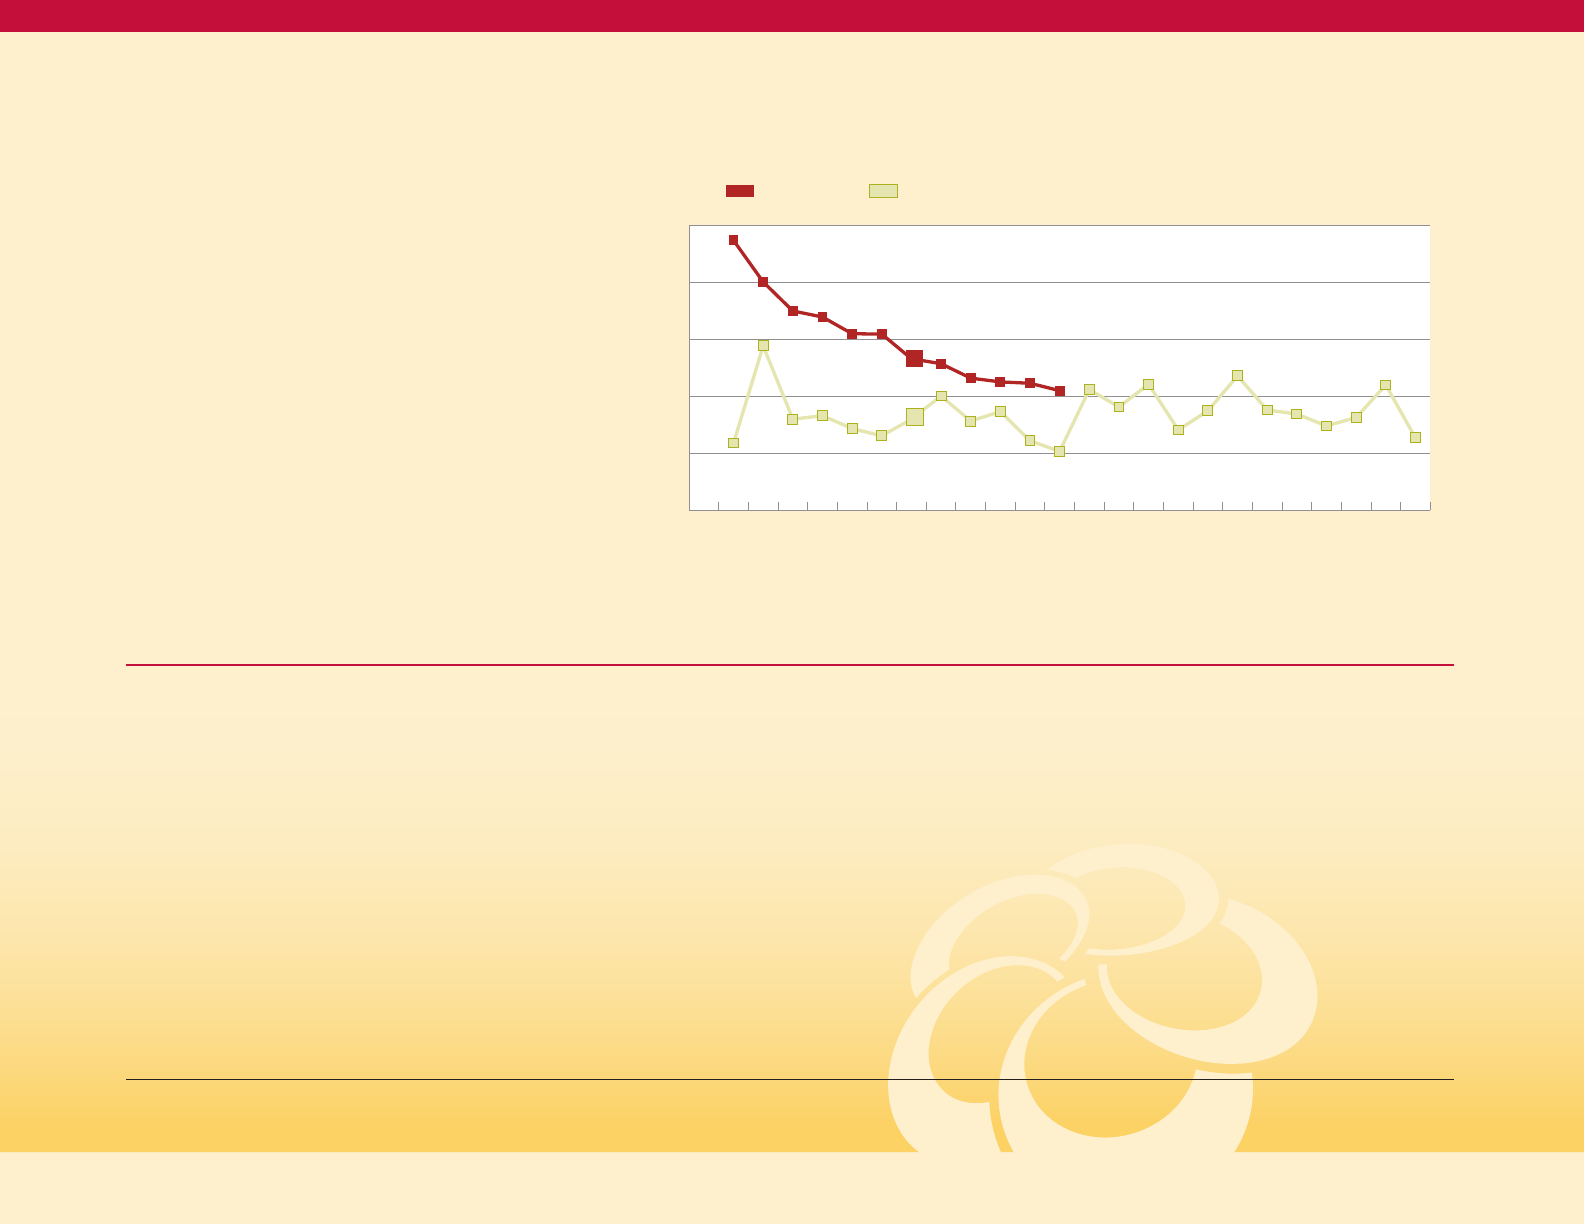
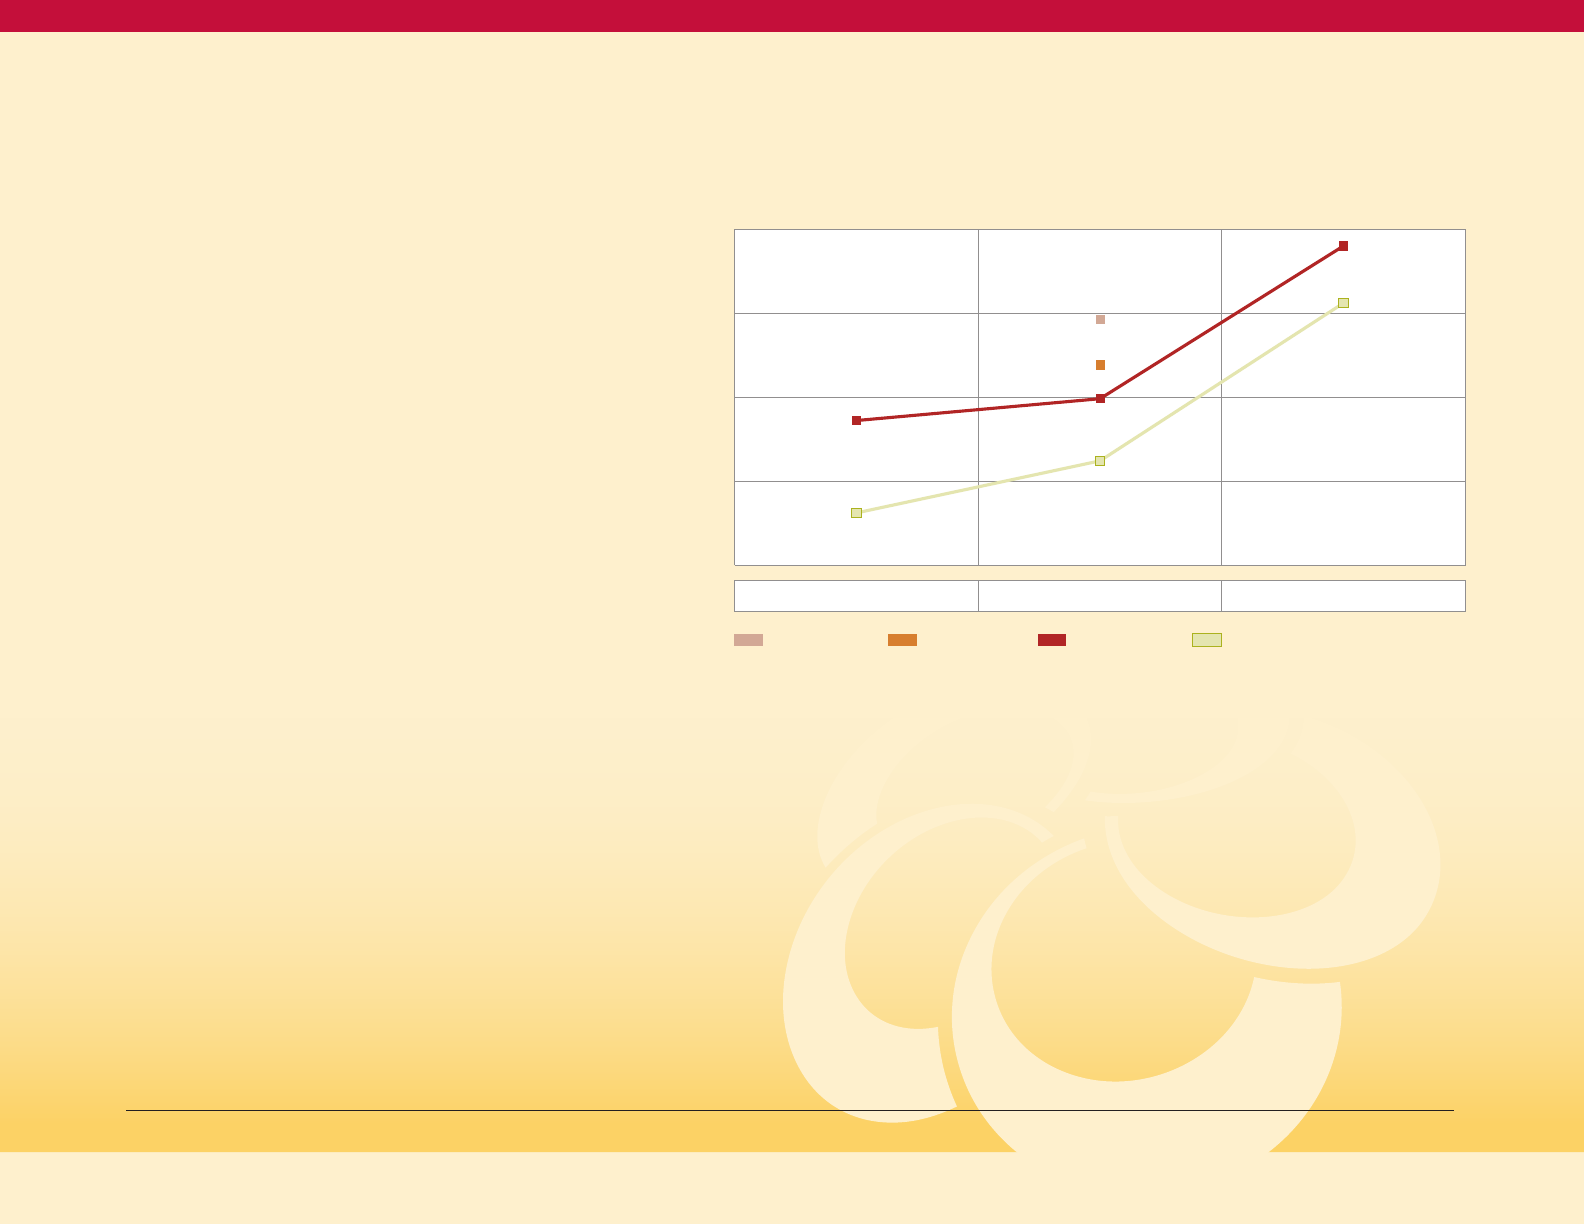
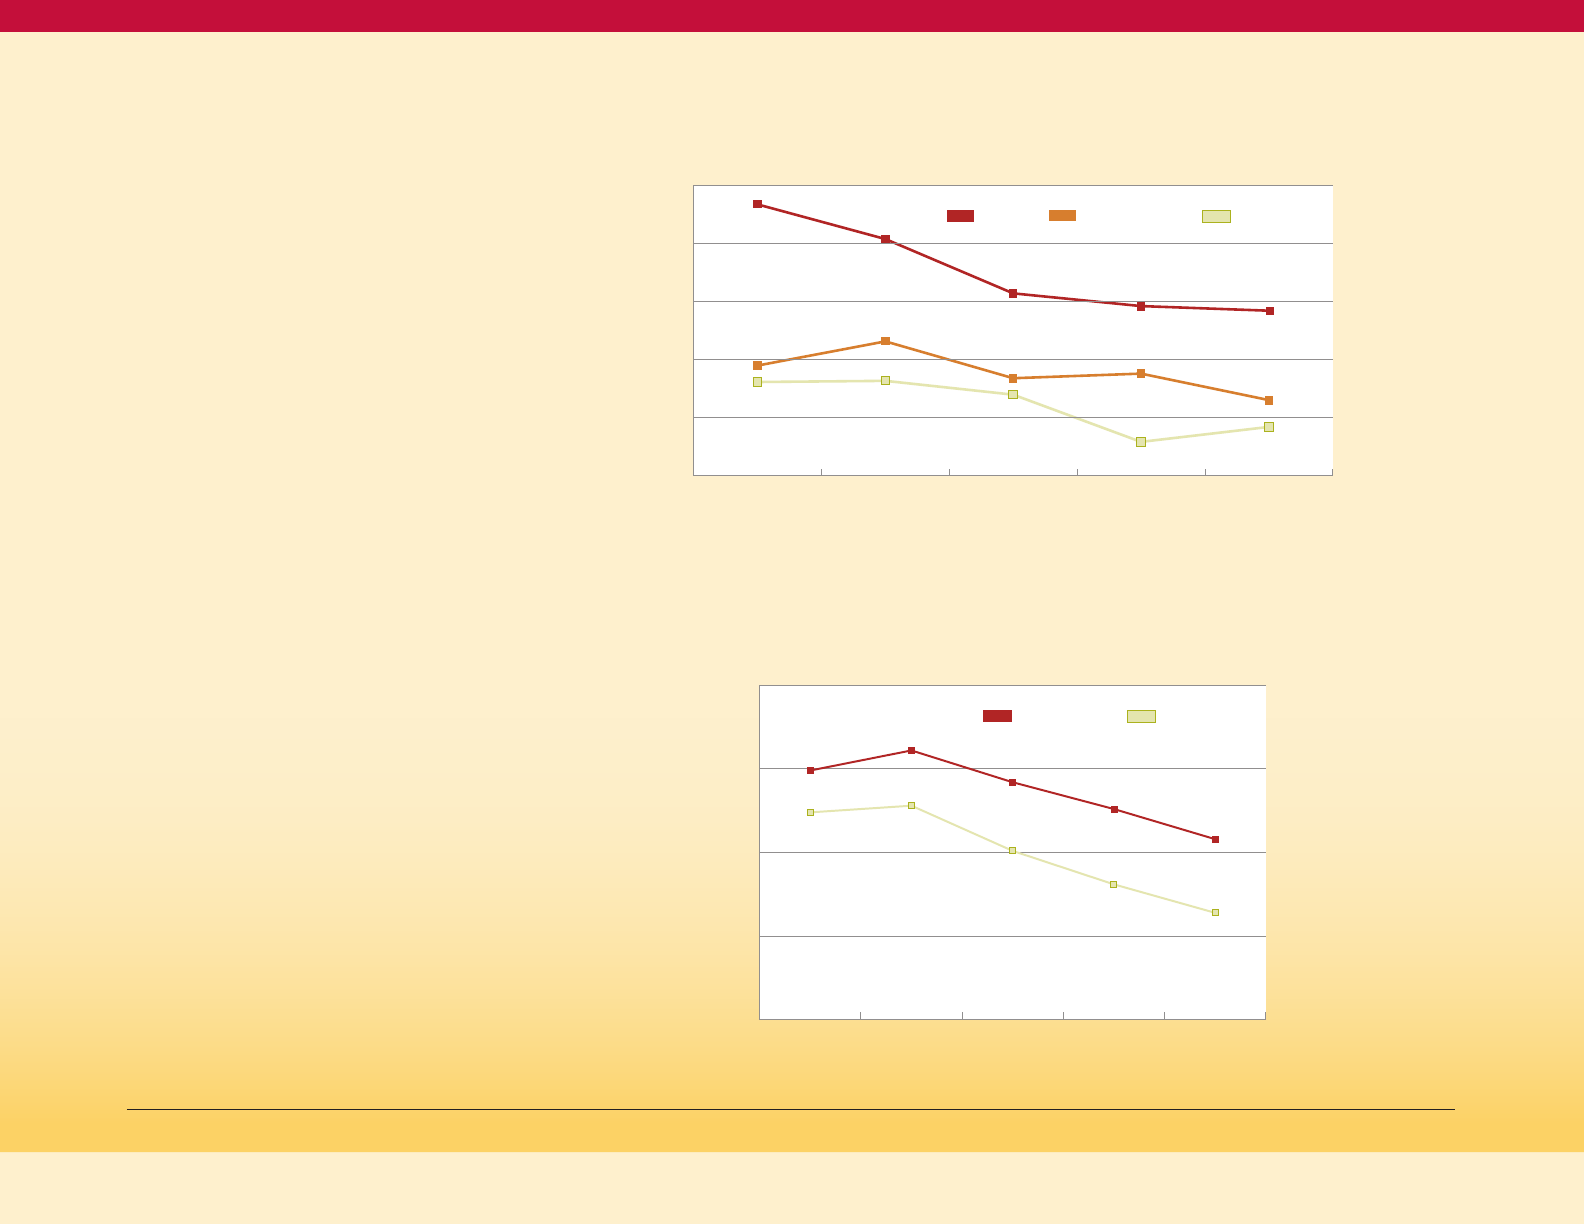
Figure 6 on the next page shows that the
age-adjusted diabetes mortality rate in
Maryland declined from 20.7 in 2009 to a
recent low of 18.3 in 2015, but then rose to 19.6
per 100,000 people in 2018. This increase from
2015 to 2018 occurred mostly in the NH Black
population and less so in the NH White
population. Consistent with the greater burden
of diabetes prevalence in the Black community,
the diabetes mortality rate for Blacks is about
twice as high as the mortality rate for Whites.
17
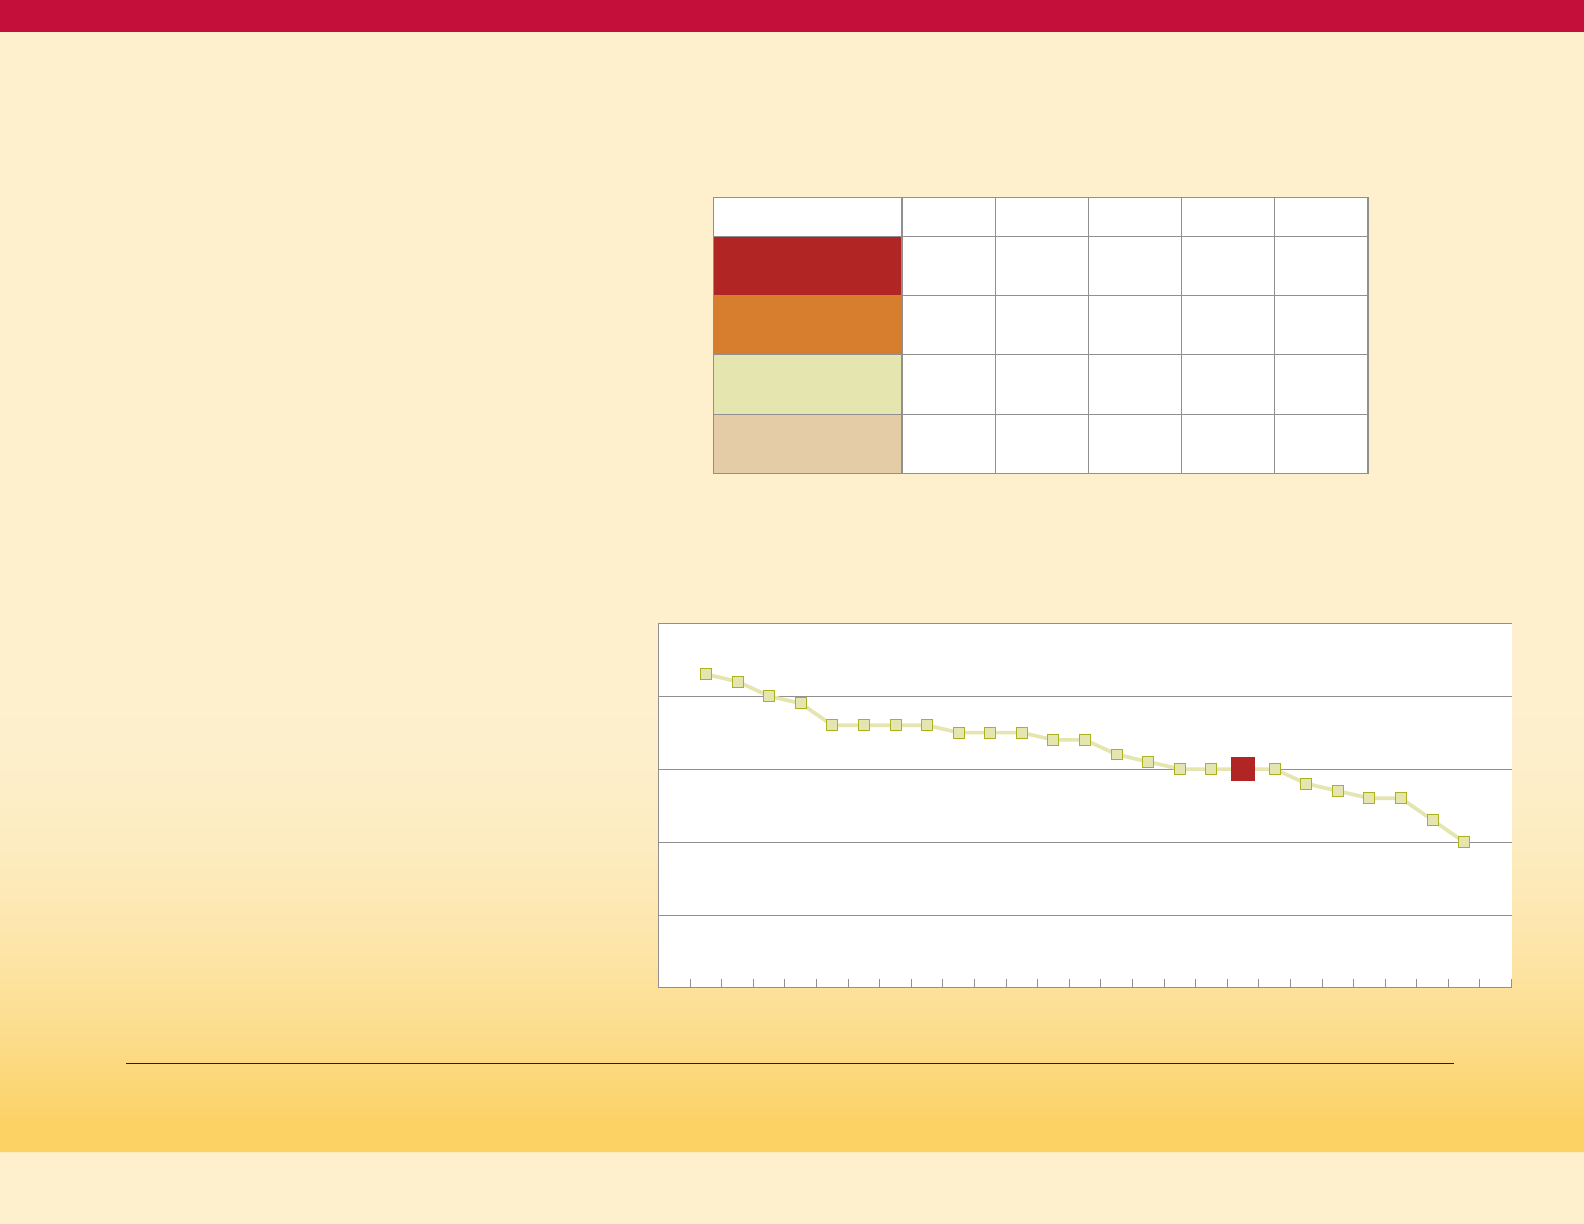
Comparing Maryland to the United States
(Figure 7), death rates were essentially
identical in 2009. From 2009 to 2015, Maryland
improved more rapidly than the US. However,
after 2015, the rising Black diabetes death
rate in Maryland has resulted in the overall
Maryland rate converging toward the
national rate.
18
15
Maryland Vital Statistics Annual report (2018): //health.maryland.gov/vsa/Documents/Reports%20and%20Data/Annual%20Reports/2018annual_rev3.pdf
16
Centers for Disease Control and Prevention. National Diabetes Statistics Report, 2017. Atlanta, GA: Centers for Disease Control and Prevention
17
Id fn 15
18
Id fn 15
Age-adjusted Adult Prevalence of Diagnosed Diabetes
by Race and Jurisdiction, Maryland 2015-17 (BRFSS)
Figure 5
% with diagnosed diabetes
15%
25%
10%
5%
0%
20%
Talbot
Dorch
Fred
Anne A
Wico
B City
Maryland
Prince G
Charles
Balt Co
Howard
Mont
Alleg
Calvert
Caroline
Carroll
Cecil
Garrett
Harford
Kent
Queen A
St. Mary
Wash
Worc
Diabetes as a Cause of Death
Maryland Diabetes Action Plan 2020
6%
8%
14%
8%
7%
7%
8%
10%
8%
7%
6%
5%
11%
9%
11%
7%
9%
12%
9%
8%
7%
8%
11%
6%
24%
20%
18%
17%
16%
15%
13%
13%
12%
11%
11%
11%
NH WhiteNH Black
Complications of Diabetes
Diabetes causes a variety of serious
complications related to its effects on large
and small blood vessels. Diabetes promotes
atherosclerosis, the process where
cholesterol builds up in the larger blood
vessels. This increases the risk of heart disease,
heart attacks, strokes, and peripheral vascular
disease (blocked arteries in the arms and legs).
The effects of diabetes on small blood vessels
leads to eye disease, blindness, kidney disease,
end-stage kidney failure that requires
transplant or dialysis, and nerve disease.
19
The combination of nerve disease and
vascular disease in the legs results in
amputations caused by diabetes.
10
19
Centers for Disease Control and Prevention. National Diabetes Statistics Report, 2017. Atlanta, GA: Centers for Disease Control and Prevention
Maryland Diabetes Action Plan 2020
Age-Adjusted Death Rate for Diabetes, by
Race/Ethnicity, Maryland 2009-2018
Figure 6
Rate per 100,000 population
40
35
30
25
20
15
10
5
0
Non-Hispanic Black
All Races
Non-Hispanic White
Hispanic
2009 2010 2011 2012 2013 2014 2015 2016 2017 2018
NH Black 34.5 35.9 34.3 31.2 32.2 33.7 28.2 31.7 33.8 32.4
All Races 20.7 19.8 20.8 19.1 19.0 19.6 18.3 19.6 20.3 19.6
NH White 17.5 15.5 17.4 16.1 15.5 16.4 16.0 16.1 16.3 16.4
Hispanic - - - 15.8 11.3 10.3 8.6 16.4 12.3 7.3
Source: Maryland Vital Statistics Annual report (2018)
Age-adjusted Death Rate for Diabetes, Maryland
and the United States, 2009-2018
Figure 7
Rate per 100,000 population
MD
US
25
20
0
15
10
5
2009 2010 2011 2012 2013 2014 2015 2016 2017 2018
US 21.0 20.8 21.6 21.2 21.2 20.9 21.3 21.0 21.5 -
MD 20.7 19.8 20.8 19.1 19.0 19.6 18.3 19.6 20.3 19.6

11
PQI 93 Discharge Frequency and Rate
per 1000 Adult Marylanders
Table 2
2013 2014 2015 2016 2017 2018
PQI 93
Discharges
10,494 10,511 10,045 9,539 10,484 11,571
Discharges
per 1000
adults
2.34 2.34 2.24 2.13 2.34 2.58
Utilization Rates and Costs for Diabetes
Diabetes-related hospital discharges
in Maryland
In 2018, a total of 11,738 hospital discharges
(inpatient and observation stays greater than
or equal to 24 hours) were reported with
diabetes as the primary diagnosis among
Maryland adults aged 18 years or older. This is
equivalent to 2.5 hospital discharges per 1,000
Maryland adults.
20,21
In Table 1, the numerator is discharges with
diabetes-related primary diagnosis code at
Maryland hospitals among adults with
valid Maryland zip codes, denominator is
adult Maryland population based on
5-year American Community Survey. 2017
denominator is used for 2018 (as 2018 data
was not available at the time of this report).
Diabetes-related Prevention Quality
Indicators (PQIs)
PQIs reflect admissions for ambulatory-
care sensitive conditions that could have
been prevented with access to high-quality
outpatient care. The Agency for Healthcare
Research and Quality has specified four
individual PQIs for diabetes and
one composite:
22,23
• PQI 01 Diabetes Short-Term Complications
Admission Rate (primary diagnosis code of
diabetes with: ketoacidosis, hyperosmolarity,
or coma)
• PQI 03 Diabetes Long-Term Complications
Admission Rate (primary diagnosis code
of diabetes with: renal, eye, neurological,
circulatory, or complications not
otherwise specified)
• PQI 14 Uncontrolled Diabetes Admission
Rate (primary diagnosis code of diabetes
without mention of short-term or long-term
complications)
• PQI 16 Lower-Extremity Amputation among
Patients with Diabetes Rate (any-listed
diagnosis of diabetes and any-listed
procedure of lower-extremity amputation)
• PQI 93 Diabetes Composite (includes any of
the four above PQIs)
As indicated in the table below, the number
of Diabetes PQIs in Maryland and the rate
of Diabetes PQIs per 1000 adults have
fluctuated over time but have generally
increased since 2013.
24
Diabetes-related Hospital Discharge Count
and Rate per 1000 Adult Marylanders
Table 1
2013 2014 2015 2016 2017 2018
Discharges
10,676 10,689 10,357 10,823 11,735 11,738
Discharges
per 1000
adults
2.38 2.35 2.26 2.35 2.52 2.53
20
Trends between the ICD9 period (2013-2015) and ICD 10 period (2016-2018) should be treated with caution due to ICD transition. For this section, diabetes refers to Type 1 and Type 2 diabetes.
21
MATCH, Health Service Cost Review Commission (HSCRC), Maryland Hospital Discharges and Ambulatory Care Data.
22
https://www.healthypeople.gov/2020/topics-objectives
23
Many, but not all, discharges with a primary diagnosis of diabetes are included in the PQI counts. For example, Marylanders younger than 18 and those transferred from another institution are not
included in the PQI counts
24
MATCH, Health Service Cost Review Commission (HSCRC), Maryland Hospital Discharges and Ambulatory Care Data.
Maryland Diabetes Action Plan 2020
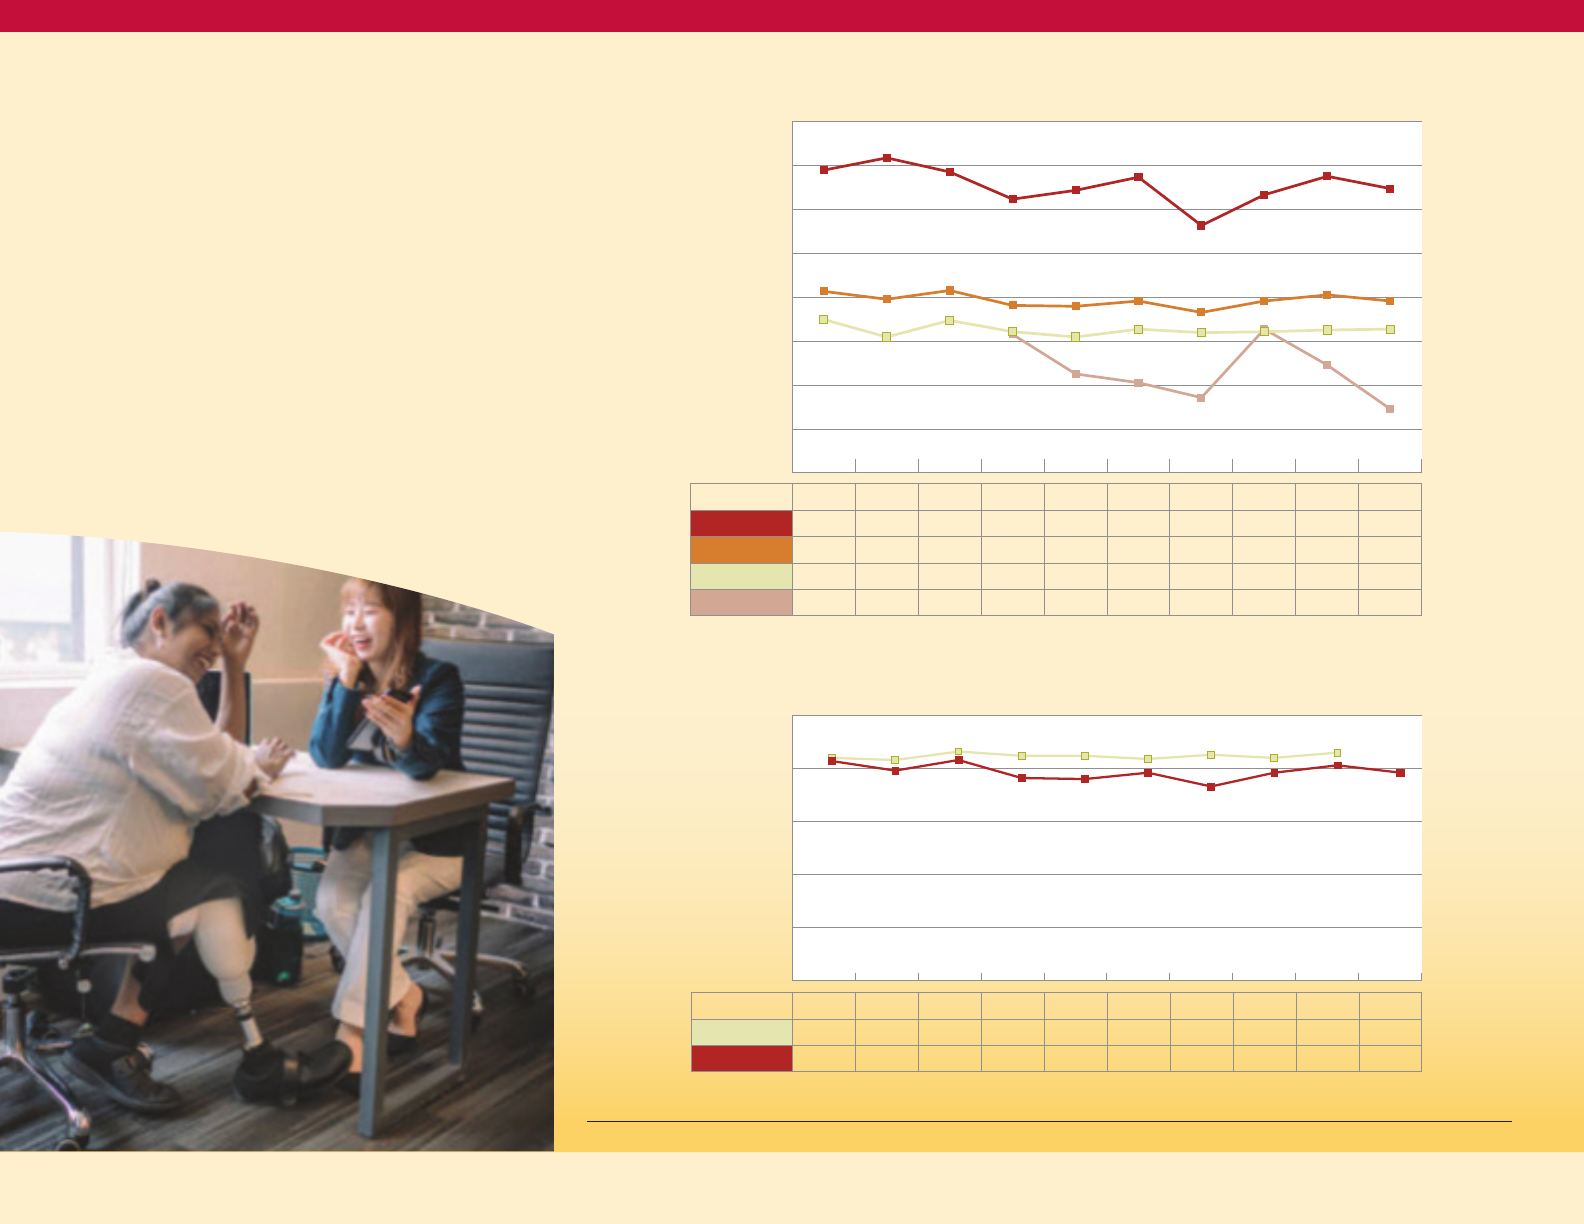
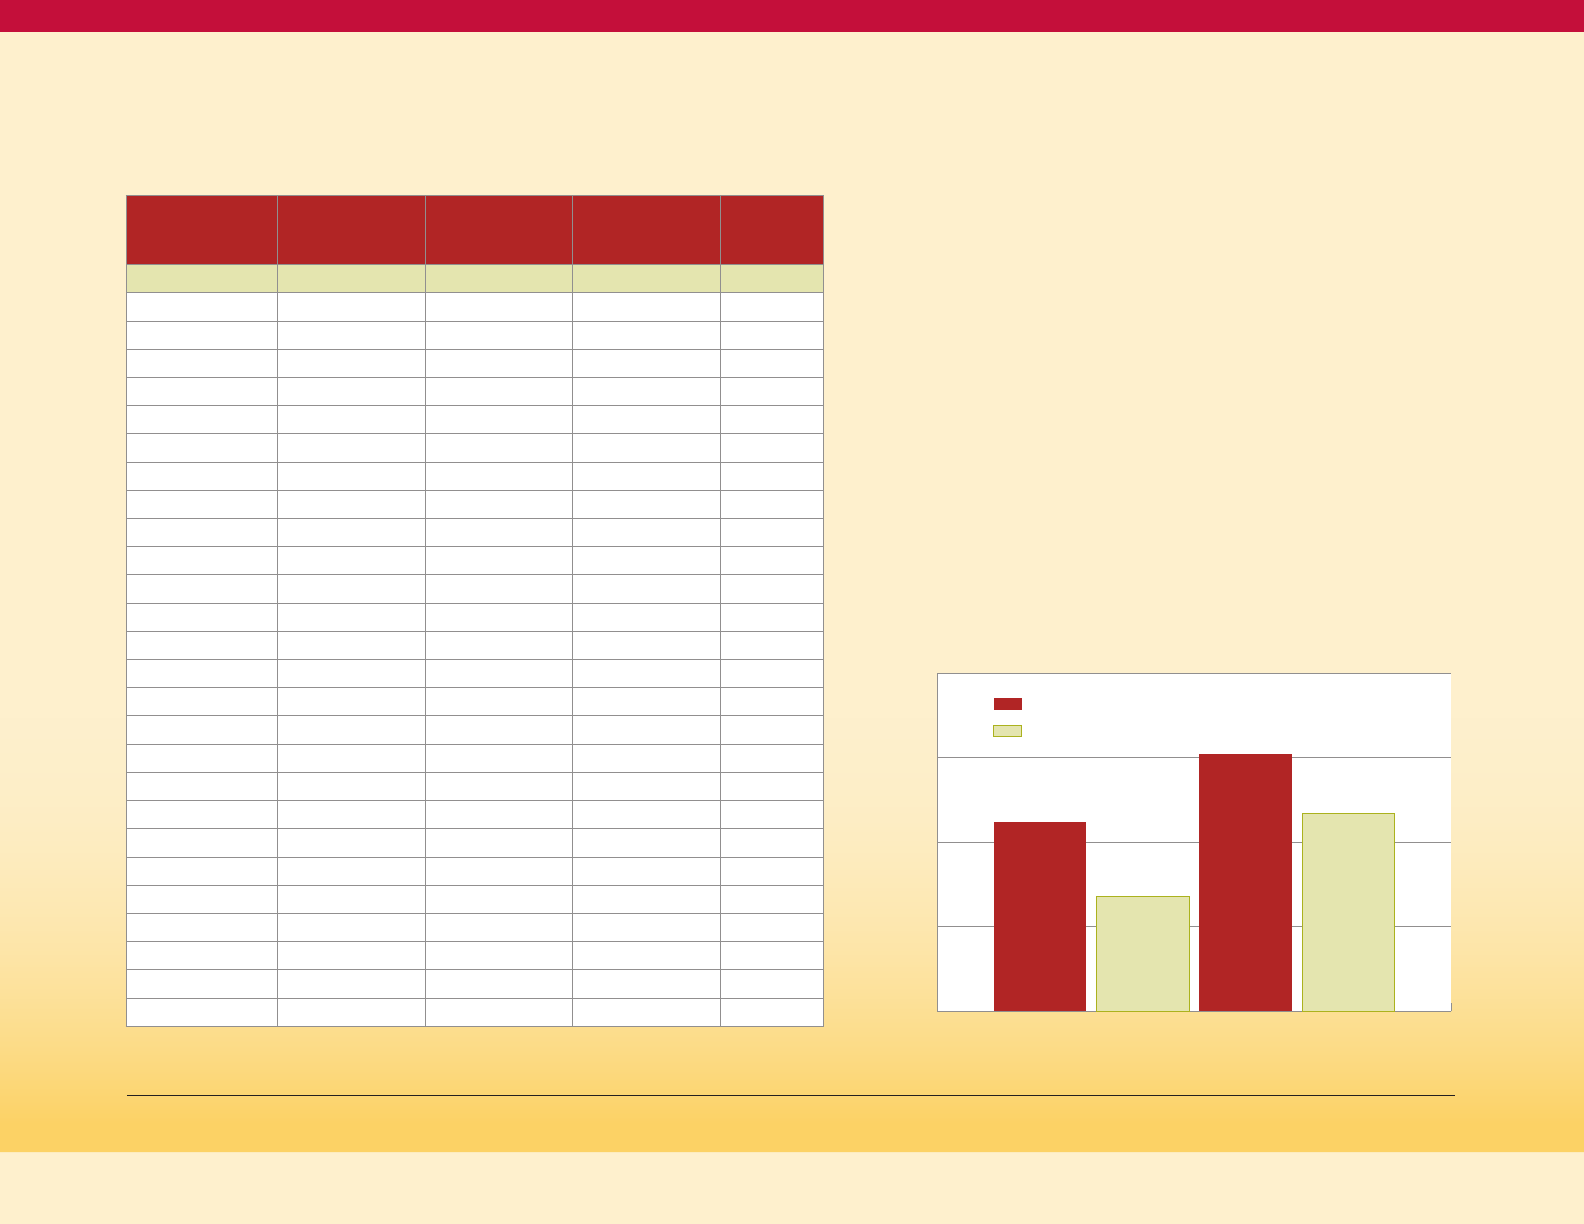
12
The disease burden of diabetes also reflects
a healthcare disparity by race (see Figure 8).
Black Marylanders experience a higher rate
of diabetes-related avoidable hospitalizations
compared to white Marylanders, with 434
people having diabetes-related avoidable
hospitalizations for every 100,000 Black
Marylanders (or 4.34 per 1000) compared to
170 for every 100,000 White Marylanders
(or 1.7 per 1000) in 2017.
25
This means that the
black rate is 2.6 times as high as the White
rate, and that 62 percent of Black discharges
are excess (would not occur if Black rate was
the same as White rate).
Diabetes Inpatient Hospital Charges
In 2017, Maryland hospitals charged
approximately $197 million for diabetes-related
hospital stays for Marylanders, compared to
$150 million dollars in 2013, an increase of more
than 30 percent. This estimate includes
Maryland residents of all ages with a primary
diagnosis of diabetes or a diabetes-related
complication (such as lower-extremity
amputation). The estimate excludes patients
seen in the Emergency Department (ED)
and released without an inpatient stay.
26
Diabetes Emergency Department Visits
In 2017, there were a total number of 121,301
ED visits related to Diabetes.
27
This indicates a
rate of 20.23 visits per 1,000 Marylanders.
25
Id fn 24.
26
MATCH, Health Service Cost Review Commission (HSCRC), Maryland Hospital Discharges and Ambulatory Care Data.
27
Defined based on CCS categories among all patients at Maryland hospitals.
Table 3
Diabetes-related ED Visit Count and
Rate per 1,000 Population
2013 2014 2015 2016 2017
Number of
ED visits
122,439 123,875 124,928 124,420 121,301
Population
5,834,299 5,887,776 5,930,538 5,959,902 5,996,079
Visit Rate
per 1,000
20.99 21.04 21.07 20.88 20.23
Maryland Diabetes Action Plan 2020
Figure 8
Diabetes Composite (PQI 93) per 100,000
Population Aged 18+ in Maryland
PQI 93 per 100k adults
500
400
300
200
100
0
2013 2014 2015 2016 2017
Black
466 402 424 406 434
Total
234 234 224 213 234
White
152 146 156 155 170

13
Utilization Differences for Medicaid Enrollees
with Diabetes vs. Without Diabetes
To further demonstrate the individual and
societal costs of diabetes, the data below shows
that compared to Medicaid enrollees without a
diagnosis of diabetes, those with diabetes
• Are 2.4 times as likely to have an
inpatient admission
• Have four times as many admissions
per enrollee
• Are 1.3 times as likely to have an ED visit
• Have 1.7 times as many ED visits per enrollee
• Are 1.1 times as likely to have an
ambulatory visit
• Have 2.3 times as many ambulatory visits
per enrollee
• Have 3.1 times the level of average
fee-for-service payment, and
• Have 2.5 time the level of average
MCO payment.
Cost Burden of Diabetes in Maryland
Diabetes and prediabetes cost an estimated
$7.01 billion in Maryland each year.
29
Serious
complications of diabetes include heart
disease, stroke, amputation, end-stage
kidney disease, blindness, and death.
People with diabetes have medical expenses
approximately 2.3 times higher than those who
do not have diabetes.
30
Total direct medical
expenses for diagnosed and undiagnosed
diabetes, prediabetes and gestational
diabetes in Maryland was estimated at
$4.92 billion in 2017. In addition, another $2.09
billion was spent on indirect costs from lost
productivity due to diabetes.
31,32
28
Maryland Department of Health, Health Care Financing/Medicaid, data provided September 2019.
29
Diabetes Care Volume 41, December 2018, https://care.diabetesjournals.org/content/diacare/41/12/2526.full.pdf
30
Diabetes Care. January 01 2019; volume 42 issue Supplement 1.
31
Id fn 29
32
The Hilltop Institute. (2016, May 20).Briefing Report: An Examination of Service Utilization and Expenditures among Adults with Diabetes Enrolled in Maryland’s Medicaid Managed Care Program.
Baltimore, MD: UMBC. Retrieved from: https://www.medchi.org/Portals/18/files/pdfs/Hilltop%20Briefing%20Report_Medicaid%20Diabetes%20Analysis_Final_5-20-16.pdf?ver=2016-10-27-143345-240.
Admission, ED Visit, and Ambulatory Visit Prevalence and Rates;
and Average Payments Comparing Medicaid Enrollees with and
without Diabetes, Maryland, 2017
28
Table 4
Calendar Year 2017
Medicaid Enrollees
with Diabetes
Medicaid Enrollees
without Diabetes
Ratio: Diabetes
to No Diabetes
% with One or More
Inpatient Admissions
24.8% 10.3% 2.4
Average Admissions
per Enrollee
0.4 0.1 4.0
% with One or More
ED visits
42.7% 33.2% 1.3
Average ED visits
per Enrollee
1.2 0.7 1.7
% with One or More
Ambulatory Visits
93.4% 87.0% 1.1
Average Ambulatory
Visits per Enrollee
11.8 5.1 2.3
Average Fee-for-Service
Payment
$12,334 $3,961 3.1
Average MCO Payment
$9,794 $3,909 2.5
Maryland Diabetes Action Plan 2020

14
33
Id fn 32
34
The average Medicaid expenditure does not adjust for participants for the length of enrollment in Medicaid (i.e., the costs for the one cohort could be higher because the cohort is enrolled for longer
periods in Medicaid and has more opportunity to receive services). The PMPM method adjusts for length of Medicaid enrollment.
35
The Hilltop Institute (2019, August 29). Analyses of Medicaid Expenditure Data for the Diabetes Action Plan, 2013-2017. Baltimore, MD: UMBC.
36
Kick payments are supplemental funds that the Department pays to managed care organizations (MCOs) outside of their regular capitation payments to better target resources for a specific set of
services or having a certain condition. For example, MCOs currently receive kick payments for the birth event and for beneficiaries receiving Hepatitis C treatment.
Medicaid Costs of Diabetes in Maryland
People with diabetes cost the State's Medicaid
program twice as much as those without the
chronic condition, a study commissioned by
MedChi, the Maryland State Medical Society
has found.
33
No other insurance utilization data
was available at the time of plan completion.
In CY 2017, total expenditures for Medicaid
participants with diabetes amounted to nearly
$1.9 billion. Between CY 2013 and CY 2017, total
Medicaid per-member-per-month (PMPM)
expenditures for individuals with diabetes was
two to three times higher than users without
diabetes ($1,652 vs. $688 in CY 2017). Similar
to the PMPM expenditures, average Medicaid
expenditures among eligible individuals with
diabetes was two to three times higher than for
individuals without diabetes ($18,202 vs. $7,516
in CY 2017). For individuals with diabetes, the
average Medicaid PMPM expenditure reduced
from $1,746 to $1,652 among users between
CY 2013 and CY 2017. This reduction was due
to a lower average fee-for-service PMPM
expenditure among Medicaid beneficiaries
with diabetes (from $1,362 in CY 2013 to $1,119
in CY 2017) and lower average PMPM capitation
and kick payments for beneficiaries with
diabetes enrolled in the HealthChoice
managed care program (from $1,031 in CY
2013 to $926 in CY 2017).
34,35,36
Maryland Diabetes Action Plan 2020

15
Action Plan
Diabetes
Section II:
Determinants and Risk Factors for Diabetes: Opportunities for Intervention
Diabetes by Age and Sex
Diabetes is more common in older adults. In
Maryland, in 2015-17 combined, about 26
percent of men and 20.2 percent of women
aged 65 and older had been diagnosed with
diabetes compared to about 5 percent of
adults aged 35-44 (Figure 9).
37
Diabetes in
older adults has been linked to a reduction
in functional status, higher mortality, and
increased risk of institutionalization.
The increasing prevalence of diabetes with
advancing age is part of the natural history
of the disease, which means that these age
differences are not an “age disparity.” Obesity
is more common at older ages, which
increases insulin resistance, and reduction
of insulin secretion also occurs at older ages.
Age is not a modifiable factor but
understanding age effects is important
to evaluating other determinants and risk
Maryland BRFSS, 2015-17.
% with diagnosed diabetes
Figure 9
Adult Prevalence of Doctor-Diagnosed Diabetes,
by Age and Sex, Maryland 2015-17 (BRFSS)
Maryland Diabetes Action Plan 2020
Age Group 35-44 45-54 55-64 65+
25%
20%
15%
10%
5%
30%
Male
Female
5.5%
11.0%
19.4%
26.0%
5.1%
10.0%
15.9%
20.2%
0%

16
factors. Because of this strong age effect, the
remaining analyses will display age-adjusted
diabetes prevalence rates to disentangle the
effects of age from the effects of other
determinants and risk factors.
Gender is generally not considered to be a
risk factor for diabetes. In Figure 9, male and
female prevalence is essentially the same
below age 55. While there are somewhat
higher rates for males at ages 55 and older,
this does not mean that females should be
considered a “low risk” group.
This is confirmed by the equal incidence rates
(rate of new cases) between males and females
nationally shown inFigure 10on this page
(incidence rate data by sex is not available for
Maryland). (https://gis.cdc.gov/grasp/diabetes/
DiabetesAtlas.html#[DM1]).
Figure 10
Age-adjusted Adult Incidence Rate
of Diagnosed Diabetes, by Sex, U.S., 1980 to 2017
(National Health Interview Survey)
38
38
https://www.cdc.gov/nchs/nhis/shs/tables.htm
1980
1982
1984
1986
1988
1990
1992
1994
1996
1998
2000
2002
2004
2006
2008
2010
2012
2014
2016
8
10
6
4
2
0
rate per 1000 population
Male
Female
Maryland Diabetes Action Plan 2020
17
Maryland BRFSS, 2015-2017.
NIDDK, https://www.niddk.nih.gov/health-information/diabetes/overview/preventing-type-2-diabetes
Diabetes and Weight
In Maryland, as in the nation, the prevalence
of diabetes increases as weight classification
moves from healthy weight, through
overweight, and to obesity. As seen in Figure
11 on this page, in Maryland there is a small
step-up in diabetes prevalence between
healthy weight and overweight, and a larger
step-up in prevalence between overweight
and obesity. This relationship of prevalence to
weight status is similar for Non-Hispanic Blacks
and Non-Hispanic Whites.
In addition, Figure 11 shows that the higher
diabetes prevalence for minorities presented
earlier (Figure 2) persists within weight
categories, with Non-Hispanic Black diabetes
prevalence higher than Non-Hispanic White
in all weight categories, and Hispanic and Asian
prevalence higher at overweight (the only
category with reportable data for those
populations in this analysis).
39
This indicates
that the racial/ethnic disparity in diabetes
prevalence is not simply an issue of more
excess weight in minority populations,
although for some groups that contributes
to the disparity.
Higher BMI correlates with greater abdominal
fat, and abdominal fat increases insulin
resistance, which can produce high levels of
blood glucose.
40
Insulin is produced by the
pancreas and is the hormone that moves the
sugar out of the blood and into the cells. When
an individual has excess body fat, the body’s
cells become resistant to insulin, which is
why overweight and obesity are risk factors
for diabetes. The body’s response to
insulin-resistant cells increases insulin
production to the point that the pancreas
begins to fail to keep up with the insulin
demand. Failure to produce and/or utilize
enough insulin results in diabetes.
Figure 11
Age-adjusted Adult Prevalence of Doctor-Diagnosed
Diabetes, by Race/Ethnicity and Weight Status,
Maryland 2015-17 (BRFSS)
Healthy Weight Over Weight Obese
20%
15%
10%
5%
0%
% with diagnosed diabetes
Maryland Diabetes Action Plan 2020
3.1%
6.2%
15.6%
8.6%
9.9%
19.0%
11.90%
14.6%
NH WhiteNH BlackNH Asian Hispanic
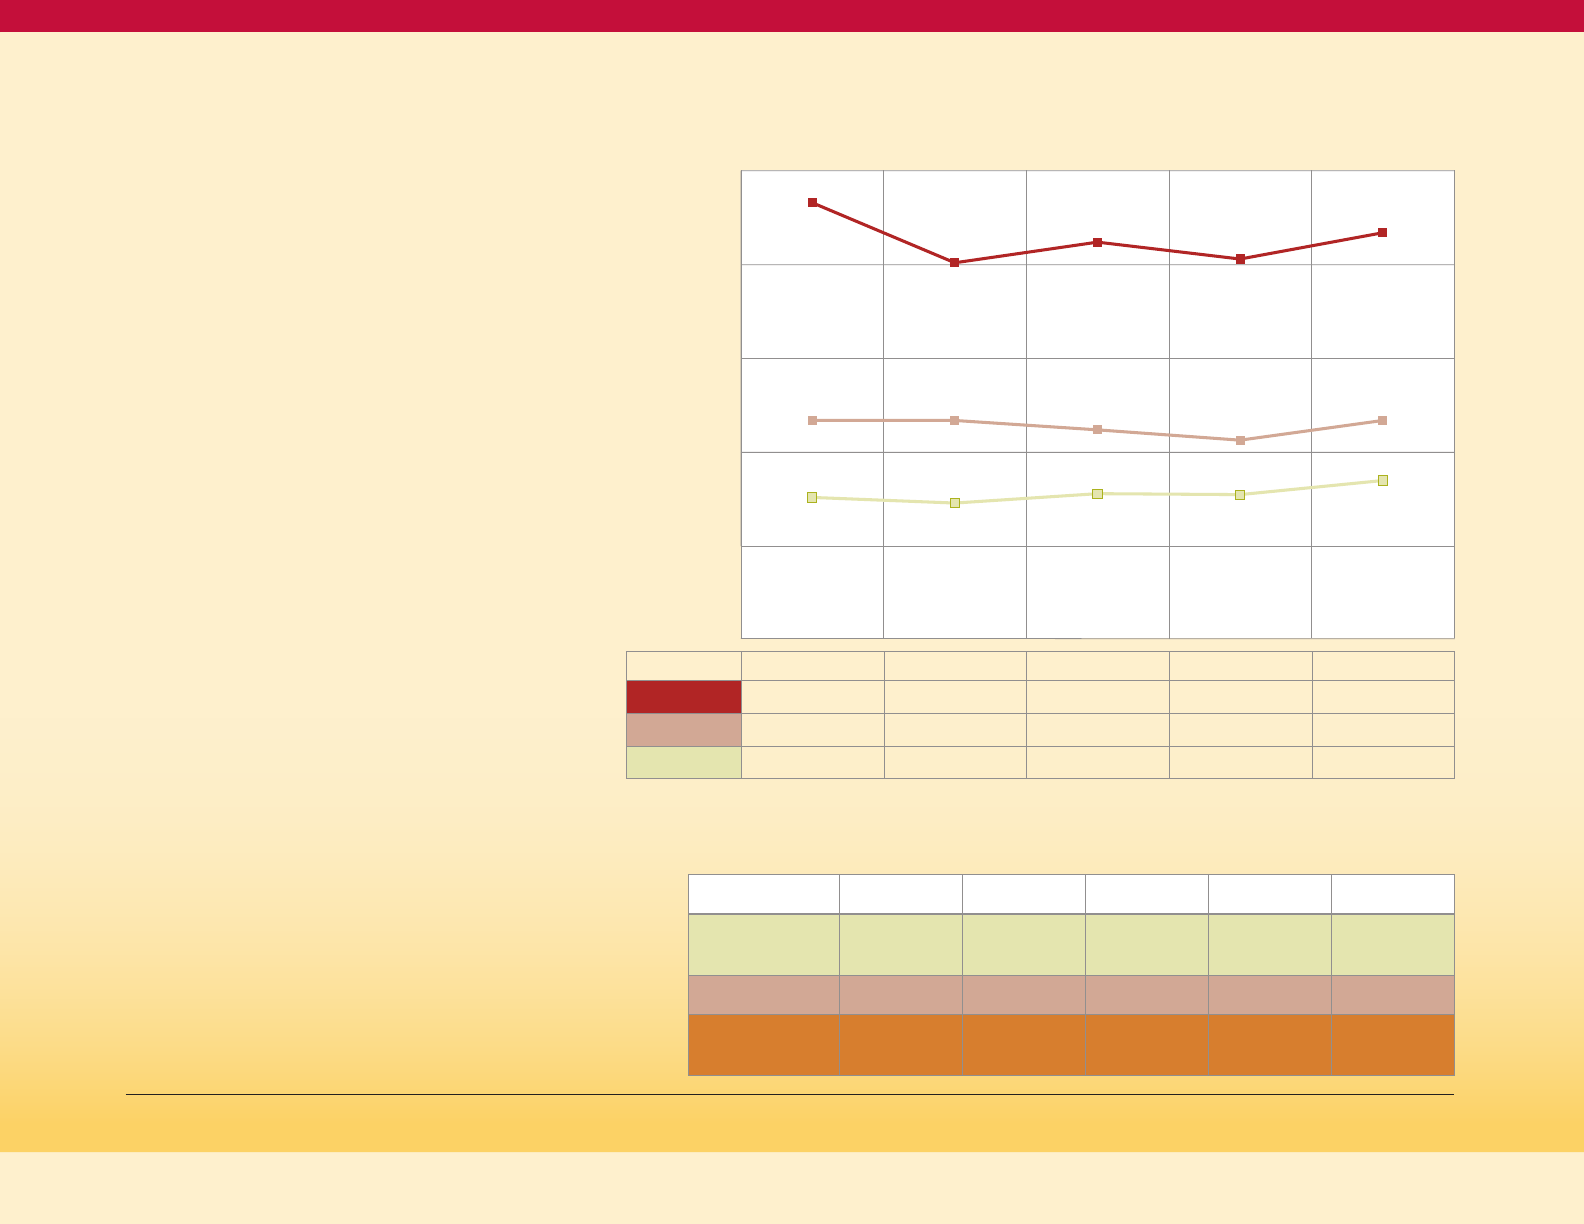
18
Adult Prevalence of Excess Weight
in Maryland
Based on data from 2017, in Maryland, 34.6
percent of the population is overweight, and
30.8 percent of the population is obese.
41
Five-year trend data shows that the proportion
of Marylanders who are obese is increasing,
and the proportion of Marylanders who are
overweight has been relatively stable. In
addition, the healthy weight population in
Maryland is decreasing from 35.1 percent in
2013 to 32.7 percent in 2017.
42
Figure 12 shows a wide range of obesity
prevalence rates by jurisdiction in Maryland,
ranging from a low of 20 percent in
Montgomery County to a high of 43 percent
in Caroline County. Several factors influence
the obesity prevalence rate in a jurisdiction,
including the racial and ethnic mix and the
socio-economic status of the population.
44
Maryland BRFSS, 2015-2017.
Maryland Behavioral Risk Factor Surveillance System (BRFSS), 2013-2017
Centers for Disease Control and Prevention, National Center for Chronic Disease Prevention and Health Promotion, Division of Population Health. BRFSS Prevalence & Trends Data.
https://www.cdc.gov/brfss/brfssprevalence/.
Maryland BRFSS, 2015-2017.
Adult Weight Classification by Body Mass
Index (BMI) Age-Adjusted Prevalence and
Trend, Maryland 2013-2017
43
Table 5
2013 2014 2015 2016 2017
Obese
27.6% 29.0% 28.2% 29.4% 30.8%
Overweight
35.5% 34.9% 35.7% 34.1% 34.6%
Healthy Weight
35.1% 34.5% 33.7% 34.8% 32.7%
Underweight
1.9% 1.6% 2.4% 1.8% 1.9%
Age-adjusted Adult Obesity Prevalence by
Jurisdiction, Maryland 2015-17 (BRFSS)
Figure 12
30%
50%
20%
10%
0%
40%
Caroline
Somer
Wash
Dorch
Garrett
St. Mary
Wort
Prince G
Charles
Wico
B City
Carroll
Alleg
Cecil
Calvert
Balt Co
Harford
Maryland
Kent
Anne A
Fred
Queen A
Talbot
Howard
Mont
% obese
43%
42%
40%
39%
36% 36% 36% 36%
35% 35% 35%
34% 34%
32%
31%
30% 30%
30%
30%
28%
27%
26% 26%
23%
20%
Maryland Diabetes Action Plan 2020

19
Maryland BRFSS, 2015-2017.
Overweight/Obesity in Women
of Childbearing Age
The prevalence of overweight and obesity
among women of childbearing age is of
particular interest since this will determine
the prevalence of pre-pregnancy diabetes
and the incidence of gestational diabetes
among pregnant women. Both conditions
increase the risk of adverse infant and
maternal outcomes.
Figure 13 on this page shows the weight
category distribution of women age 18-44 for
Non-Hispanic Whites and Non-Hispanic Blacks.
For Non-Hispanic Whites, a slight majority of
the women are in the healthy weight category
(50.9 percent) while for Non-Hispanic Blacks
the most prevalent weight category is obesity
(40.8 percent). Both racial groups have similar
prevalence of overweight, but very different
prevalence in the healthy weight and
obese categories.
45
Maryland Diabetes Action Plan 2020
% in the weight category
Figure 13
Weight Category Distribution of Women
of Childbearing Age, by Race Maryland 2015-17 (BRFSS)
Healthy Weight Over Weight Obese
50%
40%
30%
20%
60%
50.9%
32.2%
27.1%
26.1%
40.8%
23.1%
10%
0%
NH WhiteNH Black

20
Table 6 on this page shows the pre-pregnancy
BMI classification for pregnant women active
in the Women Infants and Children (WIC)
program Statewide and by jurisdiction.
Statewide, 36 percent have an obese BMI,
with a range of 29 percent in Montgomery
and Garrett counties to 46 percent in Talbot,
48 percent in Dorchester and 61 percent in
Somerset counties.
46
Maryland Women Infant and Children Program, communicated October 7, 2019.
Pre-pregnancy BMI of Active Pregnant Women
as of October 7, 2019, Maryland WIC Program
Table 6
County
Underweight
BMI < 18.5
Normal Weight
BMI 18.5-24.9
Overweight
BMI 25.0-29.9
Obese
BMI > 30.0
Allegany 4% 43% 21% 32%
Anne Arundel 2% 35% 26% 36%
Baltimore City 4% 31% 24% 40%
Baltimore County 4% 35% 25% 36%
Calvert 4% 35% 28% 33%
Caroline 1% 35% 28% 35%
Carroll 6% 38% 24% 32%
Cecil 5% 36% 23% 35%
Charles 6% 35% 27% 33%
Dorchester 2% 29% 21% 48%
Frederick 3% 37% 30% 30%
Garrett 8% 44% 19% 29%
Harford 7% 31% 26% 36%
Howard 1% 35% 34% 30%
Kent 5% 30% 24% 41%
Montgomery 3% 34% 34% 29%
Prince George's 3% 31% 31% 35%
Queen Anne's 0% 35% 29% 36%
Somerset 7% 20% 12% 61%
St. Mary's 3% 33% 22% 42%
Talbot 6% 12% 36% 46%
Washington 4% 35% 21% 39%
Wilcomico 3% 35% 23% 40%
Worcester 5% 32% 29% 34%
State 3% 33% 28% 36%
Total Pregnant Women = 10,015
Maryland Diabetes Action Plan 2020

21
Excess Weight among Children
Maryland does not have state-level data on
diabetes in children. The SEARCH for Diabetes
in Youth study is aimed at understanding more
about diabetes among children and young
adults in the United States; the incidences of
both type 1 and type 2 diabetes among youths
increased significantly in the 2002–2012 period,
particularly among youths of minority racial
and ethnic groups.
47
State level data on overweight and obesity
is available. In children and adolescents,
overweight and obesity are defined by
comparing weight for height (the Body Mass
Index or BMI) to a reference population that
precedes the recent rise in rates of childhood
obesity. Comparisons are made to the
corresponding age and sex of the child.
Underweight is falling below the 5th percentile
of that reference population, normal weight is
being 5th to below 84th percentile, overweight
but not obese is being 85th to below 95th
percentile, and obese is being 95th
percentile or above.
48
The Maryland Youth Risk Behavior Survey
(YRBS) is an on-site survey of Maryland
students in a sample of middle and high
school classrooms focusing on health-related
behaviors and tobacco-use prevalence. The
survey does not include elementary schools.
The survey is conducted every two years and is
self-reported. According to the 2016 Youth Risk
Behavior Survey, 26.4 percent of Maryland high
school students are overweight or obese.
49
The percentage of high school students
who are overweight and obese were 11.5
percentand 14.9 percent, respectively. Based
on this data, interventions and strategies to
address overweight and obesity must be
targeted to children and youth as well as
adults to prevent diabetes.
The Women Infant and Children (WIC)
program childhood participants (children 2
to 5 years of age, July–December 2018) have
their height and weight checked during
regular WIC visits. Table 7 shows that of these
children, 17 percent were at or above 95th
percentile BMI (obese), and 16 percent were
of 85th to below 95th percentile BMI
(overweight but not obese).
50
Incidence Trends of Type 1 and Type 2 Diabetes among Youths, 2002–2012. Elizabeth J. Mayer-Davis, Ph.D., Jean M. Lawrence, Sc.D., M.P.H., M.S.S.A., Dana Dabelea, M.D., Ph.D., Jasmin Divers, Ph.D., Scott
Isom, M.S., Lawrence Dolan, M.D, Giuseppina Imperatore, M.D., Ph.D., Barbara Linder, M.D., Ph.D., Santica Marcovina, Ph.D., Sc.D., David J. Pettitt, M.D., Catherine Pihoker, M.D., Sharon Saydah, Ph.D., M.H.S.,
and Lynne Wagenknecht, Dr.P.H. et al., for the SEARCH for Diabetes in Youth Study*. https://www.searchfordiabetes.org.
https://www.cdc.gov/obesity/childhood/defining.html.
Maryland Department of Health, Youth Behavior Risk Survey, 2016. https://phpa.health.maryland.gov/ccdpc/Reports/Pages/yrbs.aspx
Id fn 46
Maryland Diabetes Action Plan 2020
22
Id fn 51
National Physical Activity Guidelines;
https://www.cdc.gov/physicalactivity/index.html
Maryland BRFSS 2011-2013.
Prevalence of Weight Classes Among
Children Participating in WIC in Maryland
(by Jurisdiction, July-December 2018; 40,935 Total Children)
51
Table 7
County
Underweight
BMI < 5th
Percentile
Healthy WT BMI
between 5th to
< 84th percentile
Overweight BMI
between 85th to
< 94th percentile
Obese
BMI ≥ 95th
percentile
Maryland 3% 63% 16% 17%
Allegany 3% 67% 17% 13%
Anne Arundel 3% 65% 17% 14%
Baltimore City 3% 70% 15% 12%
Baltimore County 3% 62% 17% 18%
Calvert 4% 62% 15% 20%
Caroline 3% 68% 15% 14%
Carroll 3% 58% 18% 21%
Cecil 1% 69% 15% 16%
Charles 5% 63% 18% 15%
Dorchester 3% 60% 18% 19%
Frederick 3% 62% 17% 18%
Garrett 5% 68% 15% 12%
Greater Baden 5% 62% 14% 18%
Harford 4% 69% 14% 13%
Howard 3% 64% 15% 17%
Johns Hopkins 3% 65% 14% 17%
Kent 4% 66% 16% 14%
Montgomery 2% 59% 18% 21%
Prince George's 4% 62% 15% 18%
Queen Anne's 1% 64% 13% 22%
Somerset 7% 63% 13% 17%
St. Mary's 3% 67% 17% 13%
Talbot 1% 66% 15% 18%
Washington 4% 62% 18% 16%
Wicomico 4% 64% 15% 17%
Worcester 2% 67% 14% 17%
Diabetes and Physical Activity
Sedentary Lifestyle
The Physical Activity Guidelines for Americans
encourages adults to move more and sit less.
Adults should get at least 150 minutes of
physical activity each week and children should
be active for at least 60 minutes a day (preschool
children should be moving throughout the day).
52
A sedentary lifestyle puts individuals at increased
risk for developing a variety of chronic health
conditions, including type 2 diabetes. Research
shows that an active lifestyle reduces the risk of
chronic health conditions like diabetes. The adult
prevalence of diagnosed diabetes is higher in
those who do not meet weekly physical activity
guidelines compared to those who do meet those
guidelines (Figure 14).
53
Crude Adult Prevalence of Diagnosed
Diabetes by Physical Activity Status and Race,
Maryland 2011-13 (BRFSS)
Figure 14
Met Not Met
20%
15%
10%
5%
0%
% with diagnosed diabetes
11.2%
6.8%
15.2%
11.7%
NH Black
NH White
recommended weekly physical activity
Maryland Diabetes Action Plan 2020
23
The pattern of lower diabetes prevalence
in persons getting more physical activity is
seen for both Non-Hispanic Whites and
Non-Hispanic Blacks.
With physical activity being a determinant
of diabetes risk, the distribution of physical
activity participation across the State is
important to program planning. In Maryland,
adults without diabetes were more likely
to participate in at least 150 minutes of
moderate physical activity each week
(51.9 percent) versus those with diabetes
(44.2 percent). Meeting the physical activity
recommendation is more common for
Non-Hispanic Whites and Blacks compared
with Hispanics.
54
The jurisdiction-specific
prevalence of meeting the 150 minute per
week physical activity recommendation is
mapped in Figure 15 below.
Maryland BRFSS 2017.
Garrett
Allegany
Washington
Frederick
Carroll
Montgomery
Prince
Georges
Charles
St. Mary’s
Calvert
Anne
Arundel
Harford
Cecil
Kent
Queen
Anne’s
Caroline
Talbot
Dorchester
Wicomico
Worchester
Somerset
Baltimore
County
Howard
Balt.
City
Age-adjusted Prevalence of 150 Minutes per Week of Physical Activity
(Maryland BRFSS 2017)
Figure 15
Maryland Diabetes Action Plan 2020
≤ 41.5%
≤ 46.8%
≤ 50.5%
≤ 53.5%
≤ 57.9%
Legend
24
https://www.cdc.gov/tobacco/campaign/tips/diseases/diabetes.html
https://www.cdc.gov/diabetes/library/features/smoking-and-diabetes.html
Maryland BRFSS, 2015-2017.
Maryland BRFSS, 2015-2017.
Maryland Quitline, FY2019, communicated October 9, 2019.
Smokers have a 30 percent to 40 percent
higher risk of developing diabetes compared
to non-smokers.
55
Studies have shown that
smoking can increase blood sugar levels and
decrease the body’s ability to use insulin.
People with diabetes who smoke need larger
doses of insulin to control their blood sugar
than those who do not smoke. Smoking
can increase the risk of certain diabetes
complications,
56
particularly the large blood
vessel effects related to atherosclerosis
(cholesterol deposits). These complications
are heart disease, heart attacks, stroke,
peripheral vascular disease, and amputations.
In Maryland, the adult prevalence of diagnosed
diabetes is higher in current and former
smokers than it is in non-smokers (Figure 17):
about 8.8 percent of non-smokers have
diagnosed diabetes, compared to 11.0 percent
and 10.3 percent of former and current
smokers, respectively.
57
Because smoking is a synergistic cause with
diabetes for large blood vessel complications
(heart attacks, strokes, leg artery blockage and
amputations), smoking is an important risk
factor to target among persons with diabetes.
In 2017, 17.9 percent of Maryland adults with
diabetes were current smokers, compared to
the 13.9 percent proportion of current smokers
among adults without diabetes (Figure 18).
58
The Maryland Department of Health manages
the MD Quitline, a free service for Maryland
residents 13 years and older to help quit
tobacco use. The MD Quitline tracks
information about smokers with diabetes.
In fiscal year 2019, approximately, 1,500 of
Quitline participants reported being told
by a provider they have prediabetes, 160
participants reported type 1 diabetes and
1,000 participants reported type 2 diabetes.
In fiscal year 2019, the Quitline was used by
a total of 8,155 phone participants and 1,340
web participants.
59
Diabetes and Tobacco
Figure 16
Age-adjusted Adult Prevalence of
Diagnosed Diabetes by Smoking Status,
Maryland 2015-17 (BRFSS)
12%
10%
8%
6%
4%
Never
Smoker
Former
Smoker
Current
Smoker
All
2%
0%
8.77%
11.00%
10.27%
9.67%
Figure 17
Age-adjusted Adult Prevalence of Current Smoking,
by Diabetes Status, Maryland 2017 (BRFSS)
30%
25%
0%
20%
15%
10%
5%
Doctor Diagnosed Diabetes (excl. women told only during pregnancy)
Doctor Diagnosed Diabetes No Diabetes
Percentage who are current smokers
Maryland Diabetes Action Plan 2020
17.9%
13.9%

25
“The Economic Burden of Elevated Blood Glucose Levels in 2012,” Diabetes Care, December 2014, vol. 37.
Centers for Disease Control and Prevention. National diabetes fact sheet: National estimates and general information on diabetes and prediabetes in the United States, 2011. Atlanta, GA: U.S. Department
of Health and Human Services, Centers for Disease Control and Prevention, 2011.
American Dental Association, https://www.mouthhealthy.org/en/az-topics/d/diabetes
National Institute of Diabetes and Digestive and Kidney Diseases, https://www.niddk.nih.gov/health-information/diabetes/overview/preventing-problems/gum-disease-dental-problems
Preshaw PM, Alba AL, Herrera D, et al. Periodontitis and diabetes: a two-way relationship. Diabetologia. 2012; 55(1):21–31. doi:10.1007/s00125-011-2342-y.
Diabetes and Oral Health
Diabetes impacts almost every part of the
body and can result in many complications,
including the increased likelihood of oral
health complications. The American Dental
Association has identified periodontal disease
as the most common dental disease affecting
those living with diabetes, affecting nearly 22
percent of those diagnosed. This is especially
true with increasing age. Poor blood sugar
control increases the risk for gum problems.
People with diabetes are twice as likely to
develop periodontitis and periodontitis can
also elevate blood sugar levels.
60
Periodontal disease is more common in people
with diabetes, so people with diabetes need
to be especially diligent about getting regular
dental examinations.
61
According to the CDC,
diabetes can increase the risk of periodontitis
for the following groups:
• Among young adults, those with diabetes
have about twice the risk of developing
periodontitis as those without diabetes.
• Adults ages 45 or older with poorly
controlled diabetes (A1C >9 percent)
are 2.9 times more likely to have severe
periodontitis than those without diabetes.
• People who smoke and have persistently
elevated glucose levels have a 4.6 times
greater risk for developing periodontitis.
62
Elevated glucose levels in the mouth can also
cause pain, infection and associated problems
in the mouth, potentially affecting the teeth,
gums, jaw, and tissues such as the tongue, the
roof and bottom of the mouth, and the inside
of the cheeks. When diabetes is not controlled,
high glucose levels in saliva help harmful
bacteria grow. These bacteria combine with
food to form plaque. Plaque can cause a variety
of oral diseases ranging from gum disease
and bad breath to bone loss, and tooth decay
or cavities. Gum disease can be more severe
and take longer to heal if you have diabetes.
In-turn, having gum disease can make your
glucose hard to control.
63
Research continues
to show that bi-directional relationship
between periodontal disease and diabetes.
People with diabetes have a higher prevalence
of periodontal disease and those with
untreated periodontal disease have challenges
with glycemic control.
64
Maryland Diabetes Action Plan 2020
26
Maryland BRFSS, 2015-2017.
Maryland BRFSS, 2015-2017.
The prevalence of diabetes is strongly
determined by income. As seen in Figure 18
and Figure 19, prevalence of diagnosed
diabetes is higher for adults with income
below $15,000 compared to adults with
income at or above $75,000.
65
This gradient of higher diabetes prevalence
at lower levels of income is seen in all three
weight classifications (healthy weight,
overweight and obese). In addition, Figure
18 shows that for every level of income,
diabetes prevalence is higher for the obese
weight group. Income and weight status are
independentdeterminants (causes)
of diabetes.
This gradient of higher diabetes
prevalence at lower levels of income is also
seen in both Non-Hispanic Blacks and
Non-Hispanic Whites. In addition, Figure
19 shows that for every level of income,
Non-Hispanic Black diabetes prevalence is
higher than Non-Hispanic White diabetes
prevalence. This means that income does
not fully explain the disparity in diabetes
prevalence between Non-Hispanic Blacks
and Non-Hispanic Whites.
66
Diabetes and Income
Figure 18
Age-adjusted Prevalence of Doctor Diagnosed Diabetes,
By Income and BMI Status (Maryland BRFFS 2015-2017)
Figure 19
Age-adjusted Adult Prevalence of Doctor Diagnosed
Diabetes, by Income and Race, Maryland 2015-17 (BRFSS)
Maryland Diabetes Action Plan 2020
25%
20%
0%
15%
10%
5%
< 15K
15K to
<25K
25K to
<50K
50K to
<75K
>=75K
23.4%
20.4%
15.7%
14.6%
14.2%
9.5%
11.6%
8.4%
8.8%
6.5%
8.1%
8.2%
7.0%
2.9%
4.2%
Healthy
Over Weight
Obese
20%
0%
15%
10%
5%
< 15K
15K to
<25K
25K to
<50K
50K to
<75K
>=75K
14.9%
16.1%
14.2%
12.6%
10.8%
12.4%
12.8%
10.1%
8.1%
6.4%
NH WhiteNH Black
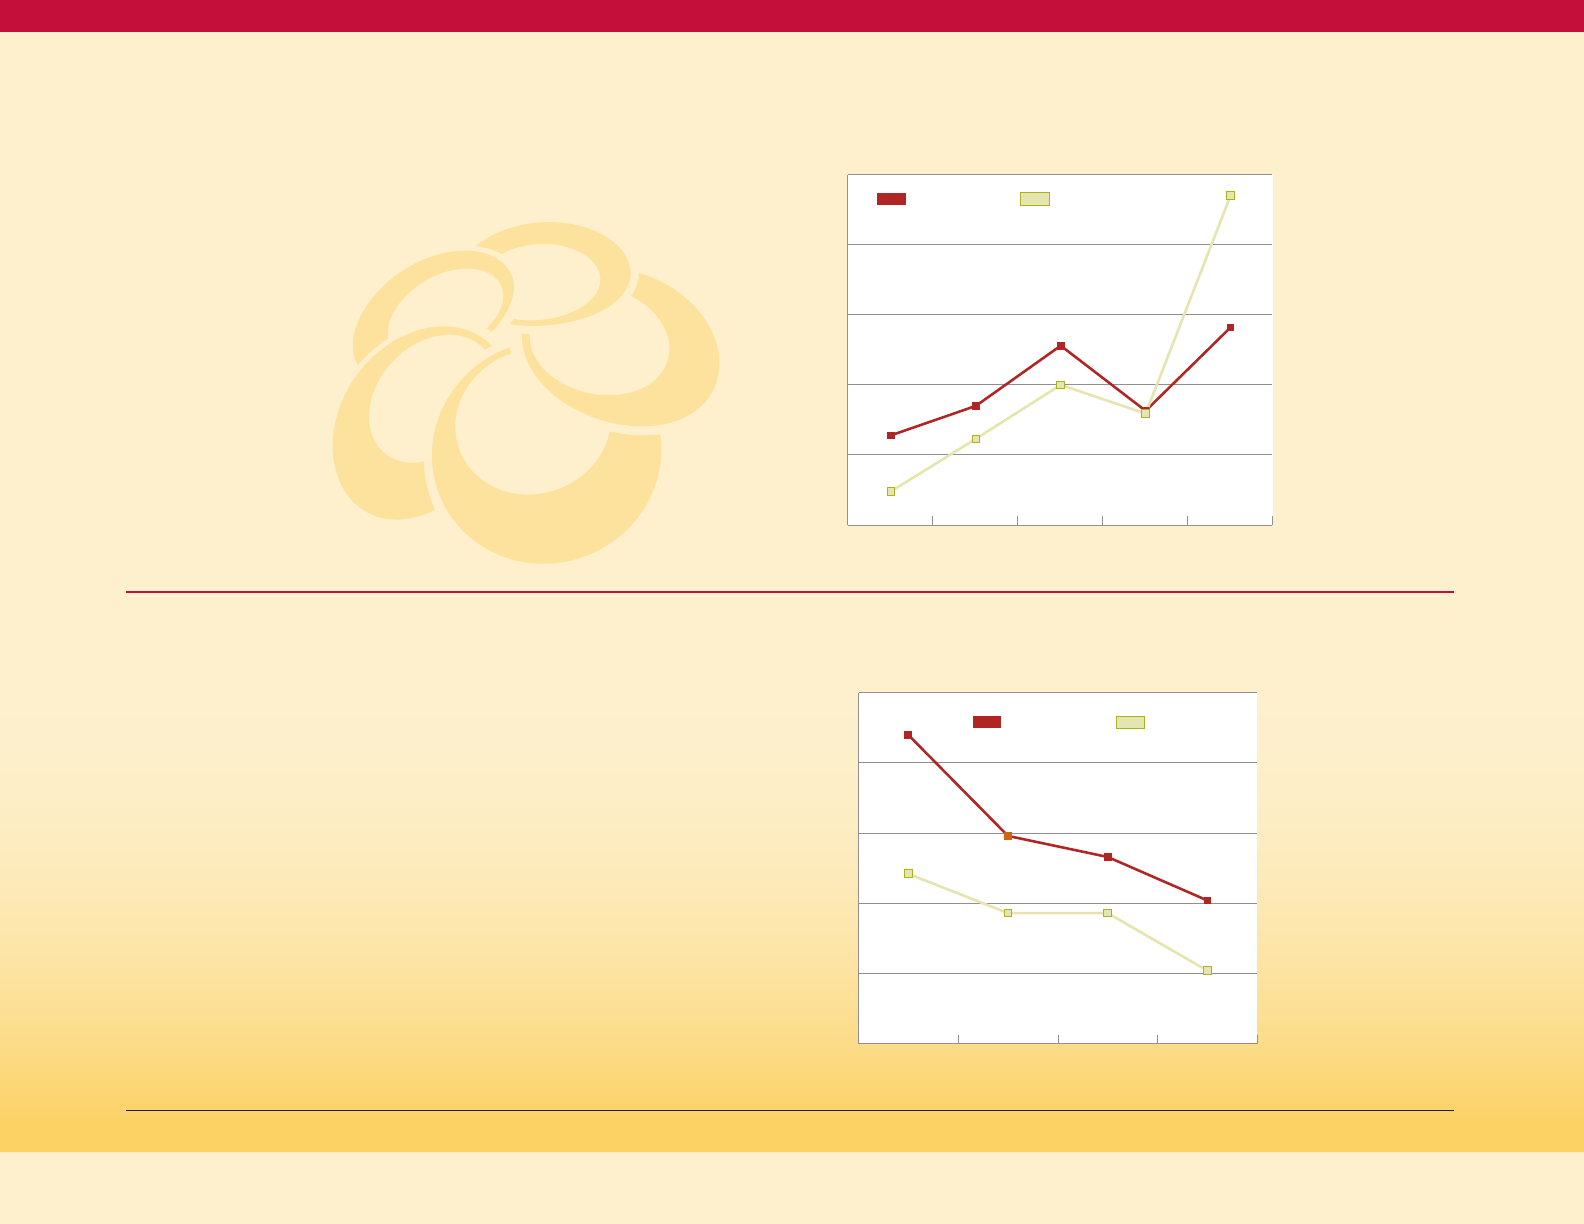
27
Maryland BRFSS, 2015-2017.
Maryland BRFSS, 2015-2017.
Figure 20
Distribution of Household Income by
Black or White Race, Maryland 2011-13 (BRFSS)
The prevalence of diabetes is strongly
determined by level of education. As seen
in Figure 21, adult prevalence of diagnosed
diabetes is more than twice as high for
persons with less than high school education
compared to persons with a college degree
or more education.
This gradient of higher diabetes prevalence
at lower levels of education is seen in both
Non-Hispanic Blacks and Non-Hispanic Whites.
In addition, Figure 21 shows for every level of
education, Non-Hispanic Black diabetes
prevalence is higher than Non-Hispanic
White diabetes prevalence. This means that
education does not fully explain the disparity
in diabetes prevalence between Non-Hispanic
Blacks and Non-Hispanic Whites.
68
Diabetes and Level of Education
While income does not fully explain the
disparity between Non-Hispanic Blacks and
Non-Hispanic Whites, it does contribute to the
disparity. Figure 20 shows that Non-Hispanic
Blacks are about half as likely (28 percent) to
have a household income at or above $75,000
compared to Non-Hispanic Whites (47
percent). Non-Hispanic Blacks have more
diabetes at every income level and are more
likely to be in the lower income categories
that have higher risk.
67
Figure 21
Age-adjusted Adult Prevalence of Diagnosed Diabetes, by
Education and Black or White Race, Maryland 2015-17 (BRFSS)
Maryland Diabetes Action Plan 2020
50%
30%
20%
10%
0%
40%
< 15K
15K to
<25K
25K to
<50K
50K to
<75K
>=75K
12.8%
17.0%
25.6%
16.3%
28.2%
47.0%
15.9%
20.0%
12.3%
4.8%
25%
15%
10%
5%
0%
20%
< HS or
GED
HS or
GED
Tech, or
< 4Yr College
4+ Years
College
22.0%
14.8%
13.3%
10.2%
12.1%
9.3% 9.3%
5.2%
NH WhiteNH Black
NH WhiteNH Black

28
Maryland BRFSS, 2011-2013.
U.S. Department of Health and Human Services, Office of Disease Prevention and Health Promotion. (2010). National Action Plan to Improve Health Literacy. Washington, DC.
Level of education does contribute to the
Black vs. White disparity in diabetes prevalence
since Non-Hispanic Whites are more likely than
Non-Hispanic Blacks to have four or more
years of college/graduate school education,
as shown in Figure 22. About 37 percent of
the Non-Hispanic White adult population
has a college degree, compared to only
about 25 percent of the Non-Hispanic
Black population.
69
In addition to Non-Hispanic Blacks having
higher diabetes prevalence at each level of
education, Non-Hispanic Blacks are more likely
to have the lower levels of education, which
have higher risk for diabetes.
Income and education are closely related to
each other, with higher educational attainment
being associated with higher income at the
population level.
Figure 22
Distribution of Education Level, for NH Black
and NH White Adults, Maryland 2011-13 (BRFSS)
The Office of Disease Prevention and Health
Promotion (ODPHP) of the US DHHS defines
health literacy as follows in its 2010 National
Action Plan to Improve Health Literacy:
"Health literacy is the degree to which
individuals have the capacity to obtain, process,
and understand basic health information and
services needed to make appropriate health
decisions. Limited health literacy affects
people of all ages, races, incomes, and
education levels, but the impact of limited
health literacy disproportionately affects lower
socioeconomic and minority groups. It affects
people’s ability to search for and use health
information, adopt healthy behaviors, and
act on important public health alerts. Limited
health literacy is also associated with worse
health outcomes and higher costs."
70
Limited health literacy has a variety of negative
impacts on health. The ODPHP plan describes
how limited health literacy reduces the use of
preventive services (mammograms, flu shots,
etc.), and impairs the management of chronic
conditions such as diabetes. Limited health
literacy is also associated with higher rates of
preventable hospital visits and admissions.
One example of a successful intervention to
address limited health literacy in diabetes
is the IDEALL (Improving Diabetes Efforts
Across Language and Literacy) Project at
San Francisco General Hospital. It found
that providing patients with weekly phone
calls via an automated telephone diabetes
management system is effective at addressing
the literacy and language needs of
high-risk diabetes patients and enhancing
self-management. Demonstrating
improvements in communication and
self-efficacy at a modest cost, especially among
low-literate and LEP populations, IDEALL
has proved to be an innovative approach to
transforming the health care delivery system.
Diabetes and Health Literacy
Maryland Diabetes Action Plan 2020
50%
30%
20%
10%
0%
40%
< HS or
GED
HS or
GED
Tech, or
< 4Yr College
4+ Years
College
13.2%
30.9%
30.8%
36.8%
8.6%
26.8%
27.9%
25.1%
NH WhiteNH Black
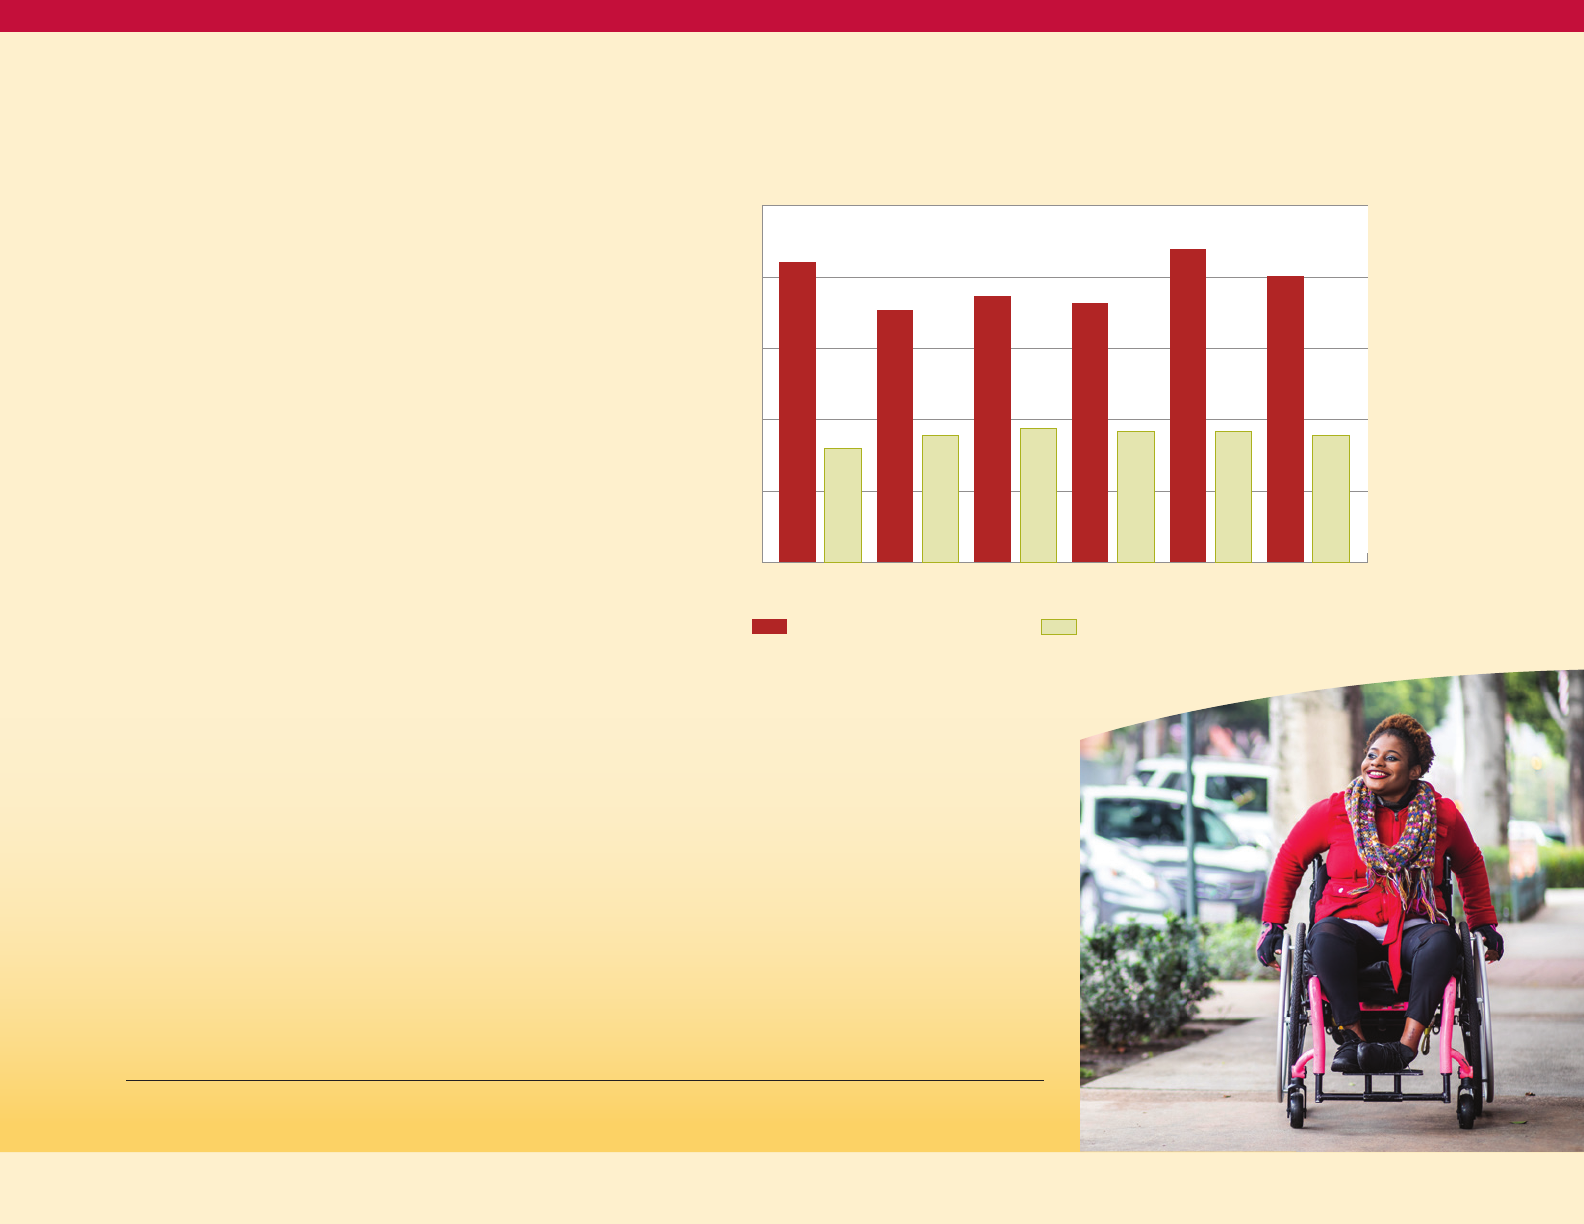
29
Diabetes and Disability
https://www.cdc.gov/ncbddd/disabilityandhealth/disability.html
https://www.cdc.gov/vitalsigns/disabilities/index.html.
Health and Human Services Data Collection Standards for Disability Status: http://aspe.hhs.gov/datacncl/standards/ACA/4302
Id fn 71
A disability is any condition or impairment
of the body or mind that makes it more
difficult for the person with the condition to
do certain activities and interact with the world
around them.
71
More than 21 million US adults
18–64 years of age have a disability. These
are adults with serious difficulty walking
or climbing stairs, hearing, seeing, or
concentrating, remembering, or making
decisions.
72,73
Disability and diabetes
are interrelated.
The adult prevalence of diagnosed diabetes
in Maryland is consistently about twice as
high among persons with mobility, cognitive,
hearing, vision, self-care, or independent living
disabilities compared to persons without those
disabilities (Figure 23). In some cases, disability
may cause the diabetes, as in the situations
where the disability limits physical activity and
thus increases the risk of overweight or obesity.
In other cases, the disability may be the result
of the diabetes, for example when diabetes
causes vision loss and produces vision
disability. It is also possible that in some cases,
a factor that causes both diabetes and a
disability will result in the two conditions
occurring together, even without a causal
relationship between the diabetes and the
disability in that case.
People with disability who have a diagnosis
of diabetes often have higher rates of
unemployment, absenteeism on the job,
and health care utilization, and lower income
levels and capabilities in personal care and
activities of daily living.
74
Maryland Diabetes Action Plan 2020
Figure 23
Age-adjusted Adult Prevalence of Doctor Diagnosed
Diabetes, By Presence or Absence of Selected Disabilities
(Maryland BRFSS 2015-2017)
25%
20%
15%
10%
5%
0%
21%
8%
18%
9%
19%
18%
22%
20%
9%
9% 9%
9%
Mobility
With Listed Disability
Without Listed Disability
Cognitive Hearing Vision Self-care Indep living
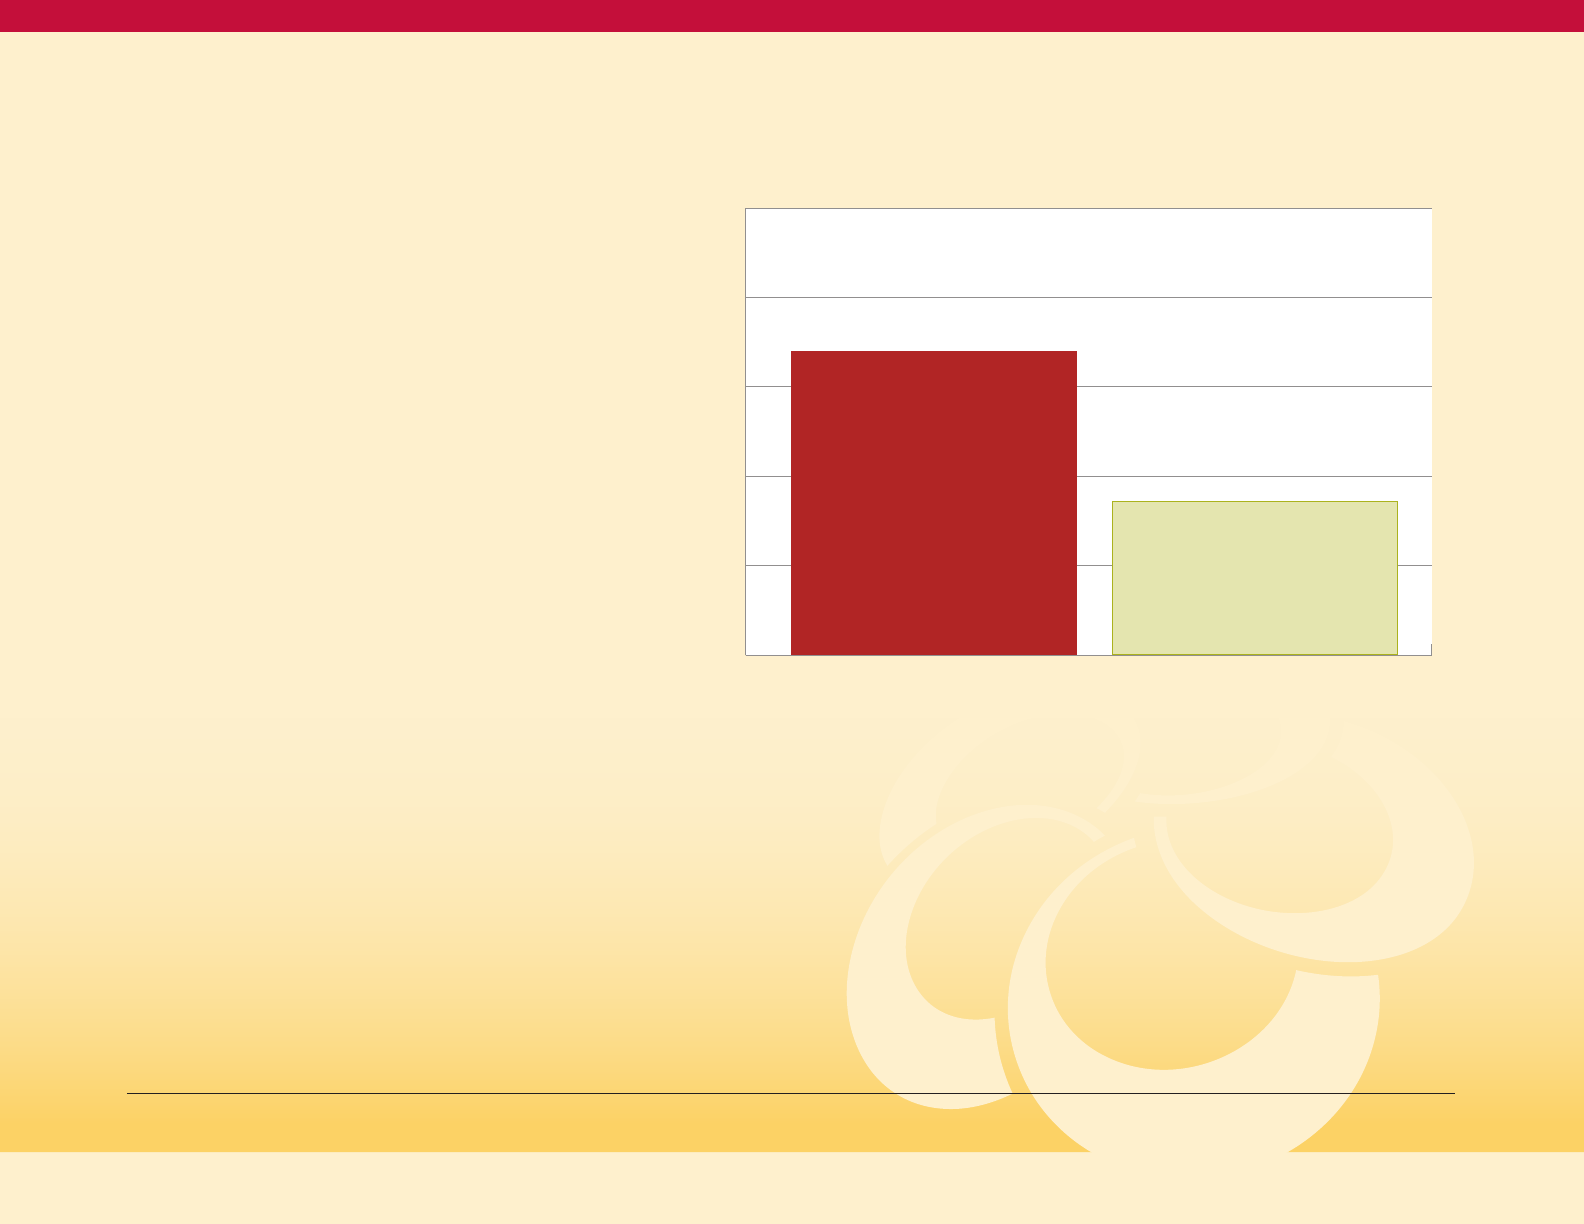
30
Diabetes and Mental Health
Research shows that people with diabetes
are at increased risk for diabetes distress,
which refers to the negative emotional and
psychosocial worries and burden individuals
with the diagnosis of diabetes experience.
Diabetes distress could manifest as depression,
anxiety disorders, eating disorders,
inappropriate stress responses, substance
use disorders, and alcohol abuse.
75
The relationship of a diagnosis of depression
with a diagnosis of diabetes among adults in
Maryland is shown in Figure 24: the percent
ever diagnosed with depression is about twice
as high for adults with a diagnosis of diabetes
(34 percent) as for adults without a diagnosis of
diabetes (17 percent).
76
People who have mental health conditions
are at an increased risk for developing
diabetes and untreated mental health
conditions can make the management of
diabetes more difficult. People with untreated
mental health conditions often deal with issues
like poor self-care, improper nutrition, barriers
to accessing primary care and mental health
care, and lack of exercise. Mental illness
reduces the likelihood a person with
diabetes will be properly treated.
77
Figure 24
Age-Adjusted Percent of Adults Ever Diagnosed with
Depression, by Diagnosed Diabetes Status,
Maryland 2017 (BRFSS)
Frayne, S.M., Halaynch, J.H., Miller, D.R., Wang, F., Lin, H., Pogach, L., et al. (2005). Disparities in diabetes care: Impact on mental illness. Archives of Internal Medicine, 165, 2631-2638
Maryland BRFSS 2015-2017.
Disability in Diabetics, Thomas Songer, PHD, Chapter 12, 1996.
50%
40%
0%
30%
20%
10%
Doctor Diagnosed Diabetes (excl. women told only during pregnancy)
Doctor Diagnosed Diabetes No Diabetes
Percentage ever diagnosed with depression
Maryland Diabetes Action Plan 2020
34%
17.1%

31
Gestational Diabetes
NIDDK, https://www.niddk.nih.gov/health-information/diabetes/overview/preventing-type-2-diabetes
ACOG Releases Planline on Gestational Diabetes, American Family Physician, 2014 Sept 15; 90(6): 416-417
Percentage of Women Delivering a Live Birth Who Developed Gestational Diabetes, Maryland Vital Statistics, 2013-2017.
https://www.cdc.gov/diabetes/basics/getting-tested.html
https://www.cdc.gov/diabetes/basics/prediabetes.html
Centers for Disease Control and Prevention. National Diabetes Statistics Report, 2017. Atlanta, GA: Centers for Disease Control and Prevention, U.S. Dept of Health and Human Services; 2017.
Diabetes Care. January 01 2019; volume 42 issue Supplement 1.
Gestational diabetes is diabetes that starts
during pregnancy and occurs when a
pregnant woman is not able to make and
use all the insulin needed during pregnancy,
which results in high blood sugar. Pregnant
women with gestational diabetes tend to have
larger babies, and mothers have an increased
risk of high blood pressure and infections
during pregnancy. Women with a history of
gestational diabetes are at risk of developing
gestational diabetes for future pregnancies.
Although gestational diabetes usually resolves
after pregnancy, women who have gestational
diabetes in their pregnancies are at an
increased risk for developing type 2 diabetes
later in life.
78
Providers usually test for and identify
gestational diabetes between the 24th and
28th weeks of pregnancy.
79
In Maryland, the
rate of gestational diabetes increased from
5.4 percent in 2013 to 7.3 percent in 2017, and
has far-reaching consequences for the health
of women, as well as the health of their babies
by increased risk for diabetes.
80
Factors
such as multiple pregnancies and being
overweight or obese at the beginning of
the pregnancy greatly increase the risk of
gestational diabetes.
80
Prediabetes
Prediabetes is a condition where blood sugar
levels are higher than normal, but not high
enough to be considered diabetes. Prediabetes
is a precursor condition on the pathway from
normal glucose levels to type 2 diabetes; the
development of type 1 diabetes is usually so
rapid that there is no “prediabetes” state that
precedes type 1 diabetes. A fasting glucose
level of 100 to 125 mg/dL, a hemoglobin A1C
level of 5.7 percent to 6.4 percent, or a two-hour
glucose level in an oral glucose tolerance test
of 140 to 199 mg/dL defines prediabetes.
81
Prediabetes often goes unrecognized by both
individuals and their health care providers;
nine out of ten adults who have prediabetes do
not know they have it.
82
CDC estimates that
34 percent of U.S. adults have prediabetes.
83
Diabetes and prediabetes are serious
conditions that can lead to complications
including heart disease and stroke,
blindness, amputations, nerve damage,
and kidney disease.
84
Prediabetes and gestational diabetes indicate
higher risk for the development of diabetes, as
well as higher risk for some other bad health
outcomes. While prediabetes and gestational
diabetes do not cause diabetes per se, they
represent points in the chain of progression
to diabetes that are very near to crossing the
threshold to a diagnosis of diabetes. More
information on these interventions for these
conditions is found in Section III.
Maryland Diabetes Action Plan 2020

32
https://www.cdc.gov/socialdeterminants/index.htm
https://www.healthypeople.gov/2020/topics-objectives/topic/social-determinants-of-health
Id fn 85.
Social Determinants of
Health and Diabetes Risk
Social Determinants of Health (SDOH) are the
conditions in which people are born, grow, live,
work and age. SDOH have an impact on many
chronic diseases like diabetes.
85
The Maryland
data provided earlier show an increased
prevalence of diabetes among people with
lower levels of income and education, and
among racial and ethnic minorities. People
in these categories often may not have the
financial means to pay for healthier foods,
may struggle with food security, and may not
have safe areas for physical activity. The stress
related to poverty and racism has physiologic
effects that can promote the progression to
diabetes as well as impacting diet and
physical activity behaviors. All these societal
issues affect a person’s health.
86
Figure 25
depicts the five main categories of social
determinants of health which is the framework
used by Healthy People 2020.
87
Figure 25
Social Determinants of Health
Source: Healthy People 2020,
Office of Disease Prevention
and Health Promotion
Neighborhood
and Built
Environment
Economic
Stability
Education
Health and
Health Care
Social and
Community
Context
SDOH
Maryland Diabetes Action Plan 2020

33
Diabetes and Health Equity
https://www.healthypeople.gov/2020/about/foundation-health-measures/Disparities
Id fn 88
Kolb H. and Martin S. Environmental/lifestyle factors in the pathogenesisand prevention of type 2 diabetes. BMC Medicine. July 2017; volume 15,131; doi:10.1186/s12916-017-0901-x.
Walker RJ, Strom Williams J, Egede LE. Influence of race, ethnicity and social determinants of health on diabetes outcomes. Am J Med Sci. 2016;351: 366-373.
Healthy People 2020 defines health equity as
the “attainment of the highest level of health
for all people. Achieving health equity requires
valuing everyone equally with focused and
ongoing societal efforts to address avoidable
inequalities, historical and contemporary
injustices, and the elimination of health and
health care disparities.”
88
Healthy People 2020 defines a health disparity
as “a particular type of health difference that
is closely linked with social, economic, and/or
environmental disadvantage. Health disparities
adversely affect groups of people who have
systematically experienced greater obstacles
to health based on their racial or ethnic group;
religion; socioeconomic status; gender; age;
mental health; cognitive, sensory, or physical
disability; sexual orientation or gender
identity; geographic location; or other
characteristics historically linked to
discrimination or exclusion.”
89
The Maryland data presented above have
shown differences in diabetes prevalence in
high burden populations, such as by age, by
race/ethnicity, by geography, by level of income
and by level of education. Differences by other
factors likely exist as well, which cannot be
documented in our current data systems.
Determinants such as poor diet, low physical
activity, overweight/obesity, and high chronic
stress drive physiologic changes that lead to
diabetes. Social determinants such as income,
education, housing, unsafe neighborhoods,
food insecurity, lack of transportation, and lack
of health care access drive differences in diet,
activity, stress and preventive care regardless
of race. Finally, racial injustice has produced
persistent disadvantage in social determinants
of health for racial and ethnic minority
populations, creating racial/ethnic disparities
in diabetes outcomes.
The data presented above suggest the
following multiple opportunities to intervene
to move toward health equity with respect to
diabetes incidence, morbidity and mortality.
Factors on which to intervene include:
The physiologic determinants of diabetes:
90
• Unhealthy diet
• Low physical activity
• Stress
The social determinants of diabetes:
91
• Income
• Education
• Housing
• Unsafe neighborhoods
• Food insecurity
• Lack of transportation
• Lack of health care access
Populations to target with interventions
on the factors listed above:
• Certain racial/ethnic minority populations
• Certain urban populations
• Certain rural populations
• Low income population
• Low educational attainment population
• The population with mental
health conditions
• The population with disabilities
Maryland Diabetes Action Plan 2020

Action Plan
Diabetes
Section III:
Intervention Strategies and Actions Steps for Diabetes Prevention and Control
34
Meigs, JB, Muller, DC, Nathan, DM, Blake, DR, Andres, R. The Natural History of Progression From Normal Glucose Tolerance to Type 2 Diabetes in the Baltimore Longitudinal Study of Aging.
Diabetes 2003 Jun; 52(6): 1475-1484. https://doi.org/10.2337/diabetes.52.6.1475.
Kim, D.,
https://thesystemsthinker.com/introduction-to-systems-thinking
.
Rationale Behind Four Risk Populations for Diabetes
The natural progression of type 2 diabetes
is a risk continuum from healthy weight,
overweight and other risk factors, normal
glucose, impaired glucose, and glucose
intolerance to diabetes.
92
The Maryland
Diabetes Action Plan uses a systems-
thinking model approach to frame the
actions and strategies needed to address all
components and populations along the
continuum (Healthy; Overweight/Obese;
Prediabetes/Gestational Diabetes; and
Diabetes and Diabetes Complications). This
approach recognizes upstream factors which
affect the full population (those factors that
can benefit all risk level components) to those
at highest risk downstream (Diabetes and
Diabetes Complications) (Figure 26).
93
Using
this approach can also address high burden
populations (as discussed in Section II). In the
systems-thinking model (Figure 1), the actions
take place between the risk factors.
Action Plan Framework
Maryland Diabetes Action Plan 2020

35
Auerbach J. The 3 Buckets of Prevention. J Public Health Manag Pract. 2016;22(3):215–218. doi:10.1097/PHH.0000000000000381.
Using additional public health frameworks,
such as the Three Buckets of Prevention,
categorizes actions to be taken in healthcare,
at the intersection of the community and
healthcare, and at the community-wide level
(Figure 27).
94
The “buckets” show sectors for
action, between the health care system, the
community and public health.
A brief description of evidence which informs
the development of action steps in the four
components in Section III is listed below. The
vision is for all Maryland partners, across
multiple sectors, to identify areas where they
currently work or have the capability of
working, to align their efforts to make strides
in reducing the diabetes burden in the state.
Figure 26
Diabetes Systems Thinking Model
Figure 27 Three Buckets of Prevention
Keeping a
healthy
population
Reducing
overweight and
obesity
Managing diabetes
and diabetes
complications
Reducing risk
with prediabetes and
gestational diabetes
Bucket 3:
Community-wide
interventions
(ex: policies to increase
access to healthy
nutrition and
physical activity)
Bucket 2:
Community-
health care
Interventions
(ex: national diabetes
prevention program)
Bucket 1:
Health systems
(ex: care management
and diabetes self
management education)
Health Care Public Health
Traditional Clinical
Prevention
Innovative Clinical
Prevention
Total Population or
Community-Wide
Prevention
Increase
the use of
evidence-based
services
1
Provide
services
outside the
clinical setting
2
Implement
interventions
that reach whole
populations
3
Maryland Diabetes Action Plan 2020

36
Id fn 71
Maryland BRFSS, 2017.
https://www.cdc.gov/obesity/index.html
tfah.org/stateofobesity2018
. Accessed August 18, 2019.
https://www.cdc.gov/policy/hiap/index.html. Accessed August 18, 2019.
http://www.mdot.maryland.gov/newMDOT/Planning/Bike_Walk/Bike_Ped_Plan_Update.html. Accessed August 18, 2019.
W.H. Dietz; Obesity and Excessive Weight Gain in Young Adults, New Targets for Prevention; JAMA; July 18, 2017;
https://www.cdc.gov/breastfeeding/about-breastfeeding/index.html, accessed August 29, 2019.
https://www.healthypeople.gov/2020/topics-objectives/topic/maternal-infant-and-child-health/objectives, accessed August 29, 2019.
Maryland PRAMS Report, 2017 Births.
Interventions for the Healthy Weight Population
In Maryland, over 32.7 percent of the adult
population is of a healthy weight.
95
The
Keeping a Healthy Weight population actions
focus on community-wide approaches, which
will also impact the health of the other three
population components downstream by
implementing multi-faceted, multi-sector
collaborations to make healthy eating
and active living accessible, affordable,
and convenient.
What is a Healthy Weight:
Healthy weight is a weight at which an
individual is considered at a low or reduced risk
for adverse health conditions. Body Mass Index
(BMI) is used as a screening tool to determine if
an individual is overweight or obese based on
their height and weight. For adults it is a BMI
of 18-24. A child whose BMI is between the 5th
percentile to 84th percentile is in the healthy
weight range.
96
Trust for America’s Health and the Robert
Wood Johnson Foundation recommend three
guiding principles to address healthy weight
(reducing obesity): 1) Promote polices and scale
programs that take a multi-sector approach;
2) Adopt and implement policies that help
make healthy choices easy; and 3) Invest in
programs that level the playing field for all
individuals and families.
97
Additionally, the
movement around Health in All Policies
(HiAP) recognizes that health is created by a
multitude of factors beyond healthcare and,
in many cases, beyond the scope of traditional
public health activities.
98
Interventions targeted at keeping all people
at a healthy weight specifically creates access
to healthy nutrition and physical activity,
using broad and large-scale actions which
include environmental change and policies
to reach all citizens. For example, the 2040
Maryland Bicycle and Pedestrian Master Plan
addresses actions to increase use of and access
to bike and pedestrian usage in the state.
99
Other system level change actions in this
component can also include improving
access and polices within institutions, such
as worksites and schools. Worksites can
implement breastfeeding policies which
include dedicated space and time for
employees to breastfeed, as well as policies
to increasing available healthy food options
in cafeterias and working with food service
vendors to supply low fat/low sodium
products. Increasing farm production
statewide and access to farmers markets with
Electronic Benefits Transfer (EBT) access for
healthy foods are actions also recommended
by Trust for America’s Health and the Robert
Wood Johnson Foundation.
74
Targeting healthy weight in specific
populations, such as women of childbearing
age, should be encouraged for preconception
healthy weight.
100
Increasing breastfeeding
initiation and duration have lasting benefits for
infants, reducing the risk of obesity, and also
reducing the risk of diabetes and other chronic
diseases for mothers.
101
Healthy People 2020
targets are to increase the proportion of those
infants who were ever breastfed from 74
percent to 81.9 percent, in Maryland 89.4
percent of live births were ever breastfed
in 2017.
102,103
Maryland Diabetes Action Plan 2020

37
Maryland BRFSS 2017.
Endocr Pract. 2016;22:Supp3;1-205.
Id fn 105
https://www.montgomeryparks.org/about/parks/park-prescription/. Accessed August 18, 2019.
https://ihcw.aap.org/resources/Documents/algorithm_brightfutures_032819.pdf. Accessed August 27, 2019.
Interventions for the Overweight and Obese Populations
In Maryland, over 65.4 percent of the adult
population is overweight or obese, the leading
risk factor in diabetes.
104
As the model moves
downstream according to risk, all people in
this population will be impacted by the
broad actions in the Keeping a Healthy
Weight component.
What is Overweight or Obesity:
In children, overweight is defined as a BMI
measurement greater than the 85th percentile
for age and sex of the child. Obese is defined
as a BMI measurement greater than the 95th
percentile for age and sex. Adult overweight is
defined as a BMI equal to or greater than 25,
while obesity is a BMI equal to or greater than
30. In adolescents, a BMI >25/30 or above 85/95
percentile, whichever is lower. There are three
classes of obesity, ranging from BMI 30-34 for
Class 1, BMI 35-39 for Class 2, and BMI greater
than 40 for Class 3.
In the Overweight/Obese component, the
focus is to reduce the risk of diabetes by
moving the population back to a healthy
weight through behavior change and health
system intervention for weight loss in adults
and to slow weight gain in children. Action
steps addressed in this component focus
on specific actions which target those
Marylanders who are overweight and obese,
while acknowledging the action steps in the
earlier Keeping a Healthy Weight component
will be available to support Marylanders in the
actions in this component.
Obesity is a complex, adiposity-based
chronic disease, where management targets
both weight-related complications and
adiposity to improve overall health and quality
of life. Recommendations allow for clinical
decision-making for patients with obesity,
which include screening, diagnosis, and
evaluation, selection of therapy, treatment
goals, and individualization of care with the
goal of facilitating high-quality care of
patients with obesity and provide a rational,
scientific approach to management that
optimizes health outcomes and safety.
105
Strategies for treating overweight include
preventing progressive weight gain and
lifestyle change; obesity treatment weight
loss, lifestyle change, considering/adding
pharmacotherapy and considering
bariatric surgery.
106
Providers need resources and tools to address
the complicated needs of patients who are
overweight or obese. Increasing use of
provider billing for weight management is
one strategy to help providers afford the
additional time needed to counsel and refer
patients. Some prescription programs which
link patients to healthy lifestyles have proved
successful; one example is the Montgomery
County Parks program which implements a
park prescription program, linking health
care providers and patients to parks for
physical activity.
107
Recommendations for assessing and
managing childhood obesity center on
prevention, structured weight management,
a comprehensive multi-disciplinary approach,
and if needed, tertiary care interventions.
Supporting lifestyle change with the patient
and the family using supports, such as a
diverse team trained in motivational
interviewing, is appropriate and helpful.
108
Maryland Diabetes Action Plan 2020

38
Prediabetes in Maryland—Maryland BRFSS Surveillance Brief. Vol. 1, No. 1. Baltimore, MD: Maryland Department of Health and Mental Hygiene, Center for Chronic Disease Prevention and Control,
October 2016
Maryland BRFSS 2018.
Centers for Disease Control and Prevention. National Diabetes Statistics Report, 2017. Atlanta, GA: Centers for Disease Control and Prevention, U.S. Dept of Health and Human Services; 2017.
CDC 2017 https://www.cdc.gov/diabetes/pdfs/data/statistics/national-diabetes-statistics-report.pdf. Accessed August 18, 2019.
Maryland BRFSS, 2018.
https://www.diabetes.org/risk-test;
https://www.cdc.gov/prediabetes/takethetest
Diabetes Care. January 01 2019; volume 42 issue Supplement 1.
https://amapreventdiabetes.org/tools-resources
CDC 2017 https://www.cdc.gov/diabetes/pdfs/data/statistics/national-diabetes-statistics-report.pdf. Accessed August 18, 2019
US Census 2016.
Maryland BRFSS 2017.
Interventions for the Gestational Diabetes and Prediabetes Populations
Among Maryland adults who have never
received a diagnosis of diabetes, 58.9 percent
report having a blood sugar test in the previous
three years. In Maryland residents age 45 and
older, for whom risk of prediabetes is increased,
69.5 percent report having been tested in the
previous three years.
109
Screening and testing
rates need to be improved so providers will be
able to refer at-risk people to resources to
prevent progression to type 2 diabetes. Based
on 2018 Maryland BRFSS data, 13 percent of
Maryland adults ages 18 and older had been
told they have prediabetes.
110
This number is far
below the CDC estimate of 34 percent of adults
ages 18 and older with prediabetes, which
suggests there are many Maryland adults
who have prediabetes who do not know
their status.
111
What is Prediabetes and
Gestational Diabetes:
Prediabetes occurs when people have elevated
blood glucose (sugar) levels, which places
them at higher risk for developing type 2
diabetes. This group includes people with A1C
of 5.7-6.4 percent, or fasting plasma glucose
between 100 and 125 mg/dL, regardless of BMI.
Gestational Diabetes occurs in pregnant
women who have high blood glucose levels
during pregnancy with no history of diabetes
mellitus prior to pregnancy. Gestational
diabetes is typically tested between 24-28
weeks with Oral Glucose Tolerance Test (OGTT)
levels exceeding normal range fasting, 1 hour,
and 2 hours. Even if the blood glucose
reduces back to normal levels after delivery,
the woman has an increased risk for type 2
diabetes mellitus later in life as does the child.
It is estimated that approximately 1 in 4
people with diabetes do not know they have
it.
112
In Maryland, only 13 percent of the adult
population has been told they have
prediabetes, however, CDC estimates that
34 percent of adults has prediabetes.
113
Screening and testing asymptomatic people
for prediabetes and diabetes can be done
by informally evaluating risk factors with
simple prediabetes risk tests, as those available
from the ADA and CDC.
114,115
Screening tools
are recommended at age 45 for people with no
symptoms and for people who are overweight
and obese. The screening results can help
determine whether blood tests are needed to
further evaluate for abnormal blood sugars.
Screening and testing with blood tests should
be considered at any age for people who are
overweight or have obesity (BMI ≥25 kg/m
2
or
≥23 kg/m
2
in Asian Americans) and who also
have one or more of the following risk factors:
• First-degree relative with diabetes;
• High-risk race/ethnicity (e.g., African
American, Latino, Native American, Asian
American, Pacific Islander);
• History of cardiovascular disease;
• Hypertension (≥140/90 mmHg or on therapy
for hypertension);
• HDL cholesterol level <35 mg/dL and/or a
triglyceride level >250 mg/dL;
• Women with polycystic ovary syndrome;
• Physical inactivity; and
• Other clinical conditions associated with
insulin resistance (e.g., severe obesity,
acanthosis nigricans).
116
Four blood tests are used to diagnose diabetes.
The most common are the fasting blood
glucose and the hemoglobin A1C, but an oral
glucose tolerance test (OGTT) may also be
used. The fourth diagnostic test is non-fasting
blood sugar, which if over 200 mg/dL in the
presence of typical signs and symptoms of
diabetes, indicates diabetes. Two positive tests
are required to confirm a diagnosis of diabetes,
which can be two different tests on the same
blood sample (such as fasting glucose and
A1C from the same blood draw). Intensive
adherence to authoritative clinical guidelines
and use of EHR tools should be encouraged
with providers and health systems.
117
CDC estimates over 34 percent of the adult
population has prediabetes, which translates
to approximately 1.6 million adults in Maryland.
In 2017, 1.7 percent of Maryland adult women
reported a history of gestational diabetes.
120
118,119
Maryland Diabetes Action Plan 2020

39
Diabetes Care. January 01 2019; volume 42 issue Supplement 1.
Diabetes Prevention Program Research Group, Reduction in the Incidence of Type 2 Diabetes with Lifestyle Intervention or Metformin; N Engl J Med 2002; 346:393-403.
Id fn 122
Ackermann RT, Finch EA, Brizendine E, Zhou H, Marrero DG. Translating the Diabetes Prevention Program into the community. The DEPLOY Pilot Study. Am J Prev Med. 2008;35(4):357–363.
doi:10.1016/j.amepre.2008.06.035.
DPRP State-Level Evaluation Report, CDC, July 2019.
Maryland BRFSS 2018.
Both prediabetes and gestational diabetes
significantly increase the risk of
progression to diabetes.
121
Prediabetes and Diabetes
Screening in Adults
Testing to detect prediabetes and diabetes is
recommended for adults of any age who are
overweight or obese and who have one or
more additional risk factors for diabetes. For all
others, especially those who are overweight,
testing should begin at age 45. People with
prediabetes who are at risk for type 2 diabetes
can prevent or delay the disease by making
modest lifestyle changes to lose five to seven
percent of body weight and increasing
physical activity to at least 150 minutes per
week.
122
In Maryland, people with prediabetes
can participate in a National Diabetes
Prevention Program (National DPP). The
National DPP is an evidence-based lifestyle
change program designed to help participants
make these lifestyle changes to avoid
developing type 2 diabetes.
As the model continues to move downstream,
people with prediabetes and a history of
gestational diabetes will be impacted by the
broad actions in the Keeping a Healthy Weight
component, as well as the targeted weight
control/reduction actions in the Reducing
Overweight and Obesity component. In the
Prediabetes/Gestational Diabetes component,
the focus is to test those at risk and refer to
aggressive risk reduction resources, such as
the National DPP.
The original DPP study was shown to reduce
the risk by 58 percent in the group who made
behavior change that resulted in a 7 percent
weight loss and at least 150 minutes a week
of moderate physical activity. The metformin
(low cost drug to lower blood glucose) group
showed a 34 percent decrease.
123
The research
into practice for this program demonstrated
similar outcomes from small group sessions
led by lay health coaches.
124
The CDC launched
the National DPP in 2012 to set standards and
assure fidelity and create a recognition registry
of programs throughout the country.
Maryland currently has 53 National DPP
lifestyle programs (12 fully recognized);
since 2012, 5,296 citizens participated in
the program.
125
Public payer reimbursement for the National
DPP is a step toward sustainability. In April
2018, Medicare DPP services became available
to eligible beneficiaries nationwide,
creating a billing framework based on
outcomes of participants. In 2016, Maryland
Medicaid implemented a CDC-funded
demonstration to implement a delivery model
for the National DPP in Medicaid managed
care organizations (MCOs). Four of Maryland’s
nine HealthChoice MCOs participated,
successfully enrolling 637 enrollees into a
participating CDC-recognized lifestyle change
program. Key outcomes of the demonstration,
which concluded in January 2019, included
the creation of an eligibility algorithm, and
a sustainability plan culminating in
Medicaid applying to CMS for a Section 1115
demonstration waiver amendment that would
authorize continued provision of the National
DPP lifestyle change program in HealthChoice.
CMS approved the waiver request in April 2019,
and HealthChoice DPP has been implemented
statewide effective September 1, 2019.
As the prevalence for Maryland adults who
are told their prediabetes status by providers
is dramatically lower (13 percent) than those
estimated through national clinical studies,
implementing mechanisms or tools within
provider practice systems to increase testing
for those at risk of diabetes is the first step for
provider practices.
126
The Maryland Primary Care Program (MDPCP)
is driving the adoption of advanced primary
care in Maryland practices including
management and prevention of chronic
disease. Currently, practice performance
is measured on critical chronic disease areas
including diabetes and hypertension
management. A focus of the program is
aligning with the State's population health
goals which includes reducing the incidence
of diabetes. MDPCP is working on adding a
performance measure for 2020 to drive
diabetes prevention efforts that would
emphasize BMI and blood glucose
assessment and making subsequent
referrals to evidence-based programs such
as the National DPP. The MDPCP anticipates
regular training for its practice coaches
and the participating practices and Care
Transformation Organizations, entities that
Maryland Diabetes Action Plan 2020

40
Auerbach J. The 3 Buckets of Prevention. J Public Health Manag Pract. 2016;22(3):215–218. doi:10.1097/PHH.0000000000000381.
Kim C, Newton KM, Knopp RH. Gestational diabetes and the incidence of type 2 diabetes; a systematic review. Diabetes Care 2002;25:1862-1868.
Diabetes Care. January 01 2019; volume 42 issue Supplement 1.
http://www.improvingchroniccare.org/index.php?p=The_Chronic_Care_Model&s=2 Accessed July 18, 2019.
Centers for Disease Control and Prevention. Put the brakes on diabetes complications. Accessed November 13, 2019 at
https://www.cdc.gov/diabetes/library/features/prevent-complications.html
Diabetes Care. January 01 2019; volume 42 issue Supplement 1.
provide staffing and technical assistance to
practices as well as provider referral
mechanisms to increase referrals.
The National Nurse Study showed an increased
risk of the conversion to diabetes in those with
a history of gestational diabetes.
127
Priority
actions for women with gestational
diabetes focus on postpartum testing to
rule out undiagnosed prediabetes, or type 1
or type 2 diabetes. Postpartum continued
follow-up for women with a history of
gestational diabetes should include regular
testing, healthy lifestyle support and potentially
use of metformin.
128
Working with the healthcare team to ensure
postpartum testing of women with gestational
diabetes is a standard of care practice that is
underutilized. In 2016, Maryland Medicaid and
Maryland Public Health engaged two MCOs to
develop and implement system level tools and/
or policies to ensure testing for women with a
history of gestational diabetes.
Interventions for Managing Diabetes and Diabetes Complications
The American Diabetes Association (ADA)
recommends population health approaches for
managing diabetes be timely, evidence-based,
and in collaboration with each patient.
94
Health care systems should consider using
frameworks such as the Chronic Care Model
(CCM) for achieving high quality care of
people with diabetes which encourages six
essential elements to move health systems
toward having a prepared, proactive team
and an informed, activated patient. These
core elements are: community resource
mobilization; health system that operates
with safe, high quality care as part of its
culture; self-management support to
strengthen decision-making and agency;
delivery system design to assess what care
is needed and deliver it to keep patients as
healthy as possible; evidence-based
decision-making and patient-centered
care; and clinical information systems that
are comprehensive and facilitate effective
and efficient care.
129
What is Diabetes and its Complications:
This group includes people with a diagnosis
that is confirmed by two tests; fasting plasma
glucose over 126 mg/dL or A1C of 6.5 percent or
higher, regardless of BMI. Diabetes is also
diagnosed with an oral glucose tolerance
test result greater than 200mg/dL or random
plasma glucose greater than 200mg/dL with
typical symptoms of diabetes (blurred vision,
excess thirst, excess hunger, frequent
urination). When not well managed or
when it has been present for many years,
diabetes slowly damages the blood vessels in
the body and results in problems of organs or
organ systems in the body, including the heart,
eyes, kidneys, skin, and nerves. The resulting
complications, like blindness, kidney failure,
nerve pain, and extremity amputations, can
be debilitating and significantly impact quality
of life.
130
Actions for managing diabetes and controlling
complications are complex and rely on a
team-based approach, which includes
behavior change for self-care and a healthy
lifestyle. Diabetes self-care requires daily
decisions about food, physical activity, stress
management, and daily self-monitoring of
glucose levels. Self-management education
facilitates the knowledge, skill, and confidence
for individuals with diabetes to manage their
own health, a concept known as patient
activation. Self-management education is
designed to help individuals adopt and sustain
the necessary skills and behaviors to achieve
proper diabetes self-care on an ongoing basis,
and has been shown to positively affect
outcomes, and all people with diabetes should
participate in diabetes self-management
education and support programs.
131
Telemedicine is an opportunity to improve
patient access to primary care and to
Maryland Diabetes Action Plan 2020

41
Siminerio L, Rubbert K, Huber K, Toledo FGS. Telemedicine for Reach, Education, Access, and Treatment (TREAT): Linking Telemedicine with Diabetes Self-management Education to Improve Care in
Rural Communities, The Diabetes Educator.
Ciemins E, Coon P, Peck R, Halloway B and Min SJ. Using Telehealth to Provide Diabetes Care to Patients in Rural Montana: Findings from the Promoting Realistic Individual Self-Management Program.
Telemedicine Journal and e-Health. 2011 Oct; 17(8):596-602. Doi: 10.1089/tmj.211.0028.
DLee SWH, Chan CKY, Chua SS, Chairyakunapruk N. Comparative Effectiveness of Telemedicine Strategies on Type 2 Diabetes Management:A Systematic Review and Network Meta-analysis.
Scientific Reports. 2017 Oct4;7(1):12680.Doi: 10.1038/s41598-017-12987-z.
American Diabetes Association Clinical Planlines.
Maryland BRFSS, 2017.
Centers for Disease Control and Prevention.National diabetes statistics report: Estimates of diabetes and its burden in the United States, 2017.Atlanta, GA: US Department of Health and Human
Services; 2017. Accessed 11/14/2019 athttps://www.cdc.gov/diabetes/pdfs/data/statistics/national-diabetes-statistics-report.pdf
Matheus AS, Tannus LR, Cobas RA, Palma CC, Negrato CA, Gomes MB. Impact of diabetes on cardiovascular disease: an update.Int J Hypertens.2013;2013:653789.
National Institute of Diabetes and Digestive and Kidney Diseases,
https://www.niddk.nih.gov/health-information/diabetes/overview/preventing-problems/gum-disease-dental-problems.
Centers for Disease Control and Prevention, https://www.cdc.gov/diabetes/managing/problems.html
community supports and services, and
telehealth strategies have been effective
for improving patient self-activation and
engagement, for increasing patient blood
glucose self-monitoring and dietary adherence,
and for decreasing A1C in many settings.
132,133,134
Managing and Controlling Diabetes
The American Medical Association and the
American Diabetes Association (ADA)
recommend individuals diagnosed with
diabetes should be aware of how to manage
their disease, and nearly all general
practitioners and their staff should be trained
on diabetes management. Once a person is
diagnosed with diabetes, they ideally should be
trained on how to monitor their blood glucose
levels, administer insulin injections if necessary,
take other diabetes medications, receive
annual eye and foot exams, and be vaccinated
for influenza, pneumonia and other
vaccinations based on clinical protocols.
Blood levels should be checked daily for
glucose levels. In addition, A1C testing should
be performed at least twice yearly in patients
who have achieved stable glycemic control.
For those patients who are not at goal or for
whom therapy recently changed, quarterly
A1C testing is recommended.
135
According to self-reported data from BRFSS,
in 2017, 10.2 percent of Maryland adults with
diagnosed diabetes did not visit their doctor
regularly, 4.0 percent did not have dilated eye
examinations, 5.2 percent did not receive
A1C testing, 21.1 percent did not have foot
examinations, 31.6 percent did not receive an
influenza or a pneumonia shot at any time,
and 47.5 percent never attended a diabetes
self-management course, which are offered
regularly at hospitals and doctors’ offices.
136
Because diabetes increases the risk of
cardiovascular disease two to four times
more than people who do not have diabetes,
cardiovascular disease is still the most
common cause of death for people with
diabetes.
137,138
Controlling blood pressure and
monitoring cardiovascular risk factors should
be part of diabetes care plans.
High blood sugar increases the level of sugar
in saliva. Sugar feeds the bacteria in the mouth,
and when bacteria are combined with food, it
creates optimum conditions for tooth decay to
occur. Additionally, people with diabetes are
more likely to have gum disease, which can
lead to tooth loss. Gum disease can also make
blood sugar levels rise and make diabetes
harder to manage. Treating gum disease
can lower blood sugar over time and reduce
the chance of other diabetes-related
complications, such as heart disease and
kidney failure.
139
For people with diabetes, optimum
management of mouth and diabetes health
should include:
• Keeping blood sugar as close to target levels
as possible.
• Brushing teeth at least twice a day and
flossing once a day.
• If wearing dentures, removing and
cleaning them daily and informing the
dental provider of any denture-related
soreness in the mouth.
• Getting regular dental checkups and
informing the dental provider of the
diabetes diagnosis.
• Stopping smoking or not starting.
140
Many common signs of diabetes appear in
the mouth, such as red swollen, tender, or
bleeding gums. All signs of infection should be
reported to a dental provider immediately.
However, gum disease may not cause
immediate pain or visible signs, so regular
dental cleanings and exams every six months
are essential to prevent the development of
Maryland Diabetes Action Plan 2020

42
National Institute of Diabetes and Digestive and Kidney Diseases, https://www.niddk.nih.gov/health-information/diabetes/overview/preventing-problems/gum-disease-dental-problems.
American Dental Association, https://www.mouthhealthy.org/en/az-topics/d/diabetes
Maryland BRFSS, 2016.
Healthy People 2020 - Oral Health Topic: OH Objective 14.3. https://www.healthypeople.gov/2020/topics-objectives/topic/oral-health/objectives
more extensive damage.
141
Research also
suggests that treating gum disease can help
improve blood sugar control in patients living
with diabetes, decreasing the progression of
disease.
142
In Maryland in 2016, approximately
68 percent of adults with diagnosed diabetes
reported having visited a dentist in the
past year.
143
The integration of dental and medical practice
can also play an important role in the
management of diabetes and oral disease.
The U.S. Department of Health and Human
Services’ Healthy People 2020 oral health
objectives include increasing the proportion of
adults who were tested or referred for glycemic
control from a dentist or dental hygienist in the
past year.
144
The promotion of medical-dental
integration to reach these goals can potentially
have a significant impact on reducing the
prevalence of diabetes in Maryland.
Maryland Diabetes Action Plan 2020

43
Action Plan
Diabetes
Section IV:
Action Tables for Diabetes Prevention and Control
The interventions and action steps for the
Diabetes Action Plan are targeted to keep
people at a healthy weight, prevent overweight
and obesity, halt diabetes progression by
addressing prediabetes and gestational
diabetes, and improve care for people with
diabetes and better manage complications.
By addressing the diabetes risk continuum
with partners in all sectors across Maryland,
the burden of diabetes can be reduced
statewide. Because people with diabetes
have high risk for cardiovascular disease, the
number one cause of death in Marylanders,
addressing diabetes at the population level is
an important step in reducing the overall
number of deaths in our state.
The Diabetes Action Team developed actions in
each of the four components, and the next
section contains detailed action tables.
The actions are separated in two main
categories—Priority State Action Steps and
Suggested Action Steps for the State and its
Partners. The Priority action steps are those
MDH has prioritized and for which MDH will
assume responsibility. The “other” steps are
those where partners have influence to
impact change and assume a lead.
Additionally, data-related Action Steps are
included where there may be gaps in
important diabetes data and sources.
The goals and action steps included in the
plan are based on trend data, with reach
objectives for each population aimed at
reducing diabetes risk. For example, in the
Reducing Overweight and Obese Population,
the goals for the adults were identified based
on trend data that show a steady increase in
adult overweight and obesity; therefore the
goal is based on action steps that will halt
the increase in weight, and will keep the
overweight/obesity population from increasing.
Whereas, the high school youth overweight
and obese rates trend data have remained
relatively stable; therefore a goal to reduce
current overweight and obese by 10 percent in
4 years for the youth is needed to reduce the
risk of overweight and obesity in adulthood.
Maryland Diabetes Action Plan 2020

44
Healthy Weight Population
Definition
Healthy weight is a weight at which an individual is considered at a low or reduced
risk for adverse health conditions. Body Mass Index (BMI) is used as a screening tool
to determine if an individual is overweight or obese based on their height and weight.
For adults, it is a BMI of 18-25. A child whose BMI is between the 5th percentile to 85th
percentile is in the healthy weight range.
2019-2024 Goal
By 2024, 32 percent of Maryland adults will be of healthy weight.
Action Step Objectives
Increase access to healthy nutrition.
Achieve and maintain recommended physical activity levels for all Marylanders.
Reducing Overweight and Obese Populations
Definition
In children, overweight is defined as a BMI measurement greater than or equal to the
85th percentile for age and sex of the child. Obese is defined as a BMI measurement
greater than or equal to the 95th percentile for age and sex. Adult overweight is
defined as a BMI equal to or greater than 25, while obesity is a BMI equal to or greater
than 30. In adolescents, the definitions are a BMI of 25 or 30 or above 85 and 95
percent respectively, whichever is lower. There are three classes of obesity, ranging
from BMI 30-34 for Class 1, BMI 35-39 for Class 2, and BMI greater than 40 for Class 3.
2019-2024 Goal
By 2024, maintain the percentage of adults with a BMI >25 at 66.5 percent;
and reduce by 10 percent the BMI >85th percentile in high school students.
Action Step Objectives
Improve clinical care services for overweight and obese children and adults.
Improve the availability of healthy lifestyle options for overweight and obese children
and adults.
Prediabetes and Gestational Diabetes Populations
Definition
Prediabetes occurs when people have elevated blood glucose (sugar) levels, which
places them at higher risk for developing type 2 diabetes. This group includes people
with A1C of 5.7-6.4 percent, or fasting plasma glucose between 100 and 125 mg/dL,
regardless of BMI. Gestational Diabetes occurs in pregnant women who have high
blood glucose levels during pregnancy with no history of diabetes mellitus prior to
pregnancy. Gestational diabetes is typically tested between 24-28 weeks with Oral
Glucose Tolerance Test (OGTT) levels exceeding normal range fasting, 1 hour, and
2 hours. Even if the blood glucose reduces back to normal levels after delivery, the
woman has an increased risk for type 2 diabetes mellitus later in life as does the child.
2019-2024 Goal
By 2024, increase the prevalence of Maryland adults who know their
prediabetes status by 30 percent.
Action Step Objectives
Improve prediabetes outcomes.
Reduce risk of diabetes in women with a history of gestational diabetes.
Maryland Diabetes Action Plan 2020

45
Managing Diabetes and Controlling Diabetes with Complications
Definition
This group includes people with two confirmed tests; fasting plasma glucose over
126 mg/dL or A1C of 6.5 percent or higher, regardless of BMI. Diabetes, when not well
managed or when it has been present for many years, slowly damages the blood
vessels in the body and results in problems of organs or organ systems in the body,
including the heart, eyes, kidneys, skin, and nerves.
2019-2024 Goal
By 2024 reduce the age-adjusted diabetes mortality by 5 percent.
Action Step Objectives
Improve the use of standardized quality of care for people with diabetes at all levels
of the health care system by increasing the number of healthcare systems statewide
that utilize frameworks such as the chronic care model (CCM), as recommended by
the American Diabetes Association’s 2019 Standards of Medical Care in Diabetes.
Reduce the number of hospitalizations and emergency department visits each by
5 percent for people with diabetes in the state of Maryland.
Action Steps by Partner
Table 1: Activities for Health Care Providers
Maryland Diabetes Action Plan 2020
Healthy Population Overweight/Obesity Prediabetes/Gestational Diabetes Diabetes Management
• Utilize a statewide unified healthy
nutrition messages to be used to
promote knowledge and awareness
of healthy eating.
• Promote increased physical
activity and decreased sedentary
activity through collaborations
and referral networks with
physical activity providers in
the community.
• Implement strategies for healthy
eating and increase physical
activity as part of a population
health plan.
• Promote initiation of and length
of breastfeeding.
• Refer overweight children
and adults to appropriate
evidence-based weight and
lifestyle counseling.
• Establish referral mechanisms to
refer obese children and adults to
obesity specialists for treatment.
• Establish screening and
documentation processes for
annual BMI for children older
than 2 years of age and adults.
• Establish medical homes for
screening and treatment of
overweight/obesity for members
of higher-risk groups.
• Address barriers to participating
in healthy lifestyle activities
and programs.
• Increase number of people at
risk for prediabetes who are
tested, referred and complete
and reach evidence-based lifestyle
change program target goals.
• Utilize an e-referral application
within CRISP to facilitate referrals
to the BeHealthyMaryland.org
referral page and National DPP
Lifestyle Change Programs.
• Address barriers to participation
in lifestyle programs
(i.e. transportation, childcare,
healthy food access, exercise
program availability, etc.)
• Use a framework, such as the
Chronic Care Model (CCM), clinical
guidelines, EHR best practice
advisories, and dashboards to
achieve better compliance with
routine care such as timely
intervals for checking A1C and
urine for proteinuria, for referring
for eye/foot exams, and for
addressing oral health.
• Increase access and address Social
Determinants of Health (SDOH)
in DSMES and National DPPs.
• Ensure patients are appropriately
linked with case management.
• Address barriers to participating
in healthy lifestyle activities
and programs.

46Maryland Diabetes Action Plan 2020
Healthy Population Overweight/Obesity Prediabetes/Gestational Diabetes Diabetes Management
• Promote healthy lifestyle family
planning within OB/GYN practices
with women of childbearing age.
• For pediatricians and adult
medicine practitioners, promote
the replacement of screen time
with increased physical
activity alternatives.
• Establish universal Social
Determinants of Health screening
tools and use of z-codes in
primary care and pediatrician
practices for overweight/obese
patients (food insecurity, poverty,
housing instability, neighborhood
safety, and provide social and
case management support).
• Establish use of mobile and
telehealth technology by case
managers, licensed dietician
nutritionists, and health care
providers to monitor high risk
patients to help them achieve
weight management goals.
• Establish nutrition counseling
services via primary care and
community-based providers and
increase those billing for
nutrition counseling.
• Perform or arrange for healthy
behavior screening for
overweight/obese patients,
including food insecurity and
prescribe food and physical
activity interventions
for weight management.
• Implement mechanisms and tools
within provider practices to test for
diabetes at 4-12 weeks postpartum
for women with history of
gestational diabetes and adhere
to clinical guidelines for women
with a history of gestational
diabetes for regular testing,
healthy lifestyle support and
potential use of medication to
reduce risk.
• Implement coordinated strategies
to encourage women with a
history of gestational diabetes
to breastfeed.
• Utilize the CRISP e-referral tools to
refer women with gestational
diabetes history to evidence-based
lifestyle change programs
or interventions.
• Ensure adherence to clinical
postpartum glucose testing
guidelines for women who have
a history of gestational diabetes.
• Encourage bidirectional referral
systems between dentists and
primary care to Identify patients
who have diabetes or at risk for
diabetes and refer them to for
diagnosis and treatment.
• Following the delivery system design principle of
frameworks such as CCM, engage clinical team
members to improve efficiency in quality care
delivery by (i.e. dentists, optometrists/
ophthalmologists, podiatrists, pharmacists, nurses,
medical assistants, social workers, case managers,
lab technicians) to achieve more intensive disease
management and decrease delays in implementing
the most effective care for each person
with diabetes.
• Advance and support public policies to use available
telemedicine services to improve patient access to
primary care and to assist in self-management
of diabetes.
• Establish increased dental to primary care provider
partnerships to refer patients at high risk to primary
care providers for potential diabetes diagnosis/
management.
• Implement standard clinical education for all health
professional trainees on all aspects of the CCM, as
supported by the American Diabetes Association’s
Standards of Medical Care in Diabetes – 2019.
• Implement mechanisms and tools in provider
practices to ensure referral to self-management and
lifestyle management programs.
• Implement system mechanisms in provider
practices to assure all patients with diabetes have an
Emergency Preparedness Plan.
• Encourage the use of Diabetes Self-Management
Education and Supports, Chronic Disease
Self-Management Program, and Diabetes
Self-management program among patients with
diabetes and the use of telemedicine/virtual
methods to improve support for self-management
of diabetes as needed.
• Refer patients appropriately for vision, oral, podiatry
services and cognitive testing.
• Adhere to Community Preventive Services Task
Force (CPSTF) recommendations for intensive
lifestyle interventions (based on Look Ahead trial/
DPP model) for overweight/obese patients with
type 2 diabetes to prevent complications.
• Engage licensed dietician nutritionists, behavioral
therapists, and exercise physiologists to participate
in care teams and provide additional diabetes
related training.

47
Table 2: Activities for Health Systems
Healthy Population Overweight/Obesity Prediabetes/Gestational Diabetes Diabetes Management
• Utilize a statewide unified healthy
nutrition messages to be used to
promote knowledge and
awareness of healthy eating.
• Promote initiation of and length
of breastfeeding.
• Promote healthy lifestyle family
planning within OB/GYN practices
with women of childbearing age.
• Implement healthy eating
strategies as part of the population
health plans and address food
insecurity in partnership with
community based food and meal
providers, such as Area Agencies
on Aging.
• Collaborate with community
partners to promote increased
physical activity and decreased
sedentary activity.
• Implement strategies to increase
physical activity as part of the
population health plan.
• Implement policies that support
healthy eating in health system
facilities (cafeterias, vending
machines).
• Engage academia for medical
schools to include nutrition
education and obesity
pathophysiology and prevention/
treatment into curriculum to
maintain accreditation by
professional associations.
• Establish community investment
to support healthy lifestyles
in communities
• Encourage healthcare providers
to refer overweight children and
adults to appropriate
evidence-based weight
and lifestyle counseling.
• Establish referral mechanisms in
healthcare system to refer obese
children and adults to obesity
specialists for treatment.
• Establish screening and
documentation processes for
annual BMI for children older than
2 years of age and adults.
• Establish medical homes for
screening and treatment of
overweight/obesity for members of
higher-risk groups.
• Establish universal Social
Determinants of Health screening
tools and promote providers use
of z-codes in primary care and
pediatrician practices for
overweight/obese patients
(food insecurity, poverty, housing
instability, neighborhood safety,
and provide social and case
management support).
• Establish use of mobile and
telehealth technology by case
managers, registered dieticians,
and healthcare providers to
monitor high risk patients to
help them achieve weight
management goals.
• Establish nutrition counseling
services via primary care and
community-based providers and
increase those billing for
nutrition counseling.
• Identify risk, test at-risk people,
diagnose (using ICD-10 codes)
prediabetes, and implement
practice mechanisms to assure
referral of patients to interventions.
• Develop and train providers to
utilize an e-referral application
within CRISP to facilitate referrals to
the BeHealthyMaryland.org
referral page and National DPP
Lifestyle Change Programs.
• Engage healthcare and WIC
providers to implement
mechanisms and tools within
provider practices to test for
diabetes at 4-12 weeks postpartum
for women with history of
gestational diabetes.
• Build knowledge and ability of
providers to adhere to clinical
guidelines for women with history of
gestational diabetes for regular
testing, healthy lifestyle support
and potential use of medication
to reduce risk.
• Implement coordinated strategies
to encourage women with a history
of gestational diabetes to breastfeed.
• Develop and train providers to
utilize the CRISP e-referral to refer
women with gestational diabetes
history to evidence-based lifestyle
change programs or interventions.
• Increase number of people at risk
for prediabetes who are tested,
referred and complete and reach
evidence-based lifestyle change
program target goals.
• Enable CRISP to collect and aggregate
electronic health record data from
participating clinical partners to facilitate
population health decision making action
for diabetes.
• Encourage use of a framework, such
as the CCM for adherence to clinical
guidelines and increase use of EHR best
practice advisories, dashboards, and
provider referencing of guidelines to
achieve better compliance with routine
care items such as A1C, eye/foot exams,
dental health, urine proteinuria/
nephropathy screening.
• Following the delivery system design
principles of frameworks such as the
CCM, engage clinical team members to
improve efficiency in quality care
delivery by (i.e. dentists, optometrists/
ophthalmologists, podiatrists,
pharmacists, nurses, medical assistants,
social workers, case managers, lab
technicians), to achieve more intensive
disease management and decrease
delays in implementing the most
effective care for each person
with diabetes.
• Use available telemedicine services to
improve patient access to primary
care and to assist in self-management
of diabetes.
• Establish increased dental-to primary
care provider partnerships to refer
patients at high risk to primary care
providers for potential diabetes
diagnosis/management.
• Implement mechanisms and tools
in provider practices to ensure referral
to self-management and lifestyle
management programs.
• Implement system mechanisms in
provider practices to assure all patients
with diabetes have an Emergency
Preparedness plan.
• Support CRISP and the Maryland
Institute for Emergency Medical Services
Systems (MIEMSS) in efforts to identify
and track diabetes-related patient
encounters that do not result in
emergency department visits or
hospital admissions.
Maryland Diabetes Action Plan 2020

48
Table 3: Activities for Community groups (Faith-based and community organizations, and local government)
Healthy Population Overweight/Obesity Prediabetes/Gestational Diabetes Diabetes Management
• Utilize a statewide unified healthy nutrition
messages to be used to promote knowledge and
awareness of healthy eating.
• Expand implementation of healthy cooking and
healthy eating education and skill-building offered
by evidence-based programs.
• Promote initiation of and length of breastfeeding.
• Develop and sustain a unified statewide summer
feeding program (breakfast and lunch through
summer months) in underserved communities.
• Increase access to farmers markets and the number
of farmers and urban farms participating in markets.
• Encourage community collaboration to implement
formal walking plans.
• Expand the number of physical activity and healthy
eating offerings at parks and recreation centers,
places of worship, community and civic centers,
and senior centers.
• Sponsor weight loss competitions by partnering
with community groups, and faith-based groups.
• Promote the replacement of screen time with
increased physical activity alternatives.
• Promote opportunities to use shared community
green spaces for physical activity.
• Assess the feasibility of subsidizing gym
memberships through public-private partnerships.
• Access the feasibility of increasing the use of
wearables (fitness trackers) to increase
physical activity.
• Establish community investment to support healthy
lifestyles in communities.
• Embrace shared use agreements to improve health
and equity (i.e. churches opening their center for
free exercise classes to the community).
• Establish physical activity opportunities specifically
for overweight/obese children and adults outside of
work and school.
• Advocate for and promote legislation that institutes
incentives for grocery stores to provide affordable,
healthy food options in underserved communities.
• Support counties in assessment
of county food environment by
mapping healthy food priority
areas to elucidate relationship
between food insecurity/
inadequate healthy food access
and obesity in each county
(Ex. https://planning.baltimorecity.
gov/baltimore-food-policy-
initiative/food-environment)
• Establish and promote physical
activity opportunities specifically
for overweight/obese children
and adults outside work
and school.
• Expand the implementation of
healthy cooking, teaching
kitchens and healthy eating
education and skill-building
opportunities amongst
overweight/obese adults
and children.
• Engage community health
workers (CHWs) to screen and
refer to weight reduction and
diabetes prevention programs.
• Address barriers to participating
in healthy lifestyle activities
and programs.
• Engage partners to build evidence
for diabetes prevention outcomes
on new and existing weight
management and loss programs.
• Address barriers to participation
in lifestyle programs
(i.e. transportation, childcare,
healthy food, exercise programs).
• Explore opportunities by which
certified Community Health
Workers can specialize in and join
care teams to provide a range of
diabetes-related community work,
including prevention, referral and
patient support.
• Advocate for payment models that
support diabetes education
and care delivery.
• Collaborate with health care
providers and health systems to
make linkages to home meal
services for people with diabetes.
• Use available telemedicine services
to improve patient access to
primary care and to assist in
self-management of diabetes.
• Collaborate with partners, such
as Maryland Chapter of the
American Diabetes Association to
establish support groups for
people with diabetes.
• Address barriers to participating
in healthy lifestyle activities
and programs.
Maryland Diabetes Action Plan 2020

49 Maryland Diabetes Action Plan 2020
Healthy Population
• Implement policies that support healthy eating
in institutions (vending machines, prayer
breakfasts, etc.)
• Increase access to farmers markets and the number
of farmers and urban farms participating in markets.
• Promote policies that improve the built environment
to link people to everyday destinations such as work,
school, parks and green spaces.
• Sponsor weight loss competitions.
• Promote the replacement of screen time with
increased physical activity alternatives.
• Engage partners to build evidence for diabetes
prevention outcomes on new and existing weight
management and loss programs.
• Address barriers to participation in lifestyle
programs (i.e. transportation, childcare, healthy food,
exercise programs).
• Establish walking clubs in communities.
• Establish community investment to support healthy
lifestyles in communities.

50
Table 4: Activities for Schools
Healthy Population Overweight/Obesity Prediabetes/Gestational Diabetes Diabetes Management
• Utilize a statewide unified healthy
nutrition messages to be used to
promote knowledge and awareness of
healthy eating.
• Support wellness policies and teams
that improve healthy eating in
institutions such as school cafeterias.
• Assess the feasibility of implementing
digital platforms to improve school
nutrition programs (i.e. allowing
parents and students to electronically
preorder nutritious school meals).
• Expand implementation of healthy
cooking and healthy eating education
and skill-building offered by
evidence-based programs in schools
for parents and children.
• Develop and sustain a unified
statewide summer feeding program
(breakfast and lunch through summer
months) in underserved communities.
• Implement frameworks, such as
Whole School, Whole Community,
Whole Child to increase opportunities
for healthy food and physical activity
opportunities throughout the school
day and after school.
• Promote the replacement of
non-curricular screen time with
increased physical activity alternatives.
• Promote policies that improve the
build environment to link people to
everyday destinations such as work,
school, parks and green spaces.
• Engage MSDE and others to seek
opportunities for education about and
implementation of increased physical
activity as a required element of a
school day.
• Provide technical assistance and
program development to local
education agencies wishing to
implement school based BMI
screening and/or surveillance
processes.
• Explore feasibility of incorporating
specific questions related to
prediabetes into the school physical
form and increasing the frequency
with which the forms must be
provided to schools to align with
immunization (IZ) requirements.
• Engage school-based centers to
refer children at risk of diabetes to
providers and community-based
risk-reduction services.
• Identify opportunities to utilize
Medicaid and MCO data to identify
and track children at risk for diabetes
and/or with prediabetes served in
school-based health clinic.
• Work with MSDE to expand
School-based health clinic data
collection related to diabetes risk
and prediabetes screening
and reporting.
• Advance and support public policies to
facilitate expansion of tele-health in
schools to improve access to care and
support school nurses to foster
self-management of diabetes among
students with diabetes.
• Identify opportunities for schools to
address the unique needs of students
with type 2 diabetes that focus on
healthy eating and physical activity.
Maryland Diabetes Action Plan 2020

51
Table 5: Activities for Employers
Healthy Population Overweight/Obesity Prediabetes/Gestational Diabetes Diabetes Management
• Utilize a statewide unified healthy
nutrition messages to be used to
promote knowledge and awareness of
healthy eating.
• Establish breastfeeding policies
for worksites.
• Collaborate with farmers markets
at worksites.
• Encourage multiple modes of
transportation and commuting.
• Implement policies that support
physical activity and healthy eating
in worksites.
• Assess the feasibility of subsidizing
gym memberships through
public-private partnerships.
• Assess the feasibility of increasing the
use of wearables (fitness trackers) to
increase physical activity.
• Promote stair climbing and walking
during breaks.
• Offer weight management programs
as a covered benefit and offer classes
at work.
• Expand implementation of healthy
cooking and healthy eating education
and skill-building offered by
evidence-based programs.
• Promote policies that improve the
build environment to link people to
everyday destinations such as work,
school, parks and green spaces.
• Establish community investment
to support healthy lifestyles
in communities.
• Offer diabetes prevention programs
as a covered benefit.
• Partner with a diabetes prevention
program to offer classes at work sites.
• Partner with weight loss programs.
• Provide incentives for milestone and/or
completing weight loss programs.
• Provide third party reimbursement
for nutrition counseling for overweight/
obese employees and their covered
family members.
• Screen and test employees
confidentially and refer as appropriate.
• Establish the National DPP as a benefit
option for employees.
• Connect with the Maryland Quitline for
tobacco cessation for employees.
• Offer diabetes prevention programs
free or as no/low cost covered benefit.
• Partner with a diabetes prevention
program to offer classes at worksites.
• Cover and incentivize routine
post-partum 6 week check-ups for
pregnant women.
• Allow employees to attend National
DPP and weight loss programs
during work day.
• Support persons with diabetes in
the workplace through coverage of
self-management services and
wellness programs, and
encouragement to remain
engaged with primary care providers.
• Partner with local public health to
offer recognized DSMES at work.
• Cover insulin pumps and insulin as a
copay and ensure benefits package
allows for similar co-pays on insulin
pens and syringes.
• Offer refrigerators at work for
insulin storage.
• Offset the cost of medications and
premium reductions for persons who
maintain an A1C under seven.
• Engage community partners to
provide diabetes education
to employees.
• Allow employees to attend DSMES
programs during work day.
Maryland Diabetes Action Plan 2020

52
Table 6: Activities for Health Insurance Payors
Healthy Population Overweight/Obesity Prediabetes/Gestational Diabetes Diabetes Management
• Utilize a statewide unified healthy
nutrition messages to be used to
promote knowledge and awareness of
healthy eating.
• Improve current benefit structures
to encourage prevention and health
living, such as value-added benefits to
insurance plans and employee benefits
to encourage healthy behavior change
activities and participation in
prevention programs.
• Explore expanded public and private
insurance coverage for clinically
supervised weight loss for obese
children and adults without secondary
co-morbidities.
• Establish reimbursement models
for nutrition counseling for overweight/
obese children and adults.
• Establish the National DPP as a
benefit option for employers using a
pay-for-performance model.
• Cover and incentivize routine
post-partum 6 week check-ups for
pregnant women.
• Engage partners across the state
to support payment mechanisms, that
support high quality, state of the art
diabetes care and prevention including
the use of telemedicine, case
managers, and community health
workers, and implement payment
incentives to encourage the use of
DSMES, CDSMP, and DSMP among
people with diabetes.
• Reimburse for diabetes testing
supplies and medication with no or
low cost copay.
Table 7: Activities for State Government
Healthy Population Overweight/Obesity Prediabetes/Gestational Diabetes Diabetes Management
• Utilize a statewide unified healthy
nutrition messages to be used to
promote knowledge and awareness of
healthy eating.
• Implement policies that support
healthy eating in institutions, such as
worksites, health systems, senior
centers and school cafeterias.
• Assess the food supply chain for
opportunities to address healthy food
pricing, cost of fresh fruits and
vegetables and access to healthy foods.
• Assess and forecast access to fresh
fruits and vegetables by geography.
• Advocate for and promote legislation
that institutes incentives for grocery
stores to provide affordable,
healthy food options in underserved
communities.
• Implement statewide policies that
increase opportunities for students
to be physically active throughout the
school day and after school.
• Promote policies that improve the
build environment to link people to
everyday destinations such as work,
school, parks and green spaces.
• Establish a reliable population-level
data source for child body mass index.
• Engage MSDE and others to seek
greatly increased opportunities for
physical activity as a required element
of a student’s life.
• Identify prevalence of school districts in
the state with a minimum time
requirement for physical education.
• Assess the percentage of third-party
payers covering comprehensive obesity
management services for adults
and children.
• Align quality metrics across health care
programs in Maryland to require at-risk
screening (e.g. MDPCP has proposed to
CMS to add weight assessment and
counseling as a P4P measure in 2020).
• Complete return on investment (ROI)
for Maryland diabetes prevention
efforts to track progress.
• Maintain and foster a statewide
network to increase the number of
evidence-based lifestyle change
programs, including group, virtual
and blended programs.
• Increase capacity of evidence-based
lifestyle change programs, such as the
CDC-recognized lifestyle change
program, in the state to deliver and
bill payers and insurers for lifestyle
change programs.
• Implement a communication
campaign on prediabetes to increase
screening and testing, with targeted
messages to enroll and retain
HealthChoice DPP and Medicare
enrollees.
• Build knowledge and ability of
healthcare providers to identify risk,
test at-risk people, diagnose
prediabetes, and implement practice
mechanisms to assure referral of
patients to interventions.
• Align quality metrics across health care
programs in Maryland to require at-risk
screening (e.g., MDPCP has proposed
to CMS to add weight assessment and
counseling as a pay-for-performance
measure in 2020)
• Complete return on investment (ROI)
for Maryland diabetes prevention
efforts to track progress.
• Develop and encourage use of
standardized social determinants of
health screening tools for use
statewide for all patients with diabetes.
• Convene and sustain a statewide
diabetes clinical collaborative
committee to develop universal quality
measures for diabetes.
• Encourage the use of Diabetes
Self-Management Education and
Supports, Chronic Disease
Self-Management Program, and
Diabetes Self-management program
among patients with diabetes and the
use of telemedicine/virtual methods to
improve support for self-management
of diabetes as needed.
• Explore opportunities for certified
Community Health Workers to
specialize in and join care teams to
provide a range of diabetes-related
community work, including prevention,
referral and patient support.
• Establish a diabetes platform to collect
and track data on aggregated patient
care outcomes, coordinate care across
specialties, identify gaps in care and
assure quality care.
Maryland Diabetes Action Plan 2020

53 Maryland Diabetes Action Plan 2020
Healthy Population Overweight/Obesity Prediabetes/Gestational Diabetes Diabetes Management
• Incentivize employers to encourage
multiple modes of transportation
and commuting.
• Implement the Maryland (MDOT)
Pedestrian and Bicycle Plan.
• Increase access to farmers markets and
the number of farmers and urban
farms participating in markets.
• Promote initiation of and length
of breastfeeding.
• Establish community investment to
support healthy lifestyles in
communities.
• Increase existing CDC-Recognized
Organization’s capacity to bill for new
coverage (i.e. Medicaid and Medicare)
and business acumen.
• Establish insurance regulations and
engage elected officials to introduce
new legislation related to preventing
and treating prediabetes.
• Establish data source for women
with gestational diabetes and
postpartum testing.
• Support counties in assessment of
county food environment by mapping
healthy food priority areas to elucidate
relationship between food insecurity/
inadequate healthy food access and
obesity in each county (Ex. https://
planning.baltimorecity.gov/
baltimore-food-policy-initiative/
food-environment).
• Explore expanded public and private
insurance coverage for clinically
supervised weight loss for obese
children and adults without secondary
co-morbidities.
• Maintain and foster a statewide
network to increase the number of
evidence-based lifestyle change
programs, including group, virtual
and blended programs.
• Increase existing CDC-Recognized
Organization’s capacity to bill for new
coverage (i.e. Medicaid and Medicare)
and business acumen.
• Establish insurance regulations and
engage elected officials to introduce
new legislation related to preventing
and treating prediabetes.
• Establish a data source of women
with gestational diabetes and
postpartum testing.
• Engage healthcare and WIC providers
to implement mechanisms and tools
within provider practices to test for
diabetes at 4-12 weeks postpartum for
women with history of gestational
diabetes.
• Build knowledge and ability of
providers to adhere to clinical
guidelines for women with a history of
gestational diabetes for regular testing,
healthy lifestyle support and potential
use of medication to reduce risk.
• Establish a diabetes education,
screening, and referral program in
dental practices throughout Maryland.
• Establish a data source to track adult
dental patients screened for diabetes
or prediabetes during routine
dental visits.
• Engage partners, such academia, to
build evidence for diabetes prevention
outcomes on new and existing weight
management and loss programs.
• Enable CRISP to collect and aggregate
electronic health record data from
participating clinical partners to
facilitate population health
decision-making actions for diabetes.
• Develop a health literacy program to
increase awareness of the importance
of oral health for adults at risk for
and with diagnosed diabetes and
the connection between diabetes and
oral health.
• Develop a set of guidelines for primary
care and oral healthcare providers that
includes state-specific guidance on
oral health care for adults at risk for
and with diagnosed diabetes, including
statistics on oral healthcare utilization,
clinical practice guidance, and
educational resources.
• Investigate barriers to payment
models that support diabetes
treatment and education.
• Explore reimbursement of DSMES
for Medicaid enrollees.
• Encourage use of a framework, such
as the CCM for adherence to clinical
guidelines and increase use of EHR
best practice advisories, dashboards,
and provider referencing of guidelines
to achieve better compliance with
routine care items such as A1C, eye/foot
exams, dental health, urine
proteinuria/nephropathy screening.

54
Action Plan
Diabetes
Section V:
Inventory of Diabetes-related Resources/Appendices
In June 2019, the Maryland Department of
Health (the Department) initiated a process to
inventory obesity, prediabetes, and diabetes
programs in Maryland. The aim of the inventory
is to assess the availability of programs across
Maryland that address diabetes prevention,
care, and management. While the required
level of service provision across the state
cannot be determined through the inventory
alone, the Department aims to use this process
to begin to identify gaps and opportunities to
expand efforts to address diabetes.
The scope of the inventory is all programs
serving Marylanders, including those that
serve Medicaid enrollees, Medicare
beneficiaries, commercial and small business
health insurance enrollees, and the uninsured
population. The inventory includes programs
that serve specific minority groups. The
programs are categorized according to where
the target population is situated along the
disease progression continuum: 1) Keeping
a Healthy Weight Population; 2) Reducing
Overweight and Obese Populations;
3) Prediabetes and Gestational Diabetes
Populations; 4) Managing Diabetes and
Controlling Complications. The normal clinical
management of diabetes patients within a
primary care or hospital setting was excluded
from the scope.
The Department conducted a review of a
wide range of available resources, initially
including: Community Health Needs
Assessments (CHNAs); Local Health
Improvement Plans (LHIPs); Hospital
Community Benefit Reports; Maryland
Hospital Association’s (MHA) “Innovations
for Better Health” website; the Centers for
Disease Control and Prevention’s (CDC)
national registry of all recognized diabetes
prevention programs; Maryland Community
Health Resources Commission (CHRC)
grantees; Minority Outreach and Technical
Assistance (MOTA) grantees; the American
Diabetes Association website; the American
Association of Diabetes Educators website; the
Supplemental Nutrition Assistance Program
Education (SNAP-Ed) program; the Expanded
Food and Nutrition Education Program
(EFNEP); the Curves program; the Take Off
Pounds Sensibly program (TOPS Club); and the
WW (formally Weight Watchers) program.
The Department sought input from Local
Health Departments (LHDs), Local Health
Improvement Coalitions (LHICs), and minority
outreach groups in the development of the
inventory. The Department presented its plans
for a Diabetes Program Inventory at the July
2019 Local Health Officers (LHO) Roundtable
and incorporated the feedback received at this
meeting into its approach. Jurisdiction-specific
reports of programs were shared in advance
of publication with Local Health Officers; LHIC
leaders, where these are different; and MOTA
partners. Information on additional programs
received because of this outreach is included
in the draft inventory. Through the publication
of the Maryland State Diabetes Action Plan, the
Department is now seeking input from a wider
range of stakeholders.
The inventory will continue to be refined
and updated and can be accessed at
https://phpa.health.maryland.gov/CCDPC/
Pages/diabetes-action-plan.aspx. As a next
step, the Department aims to gather more
details on the reach and capacity of diabetes
programs. Along with available data on obesity
and diabetes, the Department will use a final
inventory to generate a detailed assessment of
gaps in service provision and promote action
to address these gaps. Emphasis will be placed
on identifying data sources, including from
the school system, and developmentally
appropriate interventions for children.
Development of a Diabetes Program Inventory
Maryland Diabetes Action Plan 2020

55
Diabetes Prevention and Care
While diabetes care services have long been
part of Maryland Medicaid’s comprehensive
benefits package (COMAR 10.9.67),
145
diabetes
prevention services were recently approved
by Centers for Medicare and Medicaid (CMS)
and added as part of the HealthChoice
benefit package.
HealthChoice Diabetes Prevention
Program (HealthChoice DPP)
Maryland Medicaid has been a leader in
integrating diabetes prevention into its
HealthChoice program through its MCOs.
In 2016, through a cooperative agreement
with CDC, the National Association of Chronic
Disease Directors (NACDD) awarded funding
to Maryland Medicaid in collaboration with
the Center for Chronic Disease Control and
Prevention (the Center) to implement the
Maryland Medicaid and National DPP
demonstration. The purpose of the
demonstration was to promote Medicaid
delivery models for the National DPP through
Managed Care Organizations. Maryland
enrolled 637 HealthChoice enrollees into the
National DPP lifestyle change program during
the demonstration period. As a result of this
demonstration, the Department applied for
and received a §1115 HealthChoice
demonstration waiver amendment that
authorizes Medicaid to offer the National
DPP lifestyle change program to HealthChoice
enrollees beginning September 1, 2019.
By identifying beneficiaries early through
screening and testing for prediabetes and
referring them to the National Diabetes
Lifestyle Change Program, the Department
hopes to reduce the incidence of diabetes
and increase the quality of life for
individuals at-risk for type 2 diabetes
in the HealthChoice program.
From 2016-2018, Maryland Medicaid, in
collaboration with Maryland State Health
Department’s Center for Chronic Disease
Prevention and Control, was funded to
implement the National DPP Medicaid
Demonstration project in Maryland. The
National DPP Lifestyle Change Program is an
evidence-based program established by CDC
to prevent or delay the onset of type 2 diabetes
through healthy eating and physical activity.
Diabetes prevention programs that are
recognized by the CDC, known as
CDC-recognized type 2 diabetes prevention
programs, participated with MCOs to establish
a reimbursement mechanism within Medicaid
to administer the program. Adults with
prediabetes between the ages of 18 and
64 were eligible to participate.
Investing in Prevention Programs
10.09.67 Maryland Medicaid Managed Care Program: Benefits Authority: Health-General Article, Title 15, Subtitle 1, Annotated Code of Maryland, .24 Benefits — Diabetes Prevention and Care
Services (2019).
Maryland Diabetes Action Plan 2020

56
Acronyms
A1C Glycosylated Hemoglobin
ADA American Diabetes Association
BRFSS Behavioral Risk Factor Surveillance System
BMI Body Mass Index
CDC Centers for Disease Control and Prevention
CDSMP Chronic Disease Self-Management Plan
CHNA Community Health Needs Assessment
CHRC Community Health Resource Commission
CMS Centers for Medicare and Medicaid Services
CPSTF Community Preventive Services Task Force
CY Calendar Year
DPP Diabetes Prevention Program
DSMES Diabetes Self-Management Education and Support
DSMP Diabetes Self-Management Plan
EBT Electronic Benefit Transfer
ED Emergency Department
EFNEP Expanded Food and Nutrition Education Program
FPG Fasting Plasma Glucose
HiAP Health in All Policies
ICD International Classification of Diseases
LHD Local Health Department
LHIC Local Health Improvement Coalition
LHIP Local Health Improvement Plan
LHO Local Health Officer
MCO Managed Care Organization
MDOT Maryland Department of Transportation
MDPCP Maryland Primary Care Program
MHA Maryland Hospital Association
MOTA Minority Outreach and Technical Assistance
NACDD National Association of Chronic Disease Directors
NH Non-Hispanic
OGTT Oral Glucose Tolerance Test
P4P Pay for Performance
PMPM Per-Member-Per-Month
PQI Prevention Quality Indicator
SDOH Social Determinants of Health
SNAP Supplemental Nutrition Assistance Program
TOPS Taking off Pounds Sensibly
WW Weight Watchers
YRBS Youth Risk Behavior Survey
Maryland Diabetes Action Plan 2020

57
Contributors
Diabetes Action Team
1. Uma Ahluwalia, MSW, Principal, Health Management Associates
2. Olubukola Alonge, MD, MPH, Program Administrative Specialist, Office of Minority Health and Health Disparities
3. Craig Behm, MBA, Executive Director, CRISP Maryland
4. Noel Brathwaite, PhD, MSPH, Director of Office of Minority Health and Health Disparities
5. Ernest Carter, MD, Acting Health Officer, Prince Georges County Health Department
6. Cheryl DePinto, MD, MPH, FAAP, Director, Office of Population Health Improvement
7. Geoff Dougherty, PhD, MPH, Deputy Director, Population Health, Health Services Cost Review Commission
8. Lindsey Ferris, MPH, CPH, PMP, Program Director, HIE Projects, CRISP
9. Stephanie Garrity, MS, Special Assistant, Office of the Deputy Secretary for Public Health Services
10. Donna Gugel, MHS, Director, Prevention and Health Promotion Administration
11. Howard Haft, MD, MMM, CPE, FACPE, Executive Director, Maryland Primary Care Program
12. Debony R. Hughes, DDS, Director, Office of Oral Health
13. Lee Hurt, DrPH, MS, Director, Vital Statistics Administration
14. Mangesh Joglekar, MS, PharmBS, SSGB, RPh, Chief, Clinical Services Division, Maryland Medicaid Pharmacy Program
15. Sandra Kick, MsPH, Senior Manager, Office of Innovation, Research and Development, Medicaid, Office of Health Care Financing
16. Theressa Lee, MPA, CPHQ, Director, Center for Quality Measurement and Reporting, Maryland Health Care Commission
17. Suzan Lowry, MD, FAAP, Health Officer, Charles County
18. Mark Luckner, Executive Director, Maryland Community Health Resources Commission
19. David Mann, MD, PHD, Epidemiologist, Office of Minority Health and Health Disparities
20. Mark Martin, PhD, MBA, Deputy Director, Office of Minority Health and Health Disparities
21. Eleanor L. Mason, MSc, Health Policy Analyst Advanced, Medicaid Office of Innovation, Research, and Development
22. Deidre McCabe, Director of Communications, Maryland Department of Health
23. Clifford S. Mitchell, MS, MD, MPH, Director, Environmental Health Bureau
24. Chad Perman, MPP, Program Director, Program Management Office for Maryland Primary Care Program.
25. Sadie Peters, MD, MHS, Medical Director, Cancer and Chronic Disease Bureau
26. Frances B. Phillips, RN, MHA, Deputy Secretary, Public Health Services
27. Kristi Pier, MHS, MCHES, Director, Center for Chronic Disease Prevention and Control
28. Tiffanie Powell, Operations Coordinator, Office of Population Health Improvement
29. Annie Olle, MPP, Analyst, Prevention and Health Promotion Administration
30. Katherine Roulston, MPH, Health Policy Analyst, Office of Innovation, Research and Development, Medicaid
31. Tequila Terry, Deputy Director, Center for Payment Reform and Provider Alignment, Health Services Cost Review Commission
32. Pamela Williams, MHA, Director, Cancer and Chronic Disease Bureau
Maryland Diabetes Action Plan 2020

58
Diabetes Committee Members from the Health and Wellness Council
33. James Ebeling, MD, Veterans Administration
34. Jessica Kiel, RDN, LDN, CPT, CCRP, Clinical Research Manager, Scientific & Clinical Affairs, Medifast
35. David McShea, Executive Director, Maryland Chapter, American Diabetes Association
36. Vivienne A. Rose, MD, Director Medical Weight Loss Program, University of Maryland School of Medicine
37. Stephen Shaul, University of Maryland, Diabetes by the Numbers Podcast
38. Deanna Tran, PharmD, BCACP, Assistant Professor, University of Maryland School of Pharmacy
Maryland Diabetes Action Plan 2020
