
VERSION: April 2024
EdWorkingPaper No. 24-953
Inequity and College Applications: Assessing
Differences and Disparities in Letters of
Recommendation from School Counselors with
Natural Language Processing
Letters of recommendation from school counselors are required to apply to many selective colleges and
universities. Still, relatively little is known about how this non-standardized component may affect equity in
admissions. We use cutting-edge natural language processing techniques to algorithmically analyze a national
dataset of over 600,000 student applications and counselor recommendation letters submitted via the
Common App platform. We examine how the length and topical content of letters (e.g., sentences about
Personal Qualities, Athletics, Intellectual Promise, etc.) relate to student self-identified race/ethnicity, sex, and
proxies for socioeconomic status. Paired with regression analyses, we explore whether demographic differences
in letter characteristics persist when accounting for additional student, school, and counselor characteristics, as
well as among letters written by the same counselor and among students with comparably competitive
standardized test scores. We ultimately find large and noteworthy naïve differences in letter length and content
across nearly all demographic groups, many in alignment with known inequities (e.g., many more sentences
about Athletics among White and higher-SES students, longer letters and more sentences on Personal Qualities
for private school students). However, these differences vary drastically based on the exact controls and
comparison groups included – demonstrating that the ultimate implications of these letter differences for
equity hinges on exactly how and when letters are used in admissions processes (e.g., are letters evaluated at face
value across all students, or are they mostly compared to other letters from the same high school or counselor?).
Findings do not point to a clear recommendation whether institutions should keep or discard letter
requirements, but reflect the importance of reading letters and overall applications in the context of structural
opportunity. We discuss additional implications and possible recommendations for college access and
admissions policy/practice.
Suggested citation: Kim, Brian Heseung, Julie J. Park, Pearl Lo, Dominique J. Baker, Nancy Wong, Stephanie Breen, Huong Truong,
Jia Zheng, Kelly Ochs Rosinger, and OiYan Poon. (2024). Inequity and College Applications: Assessing Differences and Disparities
in Letters of Recommendation from School Counselors with Natural Language Processing. (EdWorkingPaper: 24-953). Retrieved
from Annenberg Institute at Brown University: https://doi.org/10.26300/pmv2-r349
Brian Heseung Kim
Common App
Julie J. Park
University of Maryland,
College Park
Pearl Lo
University of Maryland,
College Park
Dominique Baker
University of
Delaware
Nancy Wong
University of Maryland,
College Park
Stephanie Breen
University of Maryland,
College Park
Huong Truong
University of Maryland,
College Park
Jia Zheng
University of Florida
Kelly Rosinger
Pennsylvania State
University
OiYan A. Poon
University of Maryland,
College Park

Inequity and College Applications:
Assessing Differences and Disparities in Letters of Recommendation
from School Counselors with Natural Language Processing
Brian Heseung Kim
Common App
(Corresponding Author)
Julie J. Park
University of Maryland,
College Park
Pearl Lo
University of Maryland,
College Park
Dominique Baker
University of
Delaware
Nancy Wong
University of Maryland,
College Park
Stephanie Breen
University of Maryland,
College Park
Huong Truong
University of Maryland,
College Park
Jia Zheng
University of Florida
Kelly Rosinger
Pennsylvania State University
OiYan A. Poon
University of Maryland,
College Park
Draft as of April 22, 2024
1
Abstract
Letters of recommendation from school counselors are required to apply to many selective colleges
and universities. Still, relatively little is known about how this non-standardized component may
affect equity in admissions. We use cutting-edge natural language processing techniques to
algorithmically analyze a national dataset of over 600,000 student applications and counselor
recommendation letters submitted via the Common App platform. We examine how the length and
topical content of letters (e.g., sentences about Personal Qualities, Athletics, Intellectual Promise,
etc.) relate to student self-identified race/ethnicity, sex, and proxies for socioeconomic status. Paired
with regression analyses, we explore whether demographic differences in letter characteristics persist
when accounting for additional student, school, and counselor characteristics, as well as among
letters written by the same counselor and among students with comparably competitive standardized
test scores. We ultimately find large and noteworthy naïve differences in letter length and content
across nearly all demographic groups, many in alignment with known inequities (e.g., many more
sentences about Athletics among White and higher-SES students, longer letters and more sentences
on Personal Qualities for private school students). However, these differences vary drastically based
on the exact controls and comparison groups included – demonstrating that the ultimate
implications of these letter differences for equity hinges on exactly how and when letters are used in
admissions processes (e.g., among which groups of students are they used to “break ties”?). Findings
do not point to a clear recommendation whether institutions should keep or discard letter
requirements, but reflect the importance of reading letters and overall applications in the context of
structural opportunity. We discuss additional implications and possible recommendations for college
access and admissions policy/practice.
1
This work has been generously supported through a grant by the Bill and Melinda Gates Foundation. Any mistakes,
issues, and shortcomings of this work are our own.

I. Introduction
Counselors play an important role in shaping college aspirations for students (Belasco, 2013;
Clinedinst, 2019; McDonough, 2005), yet college advising from counselors is not an even playing
field. While counselors can provide high-quality guidance, connect students to resources, and serve
as advocates (Tang & Ng, 2019), they can also (knowingly or unknowingly) discourage students
from applying to four-year institutions or away from postsecondary education altogether (Linnehan
et al., 2011; McKillip et al., 2012) – discouragement that may disproportionately affect lower-income
and racially minoritized students. Counselors at lower-resourced high schools can also be limited in
the time and energy they are able to dedicate specifically to college counseling, given the vast
number of responsibilities they must attend to otherwise (e.g., class scheduling, discipline; Woods &
Domina, 2014). Despite the recommended student-to-counselor ratio being 250:1, the actual
national ratio is much higher—385:1, with major disparities noted between public and private
schools (American School Counselor Association (ASCA), 2023).
As a result, private school counselors dedicate about 65% more time to college counseling
than their public school counterparts (Clinedinst, 2019), widening already existing inequities between
public and private education. While prior research has documented numerous inequities that exist in
broader college counseling practices across school contexts and between students of different
backgrounds (Cook et al., 2018; Clinedinst, 2019; Gast, 2016; McDonough, 2005), relatively little
attention has been given to the most tangible component of the college application process that
counselors visibly shape – the counselor letter of recommendation, which is required at most
selective institutions of higher education.
For years, researchers were limited in their ability to analyze letters at large scale due to the
difficulty of gaining access to letters and the human power previously required to code thousands of
letters to conduct ecosystem-wide research. However, studies of recommendation letters (both
teacher and counselor) in specific contexts (e.g., single institutions, individual state networks) have
revealed several possible patterns of inequity and bias, such as differential topics of discussion,
differing strength or positivity of praise, and disparate narratives for student success (e.g., hard work
versus innate talent; Akos & Kretchmar, 2016; Rothstein, 2022; Schwarz, 2016). Due to the
aforementioned research challenges, prior studies on letters of recommendation have used limited
data samples, and results may not generalize to the broader population or different institutional
contexts.
With recent advances in comprehensive data collection systems and advanced natural
language processing methodologies, we now have better, albeit still incomplete, insight into the
prevalence of these dynamics. In the first large-scale study of teacher recommendation letters across
the entire U.S. context, topics of discussion were far more variable across student demographic
populations, while levels of positivity were generally very consistent (Kim, 2022). Further,
accounting for other student qualifications (e.g., academics, test scores, extracurriculars, etc.)
reduced but did not completely ameliorate said differences in topics of discussion. The first large-
scale study of counselor recommendation letters found that letter “reuse” (e.g., boilerplate language,
templates, etc.) was widespread, more common for counselors in schools serving higher proportions
of low-income students, and at least partially related to the sorts of topics of discussion covered in
the letters (Nicola & Munoz-Najar Galvez, 2022).
While these studies represent key advances in the study of college admissions, questions
remain about how other characteristics of counselor letter writing vary across demographic groups
nationally, given evidence that counselors have a vastly different caseload and approach for letters
(as reflected by the reuse of text) than teachers. Thus, in this present study we leverage the most
advanced natural language processing techniques available to analyze a sample of 615,557 counselor

letters of recommendation for students who applied through the Common Application portal during
the 2018-2019 and 2019-2020 admissions cycles. We ask the following:
1. How do characteristics of high school counselor letters of recommendation, such as length
and content, vary by school characteristics (e.g., private/public, student-to-counselor ratio),
counselor characteristics (e.g., experience writing, letter writing burden, average letter
length), and student characteristics (e.g., race/ethnicity, socioeconomic status (SES))?
2. Do student demographic differences in these letter characteristics exist even among those
letters written by the same counselor?
3. Do student demographic differences in these letter characteristics exist even among the most
competitive subset of applicants with high SAT/ACT scores?
Overall, research on counselor letters and other non-standardized components of the
application are critical in order to inform ongoing policy conversations about the future of the
college application, debates about the value of test-optional policies, uncertainty following the
Supreme Court decision on race-conscious admissions (Russell et al., 2023), and rising calls for
admissions reform with respect to wealth and legacy status (Chetty et al., 2023). Importantly, our
work here focuses solely on potential inequities in the letter writing process. Although we suggest
some implications for evaluation practices, our findings do not speak to the letter evaluation process,
nor the role that letters play in actual admissions decisions. This landscape descriptive work has
immediate implications for admissions policy and practice, and will moreover help shape how high
schools and postsecondary institutions can work to expand access and equity in the college
admissions space.
II. Literature Review
We begin with an overview of the role of counselors in college admissions and then
highlight the role of letters of recommendation in admissions, including how bias and inequity may
shape letters. Lastly, we discuss research on letters and patterns related to race/ethnicity.
IIa. The Role of Counselors in College Admissions
High school counselors play a significant role in supporting the college admissions process
(Bryan et al., 2011; Perna et al., 2008; McDonough, 1997). They help students through obtaining
SAT/ACT fee waivers, writing letters of recommendation, and providing college advising (Mulhern,
2020). Lower student-to-counselor ratios have been linked with improved test scores as well as
increased four-year college enrollment (Carrell & Hoekstra, 2014; Hurwitz & Howell, 2014; Reback
2010). Effective college counseling is especially impactful for low-income students, likely because
these students have less access to guidance through other means. In one study, counselor
effectiveness was linked with enrolling in a more selective institution for high-achieving students; for
racially minoritized students, gains were even greater if they had a counselor of the same race
(Mulhern, 2020). In another study, adding a counselor to school staff was linked with an increase of
10 percentage points in four-year college enrollment (Hurwitz & Howell, 2014).
However, not all students have access to effective or supportive counselors. Low-income
students of color, especially those at urban schools, report feeling under-supported by their
counselors in the college application process (Cook et al., 2021; Gast, 2021). Counselors may also
subtly or explicitly discourage low-income and Black students (including high achieving Black
students) from considering four-year and/or selective institutions (Linnehan et al., 2011; McKillip et
al., 2012). Significant disparities in college admissions counseling exist between low versus high SES
high schools (Clinedinst & Koranteng, 2017; McDonough, 2005; Perna et al., 2008). Private schools

typically have a counselor staff that is mostly or exclusively devoted to college admissions
counseling, providing highly individualized support and attention with relatively low caseloads of
students (McDonough, 1997; Weis et al., 2014). Many affluent students also hire private, non-school
affiliated college counselors or coaches for additional support (McDonough et al., 1997;
McDonough, 2005). In contrast, many public school counselors have to dedicate more time to
issues like discipline, course registration, and social services, over college admissions, although some
better-resourced public high schools have counselors who focus mainly on college admissions
(Clinedinst & Koranteng, 2017). Although the recommended student-to-counselor ratio is 250:1, the
national ratio on average is much higher—385:1, with major disparities between public and private
schools (ASCA, 2023; Clinedinst & Koranteng, 2017).
IIb. Letters of Recommendation in the College Admissions Process
These disparities have ramifications not just for college counseling, but the letters of
recommendation that counselors submit as part of students’ applications to selective colleges.
Analyzing applications submitted through the Common Application platform, Nicola and Munoz-
Najar Galvez (2022) found that counselors from large public schools were most likely to reuse text
in letters of recommendation, reflecting their limited time to dedicate to college applications. With
more schools engaging in test-optional and test-free admissions, letters of recommendation and
other submitted materials may play an increasingly important role in admissions (Mulhern, 2020;
Rosinger et al., 2021). In theory, letters can provide deeper insights into who a student is, capturing
non-cognitive information which cannot be measured through GPA or test scores (Kuncel et al.,
2014; Oliveri & Ezzo, 2014). In one study, letters were more highly correlated with high school
grades and personal statement scores than with standardized test scores (Kuncel et al., 2014). Still,
the authors note that letters are affected by numerous issues such low reliability between writers.
Another study found that “. . . there is more agreement between two recommendations written by
the same person for two different applicants than there is between two people writing
recommendations for the same person” (Baxter et al., 1981 as cited in Aamodt et al., 1993, p. 82).
Competitive colleges are more likely to utilize letters of recommendation because they have
so many applicants with high levels of academic achievement (Schwarz, 2016), making factors
beyond grades and test scores more relevant for distinguishing among similarly competitive
applicants. For example, experts in the Students for Fair Admissions (SFFA) v. Harvard (2023) Supreme
Court case
2
found that letters of recommendation from teachers and counselors, among other
materials like personal essays, were considered in a “personal rating” assigned to applicants
Arcidiacono, 2018; Card, 2017). They also found that higher personal ratings were correlated with a
higher likelihood of admission. Accordingly, 61% of colleges reported placing considerable or
moderate importance on counselor letters when reviewing applications (Clinedinst & Koranteng,
2017). Counselor recommendations were the fourth most important factor in admissions decisions
cited, following grades, curriculum strength, and test scores (Clinedinst & Koranteng, 2017). Chetty
et al. (2023) estimate that about 30% of the admissions advantage accrued by students from the top
1% of household incomes can be attributed to non-academic traits gleaned from evaluation of
extracurriculars, letters of recommendation, and other sources, and much of the differential was
mediated by private school attendance.
2
The Supreme Court merged SFFA’s federal complaints against Harvard and the University of North Carolina at Chapel
Hill. In June 2023, the Court ruled against even a narrow consideration of race in college admissions. However, Chief
Justice Roberts ended the majority opinion by stating “…nothing in this opinion should be construed as prohibiting
universities from considering an applicant’s discussion of how race affected his or her life, be it through discrimination,
inspiration, or otherwise.”

Some institutions view letters of recommendation as a tool that can help reduce equity gaps
in enrollment by providing greater insight into applicants (Oliveri & Ezzo, 2014). However, highly
selective institutions that reported weighing subjective factors (i.e., those gleaned from interviews,
letters of recommendation, and essays) more heavily had lower rates of Pell Grant enrollment,
although there was no evidence of a relationship with underrepresented racially minoritized (URM)
student enrollment (Rosinger et al., 2021). Private institutions, especially highly selective colleges and
universities, placed greater weight on such factors than public institutions (Rosinger et al., 2021).
Letters of recommendation may exacerbate inequity by favoring students who are already
privileged in the college admissions process. Schwarz (2016) delineated several ways letters
advantage this group. First, private school teachers and counselors often receive more time and
additional compensation (i.e., summer pay) to write letters, helping them to write higher-quality
recommendations. Second, private schools have smaller school and class sizes, allowing teachers and
counselors to get to know their students better, which can affect letter quality. This dynamic is
especially pertinent to counselor letters, given disparities in student-to-counselor ratios (ASCA,
2023). Third, counselors at affluent schools have more experience writing letters targeted to selective
institutions because they have longstanding relationships. They know how to write in a way that will
catch reviewers’ eyes, which Schwarz (2016) refers to as “shared language” (p. 184). Counselors and
teachers at “feeder schools” (i.e., elite private high schools) can also have established relationships
with admissions officers at elite colleges (Schwarz, 2016, p. 34), which often host annual visits and
tours for feeder school personnel. As such, admission officers often trust the credibility of the letters
written by counselors or teachers that they have established relationships with (Nicklin & Roch,
2009; Posselt, 2018). All of these components make letters of recommendation a vehicle that
perpetuates inequity (Schwarz, 2016).
On top of the multiple inequities that influence counselors and counselor letters, counselors
themselves may be vulnerable to race and class-related bias. Implicit bias is pervasive within the
general population (Starck et al., 2020). Racial bias is magnified when people have to make split-
second decisions, and the limited attention and time that many counselors have for each student
may result in greater bias (Payne, 2006). Unfortunately, numerous studies document how K-12
teachers exhibit racial bias towards racially minoritized students (Cherng, 2017; Chin et al., 2020;
Dee, 2005; Gershenson et al., 2016; Quinn, 2020; Redding, 2019). Similar trends exist for
counselors, as reflected in racial inequity in school discipline, academic tracking, Advanced
Placement (AP) courses, and referrals for gifted education (Francis et al., 2019; Grissom & Redding,
2016; Linnehan et al., 2011). Such racism may influence college advising. As noted earlier,
counselors were more likely to recommend community college to high-achieving Black students
than White students (Linnehan et al., 2011). Taken together, these dynamics can contribute to the
phenomenon of undermatching outcomes for Black and Latinx students (Kang & García Torres,
2021).
IIc. Trends in Letters of Recommendation Related to Race and Class
Race and class may be relevant to letters in several ways (Kim, 2022; Polanco-Santana et al.,
2021). Insights can be gleaned from research on letters of recommendation for medical residency
and other contexts (Brown et al., 2021). Grimm et al. (2020) investigated 2,624 letters written for
736 diagnostic radiology residency applicants in 2015-2016, finding that male and senior rank faculty
used more agentic terms such as ethic, confidence, and leadership potential to describe White and
Asian/Asian American applicants, compared to Black and Latinx applicants. Examining 2,625 letters
for an academic orthopedic residency program, Powers et al. (2020) discovered that letter writers
used more standout words (e.g., amazing, exceptional, outstanding, remarkable, superb) to describe
White applicants, but described students of color with more grindstone words (e.g., hardworking,
dedicated, diligent, organized, persistent). In a study of internship applications, letter writers
emphasized White students’ cognitive ability, insight, productivity, and perception while describing
non-White students with more communal words that highlighted their positive emotion; trends were
consistent regardless of GPA (Houser & Lemmons, 2018).
Related to class, within a pool of applicants to highly selective colleges, Chetty et al. (2023)
found that students in the top 1%, and especially the top 0.1%, of household incomes were notably
more likely to receive the strongest ratings for both counselor and teacher recommendations, even
when controlling for standardized test scores. About 36% of students from the top 0.1% of
households received a top counselor rating versus about 30% for students from the top 1% of
households.
Several studies document race-related patterns in letters in the collegiate setting. In SFFA v.
Harvard, Asian American students received weaker ratings on counselor letters (Arcidiacono et al.,
2022), possibly because White applicants to elite institutions are more likely to come from private
school backgrounds (44%) than Asian American applicants (24%) (Park & Kim, 2020). In a study of
13,000 letters from teachers and guidance counselors submitted to a selective institution, teacher
letters for students from private high schools were longer and generally more positive (Schwarz,
2016). Letters for students of color contained more neutral language, while female students were
described more positively. Akos and Kretchmar (2016) analyzed 4,792 letters for applicants to a
selective public university in the Southeast. Teacher recommenders were found to use slightly fewer
grindstone words (e.g., hardworking, dedicate, diligent, organized, and persistent) when they
described Black, Latinx, and Indigenous students. The differing findings from these studies may be
partially attributable to the idiosyncratic samples to which researchers could gain access.
More recent research has used NLP techniques (Fesler et al., 2019) to analyze even larger
samples. Drawing on applications from the University of California, Berkeley in 2017, Rothstein
(2022) found that letters written for URM students (including low-income, first-generation, and
underrepresented racially minoritized students, as well as those from under-resourced high schools)
were minorly distinctive and slightly weaker than those written for non-URM students. Additionally,
URM students with average-quality letters received better application outcomes (i.e., higher ratings,
higher probability of admission) when their letters were included in the application but better
outcomes were not associated with letter strength. Analyzing letters for 1.6 million students to 800
postsecondary institutions written by 540,000 teachers, Kim (2022) found salient linguistic racial and
gender-related trends in letters written by teachers. Overall, Black students’ letters contained fewer
positive sentences and slightly more negative sentences. Teachers emphasized Black students’
community engagement and leadership more than their academics, particularly in letters to highly
selective institutions. Asian/Asian American students’ letters were slightly more positive than White
students and teachers highlighted community engagement, extracurriculars, STEM subjects, and
future potential in their letters more so than for White students. Asian/Asian American students'
letters contained less emphasis on intellectual promise but there was no difference in
personal/character-based topics (e.g., character excellence, diligence, conscientiousness,
commitment) in letters to highly selective institutions.
While the latter studies yield critical insights, no study to date has sought to analyze large-
scale patterns related to race and SES in letters written by high school counselors in a
comprehensive national sample and while controlling for additional features of students and their
counselors. Letters submitted by counselors provide a unique vantage point since they compare
students to a broader range of their peers and/or the student body as a whole, versus teachers, who
generally compare students to other students in their classes. Counselors are less likely to give strong
ratings than teachers within the elite college applicant pool (Arcidiacono, 2018), possibly because
most counselors are comparing students within a larger pool of peers than teachers. Whether
counselor letters are vulnerable to manifestations of inequity is unknown and speaks to the need for
the current study. Previous studies have also been limited in access to student applications, as well as
the ability to process millions of applications. Our study will combine human qualitative coder
insight with NLP techniques that allow us to identify trends within a much larger database,
advancing research on non-standardized components of the college application.
III. Conceptual Framework
We adapt Kim’s (2022) framework delineating the potential role of bias in letters of
recommendation from teachers to explain how bias, inequity, and other conditions may be related to
letters written by high school counselors, in Figure 1 below.
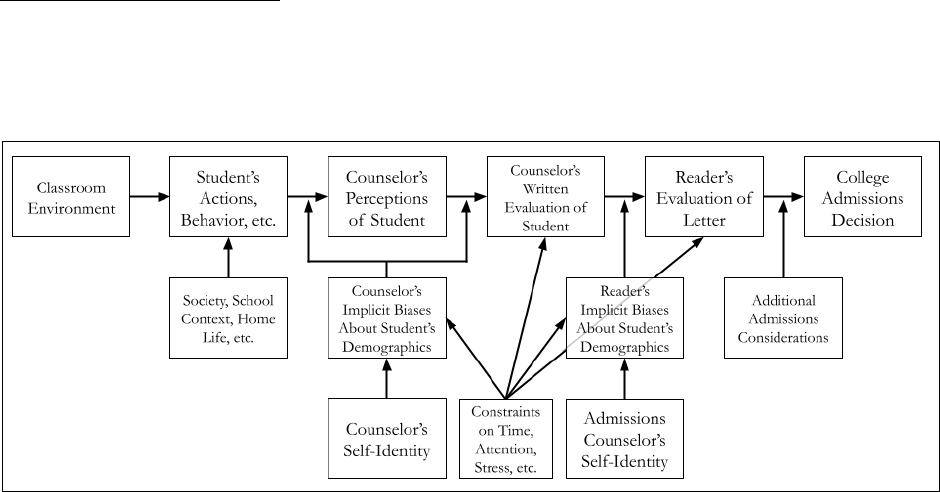
Figure 1. Conceptual Framework for Counselor Letter Writing
Running along the top-most row from left-to-right, this model conceives of the letter writing
process in three stages: the concrete actions taken by and context surrounding the student, the
process of writing the letter about the student by the counselor (which is not necessarily a
perfect/accurate reflection of the first stage), and the reading of the letter from the counselor by the
admissions official (which is not necessarily a perfect/accurate reflection of the second stage). These
stages ultimately result in some kind of influence on a final admissions decision for the student in a
specific institutional context.
The first stage (concrete actions taken by the student) is shaped by myriad contextual
factors, relatively few of which are known to or observed by the counselor, and thus are strongly
affected by existing inequities in our society and educational systems more broadly. What the
counselor perceives about the student is then an imperfect representation of all the contextual
knowledge that they are aware of, adjusted by the biases and perceptions that the counselor may
hold about the student’s demographic group(s) (Devine et al., 2012; Kang & Banaji, 2006). As
shown in the model, such biases and perceptions are further shaped by an individual’s own
racial/ethnic identity. For example, Black teachers are known to have higher expectations for Black
students than non-White teachers (Gershenson et al., 2016), highlighting how self-identification
could influence perceptions of students, which may in turn influence letters. That being said, shared
identity does not necessarily imply a lack of implicit biases. We theorize that such biases can impact
both how a counselor perceives the student’s behaviors and actions, as well as what becomes salient
to them about the student while actually writing the letter (e.g., selective memory).

Additionally, we propose that key external conditions influence manifestations of bias and
inequity in the letter writing process, as well as characteristics of letters such their length or
personalization. These conditions include the time and attention that letter writers can devote to
getting to know students and writing letters, as well as external stressors that affect their ability to
personalize their work. For example, Nicola and Munoz-Najar Galvez (2022) found that public
school counselors from large high schools are more likely to reuse text from recommendations,
reflecting how such counselors shoulder large caseloads and have less time for individualizing letters.
Limitations on time and attention can also exacerbate bias, because having less time to get to know
students on a more individual level can result in assumptions being made about a student due to
their background, whether positive or negative (Payne, 2006).
Finally, many of these exact same dynamics relating to constraints on time/attention/etc.
and implicit biases then have a parallel role to play in the reading of the letters by college admissions
office staff. As we do not have insight into how the letters we examine in this study are evaluated,
we cannot speak to nor account for this stage of the letter process, and include it here only to make
evident that limitation, opportunity for future study, and potential practical implications.
In adapting Kim’s model to guide analyses, we control for key variables such as academic
performance and college readiness indicators (i.e., reflecting how a student’s actions and behaviors
would influence a counselor’s perceptions of a student), as well as a student’s race/ethnicity as an
imperfect but relevant proxy for patterns that may reflect bias and inequity. Finally, we consider the
role of constraints on counselors’ time and attention by controlling for conditions in high schools
that likely influence these dynamics (e.g., public or private, observed student-counselor ratios among
college-appliers, etc.). Key limitations include our inability to control for a counselor’s specific
racial/ethnic self-identification, as well as complimentary data that could capture levels of implicit
bias. However, about 74% of ASCA members identify as White (ASCA, 2023), suggesting that most
counselors writing letters are White.
IV. Methods
IVa. Data
As with our recent paper on extracurricular activities (Park et al., 2023), our dataset consists
of de-identified applications submitted through Common App during the 2018 (Fall of 2018
through Spring of 2019) and 2019 (Fall of 2019 through Spring of 2020) application cycles.
3
These
application data include nearly all submitted components for each student, such as academics,
course-taking, standardized test scores, and demographic information. Moreover, the dataset
includes all information submitted via the Common App on the student’s behalf, to include their
counselor recommendation form and letter. The counselor recommendation form itself asks a series
of questions about a student’s academic background (e.g., class rank and GPA, largely serving as
reinforcement and verification of the academic data the student submits themselves), whereas the
letter is a more open-ended space for counselors to submit their evaluations of the student.
4
3
While the 2019-2020 application cycle was partially affected by the onset of the COVID-19 pandemic, the
overwhelming majority of our sample applicants from this season (>99%) had already submitted their application prior
to February of 2020 – well before most U.S. communities began any semblance of pandemic response.
4
Those familiar with the Common App recommendation process also know that counselors can optionally rate a
student’s character across a variety of measures (e.g., “Maturity,” “Leadership”, “Academic Potential,” and so on) on a
likert scale. As these are not required and thus not systematically complete for all students, we do not currently rely on
these data in our present analysis. We hope to analyze these data more directly in future work.
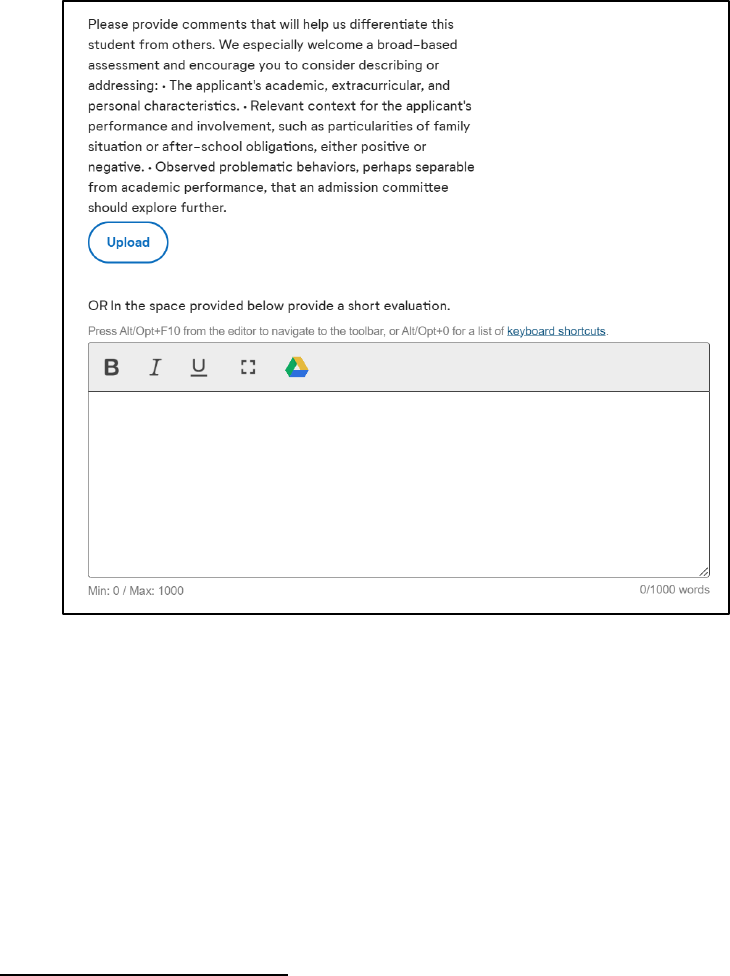
Figure 2 below displays the interface that counselors navigate for the letter submission
process. Note that counselors can submit their letter through two distinct means: a document
upload (which is immediately converted to PDF format) or an open-text response field. Counselors
can also decline to submit a letter on the student’s behalf even if they complete the rest of the
recommendation form.
Figure 2. Counselor Letter Submission Interface
Importantly, these two separate submission types result in us receiving vastly different de-
identified
5
text data; the PDF letters must be analyzed through an optical character recognition
algorithm to turn the PDFs back into analyzable text, whereas the open-text response field does not.
Counselors are also far more likely to include additional text like school letterhead, school addresses,
dates, and so on, than in the open text response field. Finally, the open-text response field enforces a
1000 word limit on length, whereas the PDF letters do not. As a result, these two formats require
substantially distinct text cleaning operations to filter down to the “real” content of the letter for us
to analyze, and may not even necessarily be comparable. For this study, we thus focus only on the
PDF letters, which constitute about 90% of the counselor letters submitted via the Common App,
to avoid comparing across these meaningfully distinct formats.
6
5
Common App uses the proprietary Amazon Comprehend service to detect and remove personally identifiable
information (addresses, phone numbers, names, etc.) from all text before it is received by analysts.
6
It is also important to note that public school counselors seem to be meaningfully more likely to submit their letters via
the open-text response field than via the PDF letter format. Nonetheless, it remains the case that the overwhelming
majority of letters submitted by public school counselors are submitted in PDF letter format.

IVb. Data Splitting
One crucial issue in this analysis with immediate repercussions for our study sample is that
we conducted a complex series of text cleaning and text analysis operations to prepare our data for
hypothesis testing. While p-hacking and similarly motivated analyst decision-making are always a
concern in research, research on text data is especially vulnerable to these threats because cleaning
and modeling text data is necessarily a bespoke and contextually-driven process. For example, it may
be the case in a given context (and it is the case in ours) that the text data include certain undesirable
data artifacts like school mottos embedded in a PDF’s header. Removing these data artifacts requires
systematic cleaning code that is necessarily trial-and-error and idiosyncratic (even “hacky”) and can
be difficult to evaluate for its true effect on the data or analyses downstream. Thus, even in the best
of cases, analysts can unknowingly “bake in” (or, conversely, “bake out”) a desired or expected data
relationship by virtue of their text cleaning and modeling decisions.
Per recommendations from Egami et al. (2022), we attempt to counteract these concerns
using a “development” and “analysis” split with our data sample (sometimes instead referred to as
“training” and “testing” in data science and machine learning). That is, we randomly split the text
data into two groups; on expectation, text formatting issues and other data artifacts that need to be
addressed should then be evenly distributed across these two groups. Rather than iteratively create
our text cleaning and modeling code on the entire dataset altogether, we develop these processes only
using the development subsample. Only when the entire cleaning and analytic pipeline is completely
finalized (to include the procedures for hypothesis testing and regression analyses we intend to run)
do we then feed the analysis subsample through this same pipeline without any alterations.
7
This then
prevents several of the aforementioned issues, as text cleaning and modeling needs to be sufficiently
generalizable enough to apply to text data never seen before (as long as it is presumably similar in
form and style to the development text data given the randomization process). Put another way, it is
much more difficult for analysts to over-optimize their text cleaning and modeling code for desired
hypothesis testing outcomes.
All that said, the exact methodology of the split is highly consequential. As we ultimately
intend to deploy a counselor fixed effects regression analysis strategy (motivated and described in
more detail later in Section IVd), it is crucial to maximize cell sizes at the counselor level. If we
randomize at the unit of letters into development and analysis subsamples, this approach would split
up a given counselor’s letters into each subsample and reduce our power to detect relationships
when using counselor fixed effects in the final analysis subsample. Instead, we randomize at the unit
of counselors into the development and analysis subsamples, such that if a counselor is randomized
into one subsample, so are all of their letters and students.
8
We moreover stratify this randomization
procedure by the number of PDF letters and open-text response letters they wrote in our sample to
ensure that lower- and higher-volume counselors for both letter types were represented in both
subsamples.
Finally, we decided to randomize 10% of counselors into the development subsample and
90% of counselors into the analysis subsample. This is ultimately an arbitrary decision, but the goal
is to maximize the size of the final analysis subsample while still maintaining sufficient variation and
7
For those who inspect our online codebase, you’ll see that minor alterations were necessary in the case of the topic
modeling and sentiment analysis procedures only to account for the vastly larger data size – handling these data required
a batch-analysis approach not necessary for the development sample. These adjustments were manually verified to cause
no changes to the output of either analysis.
8
Note that in this strategy, it is thus the case that we may split high schools across development and analysis subsamples in
circumstances where there are multiple letter-writing counselors in a given school. We ultimately choose not to use high
school fixed effects as high schools are generally fixed within counselors, and so it is largely duplicative of counselor
fixed effects; as such, splitting high schools across subsamples is not a concern for our analysis.

volume in the development sample to adequately capture the breadth of text data idiosyncrasies and
issues. Given the overall size of our dataset (described in more detail in Section IVc immediately
following), 10% should be more than adequate, representing 59,776 letters from 4,707 counselors
across 3,859 high schools. This same split ratio also seemed to work well in parallel related work by
the lead study author on teacher recommendation letters (Kim, 2022).
IVc. Present Study Sample
While the data we have on hand include all applications started or submitted in this
timeframe, we focus our study on students in these years who submitted a complete application
(hereon referred to as “applicants”) to at least one highly selective four-year institution (admit rate of
40% or lower), as motivated in Section III. Given the study timeframe, we use data on
undergraduate admission rates from the 2019 Integrated Postsecondary Education Data System to
determine which institutions meet the institutional selectivity criterion. We moreover limit our study
to domestic applicants
9
who had a complete counselor recommendation letter (in PDF format) of
substantive length
10
submitted on their behalf to examine trends in counselor letter writing trends in
the U.S., specifically.
Our overall sample thus contains 624,108 total applicants (and their corresponding
counselor letters), or approximately 35% of domestic applicants on the Common App platform
during the 2018 and 2019 application cycles (or 29% all applicants, domestic and international
combined).
11
Of these 624,108 total applicants, 59,776 were randomized into the development
subsample, while the remaining 564,332 were randomized into the analysis subsample. All results
and analyses discussed and displayed in the main narrative were conducted using the
analysis subsample unless otherwise noted; parallel tables and figures for the development
subsample are available upon request.
Table 1 below displays summary statistics for our present sample of focus. The first column
of each panel displays sample statistics for applicants in the 2018 year, the second column displays
sample statistics for applicants in the 2019 year, and the third column displays sample statistics
across both years combined.
9
We rely on the Common App’s currently operationalized definition for domestic applicants: students who are either
U.S. Citizens (living domestically or abroad, and whether sole or dual-citizens) or otherwise permanent residents of the
U.S. (whether documented or undocumented). In other words, we exclude students who claim sole citizenship to a
country besides the U.S.
10
We define substantive length in this context as containing at least 4 sentences of at least 20 characters each after the
text cleaning processes are completed. These thresholds were set somewhat arbitrarily based on the ad hoc reviews of
letters above and below these thresholds; those below the threshold were overwhelmingly erroneous (e.g., composed
entirely of gibberish text due to the PDF reading process) or unanalyzable (e.g., a counselor submitting only the single
sentence “I do not know this student adequately enough to evaluate them” despite not checking the option to opt-out of
writing a letter entirely).
11
Though it is the case that applicants may apply across multiple seasons, we include only the most recent application
we observe from a given applicant in our sample. Internal analyses at Common App show that students we observe
multiple times are often first Juniors testing their options before a “serious” application season their Senior year, in
which case their Senior year data are most updated and complete.
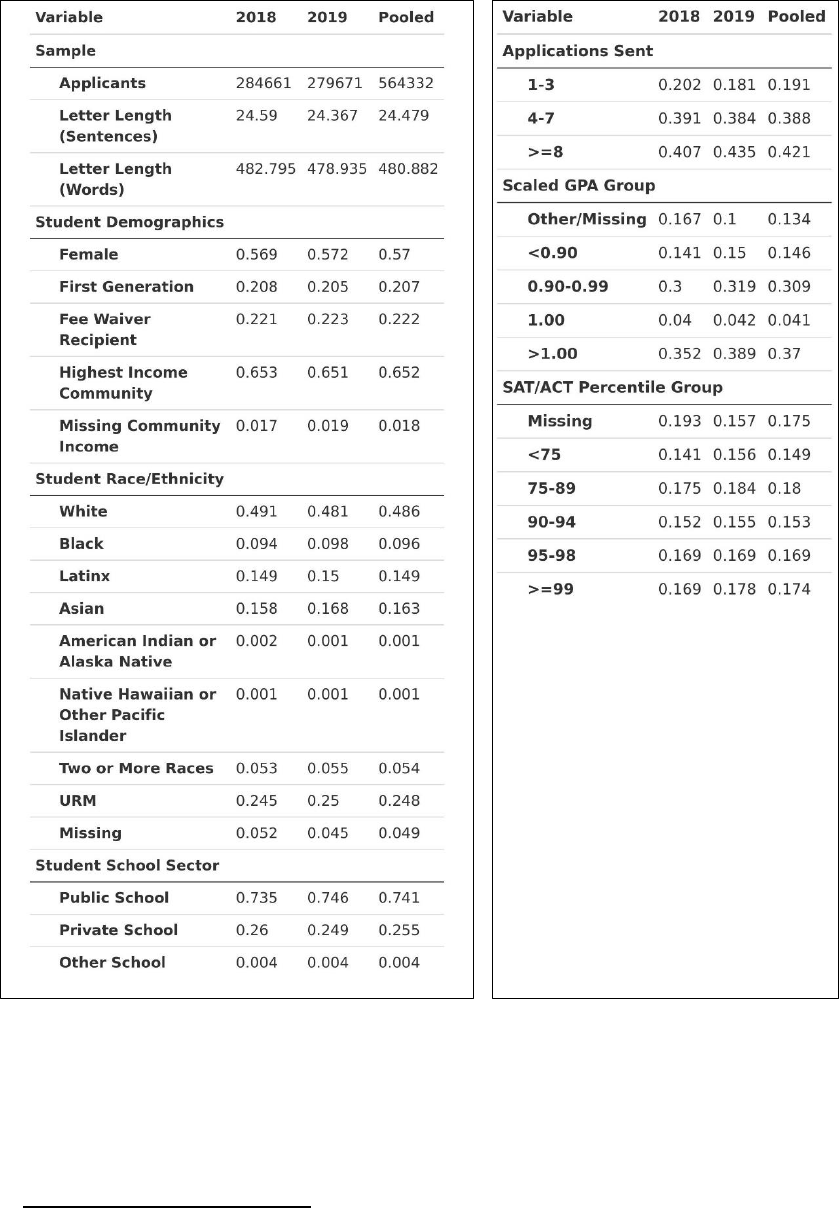
Table 1. Applicant Sample Descriptive Statistics
Beginning with the demographics of the sample, the sample is skewed slightly female at
57%, and only 21% of the sample identified as first-generation.
12
To examine applicant income
levels, we rely on two separate measures. First, we use the Common App’s primary measure of low-
12
As the Common App only includes four-year institutions, our definition of first-generation more specifically implies
that students reported that no parent completed any four-year degree – whether in the United States or outside of it.

income status, eligibility for a Common App application fee waiver,
13
and find that about 22% of the
sample identified as low-income. Because we are also interested in high income status, we merged in
ZIP code level median household income data from the U.S. Census to create a rough proxy for
each applicant’s community income level. To simplify this measure, we created a binary measure for
whether an applicant lives in a ZIP code in the top quintile of ZIP codes with respect to median
household income, which we interpret as living in one of the highest income communities in the
U.S.; importantly, this indicates community income level, rather than individual income level. The
general Common App population already skews towards higher income communities, but our
sample does so even more: the majority of applicants (65%) in our sample come from high income
communities. Continuing with race/ethnicity, about half of our sample identified as White; about
25% of the sample identified as an underrepresented racially minoritized (URM) group.
14
About
74% of applicants went to a public school, while 26% went to a private/independent school.
Turning now to some of the application behaviors and academic measures for our sample,
we see (in the left panel) that each applicant’s counselor letter was an average of about 24
substantive sentences, representing a total of 13,814,613 substantive sentences in our dataset. In the
right panel, we observed that this sample of applicants also tended to submit greater numbers of
applications: 19% submitted only 1-3 applications, 39% submitted 4-7, and 42% submitted 8 or
more (Common App allows applicants to submit no more than 20 total in a given season).
Applicants also submitted their cumulative GPA alongside their GPA scale; we created a common
“scaled GPA” where a value of 1.0 indicates the top of their grade scale (e.g., a 4.0 on a 4.0 scale).
We removed obviously erroneous values (e.g., scaled GPAs higher than 1.5 and lower than 0.5)
given the likelihood of reporting issues in these instances, though allow for values higher than 1.0
given the prevalence of weighted GPA schemes. In all, we see more than a third of our sample
reported values higher than 1.0, and only 15% reported a value below 0.9 (roughly equivalent to
having just below an A- average on a standard 4.0 scale). Given that the vast majority of our sample
submitted applications prior to the onset of the COVID-19 pandemic (and the ensuing change of
many institutions to test-optional policies, as well as disruption in testing center availability), a full
82% of our sample submitted either an SAT or ACT score as part of their application. By this more
standardized metric, our sample is also relatively high-achieving given that just over 17% reported a
score at the 99th percentile or higher, and about half reported a score at least at the 90th percentile.
Table 2 shows descriptive statistics related to the counselors in our sample, again split by year
and pooled. As such, all statistics below are currently calculated using the data we have available
directly through the Common App dataset.
13
Applicants self-identify as eligible for the fee waiver, and eligibility criteria include common indicators like receipt of
an SAT/ACT test fee waiver, receipt of free or reduced price lunch, receipt of public assistance, participation in a low-
income student program like TRIO, and so on.
14
We use the conventions employed by the National Science Foundation: applicants identifying as Black or African
American, Latinx, Native American or Alaska Native, or Native Hawaiian or Other Pacific Islander are classified as
URM applicants.
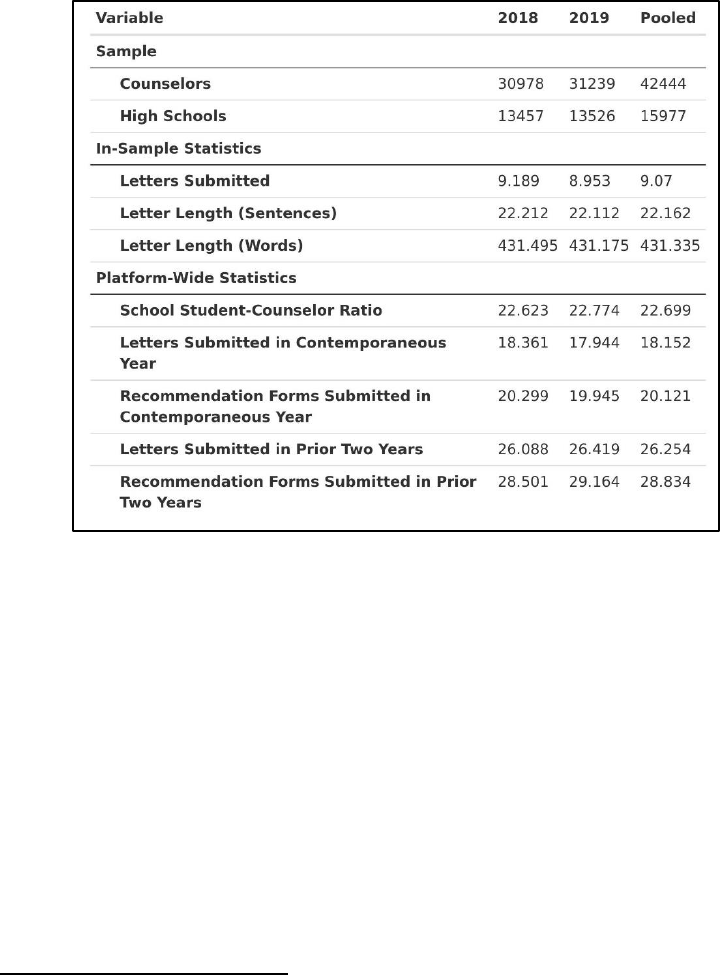
Table 2. Counselor Sample Descriptive Statistics
First, we observed a total of 42,444 distinct counselors in our sample from 15,977 distinct
schools.
15
Considering only those students and letters included in our actual study sample,
counselors in our sample wrote an average of 9.07 letters of approximately 22 substantive sentences
in length.
16
Zooming out to the full Common App dataset, the average counselor in our sample was
embedded in a high school where there were about 23 students who submitted a completed
application for every counselor on the platform. This number is importantly distinct from nationally
reported student-counselor ratios given that it exclusively reflects data from the Common App
platform and thus looks only at (a) students from a school who are applying to college via the
Common App, and (b) counselors at a school who are completing recommendations for students on
the Common App.
17
Moreover, the average counselor in our sample wrote a total of 18 letters in a
given year when looking across all applicants on the platform, out of a total of 20 recommender
forms submitted. These statistics give a sense of overall counselor “burden” or “load” in a given
year (i.e., how their time may be split across many students). We can also calculate how many letters
and forms a counselor completed on the platform over the prior two years to get a sense of counselor
15
Note that the 2018 and 2019 columns do not sum to the pooled column for the number of counselors and schools
due to the fact that many counselors and schools appear in both years of the data. This is intuitive if counselor turnover
is relatively low from year-to-year and a given school consistently has students applying to college through the Common
App from year-to-year as well.
16
Interestingly, this differs from the student-level statistic for letter length because it is calculated at the counselor-level,
which weights observations differently. That this statistic is smaller than the student-level statistic likely indicates that, in
general, counselors who wrote more letters actually wrote longer letters (i.e., when letter length is averaged at the student
level, the many longer letters written by fewer counselors tip the average up; when collapsed to the counselor-level, they
are weighted relatively lighter and thus the average is tipped back down).
17
We rely on this platform-based proxy because it is available for all schools, whereas more standard student-counselor
ratios tend to only be available for public schools in national datasets; this would thus make unusable nearly a quarter of
all letters in our data for ensuing analysis.

“experience” instead.
18
On average, a counselor in our sample wrote 26 letters across all students on
the platform out of 29 completed recommendation forms.
IVd. Text Analysis Approach
To analyze the content of counselor recommendation letters in our sample for systematic
differences by student demographics, we deployed a two-stage approach. First, we used an NLP
technique known as topic modeling to assess the extent to which each individual letter discusses
various substantive topics of conversation. Second, we then used those topic modeling measures for
each letter as the outcomes of a regression with a variety of student and counselor characteristics as
the controls to assess systematic differences across these characteristics.
19
To describe our NLP topic modeling approach in more detail, it can be illustrative to discuss
how we would approach this analysis in an ideal world where we had infinite researcher capacity to
manually read every single letter in our sample through a qualitative grounded theory lens. In such a
circumstance, we might first task a team of readers to review a randomly or purposively selected set
of letters and get a sense for the general themes present in the data. That team of researchers might
then meet to discuss said themes and establish alignment on a tentative framework for identifying
when a certain theme is surfacing in the data, perhaps on a sentence-by-sentence basis. After
establishing this framework, the reading team could then review a new sample of letters to practice
and validate the framework, before eventually meeting again and updating the framework as needed
in alignment with their new experiences and perspectives. Once that framework has been solidified
and harmonized, the readers might go on to read the remainder of the letters, and the resulting codes
for each sentence could be analyzed in a more quantitative manner via regression analyses or other
statistical techniques.
While we do not have infinite researcher capacity, modern NLP techniques are beginning to
offer approximations of this process using a family of approaches known as “topic modeling” in
conjunction with a Computational Grounded Theory framework (Nelson, 2020). In this context, we
are deploying a specific implementation of topic modeling from Grootendorst (2022) dubbed
“BERTopic.” This particular implementation is attractive because it leverages the most recent
advances in NLP (the “transformer” neural network architecture per Vaswani et al., 2017) that allow
for more contextual analysis of the meaning of a given word, phrase, and sentence, which better (but
not perfectly) captures important language nuances like negation, sarcasm, and multiple word
definitions, above and beyond word frequency based approaches such as structural topic modeling
(Roberts et al., 2019) or the Linguistic Inquiry and Word Count (or LIWC; Tausczik & Pennebaker,
2010).
On an intuitive level, BERTopic attempts to first “read” each sentence of text provided to it,
translating the sentence’s meaning into numbers by characterizing it across hundreds of numeric
18
We focus only on the past two years because the data to track counselor identities and forms change systematically
when looking earlier than the 2016-2017 application season. As such, we can’t currently look more than two years prior
to the 2018-2019 season without undergoing substantial additional data cleaning.
19
While sentiment analysis is another attractive NLP technique to apply to these evaluative letters, prior work by Kim
(2022) found that negative sentences are exceptionally rare in the parallel teacher recommendation context. Moreover,
sentiment analysis cannot adequately explain when a negative (or neutral) sentence is actually beneficial to a student. For
example, a sentence describing a student’s difficult financial circumstances would likely be read by the algorithm as
negative, but nonetheless this sentence might serve to support the student’s consideration by admissions officials.
Similarly, a sentence about a student’s transferring of schools would likely be read as neutral by the algorithm, but again
could be beneficial for the student’s consideration by admissions officials. The ambiguity of whether more neutral or
negative sentences (and thus fewer positive sentences) is thus conceptually muddy enough that we opted not to include
these sentiment analyses here for clarity and concision.

indices from 0 to 1.
20
Once this process is complete, the algorithm clusters sentences with similar
numeric indices together in this multi-dimensional space through standard clustering procedures (in
this case, HDBSCAN as developed by Campello, Moulavi, & Sander, 2013). A strong assumption of
the algorithm is that sentences clustered together because of these numeric indices will also share
some interpretable or substantive commonality in topic of discussion (e.g., “athletics” versus
“community service”). Thus, once the sentences are clustered, we as human analysts must attempt to
assess the extent to which this assumption seems to hold true in the output of the algorithm: do
sentences assigned to a given cluster actually “hold together” in any interpretable way? Then,
pending these checks, what is the substantive topic of discussion for a sentence assigned to a given
cluster? If not, the BERTopic algorithm can be adjusted in a variety of ways, as there is no single
“best” set of parameters to deploy for a given set of text data. In a process that loosely mirrors the
solidification and harmonization steps in the infinite researchers hypothetical, a human analyst must
iteratively and manually “fine-tune” the BERTopic parameters over a series of several attempts to
maximize the extent to which the topical framework that BERTopic has created seems to align with
substantively interesting and relevant themes to humans in the data.
Ultimately, we can use BERTopic’s output to first identify major topics across counselor
recommendation letter sentences, and then identify which sentences fall into which topics.
21
This
parallels the sort of output produced by the aforementioned hypothetical scenario with infinite
researchers, facilitating statistical analyses like regression and comparisons across student
populations. However, BERTopic should never be thought of a “drop-in” replacement for rigorous
qualitative reading, and this sort of approach will never be able to match the nuance, care, and
contextual understanding of a human on a case-by-case basis; even so, we lean on BERTopic to
balance the need for scale and nuance within the realm of feasibility. We would look forward to
partnering with peer qualitative researchers in the future for more focused study with these data.
In applying this approach to our specific data context, our research team constructed a single
unified coding scheme for topics surfaced by BERTopic – informed by over a dozen model
iterations and extensive manual reading of sentences to exhaustively account for all common topics
we repeatedly saw across readings and model runs. With this codebook created, we were ultimately
able to evaluate each BERTopic model on two key dimensions: the extent to which it was able to
adequately capture topics we knew to be present in the data (i.e., to what extent did it surface the
same topics we identified in our codebook), and the extent to which its judgments aligned with a
trained team of human coders looking at the same sentences (i.e., how often does the algorithm
agree with what a human would say about a given sentence’s topic?).
To this first key dimension (to what extent did the algorithm surface the same topics we
identified in our codebook), Table 3 below describes in detail the codebook scheme we created for
topics in our dataset, as well as selected keywords that our final BERTopic model found to be highly
representative of each for illustrative purposes. Each shaded partition corresponds respectively with
one of four broad categories of topics in order: Academics, Extracurriculars, Personal Qualities, and
Other. There was no topic in our codebook not represented in the final BERTopic model.
22
20
We leverage the SentenceTransformers library to conduct this step of the analysis, known more formally as
constructing Sentence Embeddings. Our main model uses the “all-mpnet-base-v2” pre-trained model derived from
Microsoft’s work, though we also tested the “all-distilroberta-v1” pre-trained model derived from HuggingFace’s work.
21
Importantly, because BERTopic is able to create extremely granular and even idiosyncratic topic clusters, we group
substantively related clusters together into a “supertopic” to maximize interpretability. All references to “topics” in this
paper are referring to these aggregated supertopics.
22
BERTopic’s clustering algorithm also allows for sentences to not be assigned a topic at all, which can present a threat
to our analysis somewhat similar in nature to data being missing-not-at-random. That being said, we find that an
overwhelming minority of sentences fall into this category (~2.5% of all sentences analyzed, or an average of half a

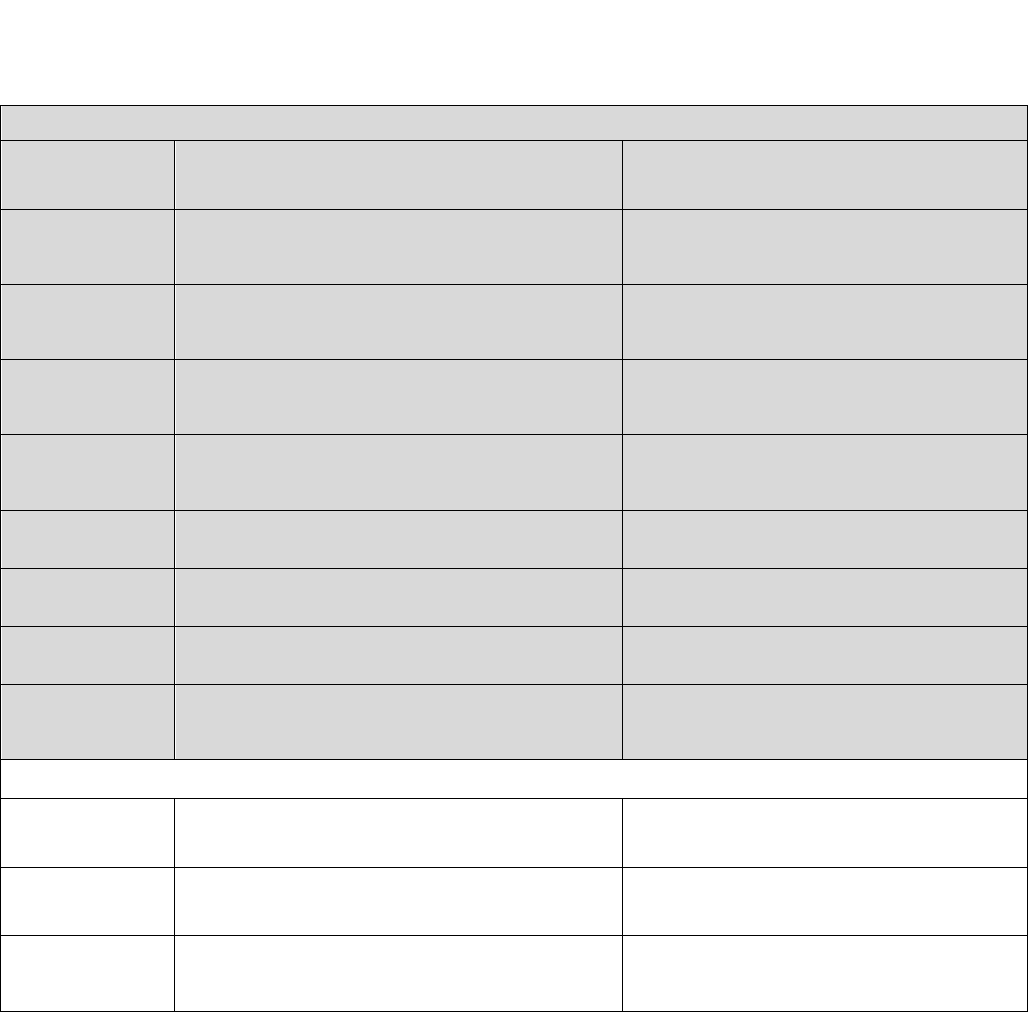
Table 3. Topics of Interest in Counselor Letter Data
Topic Name
Description
Selected Representative
Keywords/Phrases
Academic Topics
Academic
Excellence
Explicit discussion of a student’s GPA, grades, awards,
and other indicators of academic success and
excellence
GPA, weighted, average, ranked, grade
point, academically, transcript, national
honor society
Advanced Course-
taking
Discussion of rigorous course-taking patterns and
AP/IB/Honors curricula
AP, courses, honors, advanced, placement,
IB, diploma, baccalaureate, challenging,
demanding
College Readiness
Explaining that a student is ready for the rigors of a
college curriculum academically
Student ready, ready, prepared, college
Humanities
Discussion related to humanities coursework or
academic activities based in humanities (e.g.,
journalism)
Editor, law, newspaper, writing, English
teacher, yearbook, journalism, literature
Languages
Discussion of languages spoken and language study
(inclusive of ASL)
Spanish, French, Chinese, fluent, AP
Spanish, culture, language culture, AP
Spanish, Mandarin, immersion
STEM
Discussion of STEM-related coursework or academic
activities based in STEM (e.g., robotics club,
environmental science, etc.)
Medical, computer, math, robotics, physics,
environmental, engineering, math,
mathematics, doctor, surgeon, health, career,
design, geometry
Classroom
Behavior
Descriptions of a student’s contributions to their
classroom environment, participation, etc.
Discussions, teachers, class discussions,
insightful, classroom
Other (Academic)
Anything related to the category of academics, but not
in one of the specific topics listed
Business, finance, marketing, major,
entrepreneurship, engineering, computer,
law, political science
Extracurricular Topics
Arts
Theater, studio arts, music performance, etc.
Music, band, ballet, dance, film, video,
production, industry, dance team, drawing
Athletics
Sports, team leadership, game schedules
Team, varsity, captain, volleyball, football,
track, swimming, tennis, black belt, riding
Community
Engagement
Community service activities, volunteering, service
trips, etc.
Volunteered, church, club, food, community
service, faith, animals, camp, raised, cancer,
organization
Employment
Statements related to a student's job or employment
(inclusive of internships)
Parttime, job, restaurant, local, store,
worked, jobs
Other
(Extracurriculars)
Other extracurricular activities like Quiz Bowl, clubs,
etc. (besides sports, volunteering, humanities, STEM,
and arts)
Extracurricular activities, balance, involved,
activities
sentence per student). While systematic missingness could bias our results, the magnitudes here are such that all of the
main findings we highlight in the narrative would not change even in the worst case scenario of “perfectly biased”
differential missingness.
Personal Qualities Topics
Campus
Contribution
Potential
Statements related to a student being an asset to a
given college community
Campus, college, asset, confident, believe,
addition, university
Character
Excellence
Descriptions of a student’s high character, maturity,
etc.
Kind, smile, humor, friendly, respectful,
student grow, compassionate, personality,
people, come mind
Future Success
Potential
Statements about a student’s likely success and
trajectory in future studies, career, etc. overall
Confident student, future, look forward,
continue, successful, forward, believe
student
Goal Orientation
Statements about a student’s ability to set and meet
ambitious goals, determination, etc.
Goals, hard, challenges, achieve,
management skills, sets high, high
expectations
Intellectual
Promise
Statements about a student’s intellectual characteristics
like curiosity, wisdom, growth-mindset, etc.
Creative, learning, ideas, opinions, thinker,
learning, knowledge, curiosity, analytical,
insightful
Leadership
Statements about a student’s leadership capacity, roles,
or responsibilities
Leadership, leader, natural, leadership skills,
leads example
Relationship to
Student
Statements about the counselor's relationship to the
student, how long they've known them, etc.
Known student, school counselor, met
student, known years, pleasure getting know
Resilience
Statements about a student’s resilience to setbacks,
difficulties, challenges, etc.
Resilience, learned, overcome, adversity,
obstacles, struggled
Student
Background
Context
Statements about a student’s circumstances, personal
hardships, family responsibilities, health, home life,
school transitions, etc.
Diagnosed, father, twin, difficult, cultures,
new school, immigrants, different cultures,
traveling
Other Topics
Formal
Recommendation
Statements of formal positive recommendation about
the student ("I give this student my highest
recommendation…")
Recommend, admission, enthusiastically
recommend, highest recommendation
Letter Formalities
Generic phrases and sentences as part of the
recommendation letter form (e.g., “Please don’t
hesitate to contact me if you have questions”)
Contact, questions, feel free, regarding
student, hesitate, thank you, consideration
Other (Other)
Miscellaneous topics of conversation that don't fit well
into any other category or topic
Counseling, student senior, superintendent,
school district, college counseling, fax
number
To this second key dimension (how often does the algorithm agree with what a human
would say about a given sentence’s topic?), we conducted a rigorous human-algorithm validation
process to better understand how the algorithm’s output compares to that of a human reader. To
start, we trained a total of 6 researchers in the use of our codebook (all from the set of coauthors on
this paper) in classifying real letter sentences from the development subsample data. We then
created a stratified random subsample (stratified on student sex, URM race/ethnicity, and
public/private school attendance) of sentences from the development subsample that all researchers
examined and classified in their own judgment. There were 100 “common” sentences that all 6
researchers coded, and an additional 400 that were coded only by one researcher each.
With the “common” sentences, we first moved to measure inter-rater reliability among the
human team with Light’s Kappa (essentially, the average level of agreement across each pairwise set
of raters; Hallgren, 2012). Given that reasonable people can disagree about the primary topic of any
one sentence, this human-only IRR value would establish a realistic baseline for how to appraise the
algorithm’s performance – put another way, 100% agreement with humans is an unrealistic target
for the algorithm if humans cannot achieve that level of agreement with one another. We can then
see how these IRR values change when we add in the actual algorithm’s output; a meaningful
decrease in the IRR once the algorithm is added would suggest it disagrees with the human raters
more than the human raters disagreed with one another, while no change would suggest it disagrees
with the human raters about as often as the human raters disagreed with one another.
We can moreover benchmark the algorithm’s actual performance against a series of
hypothetical scenarios to serve as additional points of comparison for IRR performance: one in
which the algorithm just randomly guesses a random topic from the set of possible topics, one in
which the algorithm provides a random guess pulled from the distribution of human ratings, one in
which the algorithm “cheats” by selecting the topic that would result in the lowest level of agreement
with the human raters (what we can think of as the hypothetical floor for IRR with the algorithm),
and one in which the algorithm “cheats” by selecting the topic that would result in the highest level of
agreement with the human raters (what we can think of as the hypothetical ceiling for IRR with the
algorithm).
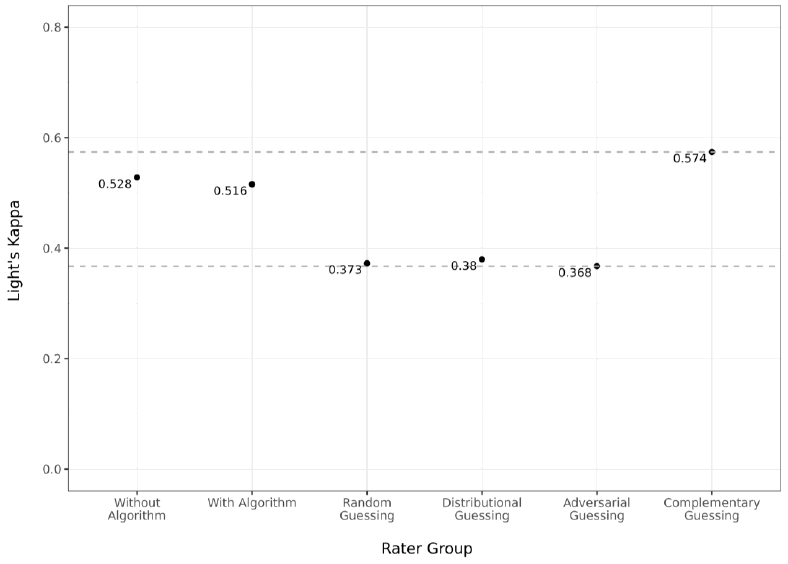
In Figure 3, we find that the algorithm generally agrees with humans at roughly the same
level that humans agree with one another: the human-only IRR was 0.528, while the IRR with the
algorithm was only slightly lower at 0.516. For context, the hypothetical lowest IRR possible was
0.368 (“adversarial guessing”), while the highest possible was 0.574 (“complementary guessing”).
This shows that while it was hypothetically possible for the algorithm to perform better, its
performance is quite close to as good as we could have hoped in comparison to other human raters.
Figure 3. Inter-rater Reliability Statistics Across Varying Group Scenarios, All Topics

For those who may be concerned at the overall level of IRR here (some researchers suggest
a threshold of 0.6 or higher for strong reliability), we can also simplify our topic assignments instead
to a broader category of topic: Academics, Extracurriculars, Other, and Personal Qualities. Thus, we
are making less specific arguments about what a sentence is about, but are doing so with greater
reliability. Figure 4 displays the results of this exercise, revealing as expected that the humans-only
IRR rises substantially to 0.658 (from 0.528), and the IRR rises to 0.633 with the algorithm included
(from 0.516). The theoretical upper bound for IRR here is 0.695, while the theoretical lower bound
is 0.419. Note here that the IRRs of random and distributional guessing rise as well – given that
there are so many fewer options to guess from, this is an expected mechanical relationship.
Figure 4. Inter-rater Reliability Statistics Across Varying Group Scenarios, Broad Topic
Categories
Importantly, we stratified the random sample of sentences being examined by humans
specifically to also assess the extent to which the algorithm may exhibit a degree of algorithmic bias;
that is, might the algorithm perform better for students of one demographic over another? In Figure
5, we find that this is not the case for student sex or public/private school status, and, interestingly,
also that our IRR with the algorithm is meaningfully higher for URM students versus non-URM
students.
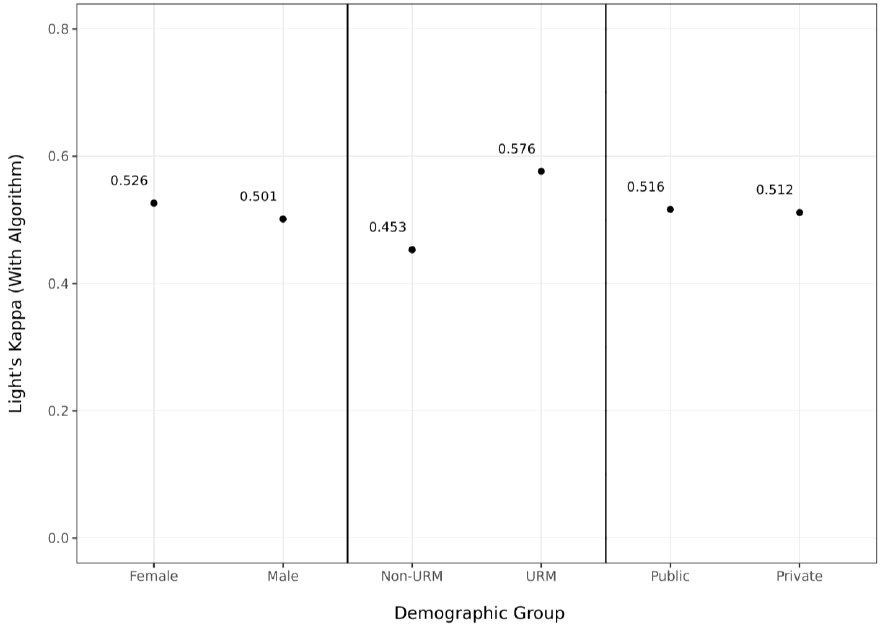
Figure 5. Inter-rater Reliability Statistics Across Student Demographics, With Algorithm
That being said, we actually see that this pattern exists even among only our human coders,
as shown in Figure 6. Therefore, it may be the case that the addition of the algorithm does not
exacerbate this issue in any meaningful way. In other words, the demographic IRR issues shown in
Figure 5 seem to be driven as much by the human coders as it is by the algorithm. This could be an
artifact of the 100 sentences we ultimately sampled, in that there just happened to be more
ambiguity in the sentences from non-URM students by chance, resulting in “true” grounds for
disagreement, or due to systematically different styles of writing when counselors write about non-
URM students that produces greater ambiguity or complexity in interpretation. This seems unlikely
to be driven by biases present in our human readers, as readers had no access to student
demographic information throughout this process (besides student pronouns used in the sentences).
Further, we manually verified that there were no obvious clues about student race/ethnicity in the
sentences themselves.
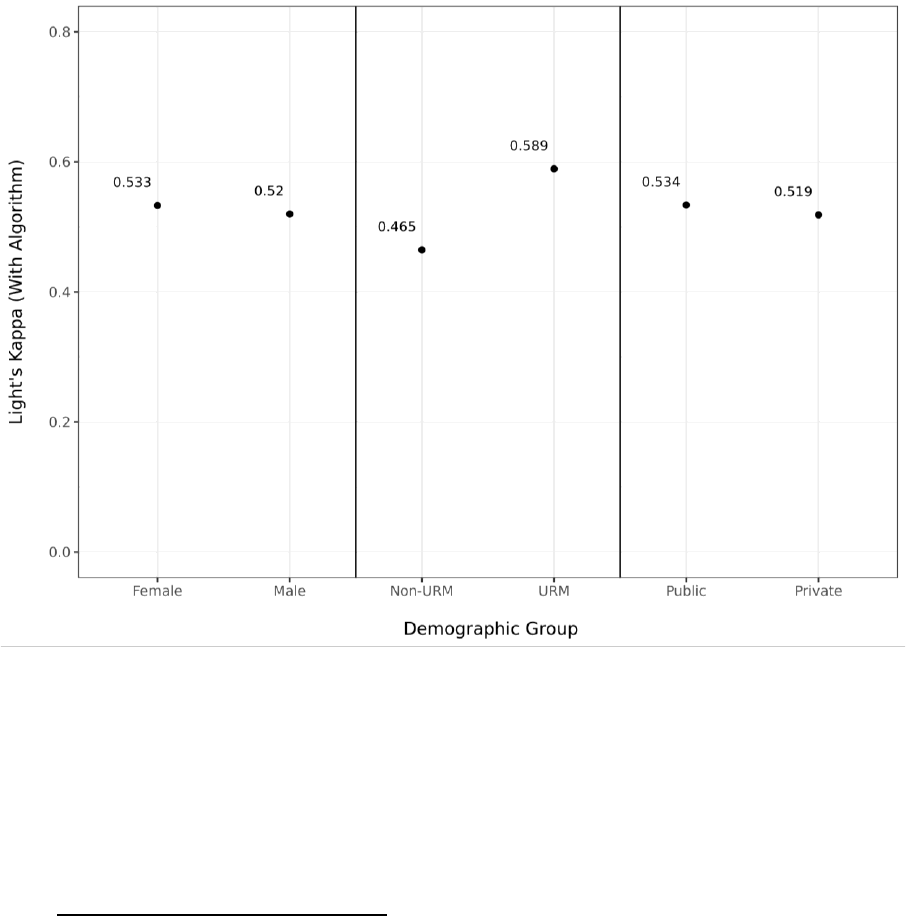
Figure 6. Inter-rater Reliability Statistics Across Student Demographics, Without Algorithm
Altogether, these results show that the algorithm performs well in the context of natural,
expected disagreement among humans about how sentences should be categorized. These validity
examinations should not conceal the fact that all results in this paper hinge quite firmly on the
nuances and idiosyncrasies of this specific model, and further study is required to understand how
best to make results more robust to modeling decisions in the NLP pipeline. It should also be noted
that our results with respect to student race/ethnicity should be approached with caution given
some of the IRR differences we surfaced above.
IVe. Regression Analysis Approach
Once each sentence of each letter has been analyzed by BERTopic, we then have an
estimate, for each student, of how many sentences in their letter discuss each topic in Table 3. From
here, we treat these values as the outcomes of several progressively more stringent regression
models to assess whether, and when, we observe demographic differences in the prevalence of each
topic of discussion.
Our first model is our most naïve model, in which we control only for a single demographic
characteristic (e.g., first-generation status) and a handful of student characteristics unrelated to
demographics: whether the student was a senior, whether the student attended multiple high
schools, and whether their letter had a substantial proportion of its text removed during the text
cleaning process. This allows us to examine whether there are demographic differences in letters at a
broad population level, but does not attempt to control for any other student characteristics in these
comparisons.
Our second model is identical to our first, except that we include all demographic
characteristics together in the same model. This allows us to compare demographic differences while
holding constant the other demographic characteristics of interest. For example, do we still observe
differences related to race/ethnicity in the prevalence of a given topic of discussion while holding
constant characteristics like first-generation status and income? This helps better account for
dynamics like systematic SES-related differences across race in our examination of either
demographic group.
Our third model adds a series of school and counselor characteristics, which currently
consists of all the Platform-Wide variables reported in Table 2 above (e.g., student-counselor ratio,
letters written in past two years, etc.) plus school sector. This regression approach better gets at the
question of: do we still observe demographic differences in the content of letters when accounting
for things like a counselor’s past experience in writing letters, and their current load of writing letters
in a given year? We might expect it to be the case that counselors with less time and experience write
systematically different letters than those with more of both, which may exacerbate dynamics like
racial and gender bias (Correll et al., 2007); this would be especially important to account for given
prior research into disparities in student-counselor ratios and workloads by race and income across
schools (Gagnon & Mattingly, 2016) and aforementioned dynamics of letter “templating” (Nicola &
Munoz-Najar Galvez, 2022). This model helps us get at the question of whether observed
differences related to race, sex, and SES in letters could be driven by access to school resources and
counselor staffing.
Our fourth model captures the same spirit of Model 3 in attempting to account for
counselor characteristics and circumstances, but instead deploys more restrictive counselor fixed
effects to do so. We can roughly interpret the results of this model as asking: do we still observe
demographic differences in letter content even when focusing on letters written by the same counselor?
This helps better isolate unobserved characteristics about the school and counselor (as schools are
fixed within counselors, and we can no longer account for school characteristics like sector) such as
counselor race/ethnicity and sex, a counselor’s tenure in a given school, and so on. Importantly,
note that the counselor fixed effects approach changes the effective sample size for the estimation of
demographic differences, and moreover changes how we should interpret the external validity of the
results. That is, a difference in letters between URM and non-URM students can only be estimated
among those counselors who wrote letters for both URM and non-URM students; this approach will
then drop counselors who only wrote letters for one group or the other, and as such this estimate
cannot be thought to include the absolute extremes in terms of student demographic composition
for counselor caseloads.
Finally, our fifth model relies on the same controls as Model 4, but focuses solely on the
subset of students who reported a test score in the 95th percentile or higher (roughly a 1430 or
higher out of 1600 on the SAT for the 2018-2019 administrations), which we interpret as a highly
competitive, college-bound subsample of students. The intention here is to non-parametrically and
parsimoniously attempt to control for a variety of observed and unobserved student academic
characteristics like GPA, advanced coursetaking, and so on – without making strict and likely
untenable assumptions about the functional form relationships between these academic
characteristics and letter characteristics. Put another way, we are asking: do demographic differences
in letter content still exist when focusing on letters by the same counselor, for students in a similar
caliber of academic competitiveness with respect to college applications?
Importantly, every one of these regression models are descriptive in nature, and cannot
speak to causal relationships between letter content and student or counselor characteristics. Just as
crucially, we cannot observe how the letters are evaluated by admissions readers; all we can remark on
is descriptive dynamics in the letter writing process as we observe with the data we have available. To
be clear, we cannot speak directly to the potential impact of letter differences on important
outcomes like admissions probability.
For our analysis, we use these regression models in three stages to examine letter content.
First, we use the outcome of overall number of sentences (letter length). Once we examine any
disparities in the overall length of letters, we can roughly decompose these analyses further into the
four broad topic categories (Academics, Extracurriculars, Personal Qualities, and Other) to see if
differences in letter length are driven by one broad category more than others. And then within each
broad topic category, we can see if disparities in that broad topic category are driven by one specific
topic more than others. Table 4 below more visually displays the hierarchy of decomposition
described here. Importantly, a lack of disparity in one aggregated “layer” of this analysis does not
necessarily preclude the possibility of large disparities in the decomposed “layer.” For example, it
could be that some students receive letters with many more sentences about Academics and fewer
sentences about Extracurriculars, while other students receive letters with many more sentences
about Extracurriculars and fewer sentences about Academics. The overall sentence length would
appear similar between the two groups, masking this important difference.
Because of the sheer volume of topics we analyze, we cannot adequately report and interpret
results for every single topic in the main narrative. In Appendix VIIa Figures A1-A6, we illustrate
descriptive demographic differences across every topic of interest (which also serves as a rough
replication of the uncontrolled topic modeling analysis from Nicola & Munoz-Najar Galvez, 2022).
We then focus our main narrative results based on the topics that made up the greatest share of
sentences in our data, displayed the most salient differences per this descriptive exploration, and/or
had highest theoretical relevance per our literature review. In the main narrative, we address: the
overall count of sentences; our three broad categories of Personal Qualities, Academics,
Extracurriculars; and the detailed topics of Humanities, STEM, Classroom Behavior, Arts, Athletics,
Character Excellence, Intellectual Promise, and Leadership. Table 4 displays in white those
topics/outcomes we examine in the main narrative of this paper. Topics/outcomes displayed in gray
are available upon request. The average number of sentences in each group are displayed in
parentheses.
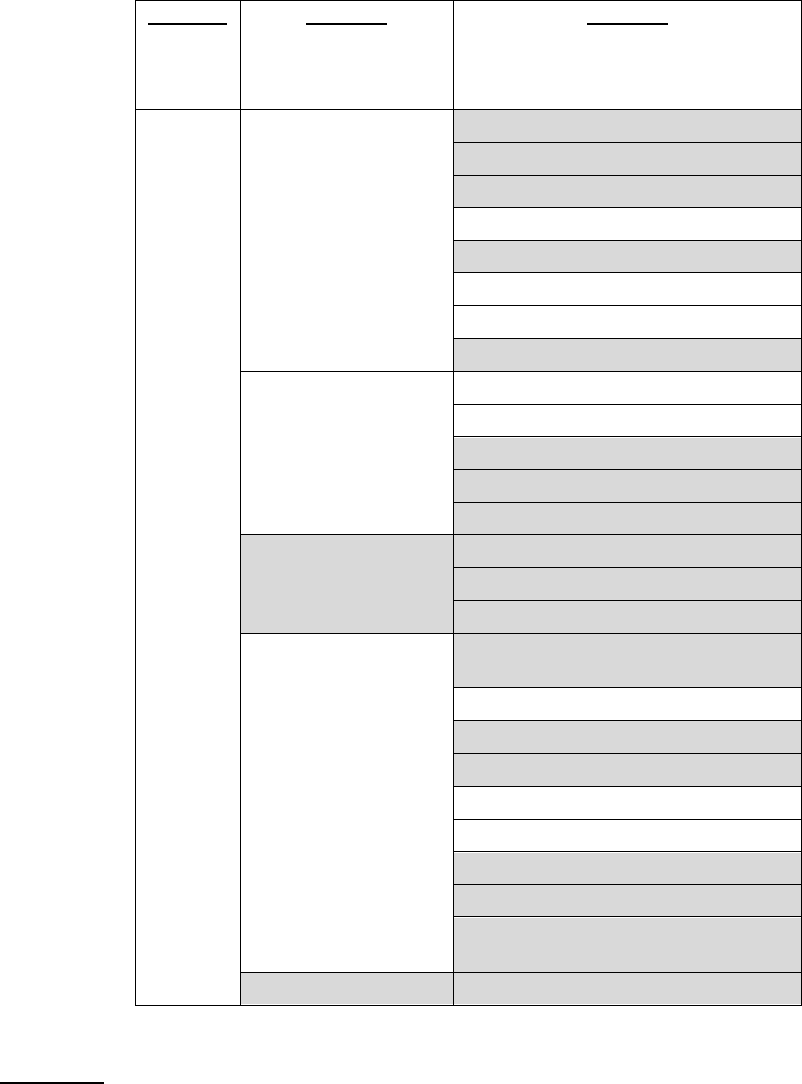
Table 4. Letter Content Measure Decomposition Diagram
Layer 1:
Letter
Length
Layer 2:
Overarching
Topic Category
Layer 3:
Specific
Topic Name
Overall
Sentence
Count
(24.48)
Academics
(5.58)
Academic Excellence (1.39)
Advanced Course-taking (1.29)
College Readiness (0.2)
Humanities (0.47)
Languages (0.21)
STEM (1.23)
Classroom Behavior (0.5)
Other (Academics) (0.28)
Extracurriculars
(4.74)
Arts (0.89)
Athletics (1.38)
Community Engagement (1.76)
Employment (0.3)
Other (Extracurriculars) (0.41)
Other
(2.28)
Formal Recommendation (1.33)
Letter Formalities (0.38)
Other (Other) (0.58)
Personal Qualities
(11.29)
Campus Contribution Potential
(0.97)
Character Excellence (3.32)
Future Success Potential (0.59)
Goal Orientation (1.57)
Intellectual Promise (1.05)
Leadership (0.94)
Relationship to Student (0.91)
Resilience (0.81)
Student Background Context
(1.12)
Missing Topic (0.6)
Missing (0.6)
V. Results
To begin our review of the results, Table 5 reports regression results for each specification
described above for the outcome of total substantive letter sentences. Each column represents a
different regression specification (with the exception of Model 1, where each cell is actually a
different regression for each separate demographic variable) with a shorthand description of the
controls included in the bottom few rows.
Beginning with first-generation differences as an illustration, we can move left-to-right
seeing how the coefficient estimate changes with each progressively added set of controls. In Model
1, we estimate that letters for first-generation students have on average 2.355 fewer substantive
sentences than letters for continuing-generation students. This is a statistically significant result, and
one that is substantively meaningful given a relative magnitude of 9.6% versus the sample average of
24.48. When we include all demographic controls together in Model 2, the coefficient declines in
magnitude to -1.117, indicating that a large proportion of the naïve difference from Model 1 is
captured by relationships with other variables like sex, race, and income. Including school and
counselor covariates in Model 3 reduces the magnitude of the coefficient further to only -0.601,
indicating that some degree of the difference here is likely driven by variation in school resources
and counselor staffing and experience patterns. That it decreases in magnitude only slightly to -0.489
for Model 4 suggests that within-counselor differences in letter writing across first-generation status
make up the majority of what was captured in Model 3. Interestingly, the coefficient stays roughly
the same size at -0.452 in Model 5, indicating that focusing only on higher-achieving competitive
students makes almost no difference for ameliorating within-counselor disparities by first-generation
status. That said, the relative magnitude of this difference is substantially smaller than the naive
difference at only 1.8% of the sample mean.
Turning now to other trends of interest, we see similar trajectories for the coefficient on
students identifying as Black or African American, Asian, Hispanic or Latinx, and American Indian
or Alaska Native. The coefficient begins relatively large and meaningful, but progressively reduces in
size through Model 5, with White students serving as the reference group. This trend seems to
indicate that disparities in letter length by student race/ethnicity when compared with White
students are not solely driven by any one factor (e.g., student demographics, school/counselor
characteristics, the individual counselor, or academic performance), but instead are related to all of
the above, and are generally less prevalent among letters written for the highest performing students
by the same counselor. That said, if letters are not evaluated in that context (e.g., admissions readers
are not trying to “norm” their interpretation of a letter by comparing it against other letters written
by the same counselor – which is possible given the number of applications read by each reader, and
geographic region assignments in many selective admissions offices), the racial disparities observed
in Models 1 and 2 may remain issues of concern.
The coefficients on Female and Fee Waiver Receipt students take the opposite trend: they
start negative or insignificant in Model 1 and progressively get larger by Model 5. This indicates that
these students are actually receiving slightly longer letters the more we account for school/counselor
and academic characteristics compared with male and fee waiver non-recipient students. Exactly
what drives these differences will be clearer as we examine the specific topic composition later on.
The largest coefficients by far within each model/column are for private school students.
Private school students seem to have letters roughly 20% longer than public school students (using
the sample mean as a benchmark), even accounting for other student demographics and
socioeconomics in Model 2. This aligns with the hypothesis that greater resources and reduced time
constraints on counselors in the private school context may advantage these students, particularly in
the realm of their college advising support.
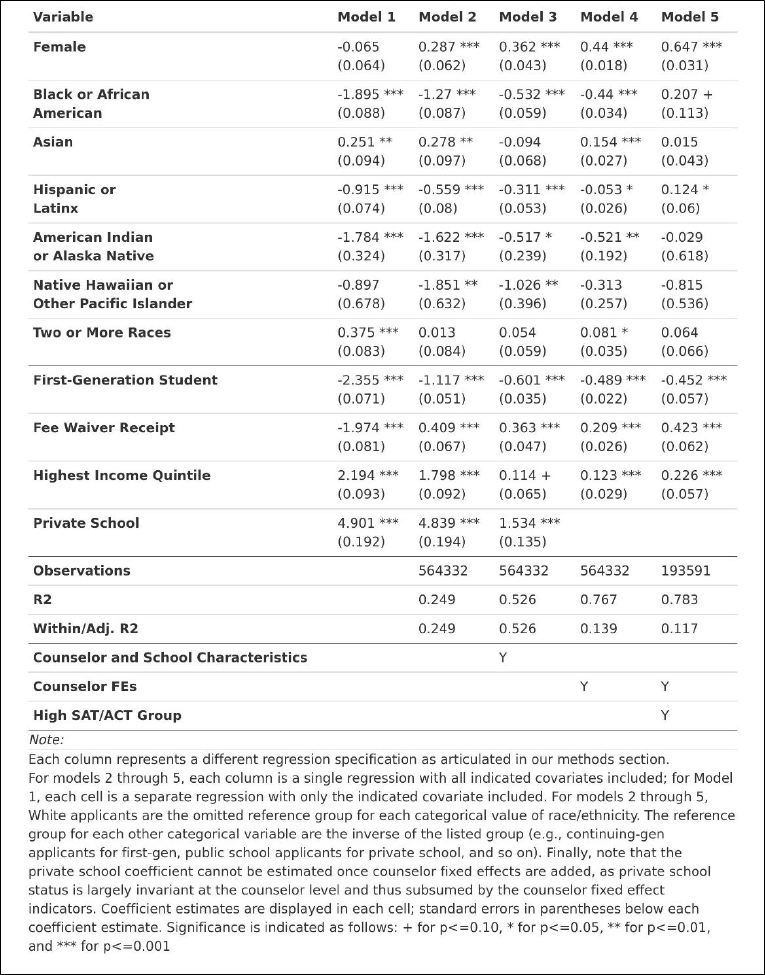
Table 5. Regression Results for Total Letter Sentences (Sample Mean: 24.48)
As described earlier, we can think of the above differences in overall letter length as the sum
of demographic differences across all broad categories of topics combined. Through the topic
modeling measures we created, we can now examine whether certain topics of discussion might be
driving differences in letter length more than others. Beginning with the broad category of Personal
Qualities in Table 6, which makes up the largest proportion of sentences in our data, we can
immediately contextualize some of the coefficients we saw in Table 5 with overall sentences. For
example, the coefficient on Female for Personal Qualities sentences is larger than the corresponding
coefficient for overall sentences for all models. This indicates that when Female students receive
longer letters than Male students, they specifically have more sentences in their letters about
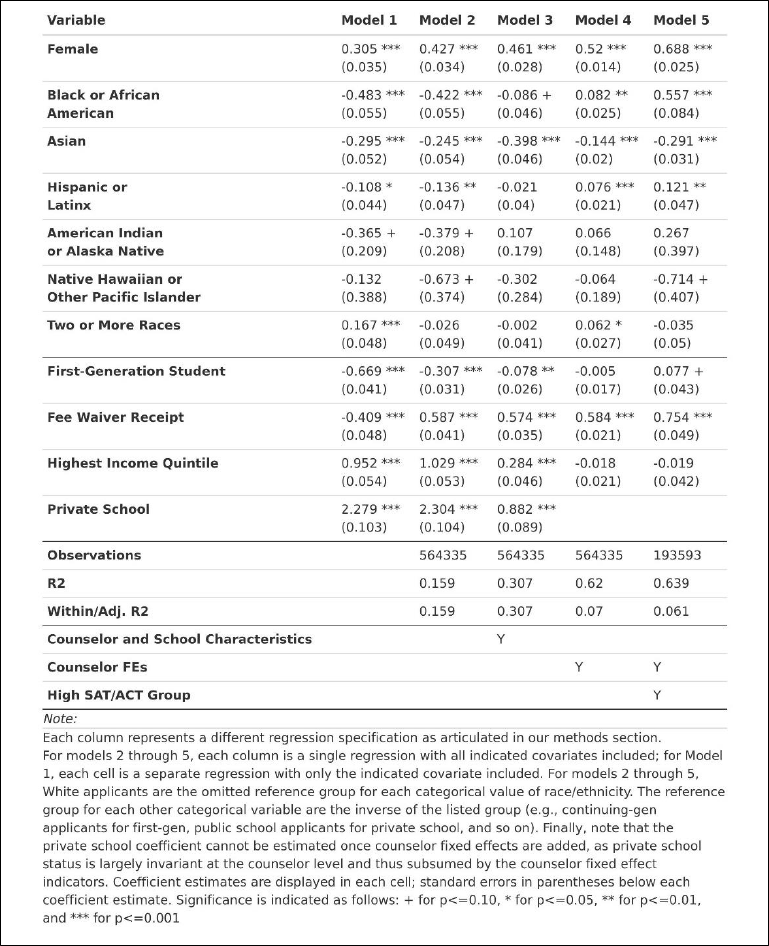
Personal Qualities. Because these coefficients are larger, they must also then be getting
commensurately fewer sentences about Extracurriculars, or Academics, or Other, for us to see the
results we did for total letter sentences. This same exact dynamic holds true for fee waiver recipients.
Likewise, about half of the difference in overall sentences we observed for private school students
versus public school students seems to be driven by having more Personal Qualities sentences.
Table 6. Regression Results for Letter Sentences by Broad Topic Category: Personal
Qualities (Sample Mean: 11.29)
In terms of student race/ethnicity, Black or African American and Hispanic or Latinx
students are generally receiving fewer sentences about Personal Qualities up until the high achieving
subsample, in which they receive 0.557 and 0.121 more sentences, respectively, about Personal
Qualities than White students. Asian students across all specifications are receiving slightly fewer
sentences about Personal Qualities than White students.
When we turn to sentences about Academics in Table 7, we see a roughly inverse trend.
That is, groups that had positive coefficients for Personal Qualities have generally negative
coefficients for Academics, with the exception of higher income and private school students. For
example, Female and Fee Waiver Recipient students are generally getting fewer sentences about
Academics across all models, while Asian students are generally getting far more sentences about
Academics across all models. This may indicate that the Personal Qualities sentences are in effect
“crowding out” sentences about academics when counselors write their letters for certain groups.
This dynamic seems less applicable to Black or African American and Hispanic or Latinx students,
where coefficients shift from negative to positive across models for both topics.
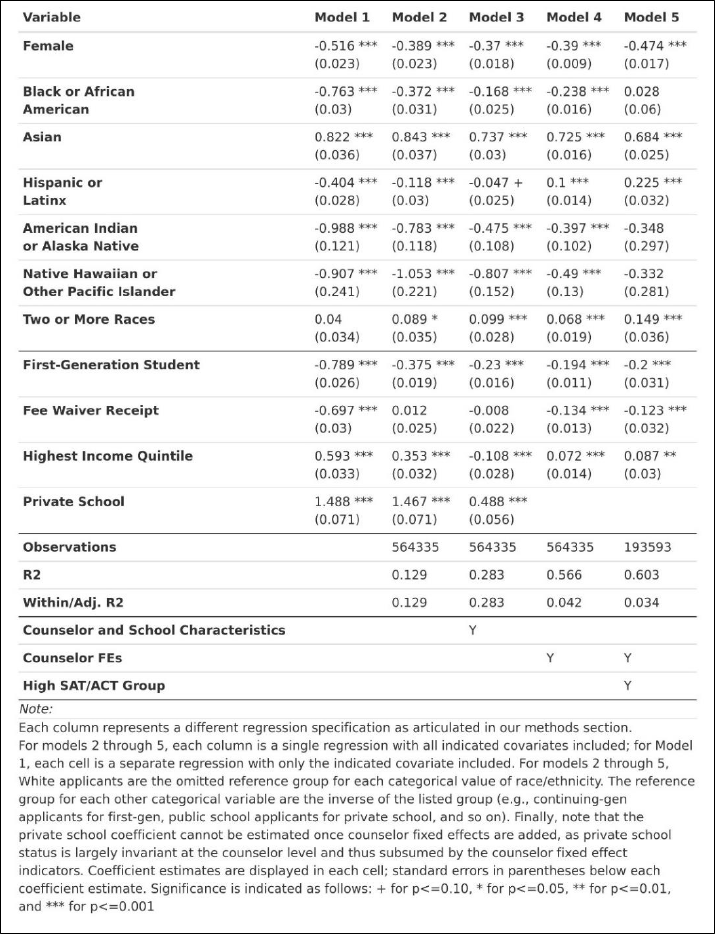
Table 7. Regression Results for Letter Sentences by Broad Topic Category:
Academics (Sample Mean: 5.58)
This “crowding out” dynamic is true for most groups except the highest income quintile and
private school students, where the coefficients for both Personal Qualities and Academics remains
positive across most models. This trend makes sense, as we see such a large, positive coefficient on
these groups in the overall sentence count regressions – so rather than crowding one another out,
the letters are simply longer overall.
Table 8 displays results for sentences about the broad topic category of Extracurriculars.
Interestingly, results here are far more uniform – Female students, lower-SES, and racial/ethnic
minority students all see fewer sentences about extracurriculars across all models.
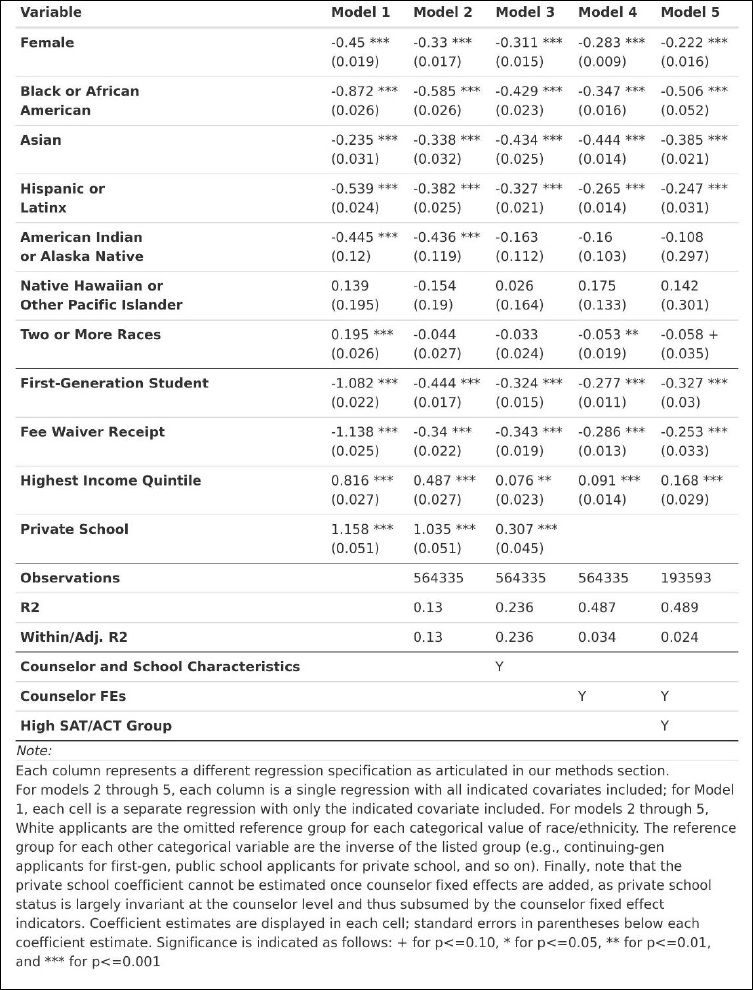
Table 8. Regression Results for Letter Sentences by Broad Topic Category:
Extracurriculars (Sample Mean: 4.74)
As with the other two broad topic categories, both highest income quintile and private
school students have generally positive coefficients across all Extracurricular models with slightly
declining magnitude as additional controls are added.
Moving into more specific topics within the Personal Qualities category, we examine
Character Excellence sentences in Table 9, Intellectual Promise sentences in Table 10, and
Leadership sentences in Table 11. As expected, the volume of results makes cohesive interpretation
difficult, and so we highlight only a few salient trends to help contextualize the earlier results
observed in Tables 5 and 6 above. Female students received relatively fewer sentences about both
Character Excellence and Intellectual Promise than Male students, but instead got substantially more
sentences about Leadership – a difference of between 50-60% relative to the mean across models.
Importantly, these leadership sentences are ones about leadership in general, whereas leadership in
Athletics or specific Extracurriculars would likely instead be classified into those other topic areas.
In terms of student SES variables, we see that Fee Waiver Recipients and First-generation students
tend to have negative coefficients for all three topics, across all models, while private school and
highest income quintile students tend to have positive coefficients. Trends by student race are more
mixed – Black or African American students have negative coefficients for Character Excellence in
Models 1-3, but a positive coefficient in Model 5. They have uniformly negative coefficients for
Intellectual Promise, but then uniformly positive coefficients for Leadership. Hispanic or Latinx
students have slightly negative coefficients across all three topics, for all measures. Asian students
have fairly substantially negative coefficients across all models for Character Excellence, but positive
coefficients for all models in Intellectual Promise except Model 5 for the high achieving subsample.
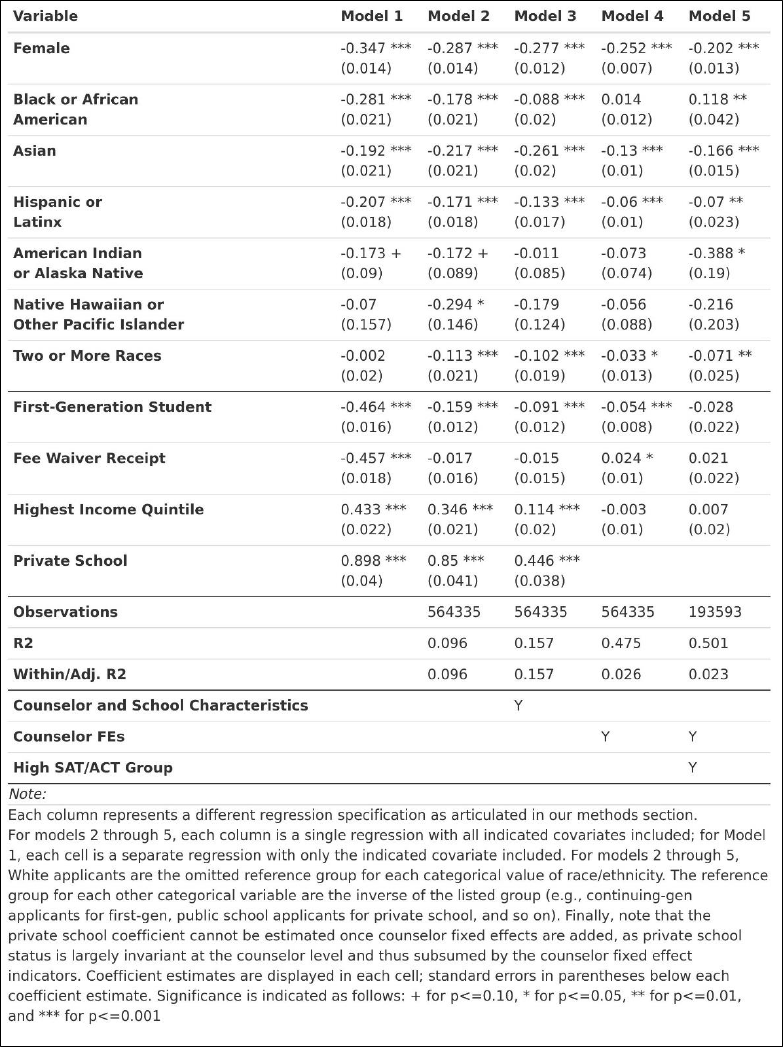
Table 9. Regression Results for Letter Sentences by Specific Topic:
Character Excellence (Sample Mean: 3.32)
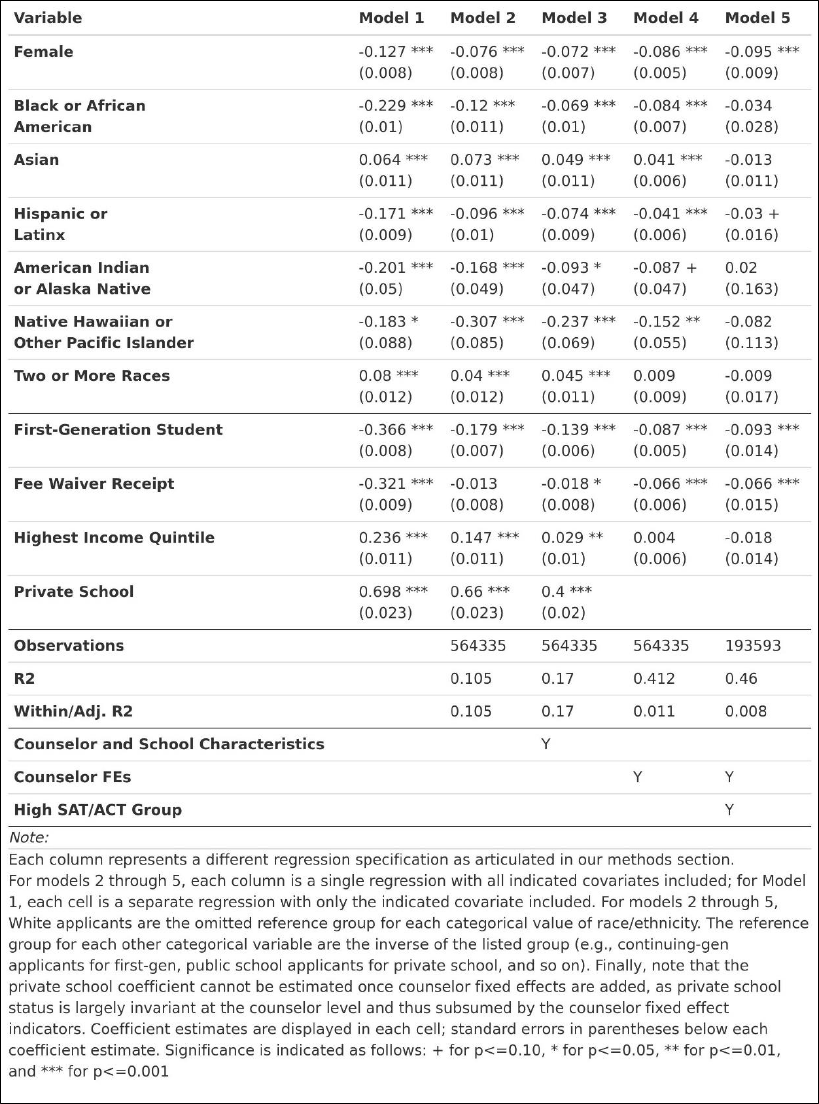
Table 10. Regression Results for Letter Sentences by Specific Topic:
Intellectual Promise (Sample Mean: 1.05)
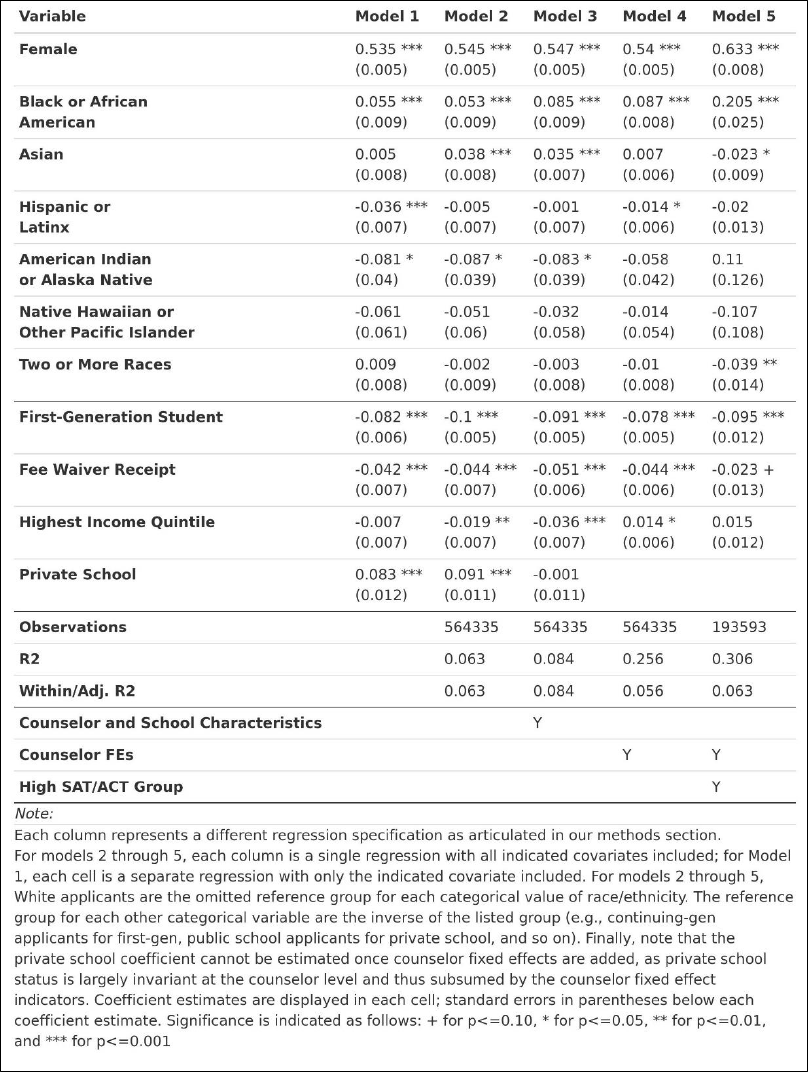
Table 11. Regression Results for Letter Sentences by Specific Topic:
Leadership (Sample Mean: 0.94)
Moving into more specific topics within the Academics category, we examine Humanities
sentences in Table 12, STEM sentences in Table 13, and Classroom Behavior sentences in Table 14.
Female students have consistently positive coefficients for Humanities, but consistently negative for
STEM and Classroom Behavior across all models. This latter example may be due to the fact that
the Classroom Behavior topic is generally focused on anecdotes about participation and classroom
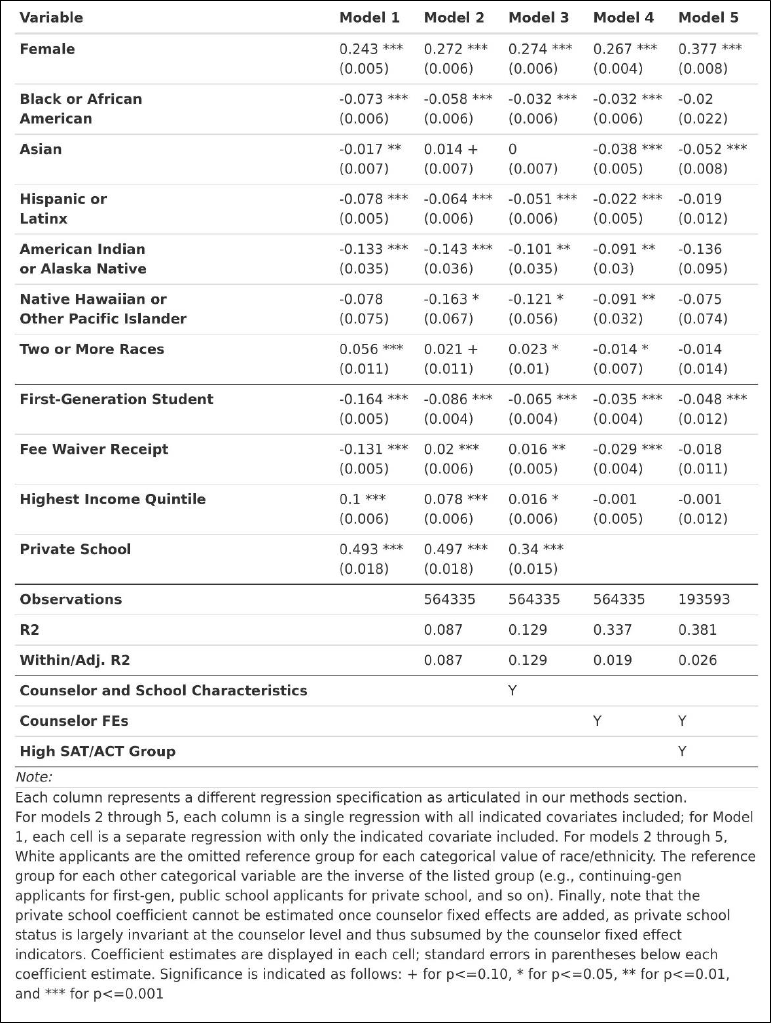
leadership. Black or African American have negative and insignificant coefficients across all three
topics, while Asian students have weakly negative coefficients for Humanities and Classroom
Behavior, but extremely positive coefficients for STEM. First-generation and Fee Waiver students
have negative coefficients consistently across all three topics, while Private school students have
highly positive coefficients across all three. In fact, the relative difference for Private school students
for Humanities is at times greater than 100% more than the mean, and is quite large for Classroom
Behavior at between 55% and 80% of the mean.
Table 12. Regression Results for Letter Sentences by Specific Topic:
Humanities (Sample Mean: 0.47)
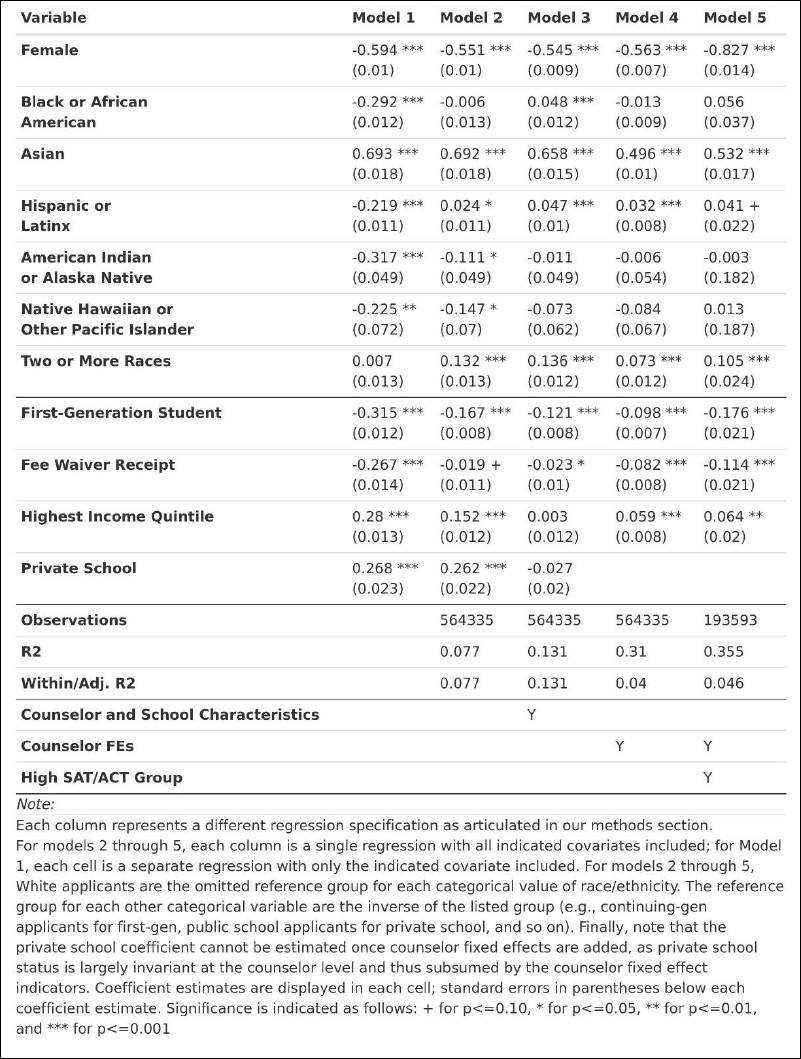
Table 13. Regression Results for Letter Sentences by Specific Topic:
STEM (Sample Mean: 1.23)
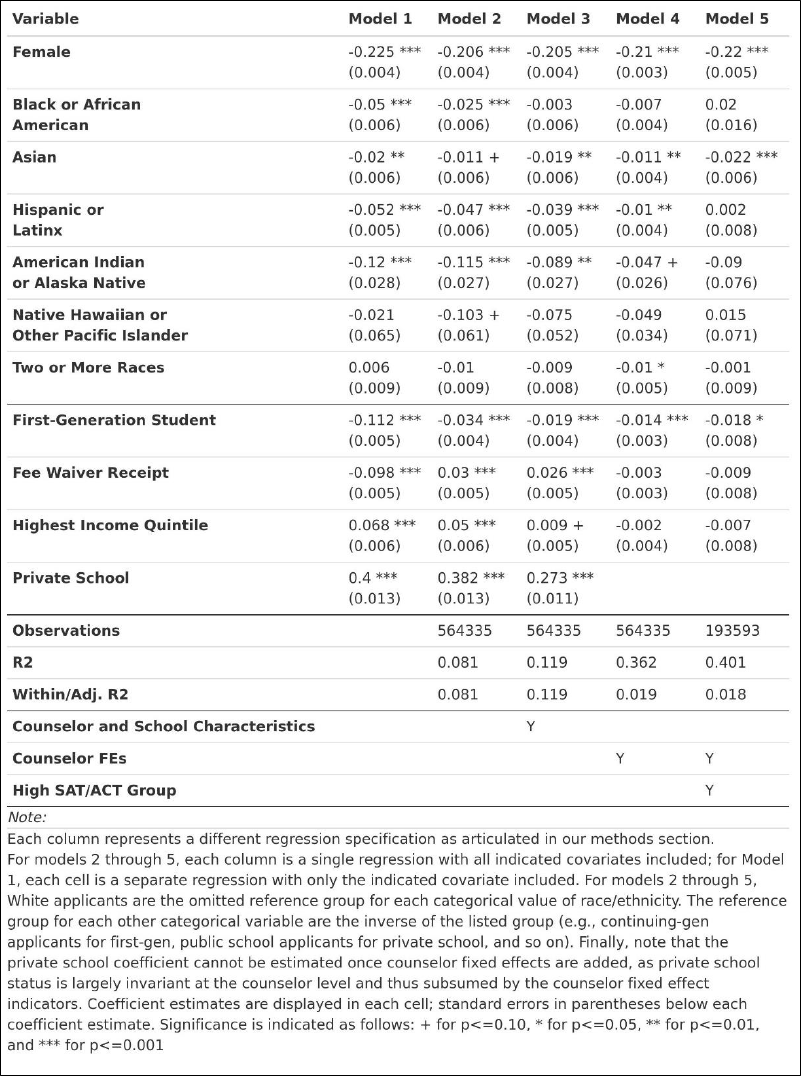
Table 14. Regression Results for Letter Sentences by Specific Topic:
Classroom Behavior (Sample Mean: 0.5)
Lastly, we show results for topics within the Extracurriculars category with Arts sentences in
Table 15 and Athletics sentences in Table 16. Trends here parallel those surfaced in the Academics
topics. For example, Female students have consistently positive coefficients for Arts, but
consistently negative coefficients for Athletics. First-generation and Fee Waiver students have
negative coefficients in all models across both, while highest income quintile and private school
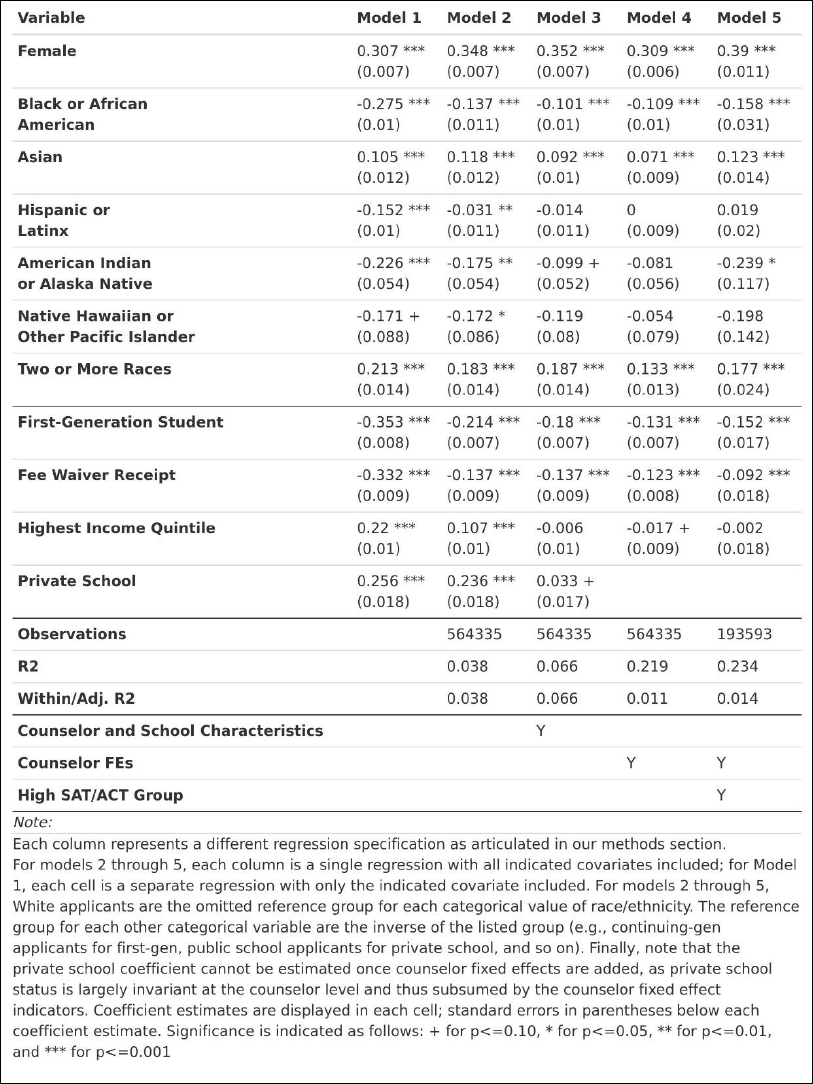
students have positive coefficients in all models across both. Interestingly, all racial/ethnic minority
students have fairly consistent negative coefficients across all models for both topics, with the
exception of Asian and Two or More Races students for Arts, where their coefficients are generally
quite positive.
Table 15. Regression Results for Letter Sentences by Specific Topic:
Arts (Sample Mean: 0.89)
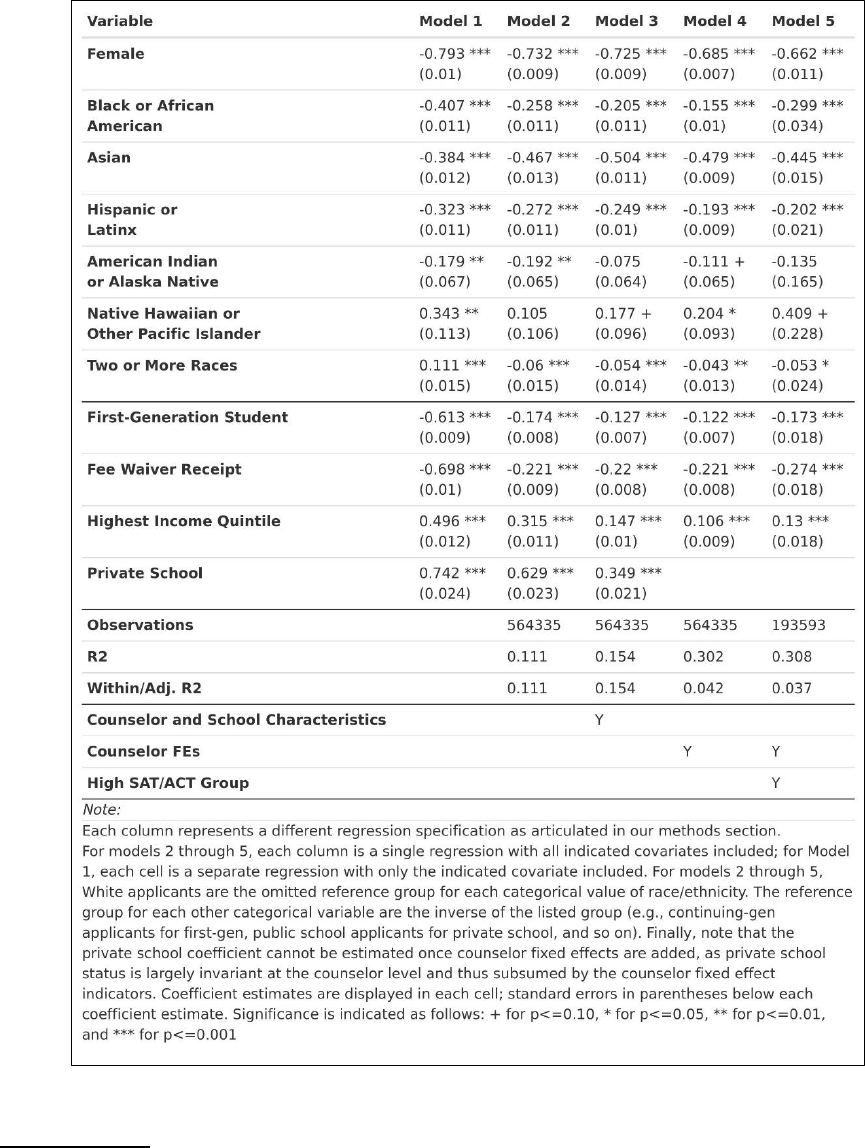
Table 16. Regression Results for Letter Sentences by Specific Topic:
Athletics (Sample Mean: 1.38)
VI. Discussion
Several trends stand out in the findings. First, overall letter length varies notably by
economic background. First-generation students received shorter letters than continuing-generation
students across all models, and across numerous topics. Put simply, they received shorter letters,

even conditional on other individual demographics, school/counselor characteristics, counselor
fixed effects, or being a high-scorer on standardized tests. Fee waiver recipients generally received
longer letters than their non-recipient peers across models, but it seems their letters were generally
more focused on Personal Qualities topics at the cost of sentences about Academics or
Extracurriculars (perhaps the result of counselors using these letters to explain home life and
financial circumstances for lower-income students).
Private school students and students living in higher-income communities generally had
longer letters. Private school students had significantly more sentences on Personal Qualities.
Unlike for lower-SES students, these sentences did not “crowd out” content on other topics like
Academics. They also had more sentences about Character Excellence, Intellectual Promise, and
Leadership—coefficients that were all negative for First-Generation and Fee Waiver recipients. In
the case of higher-income community students, longer letters included more sentences about
Extracurriculars and Athletics. Of note, private school students had more sentences on Humanities
(100% more than the mean), STEM, and Classroom Behavior—once again, all coefficients that were
negative for First-Generation and Fee Waiver Recipients. Longer letters and differences in topical
content may reflect the benefits inequitably distributed to students attending schools with lower
student-to-counselor ratios, with counselors knowledgeable on what content to include, as well as
greater bandwidth and resources to write letters (Chetty et al., 2023; Schwarz, 2016).
Trends for Female students seem to align with pervasive societal norms and stereotypes,
though we do not currently employ enough controls in these models to know if such trends would
persist conditional on students with similar contextual controls. For example, we see Female
students receive longer letters than male students, and their letters are disproportionately focused on
Personal Qualities rather than Academics or Extracurriculars. Female students had letters more
focused on Arts, Humanities, and Leadership, and less focused on STEM, Athletics, Intellectual
Promise, Character Excellence, and Classroom Behavior. Our analyses do not currently attempt to,
for example, control for Athletics participation when examining letters about Athletics. Some of
these dynamics could then be driven by concrete participation differences (which are themselves at
least partly driven by societal norms and stereotypes, as well).
23
Trends by student race/ethnicity were more mixed and nuanced by comparison. Nearly all
groups besides Asian students had shorter letters than White students across most models.
However, Black/African American and Hispanic/Latinx students had slightly longer letters than
White students in the high scoring test taker subsample. This seems to be driven by these groups
having more sentences about Personal Qualities and Academics than White students once
school/counselor characteristics and having a higher test score are controlled for – indicating that
perhaps counselors are inclined to help contextualize a student’s overall application portfolio
specifically when they are achieving higher test scores. These findings suggest that letter inequities
may be most obvious or concentrated in letters written for students outside the high test-taking
subsample (i.e., the vast majority of test-takers), and further reinforce that these inequities are closely
related (i.e., inequities in test taking have repercussions for inequities in letters).
Asian students, by comparison, had consistently fewer sentences about Personal Qualities
and consistently more sentences about Academics across all models. All student race/ethnicity
groups had fewer sentences about Extracurriculars than White students across all models. These
23
While these sorts of analyses are definitely of interest and are possible with our present data, as they more directly
attempt to get at this idea of implicit biases in letter writers, it is exceedingly difficult to find a modeling approach that is
both commensurately bespoke to each outcome of interest while also being rigorous and systematic in nature. That is,
these analyses will necessarily be highly sensitive to what controls are and are not included, and those decisions being
highly researcher-driven may be extremely difficult to justify against claims of “p-hacking” and other selective biases. We
would welcome suggestions for how to approach this quandary in a rigorous and systematic way for future work.
findings support recent scholarship that highlight the inequalities associated with extracurricular
involvement, which disproportionately favors White and higher-SES students who have greater
opportunities, capital, and financial means to partake in activities (Park et al., 2023).
Interestingly, Asian Americans had fewer sentences noting Intellectual Promise in their
letters than White students within the highest test score bracket (while simultaneously controlling for
letters written by the same counselor), and had slightly fewer sentences noting Character Excellence
in their letters across models. On one hand, the lower mentions of Intellectual Promise for Asian
Americans with high test scores could reflect potential stereotyping (i.e., academic ability attributed
to hard work instead of creativity or curiosity). However, it could also reflect the prevalence of SAT
prep and coaching within certain strata of Asian American students (Byun & Park, 2012) which can
result in high test scores that do not necessarily coincide with other observable characteristics
reflective of such Intellectual Promise; it is difficult to know without knowing the actual students.
Regardless, findings parallel evidence presented in the SFFA v. Harvard trial that pointed to lower
ratings assigned to letters written by counselors for Asian American students relative to White
students. This could also reflect other factors (e.g., higher rate of public school attendance by Asian
American students versus White students, see Park & Kim, 2020). Complementary findings from
closer qualitative analysis of letters would help further clarify patterns related to Asian American
students.
Importantly, we cannot speak to the role these various differences and disparities may play in
the ultimate evaluation of a student’s application portfolio, and whether the aforementioned results
are explicitly good or bad for equity in any particular arena. What is prioritized and valued by an
admissions reader within a specific institutional framework of evaluation is highly contextual – both
to the student at hand (because what a reader might value most in a letter is directly influenced by
what needs to be better contextualized about a student’s other application materials), the institution
receiving the letter (because how letters are rated and read and synthesized into supporting an
admissions decision varies so much based on an individual institution’s priorities, training, and
leadership), and the admissions officer reading it (because their individual attention, biases,
experiences, and admissions priorities can influence so much about how they manage and interact
with their caseload). Thus, we can only speak to the general trends and dynamics we observe, and
these trends will ultimately need to be interpreted in that contextual lens by institutional leaders and
policymakers.
These findings reinforce the notion that privilege and inequity can influence admissions
through multiple pathways. First, privileged extracurricular activities and longer, more personalized
letters of recommendation may be favored by admissions readers; both are more common among
private school students (Chetty et al., 2023; Schwarz, 2016). Second, these areas can reinforce one
another. For example, letters for certain students are more likely to comment on activities like
Athletics and the Arts, which may contribute to more positively valued letters. While it is challenging
to isolate the impact of such letters in the admissions process, letters commenting on student
achievements and personal qualities may reflect greater personalization or familiarity with the
student, resulting in a more individualized and high-quality letter (Chetty et al., 2023) that aligns well
with contextualized holistic review in admissions offices (Bastedo et al., 2018). Indeed, counselors
from large public high schools are more likely to recycle letter text (Nicola & Munoz-Najar Galvez,
2022), reflecting notable contrasts in student-to-counselor ratios. Our findings confirm at large-scale
some of the conclusions drawn from closer qualitative analysis of letters from private school
counselors (Schwarz, 2016), which note the multiple advantages that these students receive through
letters of recommendation.
A conundrum reflected in our work is the dual role of discussing personal characteristics in
letters. As noted, we found that private school students had letters with more sentences featuring

Personal Qualities, and generally, such sentences did not come at the expense of discussion of other
topics—instead, applicants just had longer letters. Fee waiver recipients also had letters with more
sentences on Personal Qualities, but such commentary seemed to “crowd out” discussion of other
topics. Likely in the case of low-income students, discussion of Personal Qualities includes insight
related to the degree that an applicant has experienced and overcome challenges, which may benefit
application outcomes even if overall letter quality is lower in some regards (Rothstein, 2022). Based
on analysis of letters at UC Berkeley, Rothstein (2022) noted, “There is a case for including
subjective information like letters in the process in order to make it more visible, at least within
systems like Berkeley’s that are carefully designed to promote equitable admissions” (p. 13).
Rothstein’s comments suggest that letters are most beneficial when the admissions process is highly
calibrated towards promoting equity, versus a system where letters are read without adequate
consideration to the structural factors affecting applicant opportunity shaping such letters. Overall,
letters can work as a sort of double-edged sword, where (if left unchecked) they can perpetuate
privilege for some, while having the potential to disrupt and contextualize inequity for others.
VII. Conclusion
We add to the body of work indicating that, like other components of college applications,
letters of recommendation from high school counselors are subject to inequity, be it the role of
school context, broader racial and economic inequality, or potential individual-level biases from
counselors. Findings related to private school students (e.g., longer letters, more sentences on
Personal Qualities, Athletics, Intellectual Promise, Character Excellence, Humanities, etc.) mirror
work on how elite admissions often benefits this population through prioritization of “personal”
factors gleaned from parts of the application like letters of recommendation and extracurricular
activities (Chetty et al., 2023; Rosinger et al., 2021). At the same time, discussion of personal
characteristics for historically underrepresented populations can reveal important contextual
information regarding a student’s experiences overcoming adversity or dealing with other
circumstances (Rothstein, 2022) that might improve equity in holistic admissions practices (Bastedo
& Bowman, 2017). Reflecting this dynamic, we found that counselors wrote more sentences on
Personal Qualities in letters for fee waiver recipients.
Arguably, the ultimate implications of differences in letters between groups for equity hinges
on exactly how letters are contextualized and normed in evaluation processes, through holistic review
practices (Bastedo & Bowman, 2017; Bastedo et al., 2018). For example, some differences are
ameliorated (e.g., longer letters for high-income community students) when comparing letters
written by the same counselor. However, while an admissions reader may be roughly comparing
applicants within the same high school, they may be less attuned to how certain characteristics of
letters are reflective of differences between counselors, as well as what differences are reflective of
broader inequity. Given these idiosyncrasies, equity-minded institutions should strive to read letters
in the context of structural opportunity, with special consideration to information that helps
contextualize applicants from historically underrepresented backgrounds.
Institutions and application platforms may also consider ways to encourage a more
standardized length of letters across counselors and high school contexts as one way to reduce
potential positive bias towards students who simply have longer letters. Such work could also reduce
some of the workload on school counselors and admissions staff. Overall, findings do not point to a
clear recommendation on whether institutions should keep or eliminate letter requirements, nor do
they point to a clear recommendation for policies on standardized test requirements. Regardless of
testing policy, findings suggest that institutions that do keep letters should emphasize the
importance of reading letters in the context of structural opportunity (Bastedo et al., 2023). They
should provide sustained training on the ways in which bias, inequity, and school resources can
influence letters (McDonough, 1997; Schwarz, 2016). Given that few admissions professionals
report they are prepared to consider a student’s context for opportunity when reviewing applications
(Lee et al., 2022), it is essential for institutions to train readers on the various contexts shaping
counselor letters. At a broader level, continuing to diversify high school counselors, as well as
admissions staff, is another key imperative, given that both groups are known for their homogeneity
(ASCA, 2023), which may influence both the writing and reading/scoring of evaluations from a
more diverse student population (Bowman & Bastedo, 2018; Linnehan et al., 2011).
Given the Supreme Court ruling limiting how institutions may consider race/ethnicity in
admissions decisions, but does not prevent them from “considering an applicant’s discussion of how
race affected his or her life,” (SFFA v. Harvard/UNC, 2023, p. 39) it is even more critical for
institutions to work to recruit and identify talented students from all backgrounds. However,
admissions readers are increasingly missing critical information and support to help them robustly
contextualize student applications. Institutions must invest heavily in encouraging applications from
students from historically excluded and underrepresented backgrounds, invest in efforts to broaden
access, recalibrate admissions systems to promote equitable admissions, and interrogate how to
improve equitable, mission-driven practices. As institutions weigh the future of standardized tests, it
is equally important for them to assess how non-standardized components are shaped by structural
inequity, and consider how the holistic review process can be leveraged to contextualize this
inequity.

VIII. Main References
Aamodt, M. G., Bryan, D. A., & Whitcomb, A. J. (1993). Predicting performance with letters of
recommendation. Public Personnel Management, 22, 81–91. American Educational Research
Association.
Akos, P., & Kretchmar, J. (2016). Gender and Ethnic bias in Letters of Recommendation:
Considerations for School Counselors. Professional School Counseling, 20(1), 1096-2409-
20.1.102. https://doi.org/10.5330/1096-2409-20.1.102
American School Counselor Association [ASCA] (2023, May). Member Demographics.
https://www.schoolcounselor.org/getmedia/9c1d81ab-2484-4615-9dd7-
d788a241beaf/member-demographics.pdf
American School Counselor Association [ASCA] (2023). School counselor roles & ratios.
https://www.schoolcounselor.org/About-School-Counseling/School-Counselor-Roles-
Ratios
Arcidiacono, P. (2018). Expert report for Students for Fair Admissions, Inc. v. Harvard, Technical report.
Arcidiacono, P., Kinsler, J., & Ransom, T. (2022). Asian American discrimination in Harvard
admissions. European Economic Review, 144, 104079.
Bastedo, M. N., & Bowman, N. A. (2017). Improving Admission of Low-SES Students at Selective
Colleges: Results From an Experimental Simulation. Educational Researcher, 46(2), 67-
77. https://doi.org/10.3102/0013189X17699373
Bastedo, M. N., Bowman, N. A., Glasener, K. M., & Kelly, J. L. (2018). What are We Talking About
When We Talk About Holistic Review? Selective College Admissions and its Effects on
Low-SES Students. The Journal of Higher Education, 89(5), 782–805.
https://doi.org/10.1080/00221546.2018.1442633
Bastedo, M. N., Umbricht, M., Bausch, E., Byun, B.-K., & Bai, Y. (2023). Contextualized High
School Performance: Evidence to Inform Equitable Holistic, Test-Optional, and Test-Free
Admissions Policies. AERA Open, 9. https://doi.org/10.1177/23328584231197413
Baxter, J. C., Brock, B. et al. (1981). Letters of recommendation: A question of value. Journal of
Applied Psychology, 66, 296–301.
Belasco, A. S. (2013). Creating college opportunity: School counselors and their influence on
postsecondary enrollment. Research in Higher Education, 54(7), 781-804.
https://doi.org/10.1007/s11162-013-9297-4
Bowen, W. J., & Bok, D. (1998). Why race-conscious admissions make sense. College Board Review,
186(29), 8-11.
Bowman, N.A., Bastedo, M.N. What Role May Admissions Office Diversity and Practices Play in
Equitable Decisions?. Res High Educ 59, 430–447 (2018). https://doi.org/10.1007/s11162-
017-9468-9

Brown, O., Mou, T., Lim, S. I., Jones, S., Sade, S., Kwasny, M. J., ... & Kenton, K. (2021). Do gender
and racial differences exist in letters of recommendation for obstetrics and gynecology
residency applicants?. American journal of obstetrics and gynecology, 225(5), 554-e1.
Bryan, J., Moore-Thomas, C., Day-Vines, N., & Holcomb-McCoy, C. (2011). School counselors as
social capital: The effects of high school college counseling on college application rates.
Journal of Counseling and Development: JCD, 89(2), 190- 199.
Byun, S. Y., & Park, H. (2012). The academic success of East Asian American youth: The role of
shadow education. Sociology of education, 85(1), 40-60.
Campello, R. J. G. B., Moulavi, D., & Sander, J. (2013). Density-Based Clustering Based on
Hierarchical Density Estimates. In J. Pei, V. S. Tseng, L. Cao, H. Motoda, & G. Xu (Eds.),
Advances in Knowledge Discovery and Data Mining (pp. 160–172). Springer.
https://doi.org/10.1007/978-3-642-37456-2_14
Card, D. (2017). Expert report for Students for Fair Admissions, Inc. v. Harvard, Technical report.
Carrell, S. E., & Hoekstra, M. (2014). Are school counselors an effective education input?. Economics
Letters, 125(1), 66-69.
Cherng, H. Y. S. (2017). If they think I can: Teacher bias and youth of color expectations and
achievement. Social Science Research, 66(2017), 170-186.
Chetty, R., Deming, D. J., & Friedman, J. N. (2023). Diversifying Society’s Leaders? The Causal Effects of
Admission to Highly Selective Private Colleges (No. w31492). National Bureau of Economic
Research.
Chin, M. J., Quinn, D. M., Dhaliwal, T. K., & Lovison, V. S. (2020). Bias in the Air: A Nationwide
Exploration of Teachers’ Implicit Racial Attitudes, Aggregate Bias, and Student Outcomes:
Educational Researcher. https://doi.org/10.3102/0013189X20937240
Clinedinst, M. (2019). State of college admission. National Association for College Admission
Counseling.
https://www.nacacnet.org/globalassets/documents/publications/research/2018_soca/soca
2019_all.pdf
Clinedinst, M., & Koranteng, A. M. (2017). State of college admission. National Association for
College Admission Counseling.
https://www.nacacnet.org/globalassets/documents/publications/research/soca17final.pdf
Cook, A. L., Hayden, L. A., Tyrrell, R., & McCann, A. G. (2021). “Doing everything on my own”:
Examining African American, Latina/o, and biracial students’ experiences with school
counselors in promoting academic and college readiness. Urban Education, 56(10), 1637–
1667. https://doi.org/10.1177/0042085918772624

Correll, J., Park, B., Judd, C. M., Wittenbrink, B., Sadler, M. S., & Keesee, T. (2007). Across the thin
blue line: Police officers and racial bias in the decision to shoot. Journal of Personality and Social
Psychology, 92(6), 1006–1023. https://doi.org/10.1037/0022-3514.92.6.1006
Dee, T. S. (2005). A Teacher like Me: Does Race, Ethnicity, or Gender Matter? The American
Economic Review, 95(2), 158–165.
Devine, P. G., Forscher, P. S., Austin, A. J., & Cox, W. T. (2012). Long-term reduction in implicit
race bias: A prejudice habit-breaking intervention. Journal of experimental social psychology, 48(6),
1267-1278.
Egami, N., Fong, C. J., Grimmer, J., Roberts, M. E., & Stewart, B. M. (2022). How to make causal
inferences using texts. Science Advances, 8(42), eabg2652.
https://doi.org/10.1126/sciadv.abg2652
Espenshade, T. J., & Radford, A. W. (2009). No longer separate, not yet equal: Race and class in elite college
admission and campus life. Princeton University Press.
Fesler, L., Dee, T., Baker, R., & Evans, B. (2019). Text as data methods for education
research. Journal of Research on Educational Effectiveness, 12(4), 707-727.
Francis, D. V., De Oliveira, A. C., & Dimmitt, C. (2019). Do school counselors exhibit bias in
recommending students for advanced coursework?. The BE Journal of Economic Analysis &
Policy, 19(4).
Gagnon, D., & Mattingly, M. (2016). Most U.S. School Districts Have Low Access to School
Counselors: Poor, Diverse, and City School Districts Exhibit Particularly High Student-to-
Counselor Ratios. The Carsey School of Public Policy at the Scholars’ Repository.
https://dx.doi.org/10.34051/p/2020.275
Gast, M. J. (2021). “You’re supposed to help me”: The perils of mass counseling norms for
working-class Black students. Urban Education, 56(9), 1429-
1455. https://doi.org/10.1177/0042085916652178
Gershenson, S., Holt, S. B., & Papageorge, N. W. (2016). Who believes in me? The effect of
student–teacher demographic match on teacher expectations. Economics of Education Review,
52, 209–224. https://doi.org/10.1016/j.econedurev.2016.03.002
Grimm, L. J., Redmond, R. A., Campbell, J. C., & Rosette, A. S. (2020). Gender and racial bias in
radiology residency letters of recommendation. Journal of the American College of Radiology,
17(1), 64-71.
Grissom, J. A., & Redding, C. (2016). Discretion and Disproportionality: Explaining the
Underrepresentation of High-Achieving Students of Color in Gifted Programs. AERA Open,
2(1), 2332858415622175. https://doi.org/10.1177/2332858415622175
Grootendorst, M. (2022). BERTopic: Neural topic modeling with a class-based TF-IDF procedure
(arXiv:2203.05794). arXiv. https://doi.org/10.48550/arXiv.2203.05794

Hallgren, K. A. (2012). Computing Inter-Rater Reliability for Observational Data: An Overview and
Tutorial. Tutorials in Quantitative Methods for Psychology, 8(1), 23–34.
https://www.ncbi.nlm.nih.gov/pmc/articles/PMC3402032/
Hand, S., Rice, L., & Greenlee, E. (2017). Exploring teachers’ and students’ gender role bias and
students’ confidence in STEM fields. Social Psychology of Education, 20, 929-945.
Hextrum, K. (2021). Special admission: How college sports recruitment favors white suburban athletes. Rutgers
University Press.
Houser, C., & Lemmons, K. (2018). Implicit bias in letters of recommendation for an undergraduate
research internship. Journal of Further and Higher Education, 42(5), 585-595.
Hurwitz, M., & Howell, J. (2014). Estimating causal impacts of school counselors with regression
discontinuity designs. Journal of Counseling & Development, 92(3), 316-327.
Jaschick, S. (2022, August). The growth of part-time readers. Inside Higher Ed.
https://www.insidehighered.com/admissions/article/2022/08/08/part-time-readers-grow-
applications
Jayakumar, U. M., & Page, S. E. (2021). Cultural capital and opportunities for exceptionalism: Bias in
university admissions. The Journal of Higher Education, 92(7), 1109-1139.
Kang, C., & García Torres, D. (2021). College Undermatching, Bachelor’s Degree Attainment, and
Minority Students. Journal of Diversity in Higher Education, 14(2), 264–277.
Kang, J., & Banaji, M. R. (2006). Fair measures: A behavioral realist revision of "affirmative
action". California Law Review, 94(4), 1063-1118.
Kim, B. H. (2022, March). What’s in a Letter? Using Natural Language Processing to Investigate
Systematic Differences in Teacher Letters of Recommendation. Paper presentation at 47th
Annual Conference of Association of Education Finance and Policy, Denver, CO.
Kuncel, N. R., Kochevar, R. J., & Ones, D. S. (2014). A meta-analysis of letters of recommendation
in college and graduate admissions: Reasons for hope. International Journal of Selection and
Assessment, 22(1), 101-107.
Lee, D., Engler, J.S., Hurtado, J., Raza, A., & Poon, O.A. (2022). More than marketing: Professional
development and training to integrate diversity. In O.A. Poon & M. Bastedo (eds.),
Rethinking college admissions: Research-based practice and policy, (pp. 133-50). Cambridge: Harvard
Education Press.
Lee, H., Joachims, T., & Kizilcec, R. F. (2023). Evaluating a Learned Admission-Prediction Model as
a Replacement for Standardized Tests in College Admissions. arXiv preprint
arXiv:2302.03610.

Linnehan, F., Weer, C. H., & Stonely, P. (2011). High school guidance counselor recommendations:
The role of student race, socioeconomic status, and academic performance. Journal of Applied
Social Psychology, 41(3), 536-558.
Massey, D. S., Charles, C. Z., Lundy, G. F., & Fischer, M. J. (2003). The source of the river: The social
origins of freshmen at America’s selective colleges and universities. Princeton University Press.
McDonough, P. M. (1997). Choosing colleges: How social class and schools structure opportunity. Suny Press.
McDonough, P. M. (2005) Counseling and college counseling in America’s high schools. National Association
for College Admission Counseling.
McKillip, M. E., Rawls, A., & Barry, C. (2012). Improving college access: A review of research on
the role of high school counselors. Professional School Counseling, 16(1), 49-58.
Mulhern, C. (2020). Beyond teachers: Estimating individual guidance counselors’ effects on
educational attainment. Unpublished Manuscript, RAND Corporation.
Nelson, L. K. (2020). Computational Grounded Theory: A Methodological Framework. Sociological
Methods & Research, 49(1), 3–42. https://doi.org/10.1177/0049124117729703
Nicklin, M. J., & Roch, S. G. (2009). Letters of recommendation: Controversy and consensus from
expert perspectives. International Journal of Selection and Assessment, 17, 76–91.
Nicola, T. P. & Munoz-Najar Galvez, S. (2022, November 18). Writing the same thing? Exploring text
similarity in counselor recommendation letters. ASHE Annual Conference, Las Vegas, NV, United
States
Oliveri, M. E., & Ezzo, C. (2014, April). The Role of Noncognitive Measures in Higher Education
Admissions. In Journal of the World Universities Forum (Vol. 6, No. 4).
Park, J. J., & Kim, S. (2020). Harvard's Personal Rating: The Impact of Private High School
Attendance. Asian American Policy Review, 30, 2-80.
Park, J. J., Kim, B. H., Wong, N., Zheng, J., Breen, S., Lo, P., ... & Poon, O. (2023). Inequality
Beyond Standardized Tests: Trends in Extracurricular Activity Reporting in College
Applications Across Race and Class.
Park, J.J., Lo, P., Wadsen, L., Cho, J., Bonamy, L., DiDonna, R., Kilmer, S., Alexander, V., Mehta,
N., Ogwo, A. (2021). Report on Campus Climate, Diversity, and Racial Equity at the Ohio
State University. University of Maryland, College Park.
Payne, B. K. (2006). Weapon bias: Split-second decisions and unintended stereotyping. Current
directions in psychological science, 15(6), 287-291.
Perna, L. W., Rowan-Kenyon, H. T., Thomas, S. L., Bell, A., Anderson, R., & Li, C. (2008). The role
of college counseling in shaping college opportunity: Variations across high schools. The
Review of Higher Education, 31(2), 131-159.

Polanco-Santana, J. C., Storino, A., Souza-Mota, L., Gangadharan, S. P., & Kent, T. S. (2021).
Ethnic/racial bias in medical school performance evaluation of general surgery residency
applicants. Journal of Surgical Education, 78(5), 1524-1534.
Posselt, J. R. (2018). Trust networks: A new perspective on pedigree and the ambiguities of
admissions. The Review of Higher Education, 41(4), 497-521.
Powers, A., Gerull, K. M., Rothman, R., Klein, S. A., Wright, R. W., & Dy, C. J. (2020). Race-and
gender-based differences in descriptions of applicants in the letters of recommendation for
orthopaedic surgery residency. JBJS Open Access, 5(3).
Quinn, D. M. (2020). Experimental evidence on teachers’ racial bias in student evaluation: The role
of grading scales. Educational Evaluation and Policy Analysis, 42(3), 375-392.
Reback, R. (2010). Noninstructional spending improves noncognitive outcomes: Discontinuity
evidence from a unique elementary school counselor financing system. Education Finance and
Policy, 5(2), 105-137.
Redding, C. (2019). A teacher like me: A review of the effect of student–teacher racial/ethnic
matching on teacher perceptions of students and student academic and behavioral outcomes.
Review of educational research, 89(4), 499-535.
Roberts, M. E., Stewart, B. M., & Tingley, D. (2019). stm: An R Package for Structural Topic
Models. Journal of Statistical Software, 91(2). https://doi.org/10.18637/jss.v091.i02
Rosinger, K. O., Ford, K. S., & Choi, J. (2021). The Role of Selective College Admissions Criteria in
Interrupting or Reproducing Racial and Economic Inequities. The Journal of Higher Education,
0(0), 1–25.
Rothstein, J. (2022). Qualitative information in undergraduate admissions: A pilot study of letters of
recommendation. Economics of Education Review, 89, 1-35.
https://doi.org/10.1016/j.econedurev.2022.102285
Russell. J., Fortin, J., Ford, B., Cataneo, E. (2023, June 29). Ruling raises uncertainty for high school students
heading to college. New York Times.
https://www.nytimes.com/2023/06/29/us/politics/affirmative-action-students.html
Schwarz, J. D. (2016). Lost in translation: Elite college admission and high school differences in letters of
recommendation [Unpublished doctoral dissertation]. University of Notre Dame.
Starck, J. G., Riddle, T., Sinclair, S., & Warikoo, N. (2020). Teachers Are People Too: Examining the
Racial Bias of Teachers Compared to Other American Adults: Educational Researcher.
https://doi.org/10.3102/0013189X20912758
Students for Fair Admissions, Inc. v. President and Fellows of Harvard College, 600 U.S. (2023).
Tang, A. K., & Ng, K. M. (2019). High School Counselor Contacts as Predictors of College
Enrollment. Professional Counselor, 9(4), 347-357. https://doi.org/10.15241/akt.9.4.347

Tausczik, Y. R., & Pennebaker, J. W. (2010). The Psychological Meaning of Words: LIWC and
Computerized Text Analysis Methods. Journal of Language and Social Psychology, 29(1), 24–54.
https://doi.org/10.1177/0261927X09351676
Vaswani, A., Shazeer, N., Parmar, N., Uszkoreit, J., Jones, L., Gomez, A. N., Kaiser, L., &
Polosukhin, I. (2017). Attention Is All You Need. ArXiv:1706.03762 [Cs].
http://arxiv.org/abs/1706.03762
Weis, L., Cipollone, K., & Jenkins, H. (2014). Class warfare: Class and race in affluent and elite secondary
schools. University of Chicago Press.
Woods, C. S., & Domina, T. (2014). The school counselor caseload and the high school-to-college
pipeline. Teachers College Record, 116(10), 1-30.
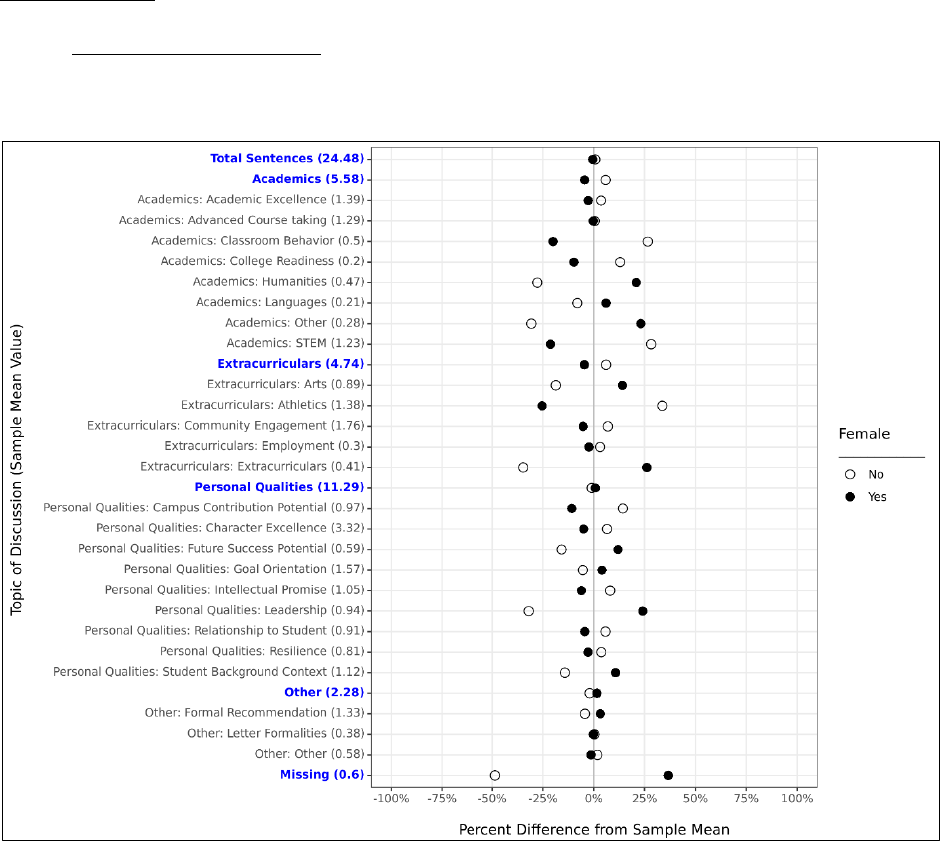
VIII. Appendix
VIIa. Descriptive Analyses
Figure A1. Descriptive Differences in Letter Content by Sex
Differences relative to sample mean (displayed in parentheses on Y-axis)

Figure A2. Descriptive Differences in Letter Content by URM Status
Differences relative to sample mean (displayed in parentheses on Y-axis)

Figure A3. Descriptive Differences in Letter Content by First-Generation Status
Differences relative to sample mean (displayed in parentheses on Y-axis)

Figure A4. Descriptive Differences in Letter Content by Fee Waiver Eligibility
Differences relative to sample mean (displayed in parentheses on Y-axis)
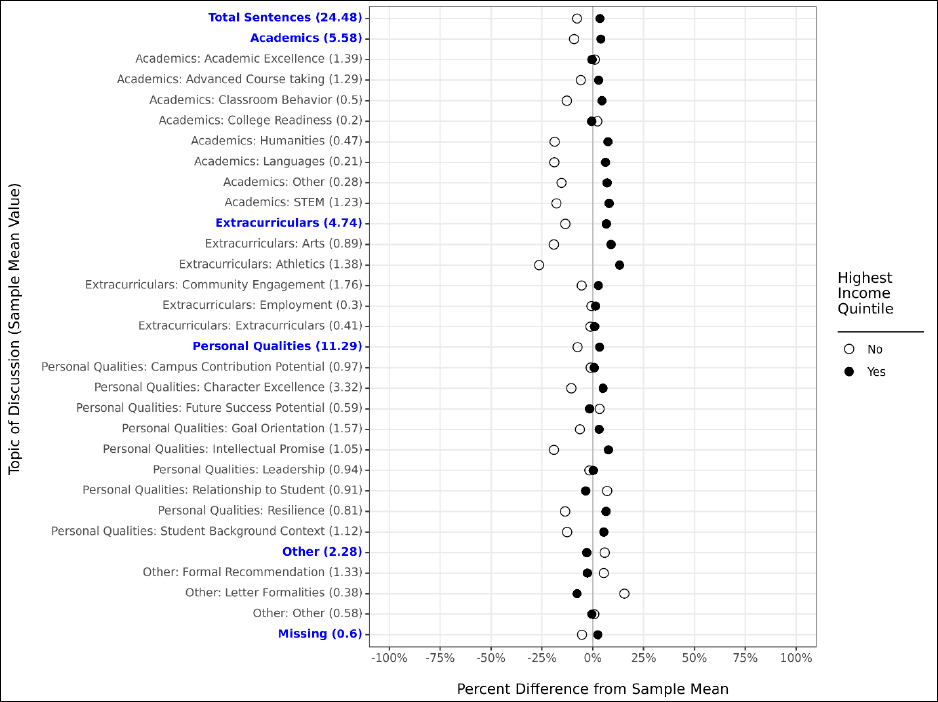
Figure A5. Descriptive Differences in Letter Content by ZIP-Code Income Quintile
Differences relative to sample mean (displayed in parentheses on Y-axis)
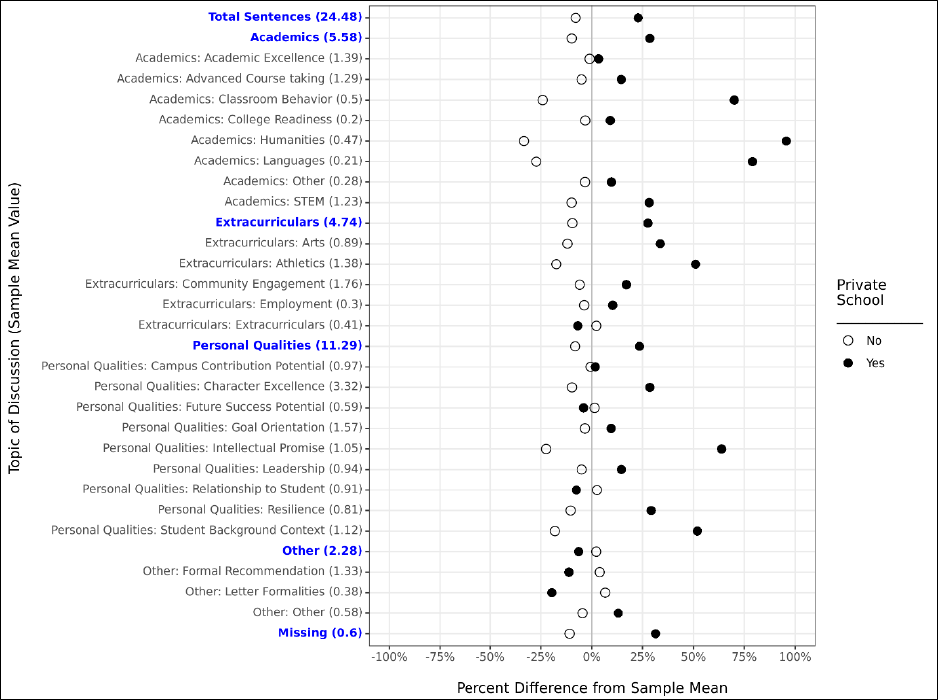
Figure A6. Descriptive Differences in Letter Content by School Sector
Differences relative to sample mean (displayed in parentheses on Y-axis)
