Washington State
Sport Catch Report 2020
STATE OF WASHINGTON July 2022
by Eric Kraig
and
Tracey Scalici

Washington state
sport CatCh report
2020
by
Eric Kraig
and
Tracey Scalici
State of Washington
Jay Inslee, Governor
Washington State Department of Fish and Wildlife
Kelly Susewind, Director
Fish Program
Kelly Cunningham, Director of Fish Program
Department of Fish and Wildlife
Fish Science Division
1111 Washington St . SE
Olympia, Washington 98501
July 2022
W
A
S
H
I
N
G
T
O
N
D
E
P
A
R
T
M
E
N
T
O
F
F
I
S
H
A
N
D
W
I
L
D
L
I
F
E

ACKNOWLEDGEMENTS
Many Department of Fish and Wildlife biologists and program staff contributed to the
compilation and editing of this report. Thanks go to the staff in Licensing, Information
Systems, Support Services Unit, and Fish Management. Special thanks are due to Dan
Ayres, David Bramwell, Euna Parse, Camille Speck, Phuong-Nhi Nguyen,
Kyle Vandegraaf, Laura Heironimus, Don Velasquez, Tyler Garber, Alex Wickett, Ann
Stephenson, Heather Hall, Barbara McClellan, Ken Keller, Merrie Schultz, Doug Rogers,
Matthew Sturza, and Erica Weyland.

Washington State Sport Catch Report 2020 July 2022
ii
TABLE OF CONTENTS
List of Tables .......................................................................................................................... iii
Introduction ..............................................................................................................................1
Methods ....................................................................................................................................2
Review .....................................................................................................................................3
References ................................................................................................................................6
Sport Licenses ..........................................................................................................................7
Technical Data ..........................................................................................................................9
Salmon ...................................................................................................................................13
Map of Salmon Catch Record Card Areas .............................................................................14
Description of Salmon Catch Record Card Areas ..................................................................15
Sturgeon .................................................................................................................................45
Map of Sturgeon Catch Record Card Areas ........................................................................... 46
Description of Sturgeon Catch Record Card Areas ...............................................................47
Steelhead ................................................................................................................................51
Marine Fish ............................................................................................................................63
Shellsh ..................................................................................................................................67

Washington State Sport Catch Report 2020 July 2022
iii
LIST OF TABLES
Sport Licenses
Table 1. Number and Value of Sport Fishing Licenses Sold in Washington
in the 2020-2021 Fishing Year ........................................................................................................8
Technical Data
Table 2. Number of Catch Record Cards Issued 1971-2020 ......................................................................10
Table 3. 2020-2021 Catch Record Card Technical Data ............................................................................. 11
Salmon
Table 4. Annual Sport Salmon Catch, 1971 – 2020 ...................................................................................16
Table 5. Total 2020-2021 Sport Salmon Catch ..........................................................................................17
Table 6. 2020 Sport Salmon Marine Catch, Area 1 – Ilwaco: Ocean ........................................................18
Table 7. 2020 Sport Salmon Marine Catch, Area 1 – Ilwaco: River .........................................................18
Table 8. 2020 Sport Salmon Marine Catch, Area 2 – Westport .................................................................19
Table 9. 2020 Sport Salmon Marine Catch, Area 2-1 – Willapa Bay ........................................................ 19
Table 10. 2020 Sport Salmon Marine Catch, Area 2-2 – Grays Harbor .......................................................20
Table 11. 2020 Sport Salmon Marine Catch, Area 3 – LaPush ....................................................................20
Table 12. 2020 Sport Salmon Marine Catch, Area 4 – Neah Bay ............................................................... 21
Table 13. 2020-2021 Sport Salmon Marine Catch, Area 5 – Sekiu – Pillar Point ....................................... 21
Table 14. 2020-2021 Sport Salmon Marine Catch, Area 6 – East Juan de Fuca Strait ...............................22
Table 15. 2020-2021 Sport Salmon Marine Catch, Area 7 – San Juan Islands ...........................................22
Table 16. 2020-2021 Sport Salmon Marine Catch, Area 8-1 – Deception Pass / Hope Island ....................22
Table 17. 2020-2021 Sport Salmon Marine Catch, Area 8-2 – Port Susan / Port Gardner ..........................22
Table 18. 2020-2021 Sport Salmon Marine Catch, Area 9 – Admiralty Inlet ..............................................23
Table 19. 2020-2021 Sport Salmon Marine Catch, Area 10 – Seattle / Bremerton .....................................23
Table 20. 2020-2021 Sport Salmon Marine Catch, Area 11 – Tacoma / Vashon Island ...............................24
Table 21. 2020-2021 Sport Salmon Marine Catch, Area 12 – Hood Canal .................................................24
Table 22. 2020-2021 Sport Salmon Marine Catch, Area 13 – South Puget Sound .....................................25
Table 23. 2020-2021 Freshwater Salmon Sport Catch, by Area and Month ................................................ 26
Table 24. 2020-2021 Washington Sport Salmon Fishing, by Residence ......................................................41
Table 25. 2020-2021 Frequency Distribution of Estimated Salmon Catch Record Cards and Catch ...........42
Table 26. 2020-2021 Sport Salmon Inventory of Catch Record Cards Received .........................................43

Washington State Sport Catch Report 2020 July 2022
iv
LIST OF TABLES
Sturgeon
Table 27. 2020-2021 Sport Sturgeon Catch by Area and Month ..................................................................48
Table 28. 2020-2021 Sport Sturgeon Fishing, by Residence ........................................................................49
Table 29. 2020-2021 Frequency of Estimated Distribution of Sturgeon Cards and Catch ...........................50
Table 30. 2020-2021 Sport Sturgeon Inventory of Catch Record Cards ......................................................50
Steelhead
Table 31. 2020-2021 Steelhead Sport Catch by Area and Month .................................................................52
Table 32. 2020-2021 Sport Steelhead Fishing, By Residence .......................................................................61
Table 33. 2020-2021 Frequency Distribution of Estimated Steelhead Cards and Catch ..............................62
Table 34. 2020-2021 Sport Steelhead Inventory of Catch Record Cards Reported ...................................... 63
Marine Fish
Table 35. 2020 Coastal Marine Fish Catch ...................................................................................................66
Table 36. 2020 Coastal Washington Recreational Pacic Halibut Catch 2000-2020 ...................................67
Table 37. 2020 Sport Bottomsh Catch by Boat-Based Anglers in Puget Sound ........................................68
Shellsh
Table 38. 2020-2021 Seasonal Summary of Sport Razor Clam Digging on Ocean Beaches .......................70
Table 39. 2020 Clam and Oyster Recreational Use and Harvest Estimates from Intertidal Areas East of
Dungeness Spit .............................................................................................................................71
Table 40. 2020 Puget Sound and Hood Canal Sport Spot Shrimp Fishery ..................................................72
Table 41. 2020 Sport Dungeness Crab Catch ...............................................................................................72

Washington State Sport Catch Report 2020 July 2022
1
INTRODUCTION
The Washington State Sport Catch Report was rst published in 1967. The report originally provided salm-
on catch estimates, which were and still are based on data from catch record cards (punch cards). In 1975,
marine sh sport harvest estimates were added to the report, followed by shellsh estimates in 1976. Marine
sh and intertidal shellsh sport harvest estimates are based on eld and creel surveys. In 1994, with the
merger of the departments of Fisheries and Wildlife, steelhead sport harvest estimates were added to the
report. Now, catch record card data are collected for salmon, sturgeon, steelhead, Dungeness crab and hali-
but. The card data is supplemented with eld or creel survey data or telephone surveys where available to
improve recreational harvest estimate accuracy. The sport harvest estimates for salmon, steelhead, sturgeon,
marine sh and shellsh are produced at varying times of each year.
The 2020 sport estimates reflect harvest for the “License Year” which ran from April 1, 2020 through March
31, 2021. These April-March license years have been used since 2000. Prior to that, salmon and marine fish
estimates were made on a calendar year basis and steelhead estimates were made using a May-April year.
Year 2020 turned out to be a challenging year for shery managers and anglers alike. The Covid-19 global
pandemic began in March 2020, right before the start of the new shing year. Fishing was closed statewide
on March 25. No sheries were open in April 2020. Some areas reopened on May 5, but other areas re-
mained closed, depending on advisories by local health departments. Even after reopening, some areas were
less accessible due to boat ramp closures and other restrictions.
Sport Licenses and Catch Record Cards
In 2020, the following licenses and catch record cards were required to sh in Washington:
• Saltwater license: Required for saltwater shing, for all anglers aged sixteen and over. Available for
residents, resident seniors (70 and older), and non-residents. Catch record cards required for salmon,
steelhead, sturgeon and halibut, for anglers of all ages.
• Freshwater license: Required for freshwater shing, for all anglers aged sixteen and over. Available
for residents, resident seniors (70 and older), and non-residents. Catch record cards required for
salmon, steelhead and sturgeon, for anglers of all ages.
• Shellsh/seaweed license: Required for harvesters aged sixteen and over. Available for residents,
resident seniors (70 and older), and non-residents. Allows the holder to harvest clams, mussels,
oysters, shrimp, crab, squid, other shellsh, and seaweed. In addition, a Puget Sound crab
endorsement and catch record card was required to harvest Dungeness crab in Marine Areas 5-13.
• Combination license: Allows anglers to sh in both saltwater and freshwater and to harvest shellsh
and seaweed. Available for both residents and non-residents aged fteen and over.
• Fish catch record cards were required for salmon, steelhead, sturgeon and halibut. Each species
group could be issued as a separate card, or included together on one card. Separate catch record
cards were required for recording Dungeness crab in Puget Sound. Separate crab cards were required
for the summer and fall/winter seasons
In 2001 WDFW implemented the Washington Interactive Licensing Data (WILD) system to electronically
capture recreational license issuance information at the point of sale. The catch record card remained the
same paper document distributed by sport license vendors, but demographic data about persons receiving
the cards became available almost immediately.
Table 1 lists license sales for the license year which ran from April 1, 2020 through March 31, 2021. Table
2 provides counts for the numbers of sh and crab catch cards issued going back to 1971. Table 3 shows the
return rate, expansion factor, and non-response bias correction factors for the 2020-2021 cards.
Washington State Sport Catch Report 2020 July 2022
2
METHODS
Catch Record Cards
Card Issuance
Catch cards are required for all anglers shing for salmon, steelhead, sturgeon, or halibut. Separate crab catch cards are
required for Dungeness crab shing in Puget Sound. The catch card requirement applies to everyone, including anglers
under the age of fteen who are not required to purchase a shing license. The rst catch card issued to an angler is free
with the purchase of a license. If an angler lls the initial card with catch, additional cards can be purchased for a fee.
Sturgeon and halibut have annual catch limits, so additional cards are not available for these species.
Most catch cards are issued from the Washington Interactive Licensing Database (WILD) system. WILD-issued cards
include the angler’s name, city of residence, and their WILD ID, a unique identier assigned to each angler in the
system. Each issued card is assigned a unique document number.
Pre-printed catch cards are provided to charter boat operators and shing guides to be issued along with one-day
charter licenses. Anglers write their name/address information on the charter card “stub” which is retained by the
operator and sent back to the agency. The same pre-printed cards may also be issued to anglers that purchase “Hot
Key” licenses. These are temporary licenses sold through the WILD system, but without the requirement for an angler
entry in the database. The angler name and address is entered on the stub, just as with charter licenses. Charter and hot
key cards make up about three to ve percent of the total card issuance annually.
Card Returns
Fish catch cards are due back on April 30, one month after the end of the license year, which runs from April 1
through March 31. Crab catch cards are issued for two separate seasons. Summer season cards are due back by
October 1; winter season cards are dub back by February 1. Cards can be mailed in or dropped off at WDFW ofces.
Online reporting is available for crab cards, but not yet for sh cards.
For sh catch cards, the CRC unit randomly selects twenty-ve percent of the cards issued each year for use in
generating catch estimates. These cards are referred to as the “in-sample” group. Cards are selected based on the last
two digits of the document numbers printed on the cards. Two reminder postcards are sent out to anglers with cards in
the in-sample range, in an effort to increase return rates. For crab catch cards, all reports are processed, including both
returned card and those reported online.
Estimation
Once the cards have been returned, the expansion factor is calculated. This is the ratio of total cards issued to cards
returned. For cards issued through the Wild system, calculating the total sold is straightforward; canceled or voided
cards are subtracted from the total issuance number to arrive at the number of valid cards that were available for
use. For charter cards, the total number of issued cards is estimated. Some, but not all, of the name/address stubs are
returned by the charter operators, and some, but not all, of the cards are returned by anglers. Thus, total issuance for
charter cards is estimated as follows:
N
T
= total charter/hot key cards issued
N
r
= in-sample name/address stubs returned
n
v
= total in-sample cards voluntarily returned (returned prior to reminder mailings)
n
m
= voluntary returns that match returned stubs
It is assumed that:
Therefore:

Washington State Sport Catch Report 2020 July 2022
3
Charter and hotkey cards make up less than ve percent of the total card issuance; thus, we assume that the
uncertainty in the numbers does not have a large impact in the overall estimation process.
Catch from the returned in-sample cards is expanded out across all issued cards. The expansion factor is one over the
in-sample return rate multiplied by the twenty-ve percent sample rate. In-sample return rates in recent years have
been in the 30 to 40 percent range. In 2020 the return rate was about 30%, so the expansion factor was:
1
= 13.34
0.30 (0.25)
Estimates are generated for each catch area, species, and time period. The following estimation method was
implemented after a ve-year intensive study conducted in the late 1980’s (Conrad, Alexandersdottir, 1993). Variance
is calculated using a random group method (Wolter, 1985) in which the in-sample returned cards are randomly
assigned to four subgroups. Estimates are then calculated separately for each subgroup as well as for the entire group,
and the variance is calculated using the deviations of the sample estimates from the over-all estimate.
In general, cards that are not returned have a lower mean catch per card than those that are returned. To adjust for this
non-response bias, a correction factor is applied. Different correction factors are used for different species.
The in-sample cards are randomly subdivided into four groups, and estimates are calculated using each of those
groups as follows:
N
i
= number of cards in subsample i
N
T
= total number of cards issued
h
i
= number of sh for subsample i
H
i
= estimated harvest based on subsample i
H
i
= non-response bias correction factor
Then the total estimate of harvest is generated as follows:
H
T
= total estimate
V
H
T
= variance of total estimate
The above process generates estimates for total harvest for each area/species/time period combination. For historical
reasons, the time periods differ for each species type. Calendar months are used for steelhead, sturgeon, and crab.
For salmon, statistical months or statistical weeks are often used. Statistical weeks (dened as Monday-Sunday) are
consecutively numbered weeks beginning on January 1. Statistical months are made up of a set number of statistical
weeks, which do not necessarily coincide with calendar month start and end dates.
REVIEW
The CRC catch estimates for each area/time period/species are routed to biologists (both state and tribal) for review.
The biologists are asked to list those entries that are questionable, either because the area was closed to shing
during that time period or because the likelihood of encountering that species at that time/place was low. The review
comments are compiled and used to draw up a list of those anglers reporting the questionable catch. CRC staff
attempt to contact these anglers by phone in order to resolve the issues. If the anglers cannot be reached, the biologists
make the decisions on how to handle the reports; generally if the catch is biologically feasible the report is left as
is, otherwise it is changed to “unknown”. Once the calls are completed to resolve possible errors, and the individual
catch records are corrected accordingly, the estimation process is rerun.
Salmon
Catch record card estimates are generated for both marine and freshwater areas. In areas where regular long-standing
creel surveys are conducted, the catch card numbers are replaced with the estimates generated from the creel surveys.
In marine areas, creel estimates were used in Areas 1-4 (not including Willapa Bay or Grays Harbor) and for some
Puget Sound sheries, primarily mark-selective chinook sheries in the summer and winter months. In freshwater,
creel estimates are used for catch in the Columbia River below Bonneville Dam.

Washington State Sport Catch Report 2020 July 2022
4
Steelhead
Steelhead estimates are generated from catch card returns, as described above. Since steelhead harvest numbers are
quite small for many streams, the estimates are rst generated for entire river systems. The estimates are then broken
out across the individual streams by using catch reported from all returned cards, both those that are in the sample
group, and those that are out of sample.
Steelhead are categorized as “summer-run” or “winter-run” based on the month of harvest. In general, sh caught
from May through October are considered summer-run and sh caught from November through April are considered
winter-run. For most areas in the Columbia system above Bonneville Dam, all sh are considered summer-run.
Sturgeon
Sturgeon estimates are generated from catch card returns, as described above. Retention of Green Sturgeon is now
prohibited statewide, so most reported sh are White Sturgeon. Creel estimates are used for the lower Columbia River,
up to McNary Dam.
Marine Fish
Marine sh are those species that live their entire lives in salt water. There are four general groups of marine sh for
management purposes: 1) bottomsh, which are species such as rocksh, lingcod and ounder; 2) forage sh, which
are small schooling sh such as herring and smelt; 3) pelagic sh such as tuna and mackerel; 4) Pacic halibut.
The recreational catch of bottomsh, halibut, and tuna in ocean waters (Catch Area 1-4) is estimated from port-based
creel and effort surveys. The estimates are made for each of the four main coastal shing areas: Ilwaco, Westport, La
Push, and Neah Bay.
The Puget Sound (Catch Areas 5-13) catch of bottomsh is estimated using a combination of two surveys: a creel
survey of anglers to determine the catch rate and species composition and a phone survey of licensed anglers to
determine total shing effort. Halibut catch is estimated by combining creel data with on-the-water effort surveys.
Catch record card estimates are also generated for halibut, but these numbers are not used for the published estimates.
Recreational catch of forage sh is not routinely monitored and no harvest estimates are available.
Crab
Catch record card returns are used to estimate Dungeness crab harvest in Puget Sound. Estimates are generated for
two seasons: summer, which generally runs from June through Labor Day, and winter, which runs from the day after
Labor Day through December 31. A ten-dollar penalty is assessed for failure to report, so all returned cards and online
reports are processed and used for estimation. Non-response bias varies depending on return rate.
Estimates are not available for recreational catch of Dungeness crab from the coast or the Columbia River mouth, or
for other crab species such as Red Rock or Tanner Crab.
Shrimp
Puget Sound spot shrimp estimates are calculated from boat ramp creel surveys combined with effort estimates
generated by aerial boat counts or on-the-water buoy counts.
Clams and Oysters
Coastal razor clam harvest estimates are generated by combining effort estimates (digger trips) with catch per trip
numbers from creel surveys.
Puget Sound clam and oyster harvest estimates are generated for actively managed beaches. Aerial surveys are used
to estimate effort, and creel checks are used to determine catch per trip. For beaches that are passively managed, only
effort estimates are generated.
Ocean Catch Data
Sport catch data from coastal areas 1 – 4 were reported using “port sampling” (creel survey) catch estimates.
Such estimates were derived by monitoring daily landings at four coastal ports: Ilwaco, Westport, La Push,
and Neah Bay. Catch is reported in the area where the sh was caught and not the area where it was landed.

Washington State Sport Catch Report 2020 July 2022
5
Statistical Months and Statistical Weeks
Some catch data (i.e. salmon and bottomsh) are reported using statistical months or statistical weeks.
Statistical weeks (dened as Monday-Sunday) are consecutively numbered weeks beginning on January
1 and continuing through week 53 or 54, ending on December 31. The rst and last weeks of any year
usually contain less than 7 days. Statistical months are made up of a set number of statistical weeks, which
approximate calendar months but do not coincide with calendar month start and end dates. For example,
in 2020, the statistical month of January begins January 1 and ends February 2 and the statistical month of
February starts on February 3 and ends March 2. Due to the differences between calendar and statistical
months, some catch may be reported during what appears to be a closed period.
Salmon
Annual sport salmon catch estimates for 1971 through 2020 are shown in Table 4. Between April 1, 2020,
and March 31, 2021 a total of 150,834 salmon were caught in marine areas, and 221,450 salmon were caught
in freshwater. The marine totals by species, as shown in Table 5, are: 28,082 chinook; 120,497 coho; 2,043
chum; 25 pink; 0 sockeye; and 185 jacks (all species combined). Freshwater species breakdowns are: 80,827
chinook; 52,822 coho; 4,368 chum; 0 pink; 60,969 sockeye; 22,664 jacks (all species combined).
Catch record card returns are used to estimate sport salmon catch in marine and freshwater areas. For some
areas, the catch cards numbers are replaced with estimates based on creel surveys. In marine areas, creel
estimates were used in Areas 1-4 (not including Willapa bay or Grays Harbor), and for many of the Puget
Sound sheries including the summer months in Area 5, 9, 10 and 11.
Sturgeon
On the new combined sport catch record card, sturgeon shers were required to record their catch statewide.
The total sport harvest for 2020, based on creel surveys and catch record card returns, was 1,329 sh.
Sturgeon retention was only allowed in the Columbia and Snake River systems.
Steelhead
Harvest estimates for sport-caught summer and winter steelhead are based on catch record card returns.
Steelhead caught during the months of May through October are considered “summer-runs,” designated
S. Steelhead caught from November through April are considered “winter-runs,” designated W, with
the exception of steelhead caught above Bonneville Dam on the Columbia River, where all steelhead are
considered “summer-runs,”, because of run and spawn timing.
Table 31 presents steelhead sport harvest estimates for the 2020-2021 season geographically by stream and
river system. Monthly estimate totals are given for marked and unmarked steelhead.
Marine Fish
Marine sh are those species of sh which live their entire lives in salt water. There are four general groups
of marine sh for management purposes: 1) bottomsh, which are species such as rocksh, lingcod and most
species of sole and ounder; 2) forage sh, which are small, schooling sh such as herring and smelt; 3)
tunas and mackerels; 4) Pacic halibut.
The recreational catch of bottomsh and halibut in ocean waters (Catch Areas 1-4) is estimated from marine
surveys (Table 35 and 36). The estimates are made for each of the four main coastal shing areas: Ilwaco,
Westport, La Push and Neah Bay.
The Puget Sound (Catch Areas 5-13) catch of bottomsh, excluding halibut, is estimated using a combination
of two surveys: a creel survey of anglers to determine the catch rate and species composition and a phone
survey of licensed anglers to determine total shing effort. These estimates are shown in Table 37. The
recreational catch of forage sh is not routinely monitored and no harvest estimate is available.

Washington State Sport Catch Report 2020 July 2022
6
Shellsh
Razor clam harvest on the coastal beaches is summarized in Table 38. During the fall of 2020 and the spring
of 2020 81,508 digging trips resulted in a harvest of 1,222,732 clams, for an average of 15 clams per trip.
Puget Sound recreational clam and oyster harvest estimates are shown in Table 39. Harvest totals for Manila
and native littleneck clams, butter clams, cockles, softshell clams, horse clams, geoducks and oysters are
shown for public access beaches. Estimates show 100,289 sport harvester trips gathered 240,912 total
pounds of clams and 760,613 oysters in 2020 on the monitored beaches.
The Puget Sound and Hood Canal shrimp shery harvest is reported in Table 40. Shrimpers caught
201,983 pounds of shrimp between May and September. The sport crab shery in the Puget Sound areas is
summarized in Table 41. Crabbers harvested an estimated 1,649,095 pounds of Dungeness crab.
REFERENCES
Conrad, R. and M. Alexandersdottir. 1993. Estimating the Harvest of Salmon by the Puget Sound Sport Fishery in
Puget Sound: Evaluation and Recommendations. Northwest Fishery Resource Bulletin, Manuscript Series Report No.
1. 82 p.
Wolter, K.M. 1985. Introduction to Variance Estimation. In: Springer Series in Statistics. Springer-Verlag. New York.
427 p.

Washington State Sport Catch Report 2020 July 2022
7
sport
LiCenses

Washington State Sport Catch Report 2020 July 2022
8
*Value does not include service charges and other fees that are included in the listed customer price.
Table 1. Number and Value of Sport Fishing Licenses Sold in Washington.
April 1, 2020 - March 31, 2021 - License Year
Type of License Price Number Sold Value
Saltwater
Resident $30.05 33,210 $830,250
Non-Resident $59.75 2,299 $119,548
Senior $8.05 4,928 $24,640
Freshwater
Resident $29.50 379,361 $9,484,025
Non-Resident $84.50 12,467 $935,025
Senior $7.5 0 32,466 $162,330
Shellsh/Seaweed
Resident $17. 40 96,819 $968,190
Non-Resident $36.10 4,937 $133,299
Senior $7.5 0 10,862 $54,310
Combination (Saltwater/Freshwater/Shellsh)
Resident $55.35 126,039 $5,671,755
Fish Washington $69.55 60,431 $1,545,896
Get Outdoors $23 6.18 4,959 $720,569
Non-Resident $124.65 4,293 $463,644
Senior $19.05 21,780 $326,700
Disabled/Veteran - Res $11.35 17, 28 4 $86,420
Disabled/Veteran - NR $55.35 435 $19,575
Youth $8.05 12,303 $61,515
Short-term Combination
1-day Resident $11.35 45,348 $362,784
1-day Non-Resident $20.15 26,142 $418,272
2-day Resident $15.75 8,960 $107,52 0
2-day Non-Resident $28.95 8,864 $212,736
3-day Resident $19.05 10,483 $157, 24 5
3-day Non-Resident $35.55 14,390 $431,700
Razor Clam
Annual Resident $14.10 10,993 $87,944
Annual Non-resident $21.80 1,316 $21,939
3-day $9.70 6,017 $29,655
PS Crab Endorsement
Annual $8.75 129,001 $ 9 67, 50 8
1-5 day $3.80 9,478 $28,434
Catch Cards with Halibut
All $5.00 36,553 $182,765
Charter/Guide Stamps
Charter/Guide Stamps $8.50 20,915 $177,778
Two-Rod Endorsements
Resident / Non-resident $14.80 81,390 $1,058,070
Senior $6.00 14,712 $73,560
Columbia River Endorsements
Resident / Non-resident $8.75
Senior / Youth $7.10
Duplicates
Additional Catch Cards $12.60 15,943 $175,373
Licenses $9.70 227 $1,249
Total 1,265,605 $26,102,223

Washington State Sport Catch Report 2020 July 2022
9
teChniCaL Data
*Value does not include service charges and other fees that are included in the listed customer price.

Washington State Sport Catch Report 2020 July 2022
10
Table 2. Number of Catch Record Cards Issued 1971-2020
Year Salmon Steelhead Sturgeon
1971 541,600 145,647
1972 536,750 153,977
1973 568,825 165,671
1974 562,375 154,051
1975 576,075 no data
1976 66 0,150 no data
1977 641,050 no data
1978 580,375 130,000
1979 487,875 136,000
1980 433,700 139,500
1981 463,561 132,000
1982 481,915 100,000
1983 481,025 101,800
1984 364,286 133,400
1985 403,523 121,500
1986 431,898 100,500
1987 475,459 102,000
1988 486,356 108,182 33,195
1989 509,534 106,666 35,576
1990 497, 215 98,362 32,421
1991 489,394 98,328 32,396
1992 419,986 98,933 37,615
1993 447,9 8 6 94,913 43,067
1994 244,629 87,0 93 54,837
1995 416,707 101,303 62,572
1996 333,773 92,858 69,639
1997 331,511 68,341 76,806
1998 265,296 85,636 79,264
1999-2000 352,003 183,520 132,503
Combined Crab - Summer Crab - Winter
2000-2001* 539,898
2001-2002 827,4 43
2002-2003 767,465
2003-2004 799,326
2004-2005 715,395
2005-2006 686,831
2006-2007 672,753
2007-2008** 640,893 210,327 157,712
2008-2009 603,539 210,893 207,143
2009-2010 729,319 236,665 89,259
2010-2011 574,969
208,458
70,731
2011-2012 632,564
230,355
28,514
2012-2013 566,372 200,711 27,711
2013-2014 631,536 214,692 29,638
2014-2015 606,471 213,741 35,371
2015-2016 636,596 232,619 36,397
2016-2017 499,989 216,949 26,591
2017-2018 541,830 21 5,929 23,277
2018-2019
498,791 200,962 24,620
2019-2020
499,128 192,794 23,578
2020-2021
579,430 213,823 36,458
*Starng with the 2000-2001 season, all species were combined on a single card.
**Starting with the 2007-2008 season, separate cards were issued for Dungeness Crab, for both the summer season
and the fall/winter season.
Washington State Sport Catch Report 2020 July 2022
11
Table 3. 2020-2021 Catch Record Card Technical Data
Cards Issued 579,430
In-sample cards 143,436
In-sample cards returned 39,146
Expansion Factor (Cards Issued / In-sample Returns) 14.80
Non-reporting bias correction factors
Salmon - Marine Area 5 1.00
Salmon - Puget Sound Marine Areas 1.46
Salmon - Freshwater, Grays Harbor, Willapa Bay 1.20
Steelhead 0.98
Sturgeon 1.00

Washington State Sport Catch Report 2020 July 2022
12
Washington State Sport Catch Report 2020 July 2022
13
Salmon
Washington State Sport Catch Report 2020
July 2022
14
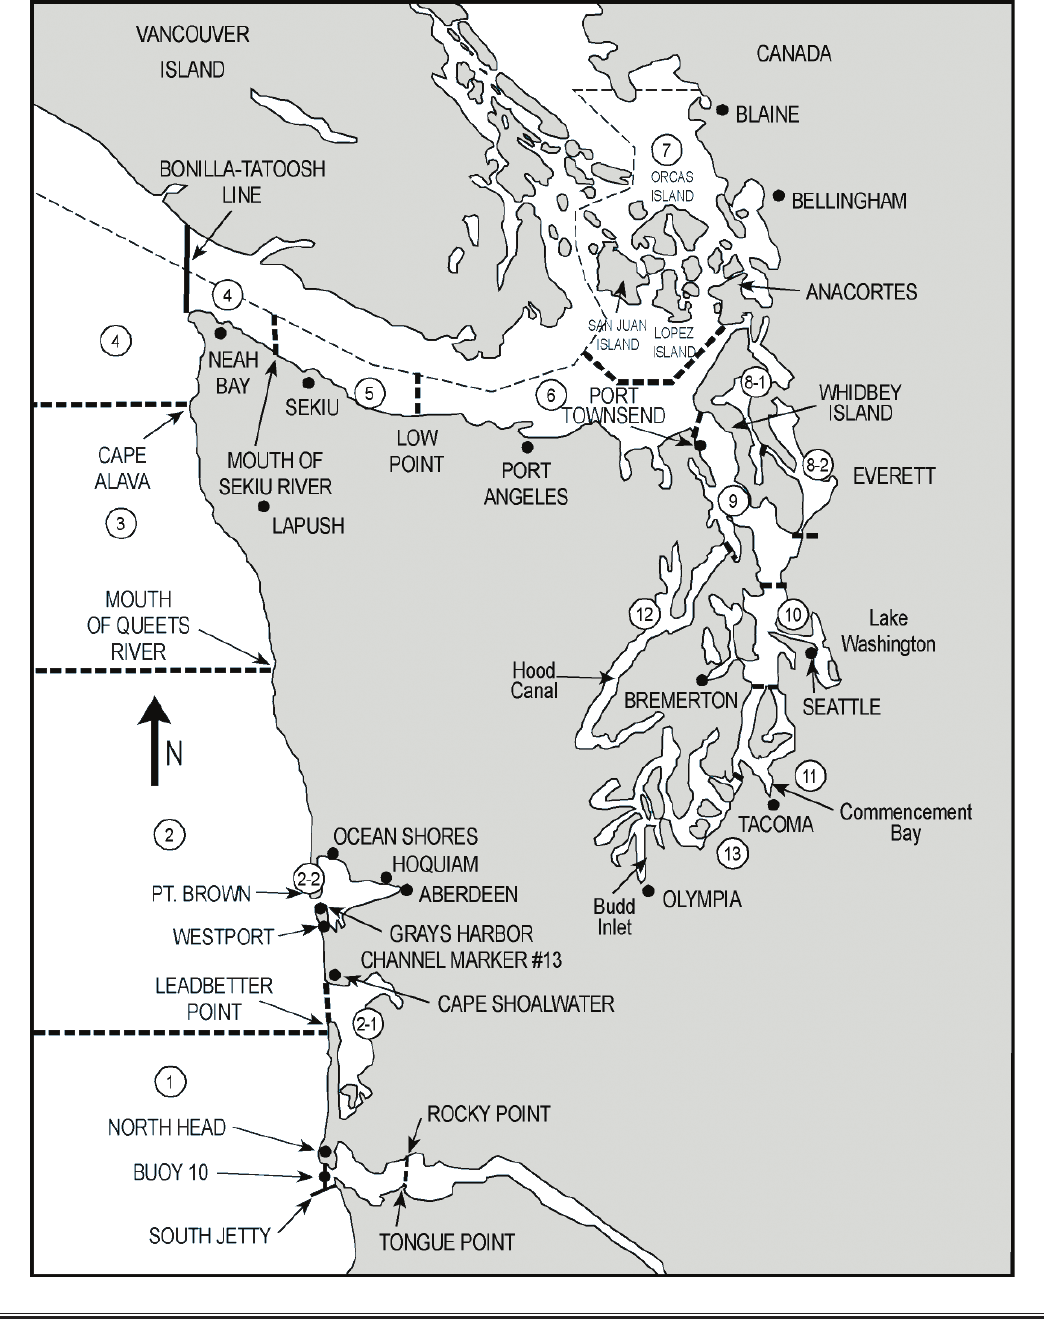
Map of saLMon CatCh reCorD CarD areas
Marine Waters onLy

Washington State Sport Catch Report 2020 July 2022
15
1 ILWACO West of the Buoy 10 line at the Columbia River mouth, north to
Leadbetter Point.
2 WESTPORT-OCEAN SHORES From Leadbetter Point north to the Queets River, excluding
Willapa Bay and Grays Harbor.
2-1 WILLAPA BAY East of a line from Leadbetter Point to Cape Shoalwater.
2-2 GRAYS HARBOR East of a line from the tip of the North Jetty to exposed end of
the South Jetty.
3 LA PUSH From the Queets River north to Cape Alava.
4 NEAH BAY From Cape Alava north and inside Juan de Fuca Strait to the
Sekiu River.
5 SEKIU AND PILLAR POINT From mouth of the Sekiu River east to Low Point, mouth of the
Lyre River.
6 EAST JUAN DE FUCA STRAIT From Low Point east to the Partridge Point - Point Wilson line north
to the line from Trial Island (near Victoria B.C.) - Vessel Trafc
Separation Buoy “R” - Smith Island to the Lawson Reef Buoy to
Northwest Island to the Initiative 77 marker on Fidalgo Island.
7 SAN JUAN ISLANDS All marine waters north of the Trial Island line described under
Area 6 to the United States-Canada boundary.
8-1 DECEPTION PASS, SK AGIT BAY From West Point to Reservation Head eastward through Deception
Pass, including all waters of Swinomish Slough and Skagit Bay, and
the portion of Saratoga Passage north and west of a line from East
Point Light to light on Camano Island (Saratoga Pass Light #4Fl Red
4 Sec.).
8-2 PORTS SUSAN AND GARDNER East of East Point Light-Camano Island Light line (described in 8-1
above) and north of the Possession Point-Shipwreck line (described
in 9 below).
9 ADMIRALTY INLET All waters inside and south of the Partridge Point - Point Wilson line,
south and west of a line from Possession Point 110º true to
shipwreck, north of the Hood Canal Bridge, and north of the Apple
Cove Point-Edwards Point line.
10 SEATTLE-BREMERTON AREA South from the Apple Cove Point-Edwards Point line to a line
projected true east- west through the north tip of Vashon Island.
11 TACOMA-VASHON ISLAND South from a line projected true east west through the north tip of
Vashon Island to the Tacoma Narrows Bridge.
12 HOOD CANAL All waters south of the Hood Canal Bridge.
13 SOUTH PUGET SOUND All waters south of Tacoma Narrows Bridge.
FRESHWATER AREAS RIVERS OR STREAMS OR LAKES - Name of river, stream or lake,
except for Buoy 10
BUOY 10 (1A) From Buoy 10 Line to Rocky Point-Tongue Point Line

Washington State Sport Catch Report 2020
July 2022
16
Table 4. Annual Sport Salmon Catch 1971-2020
Year Tot al
Fresh-
water
Un-
known
Area
1
Area
1A
Area
2
Area
2-1
Area
2-2
Area
3
Area
4
Area
5
Area
6
Area
7
Area
8
Area
8-1
Area
8-2
Area
9
Area
10
Area
11
Area
12
Area
13
1971 1,344,818 145,904 342,928 446,738 39,682 87,18 4 71,947 39,573 28,355 5,189 54,920 35,225 27, 3 3 2 19,841
1972 1,138,926 121,432 307,938 353,113 31,278 61,704 45,446 45,058 29,536 3,097 42,968 32,942 35,962 28,452
1973 1,095,360 147,554 236,385 348,406 49,900 48,645 33,347 40,308 14,852 3,966 52,935 42,574 61,919 14,569
1974 1,320,420 88,048 334,664 320,467 74,832 80,362 50,319 53,222 36,318 5,491 76,518 69,341 105,110 25,728
1975 1,399,375 101,531 308,475 331,565 57, 3 56 59,451 48,975 74,336 37,626 7,7 2 6 100,089 78,832 162,072 31,341
1976 1,749,560 100,601 433,026 543,295 70,133 68,670 63,966 102,639 55,396 21,688 88,737 62,607 61,562 24,405 52,835
1977 1,191,414 96,843 248,518 321,888 38,359 86,186 73,106 61,568 31,709 17,79 2 64,651 39,372 44,657 22,020 44,745
1978 1,107,852 86,845 220,548 269,338 24,439 52,270 59,400 68,849 36,293 13,229 73,187 56,479 48,018 26,801 72,15 6
1979 1,123,809 88,659 167, 478 174,365 24,16 0 53,840 134,354 70,839 48,101 33,835 104,619 71,167 71,495 20,006 60,891
1980 852,879 105,461 158,883 163,748 19,146 29,500 39,587 52,663 24,457 18,432 60,072 52,128 57,751 17,13 8 53,913
1981 76 0,10 4 5 8,128 142,879 151,301 1,734 36,883 55,900 56,318 21,826 16,986 67,83 8 42,602 42,175 14,989 50,545
1982 749,995 91,849 102,769 13,069 158,005 9,857 42,716 67,611 33,870 12,947 9,940 49,853 49,727 51,975 8,672 47,13 5
1983 860,623 108,783 95,593 3,006 100,791 7,318 58,469 62,486 74,311 29,844 23,268 98,485 54,228 72,772 11,756 59,513
1984 561,428 142,170 23,927 55,865 16,631 167 6,604 39,276 67, 246 29,985 17,442 79,526 24,130 28,781 5,158 24,520
1985 686,333 107,734 75,013 18,914 93,620 2,062 26,878 101,920 45,342 23,798 25,427 75,193 33,019 38,157 4,897 14,359
1986 830,644 115,46 9 69,915 86,360 98,421 2,553 25,027 138,951 71,544 27,550 26,822 79,730 33,686 33,891 3,460 17,26 5
1987 782,834 110,636 62,393 61,048 71,458 3,005 29,418 107,13 8 82,377 27,152 31,421 86,270 42,179 32,753 8,947 26,639
1988 703,088 168,594 22,960 120,019 62,001 3,341 19,576 107,935 47,483 22,225 16,514 47,109 28,020 22,202 2,420 12,689
1989 832,214 121,417 87,755 67,73 4 100,000 2,405 44,600 164,580 64,766 19,078 23,165 63,724 36,748 24,561 4,588 7,093
1990 824,14 3 107,934 97, 84 4 16,850 102,984 5,809 48,329 223,012 54,848 12,797 14,865 57,875 47,519 25,555 1,618 6,304
1991 943,473 153,719 77,60 8 152,974 107,3 6 2 1,965 9,047 5,615 43,357 216,816 42,812 16,602 3,528 16,809 40,390 32,229 15,549 3,225 3,866
1992 569,195 90,032 48,356 37,157
67,427 1,978 2,031 25,820 108,876 30,894 12,515 3,295 11,836 47,157 51,338 18 ,198 6,303 5,982
1993 599,361 145,579 49,587 17,975 5 7, 9 90 2,260 743 3,469 31,15 4 80,496 4 4,174 35,697 6,15 0 18,170 41,949 36,699 14,130 3,540 9,599
1994 156,896 61,142 1,069 71 2,574 1,971 Closed Closed 518 1,184 8,322 1,917 3,301 6,978 23,279 25,360 8,905 10,305
1995 524,232 190,158 3,743 24,954 29,122 936 1,799 1,990 15,604 53,553 20,617 23,801 23,503 42,900 22,920 28,560 28,242 5,200 6,630
1996 390,660 161,108 17, 8 82 3,509 23,089 2,422 2,601 1,901 8,750 41,820 18,10 3 15,486 2,350 13,968 20,343 18,972 25,417 6,408 6,531
1997 394,868 98,220 11,976 22,441 16,261 409 1,433 1,260 2,577 52,890 23,614 35,016 5,894 37,649 24,356 25,277 23,146 7,089 5,360
1998 235,466 78,664 4,738 5,364 9,348 1,329 2,970 762 8,045 24,509 6,657 5,801 2,095 12,409 24,324 16,674 17,272 7,782 6,723
1999 239,317 92,611 21,989 11,222 19,056 2,137 1,207 4,387 6,650 24,546 3,509 5,765 1,519 8,805 9,228 4,009 14,517 4,046 4,114
2000 401,180 191,805 4,228 27,889 16,335 34,636 870 2,736 2,519 11,652 29,883 4,334 7,178 2,10 5 12,798 12,608 15,681 14,212 4,580 5,131
2001 1,056,395 405,590 11,042 82,641 80,701 85,645 1,255 5,784 4,18 8 21,991 87,639 12,081 17,26 8 17,6 8 5 74,947 70,259 26,448 27,761 17, 67 7 5,793
2002 551,479 306,424 6,443 53,015 61,715 960 3,530 3,736 13,523 35,10 0 1,418 8,326 1,544 8,609 12,731 11, 885 12,044 7, 0 3 9 3,437
2003 810,616 342,884 6,940 83,16 4 64,733 1,953 2,135 6,537 32,207 88,885 13,781 12,409 10,573 51,784 44,697 16,5 41 17,719 10,898 2,776
2004 474,929 214,116 2,562 59,321 38,616 1,759 6,017 5,152 34,760 45,000 2,511 3,428 1,117 7, 6 06 15,024 13,766 13,944 7,2 9 3 2,937
2005 451,411 200,535 1,789 38,490 32,823 3,580 1,910 4,316 15,297 58,621 3,295 5,934 1,691 18,846 24,125 12,866 15,022 8,392 3,879
2006 288,716 174,224 1,212 21,254 14,506 3,368 1,812 3,754 7,136 13,244 1,601 4,486 378 2,280 6,398 11,193 12,024 6,214 3,632
2007 545,737 231,800 2,501 49,108 28,694 1,473 1,635 3,545 16,057 75,084 6,626 9,961 1,513 21,604 41,906 20,149 22,602 6,955 4,524
2008 251,975 160,431 1,491 11,729 16,983 2,788 1,001 1,356 3,415 14,765 1,437 3,651 580 1,303 6,982 8,007 9,598 3,124 3,334
2009 1,074,938 571,230 16,885 69,430 60,414 5,975 5,257 10,437 69,692 73,767 16,056 10,173 6,207 32,774 63,436 30,738 26,325 4,081 2,061
2010 335,931 204,196 3,881 24,191 39,821 1,893 2,122 2,19 6 6,934 19,540 3,014 4,543 234 961 7,78 6 6,369 4,621 2,415 1,214
2011 906,876 572,283 15,699 26,948 34,069 6,314 3,327 5,558 13,024 62,003 20,257 19,305 12,935 23,979 35,631 23,810 22,540 5,738 3,456
2012 584,694 285,247 4,624 17,131
31,417 4,358 9,030 3,804 12,787 72,396 17,49 4 9,228 2,549 13,863 53,679 25,308 12,690 6,855 2,234
2013 1,125,794 732,850 8,557 23,121 35,062 2,756 2,660 6,117 18,368 65,534 26,851 26,506 10,227 26,038 85,769 31,508 15,574 5,541 2,755
2014 698,126 346,446 6,772 67,498 77,815 14,583 7, 3 97 7,4 8 4 10,248 52,908 21,705 11,222 3,743 9,414 36,758 14,032 4,693 3,544 1,864
2015 1, 0 47,6 9 3 522,10 2 11,060 45,127 51,905 19,051 2,475 4,041 18,228 81,907 34,792 40,107 10,743 37,910 117, 477 31,481 12,217 4,331 2,739
2016 305,960 220,736 2,687 21,034 8,352 7,4 52 819 164 3,415 4,224 7,317 6,205 517 1,14 3 5,754 1,635 2,167 9,675 2,664
2017 388,305 220,195 2,655 21,544 21,498 6,192 2,494 2,025 11,732 13,318 5,852 13,055 517 1,496 14,286 25,579 8,726 11,397 5,744
2018 337,807 152,856 1,766 15,063 2 0,122 1,969 1,289 1,13 0 8,225 19,505 14,972 13,867 1,640 11,646 15,924 32,650 12,468 8,228 4,487
2019 427,475 194,154 2,083 39,690 22,16 8 3,193 2,117 2,656 10,931 24,287 12,334 11,916 2,402 11,614 32,489 39,879 8,810 3,626 3,126
2020 372,284 219,529 1,921 9,936 12,534 1,472 2,637 151 5,115 42,018 7,657 12,528 441 10,680 31,964 5,790 4,519 3,392
Note: In 1976, several area boundary lines were changed resulting in thirteen catch areas instead of twelve. The changes were mostly reected in catch Areas 8, 9 ,10 and new Area 13. In 1989, catch Area 8 was subdivided into
Areas 8.1 and 8.2 and catch Area 2 was subdivided into Areas 2, 2-1 and 2-2. For comparative purposes, the catch for Areas 8-1 and 8-2 are totaled and entered under Area 8 until 1990. Beginning in 1991, Areas 8-1 and 8-2, are
reported separately. Similarly, the catch in Areas 2, 2-1 and 2-2 are included in the total catch for Area 2 until 1990. Beginning in 1991, they are reported separately. The total catch for Area 1 and Area 1A is included in the total
catch for Area 1 until 1981. Starting in 1982, they are reported separately. Beginning in 2002, Area 1A catch is included in the freshwater total.
Note: Prior to 1999, sport salmon estimates were based on calendar years. In 1999, the sport estimates cover January 1, 1999 - March 31, 2000. Starting in 2000, sport salmon estimates are based on the shing license year
which runs from April 1 to March 31.

Washington State Sport Catch Report 2020 July 2022
17
Table 4. Annual Sport Salmon Catch 1971-2020
Year Tot al
Fresh-
water
Un-
known
Area
1
Area
1A
Area
2
Area
2-1
Area
2-2
Area
3
Area
4
Area
5
Area
6
Area
7
Area
8
Area
8-1
Area
8-2
Area
9
Area
10
Area
11
Area
12
Area
13
1971 1,344,818 145,904 342,928 446,738 39,682 87,18 4 71,947 39,573 28,355 5,189 54,920 35,225 27,332 19,841
1972 1,138,926 121,432 307,938 353,113 31,278 61,704 45,446 45,058 29,536 3,097 42,968 32,942 35,962 28,452
1973 1,095,360 147,554 236,385 348,406 49,900 48,645 33,347 40,308 14,852 3,966 52,935 42,574 61,919 14,569
1974 1,320,420 88,048 334,664 320,467 74,832 80,362 50,319 53,222 36,318 5,491 76,518 69,3 41 105,110 25,728
1975 1,399,375 101,531 308,475 331,565 57,3 5 6 59,451 48,975 74,336 37,626 7,72 6 100,089 78,832 162,072 31,3 41
1976 1,749,560 100,601 433,026 543,295 70,133 68,670 63,966 102,639 55,396 21,688 88,737 62,607 61,562 24,405 52,835
1977 1,191,414 96,843 248,518 321,888 38,359 86,186 73,106 61,568 31,709 17,79 2 64,651 39,372 44,657 22,020 44,745
1978 1,107,852 86,845 220,548 269,338 24,439 52,270 59,400 68,849 36,293 13,229 73,187 56,479 48,018 26,801 72,156
1979 1,123,809 88,659 167, 478 174,365 24,16 0 53,840 134,354 70,839 48,101 33,835 104,619 71,167 71,495 20,006 60,891
1980 852,879 105,461 158,883 163,748 19,146 29,500 39,587 52,663 24,457 18,432 60,072 52,128 57,751 17,13 8 53,913
1981 76 0,10 4 5 8,128 142,879 151,301 1,734 36,883 55,900 56,318 21,826 16,986 67,83 8 42,602 42,175 14,989 50,545
1982 749,995 91,849 102,769 13,069 158,005 9,857 42,716 67,611 33,870 12,947 9,940 49,853 49,727 51,975 8,672 47,13 5
1983 860,623 108,783 95,593 3,006 100,791 7,318 58,469 62,486 74,311 29,844 23,268 98,485 54,228 72,772 11,756 59,513
1984 561,428 142,170 23,927 55,865 16,631 167 6,604 39,276 67, 24 6 29,985 17,442 79,526 24,130 28,781 5,158 24,520
1985 686,333 107,734 75,013 18,914 93,620 2,062 26,878 101,920 45,342 23,798 25,427 75,193 33,019 3 8 ,157 4,897 14,359
1986 830,644 115,46 9 69,915 86,360 98,421 2,553 25,027 138,951 71,544 27,550 26,822 79,730 33,686 33,891 3,460 17,265
1987 782,834 110,636 62,393 61,048 71,458 3,005 29,418 107,13 8 82,377 27,152 31,421 86,270 42,179 32,753 8,947 26,639
1988 703,088 168,594 22,960 120,019 62,001 3,341 19,576 107,935 47, 4 8 3 22,225 16,514 47,109 28,020 22,202 2,420 12,689
1989 832,214 121,417 87,755 67,73 4 100,000 2,405 44,600 164,580 64,766 19,078 23,165 63,724 36,748 24,561 4,588 7,093
1990 824,14 3 107,934 97, 84 4 16,850 102,984 5,809 48,329 223,012 54,848 12,797 14,865 57,875 47,519 25,555 1,618 6,304
1991 943,473 153,719 77,60 8 152,974 107,3 6 2 1,965 9,047 5,615 43,357 216,816 42,812 16,602 3,528 16,809 40,390 32,229 15,549 3,225 3,866
1992 569,195 90,032 48,356 37,157
67,427 1,978 2,031 25,820 108,876 30,894 12,515 3,295 11,836 47,157 51,338 18 ,198 6,303 5,982
1993 599,361 145,579 49,587 17,975 5 7, 9 90 2,260 743 3,469 31,15 4 80,496 4 4,174 35,697 6,15 0 18,170 41,949 36,699 14,130 3,540 9,599
1994 156,896 61,142 1,069 71 2,574 1,971 Closed Closed 518 1,184 8,322 1,917 3,301 6,978 23,279 25,360 8,905 10,305
1995 524,232 190,158 3,743 24,954 29,122 936 1,799 1,990 15,604 53,553 20,617 23,801 23,503 42,900 22,920 28,560 28,242 5,200 6,630
1996 390,660 161,108 17, 8 82 3,509 23,089 2,422 2,601 1,901 8,750 41,820 18,10 3 15,486 2,350 13,968 20,343 18,972 25,417 6,408 6,531
1997 394,868 98,220 11,976 22,441 16,261 409 1,433 1,260 2,577 52,890 23,614 35,016 5,894 37,649 24,356 25,277 23,146 7,089 5,360
1998 235,466 78,664 4,738 5,364 9,348 1,329 2,970 762 8,045 24,509 6,657 5,801 2,095 12,409 24,324 16,674 17,272 7,782 6,723
1999 239,317 92,611 21,989 11,222 19,056 2,137 1,207 4,387 6,650 24,546 3,509 5,765 1,519 8,805 9,228 4,009 14,517 4,046 4,114
2000 401,180 191,805 4,228 27,889 16,335 34,636 870 2,736 2,519 11,652 29,883 4,334 7,178 2,10 5 12,798 12,608 15,681 14,212 4,580 5,131
2001 1,056,395 405,590 11,042 82,641 80,701 85,645 1,255 5,784 4,18 8 21,991 87,639 12,081 17,26 8 17,6 8 5 74,947 70,259 26,448 27,761 17, 67 7 5,793
2002 551,479 306,424 6,443 53,015 61,715 960 3,530 3,736 13,523 35,10 0 1,418 8,326 1,544 8,609 12,731 11, 885 12,044 7, 0 3 9 3,437
2003 810,616 342,884 6,940 83,16 4 64,733 1,953 2,135 6,537 32,207 88,885 13,781 12,409 10,573 51,784 44,697 16,5 41 17,719 10,898 2,776
2004 474,929 214,116 2,562 59,321 38,616 1,759 6,017 5,152 34,760 45,000 2,511 3,428 1,117 7, 6 06 15,024 13,766 13,944 7,2 9 3 2,937
2005 451,411 200,535 1,789 38,490 32,823 3,580 1,910 4,316 15,297 58,621 3,295 5,934 1,691 18,846 24,125 12,866 15,022 8,392 3,879
2006 288,716 174,224 1,212 21,254 14,506 3,368 1,812 3,754 7,136 13,244 1,601 4,486 378 2,280 6,398 11,193 12,024 6,214 3,632
2007 545,737 231,800 2,501 49,108 28,694 1,473 1,635 3,545 16,057 75,084 6,626 9,961 1,513 21,604 41,906 20,149 22,602 6,955 4,524
2008 251,975 160,431 1,491 11,729 16,983 2,788 1,001 1,356 3,415 14,765 1,437 3,651 580 1,303 6,982 8,007 9,598 3,124 3,334
2009 1,074,938 571,230 16,885 69,430 60,414 5,975 5,257 10,437 69,692 73,767 16,056 10,173 6,207 32,774 63,436 30,738 26,325 4,081 2,061
2010 335,931 204,196 3,881 24,191 39,821 1,893 2,122 2,19 6 6,934 19,540 3,014 4,543 234 961 7,78 6 6,369 4,621 2,415 1,214
2011 906,876 572,283 15,699 26,948 34,069 6,314 3,327 5,558 13,024 62,003 20,257 19,305 12,935 23,979 35,631 23,810 22,540 5,738 3,456
2012 584,694 285,247 4,624 17,131
31,417 4,358 9,030 3,804 12,787 72,396 17,49 4 9,228 2,549 13,863 53,679 25,308 12,690 6,855 2,234
2013 1,125,794 732,850 8,557 23,121 35,062 2,756 2,660 6,117 18,368 65,534 26,851 26,506 10,227 26,038 85,769 31,508 15,574 5,541 2,755
2014 698,126 346,446 6,772 67,498 77,815 14,583 7, 3 97 7,4 8 4 10,248 52,908 21,705 11,222 3,743 9,414 36,758 14,032 4,693 3,544 1,864
2015 1, 0 47,6 9 3 522,10 2 11,060 45,127 51,905 19,051 2,475 4,041 18,228 81,907 34,792 40,107 10,743 37,910 117, 477 31,481 12,217 4,331 2,739
2016 305,960 220,736 2,687 21,034 8,352 7,4 52 819 164 3,415 4,224 7,317 6,205 517 1,14 3 5,754 1,635 2,167 9,675 2,664
2017 388,305 220,195 2,655 21,544 21,498 6,192 2,494 2,025 11,732 13,318 5,852 13,055 517 1,496 14,286 25,579 8,726 11,397 5,744
2018 337,807 152,856 1,766 15,063 2 0,122 1,969 1,289 1,13 0 8,225 19,505 14,972 13,867 1,640 11,646 15,924 32,650 12,468 8,228 4,487
2019 427,475 194,154 2,083 39,690 22,16 8 3,193 2,117 2,656 10,931 24,287 12,334 11,916 2,402 11,614 32,489 39,879 8,810 3,626 3,126
2020 372,284 219,529 1,921 9,936 12,534 1,472 2,637 151 5,115 42,018 7,657 12,528 441 10,680 31,964 5,790 4,519 3,392
Note: In 1976, several area boundary lines were changed resulting in thirteen catch areas instead of twelve. The changes were mostly reected in catch Areas 8, 9 ,10 and new Area 13. In 1989, catch Area 8 was subdivided into
Areas 8.1 and 8.2 and catch Area 2 was subdivided into Areas 2, 2-1 and 2-2. For comparative purposes, the catch for Areas 8-1 and 8-2 are totaled and entered under Area 8 until 1990. Beginning in 1991, Areas 8-1 and 8-2, are
reported separately. Similarly, the catch in Areas 2, 2-1 and 2-2 are included in the total catch for Area 2 until 1990. Beginning in 1991, they are reported separately. The total catch for Area 1 and Area 1A is included in the total
catch for Area 1 until 1981. Starting in 1982, they are reported separately. Beginning in 2002, Area 1A catch is included in the freshwater total.
Note: Prior to 1999, sport salmon estimates were based on calendar years. In 1999, the sport estimates cover January 1, 1999 - March 31, 2000. Starting in 2000, sport salmon estimates are based on the shing license year
which runs from April 1 to March 31.
Table 5. Total 2020-2021 Sport Salmon Catch
Marine Area Chinook Coho Chum Pink Sockeye
Chinook
Jacks
Coho
Jacks
Total
Salmon
Marine
Angler
Trips
Salmon
per Trip
Ilwaco-Ocean (Area 1) 740 9,196 9,936 8,996 1.10
Westport (Area 2) 4,727 7,8 0 5 2 12,534 17,146 0.73
Willapa Bay (Area 2.1) 718 668 37 49 1,472
N/A
Grays Harbor (Area 2.2) 337 2,167 34 12 87 2,637
N/A
LaPush (Area 3) 13 138 151 143 1.06
Neah Bay (Area 4) 2,004 3,111 5,115 6,885 0.74
Subtotal Coast* 8,539 23,085 34 49 136 31,845 33,170 0.84
Sekiu-Pillar Point (Area 5) 5,263 36,752 3 42,018 45,838 0.92
East Juan de Fuca (Area 6) 2,292 5,365 7,657 8,460 0.91
San Juan Islands (Area 7) 1,691 10,827 10 12,528 25,559
Deception Pass, Hope Island (Area 8-1)
Port Susan & Port Gardner (Area 8-2) 441 441 845 0.52
Admiralty Inlet (Area 9) 3,995 6,685 10,680 51,614 0.21
Seattle-Bremerton (Area 10) 1,864 29,951 145 4 31,964 54,582 0.59
Tacoma-Vashon Island (Area 11) 2,090 3,700 5,790 34,795 0.17
Hood Canal (Area 12) 601 3,674 236 8 4,519 4,004 1.13
South Puget Sound (Area 13) 1,306 458 1,628 3,392 4,079 0.83
Subtotal Puget Sound 19,543 97,412 2,009 25 118,989 229,776 0.52
Marine Area Totals* 28,082 120,497 2,043 25 49 136 150,834 262,946 0.57
Freshwater Totals 80,827 52,622 4,368 60,969 11, 265 11,399 221,450
N/A
Grand Totals 108,909 173,119 6,411 25 60,969 11,314 11,535 372,284
N/A
*Salmon per trip is calculated after subtracting the catch totals for Willapa Bay and Grays Harbor, where angler trip data is not available.
Washington State Sport Catch Report 2020
July 2022
18
Table 6. 2020 Sport Salmon Catch, Area 1 - Ilwaco: Ocean
Week
Ending
Year Chinook Coho Pink Sockeye Chum
Total
Salmon
Angler
Trips
Salmon
per Trip
June 21 2020 106 106 322 0.33
June 28 2020 105 105 317 0.33
July 5 2020 133 1,435 1,568 1,774 0.88
July 12 2020 209 3,985 4,19 4 2,878 1.46
July 19 2020 53 1,155 1,208 1,246 0.97
July 26 2020 134 2,621 2,755 2,459 1.12
Total 740 9,196 9,936 8,996 1.10
Table 7. 2020 Sport Salmon Catch, Area 1 - Ilwaco: River (Buoy 10)
Week
Ending
Year Chinook Coho Pink Sockeye Chum
Total
Salmon
Angler
Trips
Salmon
per Trip
August 16 2020 1,270 99 1,369 6,379 0.21
August 23 2020 1,307 661 1,968 10,018 0.20
August 30 2020 1,619 859 2,478 6,629 0.37
September 6 2020 345 933 1,278 4,232 0.30
September 13 2020
September 20 2020 4 184 188 791 0.24
September 27 2020 3 91 94 972 0.10
Sep 28-Oct 31 2020 3 157 160 488 0.33
Total 4,551 2,984 7,535 29,509 0.26
Washington State Sport Catch Report 2020 July 2022
19
Table 8. 2020 Sport Salmon Catch, Area 2 - Westport
Week
Ending
Year Chinook Coho Pink Sockeye Chum
Total
Salmon
Angler
Trips
Salmon
per Trip
June 21 2020 33 33 417 0.08
June 28 2020 15 15 156 0.10
July 5 2020 130 95 225 567 0.40
July 12 2020 498 580 1,078 1,485 0.73
July 19 2020 717 687 1,404 1,484 0.95
July 26 2020 778 698 1,476 2,130 0.69
August 2 2020 835 533 2 1,370 2,356 0.58
August 9 2020 312 1,015 1,327 1,470 0.90
August 16 2020 296 619 915 1,378 0.66
August 23 2020 549 659 1,208 1,403 0.86
August 30 2020 88 618 706 1,034 0.68
Aug 31-Sept 13 2020 388 2,095 2,482 2,400 1.03
September 20 2020 73 139 212 685 0.31
September 27 2020 8 46 53 120 0.44
October 4 2020 6 22 29 61 0.47
Total 4,727 7,8 05 2 12,534 17,14 6 0.73
Table 9. 2020-2021 Sport Salmon Catch, Area 2-1 - Willapa Bay
Calendar Month Year Chinook Coho Pink Sockeye Chum
Chinook
Jacks
Coho
Jacks
Total
Salmon
July 2020 35 16 51
August 2020 527 92 37 12 668
September 2020 156 510 25 691
October 2020 50 12 62
Total 718 668 37 49 1,472
NOTE: Estimates from July-September are from creel surveys; all other estimates are from catch record cards.
Washington State Sport Catch Report 2020
July 2022
20
Table 10. 2020-2021 Sport Salmon Catch, Area 2-2 - Grays Harbor
Statistical
Month
Year Chinook Coho Pink Sockeye Chum
Chinook
Jacks
Coho
Jacks
Total
Salmon
July 2020 25 25
August 2020 167 22 189
September 2020 170 986 12 37 1,205
October 2020 1,156 12 50 1,218
Total 337 2,167 34 12 87 2,637
Table 11. 2020 Sport Salmon Catch, Area 3 - La Push
Week
Ending
Year Chinook Coho Pink Sockeye Chum
Total
Salmon
Angler
Trips
Salmon
per Trip
June 28 2020 3 0.00
July 5 2020
July 12 2020 13 5 18 17 1.06
July 19 2020 0
July 26 2020 0
August 2 2020 14 14 7 2.00
August 9 2020 44 44 22 2.00
August 16 2020 42 42 42 1.00
August 23 2020 18 18 9 2.00
August 30 2020 3 3 43 0.07
Aug 31-Sept 13 2020 12 12
Total 13 138 151 143 1.06
Washington State Sport Catch Report 2020 July 2022
21
Table 12. 2020 Sport Salmon Catch, Area 4 - Neah Bay
Week
Ending
Year Chinook Coho Pink Sockeye Chum
Total
Salmon
Angler
Trips
Salmon
per Trip
June 21 2020 156 139 296 396 0.75
June 28 2020 394 298 692 923 0.75
July 5 2020 197 300 497 572 0.87
July 12 2020 472 741 1,213 1,448 0.84
July 19 2020 326 681 1,007 1,147 0.88
July 26 2020 253 752 1,005 775 1.30
August 2 2020 152 130 282 752 0.37
August 9 2020 49 49 98 768 0.13
August 16 2020 10 10 36 0.29
August 23 2020 4 4 8 31 0.26
August 30 2020 8 8 7 1.26
Aug 31-Sept 13 2020 18
September 20 2020 7
September 27 2020 7
Total 2,004 3,111 5,116 6,885 0.74
Table 13. 2020-2021 Sport Salmon Catch, Area 5 - Sekiu - Pillar Point
Statistical
Month
Year Chinook Coho Pink Sockeye Chum
Total
Salmon
Angler
Trips
Salmon
per Trip
July 2020 3,649 2,327 3 5,979 15,491 0.39
August 2020 144 10,227 10,371 8,720 1.19
September 2020 85 24,198 24,283 19,792 1.23
March 2021 1,385 1,385 1,835 0.75
Total 5,263 36,752 3 0 42,018 45,838 0.92
NOTE: Estimates for July are from creel surveys; other estimates are from catch record cards.
Washington State Sport Catch Report 2020
July 2022
22
Table 16. 2020-21 Sport Salmon Catch, Area 8-1 - Deception Pass / Hope Island
Statistical
Month
Year Chinook Coho Pink Sockeye Chum
Total
Salmon
Angler
Trips
Salmon
per Trip
NOTE: Marine Area 8-1 was closed to salmon shing for the entire 2020-21 season.
Table 14. 2020-2021 Sport Salmon Catch, Area 6 - East Juan de Fuca Strait
Statistical
Month
Year Chinook Coho Pink Sockeye Chum
Total
Salmon
Angler
Trips
Salmon
per Trip
July 2020 1,669 112 1,781 2,336 0.76
August 2020 623 883 1,506 1,915 0.79
September 2020 4,289 4,289 4,10 6 1.04
October 2020 81 81 103 0.79
Total 2,292 5,365 7,657 8,460 0.91
Table 15. 2020-2021 Sport Salmon Catch, Area 7 - San Juan Islands
Statistical
Month
Year Chinook Coho Pink Sockeye Chum Total Salmon
Angler
Trips
Salmon
per Trip
July 2020 1,380 28 5 1,413 15,070 0.09
August 2020 251 1,498 5 1,754 2,746 0.64
September 2020 19 9,301 9,320 7,666 1.22
February 2021 41 41 77 0.53
Total 1,691 10,827 10 12,528 25,559 0.49
NOTE: Estimates for July are from creel surveys; other estimates are from catch record cards.
Table 17. 2020-2021 Sport Salmon Catch, Area 8-2 - Port Susan / Port Gardner
Statistical
Month
Year Chinook Coho Pink Sockeye Chum
Total
Salmon
Angler
Trips
Salmon
per Trip
May 2020 21 21 42 0.50
June 2020 163 163 288 0.57
July 2020 144 144 239 0.60
August 2020 113 113 276 0.41
Total 441 441 845 0.52
Washington State Sport Catch Report 2020 July 2022
23
Table 16. 2020-21 Sport Salmon Catch, Area 8-1 - Deception Pass / Hope Island
Statistical
Month
Year Chinook Coho Pink Sockeye Chum
Total
Salmon
Angler
Trips
Salmon
per Trip
NOTE: Marine Area 8-1 was closed to salmon shing for the entire 2020-21 season.
Table 18. 2020-2021 Sport Salmon Catch, Area 9 - Admiralty Inlet
Statistical
Month
Year Chinook Coho Pink Sockeye Chum
Total
Salmon
Angler
Trips
Salmon
per Trip
May 2020 10 10 20 35 0.57
July 2020 2,883 1,700 4,583 31,003 0.15
August 2020 984 2,190 3,174 16,376 0.19
September 2020 76 2,722 2,798 4,020 0.70
October 2020 52 52 90 0.58
November 2020 11 11 18 0.61
December 2020 21 21 36 0.58
January 2021 21 21 36 0.58
Total 3,995 6,685 10,680 51,614 0.21
NOTE: Estimates from July 16-August 16 are from creel surveys; all other estimates are from catch record cards.
Table 19. 2020-2021 Sport Salmon Catch, Area 10 - Seattle / Bremerton
Statistical
Month
Year Chinook Coho Pink Sockeye Chum
Total
Salmon
Angler
Trips
Salmon
per Trip
June 2020 4,310 4,310 3,999 1.08
July 2020 419 6,064 6,483 14,038 0.46
August 2020 1,132 5,225 4 3 6,364 19,905 0.32
September 2020 43 13,935 13 13,991 13,826 1.01
October 2020 35 411 7 453 829 0.55
November 2020 2 122 124 117 1.06
January 2021 235 4 239 1,868 0.13
Total 1,864 29,951 4 145 31,964 54,582 0.59
NOTE: Estimates from July 16-31, August, and January are from creel surveys; all other estimates are from catch record cards.
Washington State Sport Catch Report 2020
July 2022
24
Table 20. 2020-2021 Sport Salmon Catch, Area 11 - Tacoma / Vashon Island
Statistical
Month
Year Chinook Coho Pink Sockeye Chum Total Salmon
Angler
Trips
Salmon
per Trip
July 2020 1,097 359 1,456 16,047 0.09
August 2020 969 1,005 1,974 15,735 0.13
September 2020 24 2,233 2,257 2,786 0.81
October 2020 103 103 227 0.45
Total 2,090 3,700 5,790 34,795 0.17
NOTE: Estimates for July-September are from creel surveys; other estimates are from catch record cards.
Table 21. 2020-2021 Sport Salmon Catch, Area 12 - Hood Canal
Statistical
Month
Year Chinook Coho Pink Sockeye Chum
Total
Salmon
Angler
Trips
Salmon
per Trip
July 2020 226 226 181 1.25
August 2020 329 2,470 2,799 2,937 0.95
September 2020 46 1,171 1,217 730 1.67
October 2020 33 8 42 83 68 1.22
November 2020 194 194 88 2.20
Total 601 3,674 8 236 4,519 4,004 1.13
Washington State Sport Catch Report 2020 July 2022
25
Table 22. 2020-2021 Sport Salmon Catch, Area 13 - South Puget Sound
Statistical
Month
Year Chinook Coho Pink Sockeye Chum
Total
Salmon
Angler
Trips
Salmon
per Trip
May 2020 52 52 95 0.55
June 2020 52 52 70 0.74
July 2020 185 20 205 288 0.71
August 2020 700 57 7 764 1,122 0.68
September 2020 142 198 340 539 0.63
October 2020 34 641 675 810 0.83
November 2020 13 13 980 1,006 771 1.30
January 2021 22 50 72 61 1.18
February 2021 23 28 51 61 0.84
March 2021 117 58 175 262 0.67
Total 1,306 458 1,628 3,392 4,079 0.83
Washington State Sport Catch Report 2020
July 2022
26
Table 23. 2020-2021 Freshwater Salmon Sport Catch by Area and Month (continued)
COASTAL RIVER SYSTEMS
System Catch Area
CRC
Code
Species
2020 2021
Total
Apr May Jun Jul Aug Sep Oct Nov Dec Jan Feb Mar
Grays
Harbor
Elk River 342 Coho
12 12
Jackcoho 12 12
Total
24 24
Hoquiam River 355 Coho
61 12 73
Total
61 12 73
Humptulips River 358 Chinook
355 796 1,151
Chum 37 37
Coho 37 380 159 86 662
Jackchin 12 37 49
Jackcoho 110 98 12 220
Total
514 1,348 159 98 2,119
Johns River 367 Coho
294 61 355
Total
294 61 355
Wishkah River 335 Chum
12 12
Coho 12 12
Total
24 24
Chehalis R.
System
Chehalis River 315 Chinook
12 12
Coho 48 1,610 204 192 2,054
Jackchin 36 24 60
Jackcoho 721 841 24 1,586
Total
805 2,487 228 192 3,712
Satsop River 329 Chum
36 48 84
Coho 469 324 72 865
Jackcoho 108 48 156
Total
613 420 72 1,105
Skookumchuck
River
333 Coho
36 24 60
Jackcoho 24 24
Total
60 24 84
Wynoochee River 337 Chum
12 12
Coho 192 60 24 276
Jackcoho 72 72
Total
276 60 24 360
Washington State Sport Catch Report 2020 July 2022
27
Table 23. 2020-2021 Freshwater Salmon Sport Catch by Area and Month (continued)
COASTAL RIVER SYSTEMS
System Catch Area
CRC
Code
Species
2020 2021
Total
Apr May Jun Jul Aug Sep Oct Nov Dec Jan Feb Mar
Copalis R.
System
Copalis River 339 Coho
199 11 210
Jackcoho 66 66
Total
265 11 276
Hoh R.
System
Hoh River above
Oxbow Launch
348 Chinook
58 58 116
Coho 325 93 418
Jackcoho 12 12 24
Total
395 163 558
Hoh River below
Oxbow Launch
350 Chinook
23 174 12 209
Coho 23 360 383
Jackchin 12 23 35
Jackcoho 35 35
Total
58 592 12 662
Joe Creek
System
Joe Creek 323 Coho
14 14 28
Total
14 14 28
Moclips R.
System
Moclips River 371 Coho
7 7 14
Total
7 7 14
Mosquito
Cr. System
Mosquito Creek 373 Chinook
7 7
Total
7 7
Queets R.
System
Clearwater River 392 Coho
25 25
Total
25 25
Queets River 394 Chinook
13 38 25 76
Coho 13 25 38
Total
26 63 25 114
Salmon River
(Jefferson Co)
396 Chinook
38 13 51
Coho 50 50
Jackcoho 13 13
Total
101 13 114
Washington State Sport Catch Report 2020
July 2022
28
Table 23. 2020-2021 Freshwater Salmon Sport Catch by Area and Month (continued)
COASTAL RIVER SYSTEMS
System Catch Area
CRC
Code
Species
2020 2021
Total
Apr May Jun Jul Aug Sep Oct Nov Dec Jan Feb Mar
Quillayute
R. System
Bogachiel River 398 Chinook
203 12 215
Coho 24 12 12 48
Sockeye 24 24
Jackcoho 12 12
Total
24 24 12 227 12 299
Calawah River 400 Coho
12 12
Sockeye 36 12 48
Total
36 24 60
Dickey River
(Clallam Co)
402 Chinook
12 12 24
Coho 12 12
Jackcoho 12 12 24
Total
36 24 60
Quillayute River 404 Chinook
60 95 155
Coho 12 24 71 238 345
Jackchin 48 36 84
Jackcoho 24 36 60
Total
12 24 203 405 644
Sol Duc River 406 Chinook
107 226 95 12 12 378 24 854
Coho 12 167 107 155 670 298 1,409
Jackchin 36 60 12 131 12 251
Jackcoho 36 24 60
Total
107 274 322 155 179 1,203 334 2,574
Quinault R.
System
Quinault River 410 Chinook
7 14 21
Coho 94 94
Jackchin 7 7
Total
7 7 108 122
Washington State Sport Catch Report 2020 July 2022
29
Table 23. 2020-2021 Freshwater Salmon Sport Catch by Area and Month (continued)
COASTAL RIVER SYSTEMS
System Catch Area
CRC
Code
Species
2020 2021
Total
Apr May Jun Jul Aug Sep Oct Nov Dec Jan Feb Mar
Willapa Bay Naselle River 375 Chinook
333 552 65 950
Chum 110 110
Coho 26 262 785 405 37 1,515
Jackchin 12 86 12 110
Jackcoho 12 12 37 61
Total
383 912 1,009 405 37 2,746
Nemah River,
North (below
Nemah Hatchery),
Middle and South
379 Chinook
564 1,128 12 1,704
Coho 12 12
Jackchin 74 74 148
Jackcoho 12 12
Total
650 1,214 12 1,876
North River 382 Chum
12 12
Coho 257 25 282
Jackcoho 37 12 49
Total
294 49 343
Smith Creek
(Pacic Co)
384 Coho
25 25
Total
25 25
Willapa River 424 Chinook
74 441 184 699
Coho 25 184 552 147 270 1,178
Jackchin 25 12 12 49
Jackcoho 61 12 73
Total
99 711 760 159 270 1,999
Coastal River Totals
Chinook
107 226 95 983 2,641 2,061 131 6,244
Chum 207 60 267
Coho 12 203 206 867 6,593 1,881 705 10,467
Sockeye 36 36 72
Jackchin 36 60 93 305 275 24 793
Jackcoho 48 965 1,414 120 12 2,559
Total
107 274 394 1,366 4,778 10,550 2,216 717 20,402
Washington State Sport Catch Report 2020
July 2022
30
Table 23. 2020-2021 Freshwater Salmon Sport Catch by Area and Month (continued)
COASTAL RIVER SYSTEMS
System Catch Area
CRC
Code
Species
2020 2021
Total
Apr May Jun Jul Aug Sep Oct Nov Dec Jan Feb Mar
Columbia R.
Mainstem
B10 Line - Rocky
Pt. - Tongue Pt
Line
519 Chinook
4,196 352 3 4,551
Coho 1,619 1,208 157 2,984
Jackcoho
Total
5,815 1,560 160 7,5 35
Columbia - below
Bonneville
521 Chinook
973 720 3,347 5,768 1,097 1 870 12,776
Coho 20 515 295 830
Sockeye 14 1,604 1,618
Jackchin 148 21 95 203 635 157 5 1,264
Jackcoho 6 89 48 143
Total
1,135 1,625 815 3,576 7,0 07 1,597 1 875 16,631
Cowlitz R.
System
Cispus River 555 Chinook
12 12
Coho 12 62 74
Total
12 74 86
Cowlitz R. below
Mayeld Dam
561 Chinook
62 12 12 86
Coho 87 411 1,18 9 639 38 13 2,377
Jackchin 12 12 24
Jackcoho 50 573 1,357 162 2,142
Total
137 984 2,620 825 38 25 4,629
Cowlitz R. above
Cowlitz Falls Dam
559 Coho
535 212 125 872
Jackchin 37 37
Jackcoho 12 336 87 435
Total
12 908 212 212 1,344
Green River
(Cowlitz Co.)
above Toutle
Hatchery
566 Sockeye
Total
Green River
(Cowlitz Co.)
below Toutle
Hatchery
565 Coho
87 87
Sockeye
Total
87 87
Tilton River 571 Coho
498 859 75 50 1,482
Jackcoho 62 224 286
Total
560 1,083 75 50 1,768
COLUMBIA RIVER SYSTEMS
Washington State Sport Catch Report 2020 July 2022
31
Table 23. 2020-2021 Freshwater Salmon Sport Catch by Area and Month (continued)
COASTAL RIVER SYSTEMS
System Catch Area
CRC
Code
Species
2020 2021
Total
Apr May Jun Jul Aug Sep Oct Nov Dec Jan Feb Mar
Cowlitz R.
System
(cont.)
Toutle River 573 Chinook
12 12
Total
12 12
Toutle River, No
Fork
575 Chinook
87 12 99
Coho 137 137
Jackchin 12 12
Total
99 149 248
Lewis R.
System
Cedar Creek
(Clark Co)
609 Jackcoho
12 12
Total
12 12
Lewis River 611 Chinook
12 37 200 12 261
Coho 12 62 150 224
Jackchin 24 50 12 86
Jackcoho 162 125 225 512
Total
186 248 625 24 1,083
Lewis River, North
Fork
615 Chinook
13 126 339 680 101 30 13 1,302
Coho 12 362 599 137 120 1,230
Jackchin 75 100 25 25 225
Jackcoho 287 1,460 524 25 2,296
Total
13 500 2,261 1,828 288 150 13 5,053
Lower
Columbia
Grays River above
Barr Rd. Bridge
595 Coho
98 98
Jackcoho 24 24
Total
122 122
Kalama River
below Modrow
Bridge
604 Chinook
61 24 135 184 404
Coho 37 73 110
Jackchin 12 12
Jackcoho 24 49 73
Total
61 24 147 245 122 599
Kalama River
between Modrow
Bridge and
Kalama Falls
Hatchery
603 Chinook
110 37 12 159
Coho 110 12 122
Jackchin 12 12
Jackcoho 24 12 36
Total
110 49 134 24 12 329
COLUMBIA RIVER SYSTEMS
Washington State Sport Catch Report 2020
July 2022
32
Table 23. 2020-2021 Freshwater Salmon Sport Catch by Area and Month (continued)
COASTAL RIVER SYSTEMS
System Catch Area
CRC
Code
Species
2020 2021
Total
Apr May Jun Jul Aug Sep Oct Nov Dec Jan Feb Mar
Lower
Columbia
(cont.)
Washougal River
below County Line
Access
667 Chinook
26 218 26 270
Coho 24 24
Jackchin 49 12 61
Jackcoho 24 24
Total
26 267 86 379
Lower Columbia System Total
Chinook
1,144 61 733 7,8 42 6,997 2,092 125 30 13 895 19,932
Coho 1,750 3,105 4,277 1,173 333 13 10,651
Sockeye 14 1,604 1,618
Jackchin 148 33 95 290 820 293 49 5 1,733
Jackcoho 505 2,345 2,823 223 87 5,983
Total
1,306 1,698 828 10,387 13,267 9,485 1,570 450 26 900 39,917
COLUMBIA RIVER SYSTEMS
Table 23. 2020-2021 Freshwater Salmon Sport Catch by Area and Month (continued)
COASTAL RIVER SYSTEMS
System Catch Area
CRC
Code
Species
2020 2021
Total
Apr May Jun Jul Aug Sep Oct Nov Dec Jan Feb Mar
Klickitat
River
Klickitat River
above
Fishway 5
608 Chinook
11 333 218 11 700 424 11 11 1,719
Coho 200 69 23 11 303
Jackchin 11 23 11 23 11 79
Total
11 344 241 11 711 647 91 23 11 11 2,101
Klickitat River
below
Fishway 5
607 Chinook
35 761 651 84 125 1,656
Coho 93 3,197 1,431 816 80 5,617
Sockeye
Jackchin 11 69 115 11 57 46 309
Jackcoho 23 539 207 57 826
Total
35 11 946 4,502 1,733 1,055 126 8,408
COLUMBIA RIVER SYSTEMS

Washington State Sport Catch Report 2020 July 2022
33
Table 23. 2020-2021 Freshwater Salmon Sport Catch by Area and Month (continued)
COASTAL RIVER SYSTEMS
System Catch Area
CRC
Code
Species
2020 2021
Total
Apr May Jun Jul Aug Sep Oct Nov Dec Jan Feb Mar
Little White
Salmon
River &
Drano Lake
Little White
Salmon River &
Drano Lake
618 Chinook
519 12 326 2,242 651 3,750
Coho 12 206 60 278
Sockeye
Jackchin 12 48 301 60 421
Jackcoho 24 24
Total
531 12 386 2,773 771 4,473
Mid
Columbia
Columbia
Bonneville Dam to
The Dalles Dam
527 Chinook
72 12 215 1,555 909 12 36 2,811
Coho 335 1,053 239 1,627
Jackchin 12 215 48 275
Jackcoho 36 48 84
Total
72 12 227 2,141 2,058 251 36 4,797
Columbia The
Dalles Dam to
John Day Dam
529 Chinook
60 24 287 909 156 1,436
Chum
Coho 12 144 24 180
Jackchin 15 92 107
Jackcoho 12 48 60
Total
60 39 299 1,157 228 1,783
Columbia John
Day Dam to
McNary Dam
531 Chinook
132 96 72 300
Coho 12 12
Sockeye 24 24
Jackchin 36 36 72
Total
168 24 96 120 408
Wind R.
System
Wind River below
Shipherd Falls
680 Chinook
486 12 24 486 49 1,057
Coho 219 207 426
Jackchin 12 24 73 109
Total
498 12 48 778 256 1,592
Middle Columbia System Totals
Chinook
1,280 368 278 863 6,749 2,912 107 125 47 12,729
Chum
Coho 24 997 4,753 1,739 839 91 8,443
Sockeye 24 24
Jackchin 60 11 49 84 761 282 22 57 46 1,372
Jackcoho 95 635 207 57 994
Total
1,340 379 351 971 8,602 8,582 2,075 1,078 137 47 23,562
COLUMBIA RIVER SYSTEMS
Washington State Sport Catch Report 2020
July 2022
34
Table 23. 2020-2021 Freshwater Salmon Sport Catch by Area and Month (continued)
COASTAL RIVER SYSTEMS
System Catch Area
CRC
Code
Species
2020 2021
Total
Apr May Jun Jul Aug Sep Oct Nov Dec Jan Feb Mar
Entiat River Entiat River 586 Chinook
14 14
Total
14 14
Okanogan
R. System
Okanogan River 627 Sockeye
166 102 268
Total
166 102 268
Upper
Columbia
Columbia McNary
Dam to Hwy. 395
Bridge
533 Chinook
12 71 47 130
Coho 12 12
Sockeye 12 12
Jackchin 36 36 72
Total
12 12 107 95 226
Columbia Hwy.
395 Bridge to
I-182 Bridge
534 Chinook
142 226 107 475
Coho 36 24 60
Sockeye
Jackchin 24 142 24 190
Total
166 404 155 725
Columbia I-182
Bridge-old
Hanford townsite
535 Chinook
24 239 131 3,871 3,130 24 7, 419
Coho 90 78 168
Sockeye 2,390 7,228 83 9,701
Jackchin 24 84 12 529 253 902
Jackcoho 107 107
Total
48 2,390 7, 5 51 143 4,573 3,568 24 18,297
Columbia Old
Hanford
townsite-Priest
Rapids Dam
536 Chinook
36 156 48 5,695 5,001 10,936
Coho 59 71 36 166
Sockeye 190 368 12 570
Jackchin 12 12 629 487 1,140
Jackcoho 12 12 24
Total
36 190 536 60 6,395 5,583 36 12,836
Columbia Priest
Rapids to
Wanapum Dam
537 Chinook
399 24 968 520 1,911
Coho 12 12
Sockeye 2,339 47 2,386
Jackchin 36 47 142 59 284
Jackcoho
12 12 24
Total 2,786 118 1,122 579 12 4,617
COLUMBIA RIVER SYSTEMS
Washington State Sport Catch Report 2020 July 2022
35
Table 23. 2020-2021 Freshwater Salmon Sport Catch by Area and Month (continued)
COASTAL RIVER SYSTEMS
System Catch Area
CRC
Code
Species
2020 2021
Total
Apr May Jun Jul Aug Sep Oct Nov Dec Jan Feb Mar
Upper
Columbia
(cont.)
Columbia
Wanapum
to Rock Island
Dam
539 Chinook
12 178 249 439
Sockeye 24 24
Jackchin 12 83 36 131
Total
48 261 285 594
Columbia Rock
Island to Rocky
Reach Dam
541 Chinook
119 107 36 12 274
Coho 12 12 12 36
Sockeye 3,241 47 12 3,300
Jackchin 24 24
Total
3,360 166 72 36 3,634
Columbia Rocky
Reach to Wells
Dam
543 Chinook
12 2,988 807 178 214 4,199
Sockeye 1,441 214 1,655
Jackchin 321 71 12 12 416
Total
12 4,750 1,092 190 226 6,270
Columbia Wells to
Chief Joseph Dam
545 Chinook
12 896 991 179 12 2,090
Coho 12 12 24
Sockeye 14,007 8,565 335 24 12 12 22,955
Jackchin 47 142 24 213
Total
12 14,950 9,710 538 48 12 12 25,282
Wenatchee
R. System
Icicle Creek 672 Chinook
74 25 99
Coho 110 49 159
Total
74 25 110 49 258
Lake Wenatchee 670 Sockeye
12,137 368 12,505
Total
12,137 368 12,505
Yakima R.
System
Yakima River 690 Chinook
25 200 225
Coho 38 38
Jackchin 13 63 76
Jackcoho 38 38
Total
38 339 377
COLUMBIA RIVER SYSTEMS
Washington State Sport Catch Report 2020
July 2022
36
Table 23. 2020-2021 Freshwater Salmon Sport Catch by Area and Month (continued)
COASTAL RIVER SYSTEMS
System Catch Area
CRC
Code
Species
2020 2021
Total
Apr May Jun Jul Aug Sep Oct Nov Dec Jan Feb Mar
Upper Columbia System Totals
Chinook
48 48 74 4,848 2,250 11,427 9,492 24 28, 211
Coho 24 197 357 85 12 675
Sockeye 2,580 28,660 21,176 888 48 12 12 53,376
Jackchin 24 512 308 1,634 970 3,448
Jackcoho 12 24 157 193
Total
48 72 2,654 34,032 23,758 14,170 11,024 109 12 12 12 85,903
COLUMBIA RIVER SYSTEMS
Table 23. 2020-2021 Freshwater Salmon Sport Catch by Area and Month (continued)
COASTAL RIVER SYSTEMS
System Catch Area
CRC
Code
Species
2020 2021
Total
Apr May Jun Jul Aug Sep Oct Nov Dec Jan Feb Mar
Snake R.
System
Snake River:
Lower
Monumental to
Little
Goose Dam
644 Chinook
419 36 72 527
Jackchin 12 36 12 60
Total
431 72 84 587
Snake River:
Lower
Granite to
Interstate
Bridge
648 Chinook
84 754 48 886
Jackchin 12 144 96 252
Total
96 898 144 1,138
Snake River:
upstream of
Interstate Bridge
650 Chinook
120 132 252
Jackchin 24 12 36
Total
144 144 288
Grande Ronde
River
592 Chinook
24 24
Jackchin 12 12
Total
12 24 36
Snake River System Totals
Chinook
419 84 910 276 1,689
Jackchin 12 12 216 120 360
Total
431 96 1,126 396 2,049
SNAKE RIVER SYSTEM
Washington State Sport Catch Report 2020 July 2022
37
Table 23. 2020-2021 Freshwater Salmon Sport Catch by Area and Month (continued)
COASTAL RIVER SYSTEMS
System Catch Area
CRC
Code
Species
2020 2021
Total
Apr May Jun Jul Aug Sep Oct Nov Dec Jan Feb Mar
Chambers
Cr. System
Chambers Creek 714 Chinook
7 7 14
Total
7 7 14
Deschutes
R. System
Deschutes River 728 Chinook
7 7
Coho 7 7
Total
14 14
Duckabush
R. System
Duckabush River 736 Chum
7 7
Total
7 7
Dungeness
R. System
Dungeness River 738 Coho
229 60 289
Jackcoho 24 24
Total
253 60 313
Green-
Duwamish
R. System
Green - Duwamish
River
746 Chinook
107 12 12 131
Chum 24 284 1,197 24 1,529
Coho 1,794 550 275 2,619
Jackchin 344 12 356
Jackcoho 355 95 24 474
Total
2,624 953 1,508 24 5,109
Kennedy Cr.
System
Kennedy Creek 754 Chum
143 323 466
Total
143 323 466
Lake
Washington
System
Lake Sammamish 764 Coho
7 7
Total
7 7
Lake Washington 762 Coho
108 15 123
Total
108 15 123
Minter Cr.
System
Minter Creek 778 Chinook
63 38 101
Chum 25 1,458 469 1,952
Coho 107 120 227
Jackchin 50 25 75
Total
220 208 1,458 469 2,355
PUGET SOUND RIVER SYSTEMS

Washington State Sport Catch Report 2020
July 2022
38
Table 23. 2020-2021 Freshwater Salmon Sport Catch by Area and Month (continued)
COASTAL RIVER SYSTEMS
System Catch Area
CRC
Code
Species
2020 2021
Total
Apr May Jun Jul Aug Sep Oct Nov Dec Jan Feb Mar
Nisqually R.
System
McAllister Creek 770 Chinook
24 36 60
Jackchin 24 24
Total
48 36 84
Nisqually River 786 Chinook
324 753 1,077
Coho 12 352 180 544
Jackchin 12 324 817 12 1,165
Jackcoho 12 144 24 180
Total
12 672 2,066 204 12 2,966
Nooksack
Samish R.
System
Dakota Creek
(Whatcom Co)
724 Chinook
12 12
Total
12 12
Nooksack River,
Middle Fork
788 Coho
Total
Nooksack River,
North Fork
790 Chinook
85 85
Coho 122 146 37 305
Jackchin 123 123
Jackcoho 24 24
Total
208 122 170 37 537
Nooksack River,
South Fork
792 Coho
427 24 451
Jackcoho 24 24
Total
451 24 475
Nooksack River,
below North Fork
794 Chinook
12 12
Coho 122 292 110 49 573
Jackchin 12 12
Jackcoho 49 24 73
Total
171 340 110 49 670
Samish River 816 Chinook
2,476 5,062 7, 5 38
Coho 25 37 62
Jackchin 85 159 244
Jackcoho 24 24
Total
2,610 5,258 7,8 6 8
Whatcom Creek 884 Chinook
12 12
Total
12 12
PUGET SOUND RIVER SYSTEMS

Washington State Sport Catch Report 2020 July 2022
39
Table 23. 2020-2021 Freshwater Salmon Sport Catch by Area and Month (continued)
COASTAL RIVER SYSTEMS
System Catch Area
CRC
Code
Species
2020 2021
Total
Apr May Jun Jul Aug Sep Oct Nov Dec Jan Feb Mar
Puyallup R.
System
Carbon River 802 Chinook
619 87 706
Coho 161 74 235
Jackchin 260 260
Jackcoho 12 50 25 87
Total
12 1,090 186 1,288
Puyallup River 804 Chinook
582 421 12 1,015
Coho 792 2,277 37 3,106
Jackchin 359 223 12 594
Jackcoho 186 433 619
Total
1,919 3,354 61 5,334
Quilcene R.
System
Quilcene River 812 Coho
1,578 1,172 79 2,829
Jackcoho 11 11
Total
1,578 1,172 90 2,840
Skagit R.
System
Baker Lake 825 Sockeye
5,373 207 5,580
Total
5,373 207 5,580
Cascade River 826 Chinook
12 12 24
Coho 1,437 2,053 36 3,526
Jackchin 12 12
Jackcoho 12 12
Total
12 24 1,437 2,065 36 3,574
Skagit River 830 Chinook
5 12 17
Coho 2,216 3,224 435 5,875
Jackcoho 24 12 36
Total
5 12 2,240 3,236 435 5,928
Snohomish
R. System
Skykomish River 844 Chinook
27 360 130 517
Jackchin 13 106 538 657
Total
40 466 668 1,174
Stillaguamish
River
872 Chinook
1 1
Coho 75 323 75 473
Total
75 324 75 474
Wallace River 860 Coho
25 348 99 472
Total
25 348 99 472
PUGET SOUND RIVER SYSTEMS
Washington State Sport Catch Report 2020
July 2022
40
Table 23. 2020-2021 Freshwater Salmon Sport Catch by Area and Month (continued)
COASTAL RIVER SYSTEMS
System Catch Area
CRC
Code
Species
2020 2021
Total
Apr May Jun Jul Aug Sep Oct Nov Dec Jan Feb Mar
Puget Sound River System Total
Chinook
32 469 142 3,425 7,0 8 0 169 12 11,329
Chum 24 452 2,985 493 3,954
Coho 2,407 9,883 8,087 1,260 86 21,723
Sockeye 5,373 207 5,580
Jackchin 13 229 562 792 1,853 61 12 3,522
Jackcoho 234 1,055 251 48 1,588
Total
45 698 6,077 7,0 6 5 19,895 9,020 4,305 579 12 47,69 6
PUGET SOUND RIVER SYSTEMSPUGET SOUND RIVER SYSTEMS
Table 23. 2020-2021 Freshwater Salmon Sport Catch by Area and Month (continued)
COASTAL RIVER SYSTEMS
System Catch Area
CRC
Code
Species
2020 2021
Total
Apr May Jun Jul Aug Sep Oct Nov Dec Jan Feb Mar
Unknown River System Totals
Chinook
7 26 52 97 110 284 103 14 693
Chum 13 25 109 147
Coho 9 64 105 122 103 260 663
Sockeye 235 64 299
Jackchin 37 37
Jackcoho 15 45 7 15 82
Total
16 41 116 450 296 469 388 116 15 14 1,921
UNKNOWN RIVER SYSTEMS
Table 23. 2020-2021 Freshwater Salmon Sport Catch by Area and Month (continued)
COASTAL RIVER SYSTEMS
System Catch Area
CRC
Code
Species
2020 2021
Total
Apr May Jun Jul Aug Sep Oct Nov Dec Jan Feb Mar
Statewide Totals
Chinook
55 3,056 1,250 6,193 15,557 36,088 17,10 5 399 155 13 956 80,827
Chum 13 24 684 3,154 493 4,368
Coho 9 76 308 4,533 15,152 24,327 6,13 8 1,975 91 13 52,622
Sockeye 14 4,184 34,328 21,483 888 48 12 12 60,969
Jackchin 257 309 1,278 1,579 5,626 2,001 95 57 46 17 11,265
Jackcoho 15 12 787 4,529 5,280 605 171 11,399
Total
64 3,342 5,819 42,132 43,939 62,307 49,445 10,391 2,851 149 38 973 221,450
STATEWIDE TOTALS

Washington State Sport Catch Report 2020 July 2022
41
Table 24. 2020-2021 Washington Sport Salmon Fishing, by Residence
County of
Residence
Number
Catch
Record
Cards
Population
by County
% Catch
Record
Card
Holders
Total
Freshwater
Salmon
Catch
Total
Marine
Salmon
Catch
Total
Salmon
Average
Catch
per Card
Adams 1,709 20,027 8.5 1,208 448 1,656 0.97
Asotin 2,211 22,820 9.7 464 27 491 0.22
Benton 21,045 206,426 10.2 17, 570 845 18,415 0.88
Chelan 7,722 77, 574 10 12,275 565 12,840 1.66
Clallam 9,964 78,067 12.8 3,020 11,946 14,966 1.5
Clark 42,999 496,865 8.7 18,291 3,751 22,042 0.51
Columbia 557 4,048 13.8 185 185 0.33
Cowlitz 19,033 111,371 17.1 10,312 1,527 11,839 0.62
Douglas 3,722 43,560 8.5 6,352 457 6,809 1.83
Ferry 391 7,759 5 372 66 438 1.12
Franklin 9,569 97,075 9.9 7,595 27 7,6 22 0.8
Gareld 355 2,290 15.5 58 58 0.16
Grant 5,770 99,377 5.8 3,995 517 4,512 0.78
Grays Harbor 11,124 75,950 14.6 4,227 4,698 8,925 0.8
Island 11,188 86,014 13 929 4,798 5,727 0.51
Jefferson 3,651 32,700 11.2 732 3,481 4,213 1.15
King 95,682 2,274,315 4.2 20,056 31,332 51,388 0.54
Kitsap 23,373 272,787 8.6 2,415 12,829 15,244 0.65
Kittitas 3,671 49,204 7. 5 1,881 1,304 3,185 0.87
Klickitat 3,329 22,697 14.7 3,473 225 3,698 1.11
Lewis 11,492 82,109 14 4,401 1,891 6,292 0.55
Lincoln 808 11,090 7. 3 801 54 855 1.06
Mason 6,697 68,224 9.8 1,219 3,923 5,142 0.77
Okanogan 3,269 42,620 7.7 4,448 266 4,714 1.44
Pacic 4,172 22,984 18.2 2,415 3,040 5,455 1.31
Pend Oreille 529 14,144 3.7 499 246 745 1.41
Pierce 63,487 913,890 6.9 13,912 17,9 48 31,860 0.5
San Juan 2,267 17,49 2 13 58 586 644 0.28
Skagit 16,544 130,789 12.6 7,30 5 3,872 11,177 0.68
Skamania 1,388 12,107 11.5 1,603 1,603 1.15
Snohomish 59,358 830,393 7.1 13,123 18,887 32,010 0.54
Spokane 16,377 528,225 3.1 10,870 2,205 13,075 0.8
Stevens 3,077 46,360 6.6 1,091 1,091 0.35
Thurston 22,529 294,074 7.7 5,899 7, 323 13,222 0.59
Wahkiakum 1,057 4,498 23.5 1,219 1,219 1.15
Walla Walla 5,127 61,292 8.4 1,684 39 1,723 0.34
Whatcom 19,524 231,016 8.5 4,599 3,422 8,021 0.41
Whitman 2,044 49,500 4.1 93 127 220 0.11
Yakima 20,552 251,879 8.2 10,626 1,366 11,9 92 0.58
Unknown WA 1,254 337 267 604 0.48
Washington Total 538,617 7,693,612 7 201,612 144,305 345,917 0.64
Other State Total 35,210 19,835 6,447 26,282 0.75
Canada 89
Other 94 79 79 0.84
Grand Total 574,010 221,447 150,831 372,278 0.65
Source: Table 1: Annual Estimates of the Resident Population for Counties of Washington: April 1, 2010 to July 1, 2020.
Source: Population Division, U.S. Census Bureau. Release Date: July 2020

Washington State Sport Catch Report 2020
July 2022
42
Table 25. 2020-2021 Frequency Distribution of Estimated Salmon Catch Record Cards and Catch
#Salmon per
Catch Record
Card
Number of
Cards
Cumulative
Number
of Cards
Percent
Cards
Cumulative
Percent Cards
Total
Catch
Cumulative
Total Catch
Percent
Catch
Cumulative
Percent Catch
0 488,910 488,910 85.2% 85.2% 0 0 0.0% 0.0%
1 25,725 514,635 4.5% 89.7% 25,725 25,725 6.9% 6.9%
2 18,918 533,553 3.3% 93.0% 37,8 3 6 63,561 10.2% 17.1%
3 8,682 542,235 1.5% 94.5% 26,046 89,607 7.0% 24.1%
4 7,19 4 549,429 1.3% 95.7% 28,776 118,38 3 7.7% 31.8%
5 4,696 554,125 0.8% 96.5% 23,480 141,863 6.3% 38.1%
6 3,819 557,944 0.7% 97. 2% 22,914 164,777 6.2% 44.3%
7 2,354 560,298 0.4% 97.6% 16,478 181,255 4.4% 48.7%
8 2,254 562,552 0.4% 98.0% 18,032 199,287 4.8% 53.5%
9 1,621 564,173 0.3% 98.3% 14,589 213,876 3.9% 57.5%
10 1,366 565,539 0.2% 98.5% 13,660 227,536 3.7% 61.1%
11 1,010 566,549 0.2% 98.7% 11,110 238,646 3.0% 64.1%
12 1,010 567,559 0.2% 98.9% 12,120 250,766 3.3% 67.4%
13 955 568,514 0.2% 99.0% 12,415 263,181 3.3% 70.7%
14 644 569,158 0.1% 99.2% 9,016 272,197 2.4% 73.1%
15 600 569,758 0.1% 99.3% 9,000 281,197 2.4% 75.5%
16 555 570,313 0.1% 99.4% 8,880 290,077 2.4% 77. 9%
17 389 570,702 0.1% 99.4% 6,613 296,690 1.8% 79.7%
18 489 571,191 0.1% 99.5% 8,802 305,492 2.4% 82.1%
19 255 571,446 0.0% 99.6% 4,845 310,337 1.3% 83.4%
20 266 571,712 0.0% 99.6% 5,320 315,657 1.4% 84.8%
21 211 571,923 0.0% 99.6% 4,431 320,088 1.2% 86.0%
22 211 572,134 0.0% 99.7% 4,642 324,730 1.3% 87. 2%
23 222 572,356 0.0% 99.7% 5,106 329,836 1.4% 88.6%
24 233 572,589 0.0% 99.8% 5,592 335,428 1.5% 90.1%
25 189 572,778 0.0% 99.8% 4,725 3 40,153 1.3% 91.4%
26 1,177 573,955 0.2% 100% 30,602 370,755 8.2% 99.6%
27 33 573,988 0.0% 100% 891 371,646 0.2% 99.8%
28* 11 573,999 0.0% 100% 308 371,954 0.1% 99.9%
30 or more 11 574,010 0.0% 100% 330 372,284 0.1% 100%
Total 574,010 100.0% 372,284 100.0%
*Note: A single card has room for twenty-six salmon entries. Cards showing more than that were lled out incorrectly, with more than one salmon per line.

Washington State Sport Catch Report 2020 July 2022
43
Table 26. 2020-2021 Sport Salmon Inventory of Catch Record Cards Received
Response Type
With
Catch
No
catch
Total
Reports
Number of
Salmon
Catch
per Card
Prior to reminder 1,149 8,139 9,288 4,299 0.46
After 1st reminder postcard 5,330 21,10 8 26,438 24,101 0.91
After 2nd reminder postcard 1,187 2,801 3,988 5,133 1.29
Total 7,666 32,048 39,714 33,533 0.84

Washington State Sport Catch Report 2020
July 2022
44
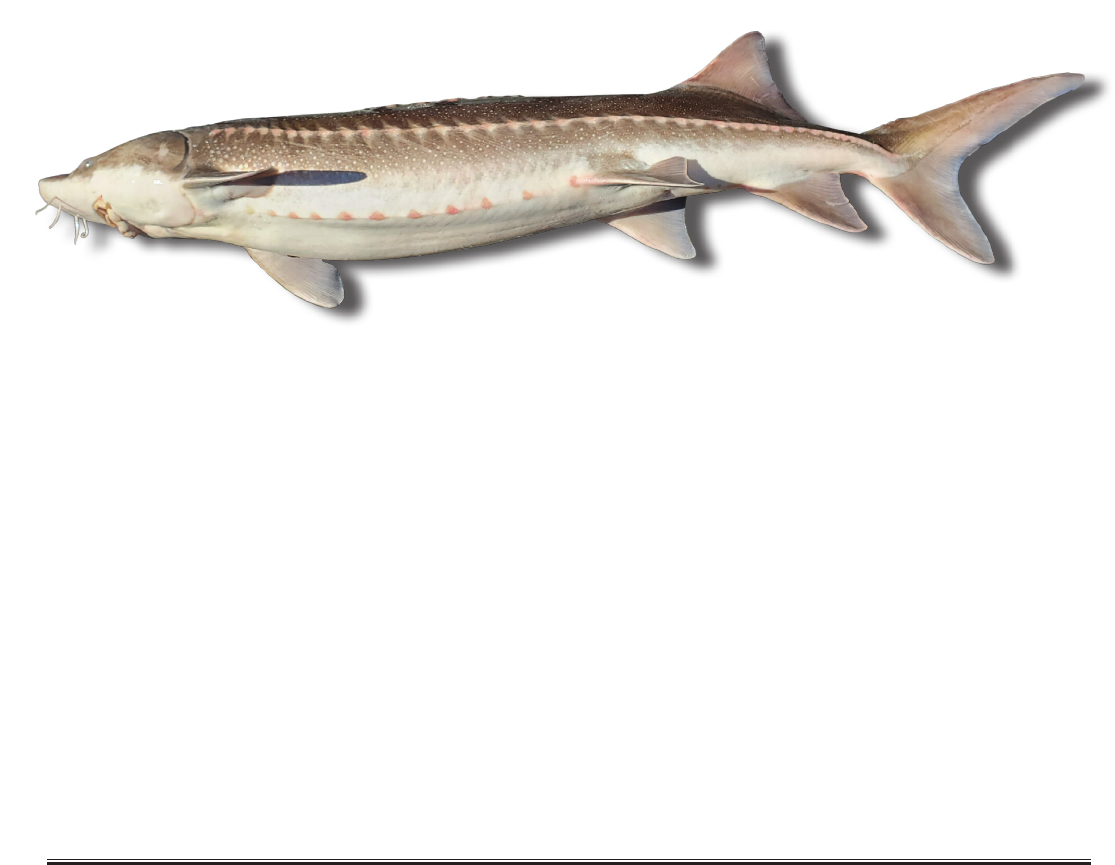
Washington State Sport Catch Report 2020 July 2022
45
Sturgeon
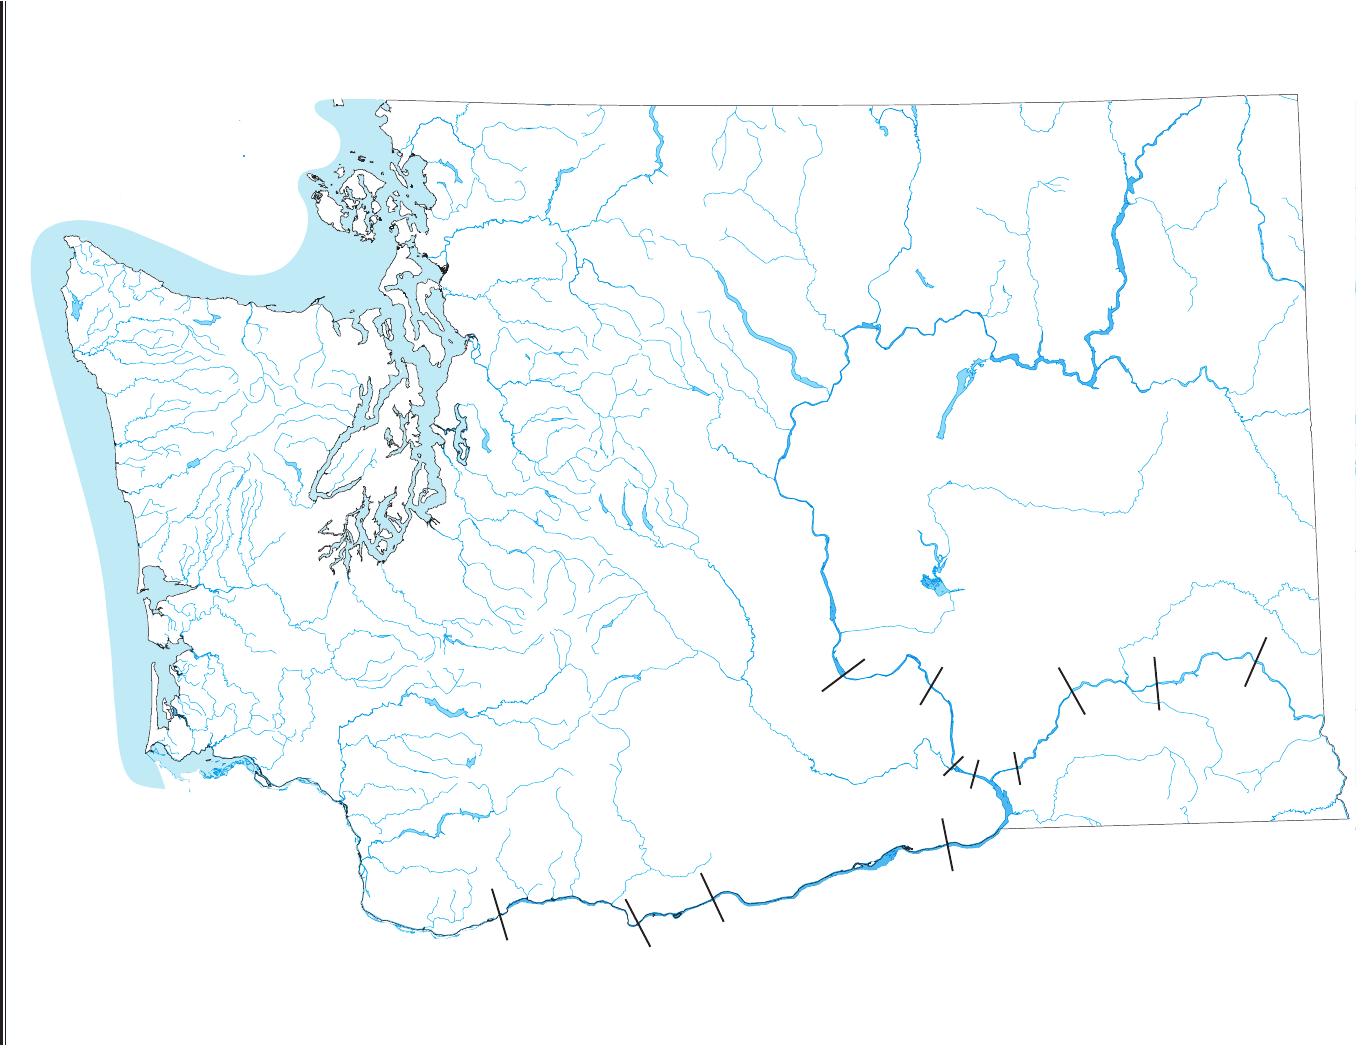
Washington State Sport Catch Report 2020
July 2022
46
527
529
531
642
644
646
C
o
l
u
m
b
i
a
R
i
v
e
r
S
n
a
k
e
R
i
v
e
r
Bonneville
Dam
The
Dalles
Dam
John Day
Dam
McNary
Dam
Ice Harbor
Dam
Priest
Rapids
Dam
Little
Goose
Dam
Lower
Granite
Dam
Lower
Monumental
Dam
533
534
535
536
Old
Hanford
Hwy.
395
I-182
640
Map of sturgeon CatCh reCorD CarD areas

Washington State Sport Catch Report 2020 July 2022
47
DesCription of sturgeon CatCh reCorD CarD areas
Columbia River
527 Bonneville to the Dalles Dam
529 The Dalles Dam to John Day Dam
531 John Day to McNary Dam
533 McNary Dam to Highway 395 Bridge at Pasco
534 Highway 395 Bridge at Pasco to I-82 Bridge
535 I-82 Bridge to Old Hanford Townsite
536 Old Hanford Townsite to Priest Rapids Dam
Snake River
640 Below Ice Harbor Dam
642 Ice Harbor to Lower Monumental Dam
644 Lower Monumental to Little Goose Dam
646 Little Goose to Lower Granite Dam
Washington State Sport Catch Report 2020
July 2022
48
Table 28. 2020-2021 Washington Sport Sturgeon Fishing, by Residence
County of
Residence
Number Catch
Record Cards
Population by
County
% Catch Record
Holders
Total Sturgeon
Average Catch
per Catch
Record Card
Adams 1,709 20,027 8.5
Asotin 2,211 22,820 9.7
Benton 21,045 206,426 10.2 37 0.00
Chelan 7,722 77,574 10 37 0.00
Clallam 9,964 78,067 12.8
Clark 42,999 496,865 8.7 373 0.01
Columbia 557 4,048 13.8
Cowlitz 19,033 111,371 17.1 161 0.01
Douglas 3,722 43,560 8.5
Ferry 391 7,759 5 13 0.03
Franklin 9,569 97,075 9.9 37 0.00
Gareld 355 2,290 15.5
Grant 5,770 99,377 5.8 25 0.00
Grays Harbor 11,124 75,950 14.6 13 0.00
Island 11,188 86,014 13
Jefferson 3,651 32,700 11.2
King 95,682 2,274,315 4.2
Kitsap 23,373 272,787 8.6 25 0.00
Kittitas 3,671 49,204 7.5
Klickitat 3,329 22,697 14.7 37 0.01
Lewis 11,492 82,109 14 99 0.01
Lincoln 808 11,090 7.3 13 0.02
Mason 6,697 68,224 9.8
Okanogan 3,269 42,620 7.7
Pacic 4,172 22,984 18.2
Pend Oreille 529 14,144 3.7
Pierce 63,487 913,890 6.9
San Juan 2,267 17,492 13
Skagit 16,544 130,789 12.6
Skamania 1,388 12,107 11.5 25 0.02
Snohomish 59,358 830,393 7.1
Spokane 16,377 528,225 3.1 99 0.01
Stevens 3,077 46,360 6.6 149 0.05
Thurston 22,529 294,074 7.7 13 0.00
Wahkiakum 1,057 4,498 23.5 13 0.01
Walla Walla 5,127 61,292 8.4 13 0.00
Whatcom 19,524 231,016 8.5
Whitman 2,044 49,500 4.1
Yakima 20,552 251,879 8.2 25 0.00
Unknown WA 1,254
Washington Total 538,617 7,693,612 7 1,207 0.00
Other State Total 35,210 124 0.00
Canada 89
Other 94
Grand Total 574,010 1,331 0.00
Note: The gures do not accurately multiply across because of the bias adjustment factor and rounding of numbers.
Source: Table 1: Annual Estimates of the Resident Population for Counties of Washington: April 1, 2010 to July 1, 2020.
Source: Population Division, U.S. Census Bureau. Release Date: July 2020
Table 27. 2020-2021 Sport Sturgeon Catch, by Area and Month
COLUMBIA RIVER SYSTEMS
Catch Area Species
2020 2021
Total
Apr May Jun Jul Aug Sep Oct Nov Dec Jan Feb Mar
Columbia R 02: Tongue Pt. Rocky Pt. to Longview Br. White 70 2 72
Columbia R 03: Longview Br. to I-5 Br. White 313 9 322
Columbia R 04: I-5 Br. to Bonneville Dam White 48 3 51
Columbia R 05: Bonneville to The Dalles Dam
White 282 282
Columbia R 06: The Dalles to John Day Dam
White 101 101
Columbia R 07: John Day to McNary Dam
White 14 1 17 32
Columbia R 08: McNary Dam - Hwy 395 Bridge in Pasco
White 1 1
Columbia R 09: I-182 Bridge to old Hanford townsite White 1 1
Columbia R 16: above Grand Coulee Dam (Lake Roosevelt)
White
49 195 95 99
438
Cowlitz R. below Mayeld Dam White 14 14
Total White 1 49 196 95 544 14 397 1 17 1,314
UNKNOWN AREA
Unknown Area Totals White 15 15
STATEWIDE TOTALS
Statewide Totals White 1 49 196 95 559 14 397 1 17 1,329
Washington State Sport Catch Report 2020 July 2022
49
Table 28. 2020-2021 Washington Sport Sturgeon Fishing, by Residence
County of
Residence
Number Catch
Record Cards
Population by
County
% Catch Record
Holders
Total Sturgeon
Average Catch
per Catch
Record Card
Adams 1,709 20,027 8.5
Asotin 2,211 22,820 9.7
Benton 21,045 206,426 10.2 37 0.00
Chelan 7,722 77,574 10 37 0.00
Clallam 9,964 78,067 12.8
Clark 42,999 496,865 8.7 373 0.01
Columbia 557 4,048 13.8
Cowlitz 19,033 111,371 17.1 161 0.01
Douglas 3,722 43,560 8.5
Ferry 391 7,759 5 13 0.03
Franklin 9,569 97,075 9.9 37 0.00
Gareld 355 2,290 15.5
Grant 5,770 99,377 5.8 25 0.00
Grays Harbor 11,124 75,950 14.6 13 0.00
Island 11,188 86,014 13
Jefferson 3,651 32,700 11.2
King 95,682 2,274,315 4.2
Kitsap 23,373 272,787 8.6 25 0.00
Kittitas 3,671 49,204 7.5
Klickitat 3,329 22,697 14.7 37 0.01
Lewis 11,492 82,109 14 99 0.01
Lincoln 808 11,090 7.3 13 0.02
Mason 6,697 68,224 9.8
Okanogan 3,269 42,620 7.7
Pacic 4,172 22,984 18.2
Pend Oreille 529 14,144 3.7
Pierce 63,487 913,890 6.9
San Juan 2,267 17,492 13
Skagit 16,544 130,789 12.6
Skamania 1,388 12,107 11.5 25 0.02
Snohomish 59,358 830,393 7.1
Spokane 16,377 528,225 3.1 99 0.01
Stevens 3,077 46,360 6.6 149 0.05
Thurston 22,529 294,074 7.7 13 0.00
Wahkiakum 1,057 4,498 23.5 13 0.01
Walla Walla 5,127 61,292 8.4 13 0.00
Whatcom 19,524 231,016 8.5
Whitman 2,044 49,500 4.1
Yakima 20,552 251,879 8.2 25 0.00
Unknown WA 1,254
Washington Total 538,617 7,693,612 7 1,207 0.00
Other State Total 35,210 124 0.00
Canada 89
Other 94
Grand Total 574,010 1,331 0.00
Note: The gures do not accurately multiply across because of the bias adjustment factor and rounding of numbers.
Source: Table 1: Annual Estimates of the Resident Population for Counties of Washington: April 1, 2010 to July 1, 2020.
Source: Population Division, U.S. Census Bureau. Release Date: July 2020
Washington State Sport Catch Report 2020
July 2022
50
Table 29. 2020-2021 Frequency Distribution of Estimated Sturgeon Catch Record Cards and Catch
#Sturgeon per
Catch Record
Card
Number of
Cards
Cumulative
Number
of Cards
Percent
Cards
Cumulative
Percent
Cards
Total
Catch
Cumulative
Total Catch
Percent
Catch
Cumulative
Percent
Catch
0 572,804 572,804 99.8% 99.8% 0 0 0.0% 0.0%
1 1,083 573,887 0.2% 100% 1,083 1,083 81.5% 81.5%
2 123 574,010 0.0% 100% 246 1,329 18.5% 100%
Total 574,010 100.0% 1,329 100.0%
Table 30. 2020-2021 Sport Sturgeon Inventory of Catch Record Cards Reported
Response Type With Catch No Catch Total Reports Number of Sturgeon Catch per Card
Prior to reminder 24 8,622 8,646 24 0.003
After 1st reminder postcard 64 24,985 25,049 73 0.003
After 2nd reminder postcard 10 6,013 6,023 11 0.002
Total 98 39,620 39,718 108 0.003
Washington State Sport Catch Report 2020 July 2022
51
Steelhead
Washington State Sport Catch Report 2020
July 2022
52
Table 31. 2020-2021 Steelhead Sport Catch, by Area and Month (continued)
COASTAL RIVERS AND MARINE CATCH AREAS
System Area Code Run
2020 2021
Total
April May Jun Jul Aug
Sep
Oct Nov Dec Jan Feb Mar
Chehalis R. System Chehalis R. above Black R. 315 W 24 80 104
Chehalis R. below Black R. 317 W 5 24 9 5 43
Satsop River 329 W 5 9 38 14 66
Satsop River, West Fork 331 W 5 5
Skookumchuck River 333 S 11 11
W 5 114 440 80 639
Wynoochee River 337 S 11 116 896 580
126
116 1,845
W 52 213 147 24 436
Chehalis R. System Totals S 11 116 896 580
126
127 1,856
W 5 67 384 714 123 1,293
Copalis R. System Copalis River 339 W 9 9
Hoh R. System Hoh River above Oxbow
Launch
348 W 9 18 18 45
Hoh River below Oxbow
Launch
350 S
7
7
W 9 18 18 45
Hoh R. System Totals S
7
7
W 9 9 36 36 90
Humptulips R. System Humptulips River 358 S 20 25 47
12
104
W 29 95 21 4 4 153
Humptulips River, E. Fork 361 S
2
2
Stevens Creek 364 W 25 17 42
Humptulips R. System
Totals
S 20 25 47
14
106
W 29 120 38 4 4 195
Marine Water Area 1: Col R - Ledbetter 1 S 7
7
20 34
Marine Water Area 2: Westport 2 S 20 20
Area 2-2: Grays Harbor 22 S
7
7 14
Marine Water Totals S 20
7
7 34
Naselle R. System Naselle River 375 W 27 375 40 13 455
Nemah R. System Nemah River, North (below
Nemah Hatchery), Middle
and South
379 W 9 9
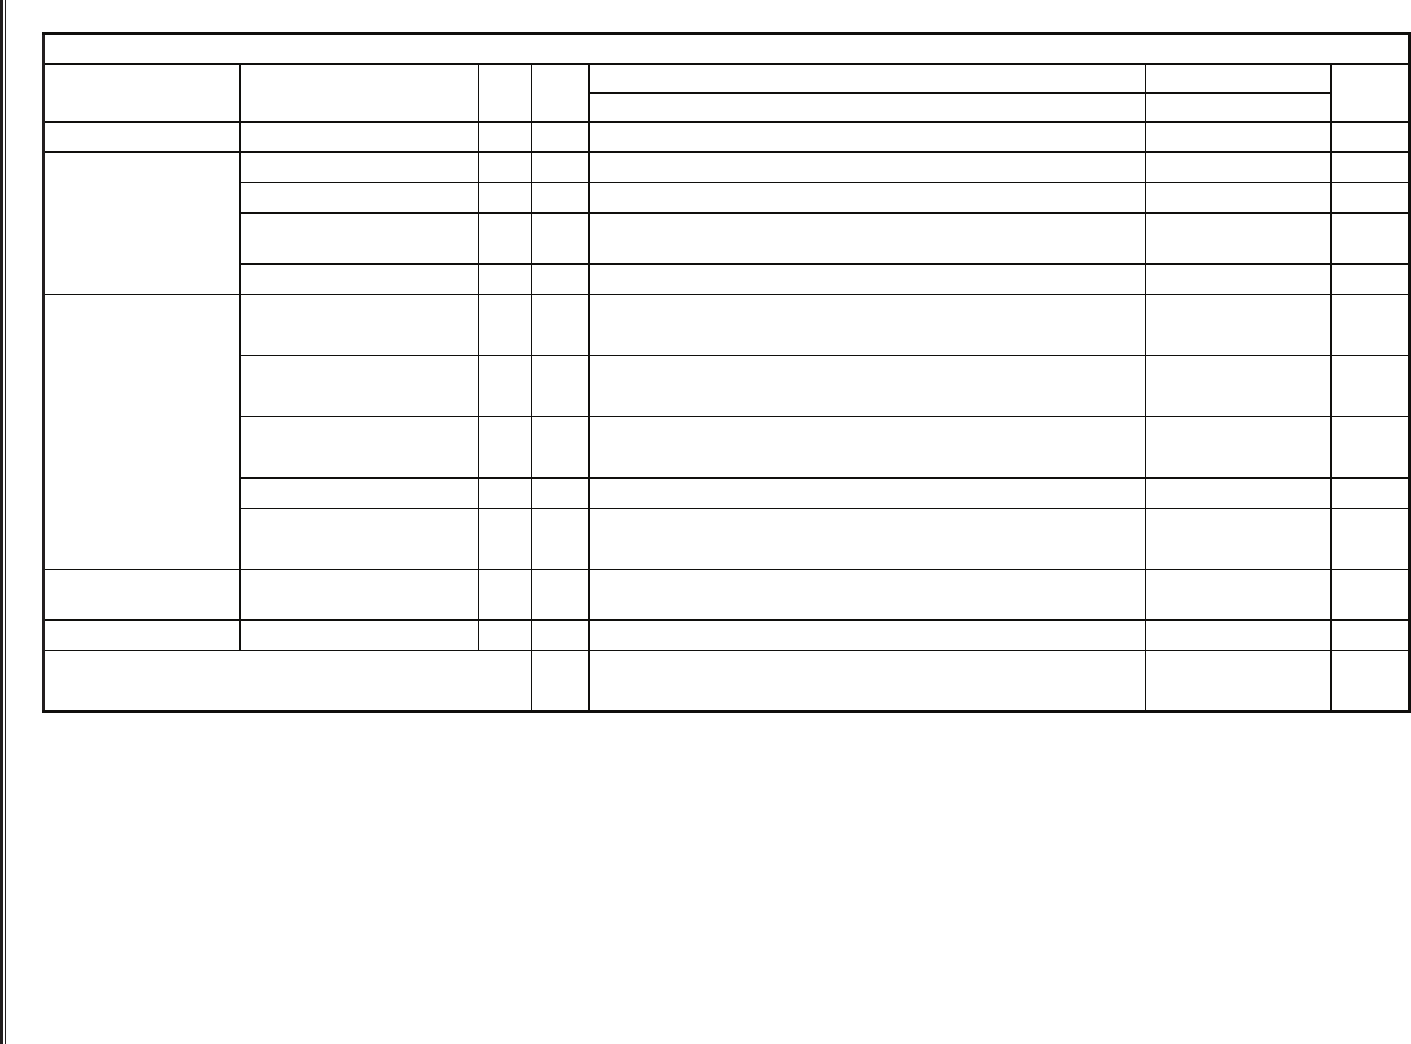
Washington State Sport Catch Report 2020 July 2022
53
Table 31. 2020-2021 Steelhead Sport Catch, by Area and Month (continued)
COASTAL RIVERS AND MARINE CATCH AREAS
System Area Code Run
2020 2021
Total
April May Jun Jul Aug
Sep
Oct Nov Dec Jan Feb Mar
North R. System North River 382 W 82 55 9 146
Queets R. System Clearwater River 392 W 6 6 12
Queets River 394 W 125 18 143
Salmon River (Jefferson
Co.)
396 W 71 143 214
Queets R. System Totals W 202 161 6 369
Quillayute R. System Bogachiel River 398 S 9 9
W 113 275 7 7 7 409
Calawah River 400 S 90 63
81
45 279
W 7 99 7 113
Quillayute River 404 S 18 18
W 14 14
Sol Duc River 406 W 7 21 28
Quillayute R. System Totals S 9 90 81
81
45 306
W 120 395 7 14 28 564
Quinault R. System Quinault R, Upper (above L.
Quinault)
412 W 9 27 36
Willapa R. System Willapa River 424 W 73 64 9 146
Coastal Rivers/Streams and Marine Carch Area Totals S 11 145 1,038 708
242
199 2,343
W 181 1,332 758 823 218 3,312
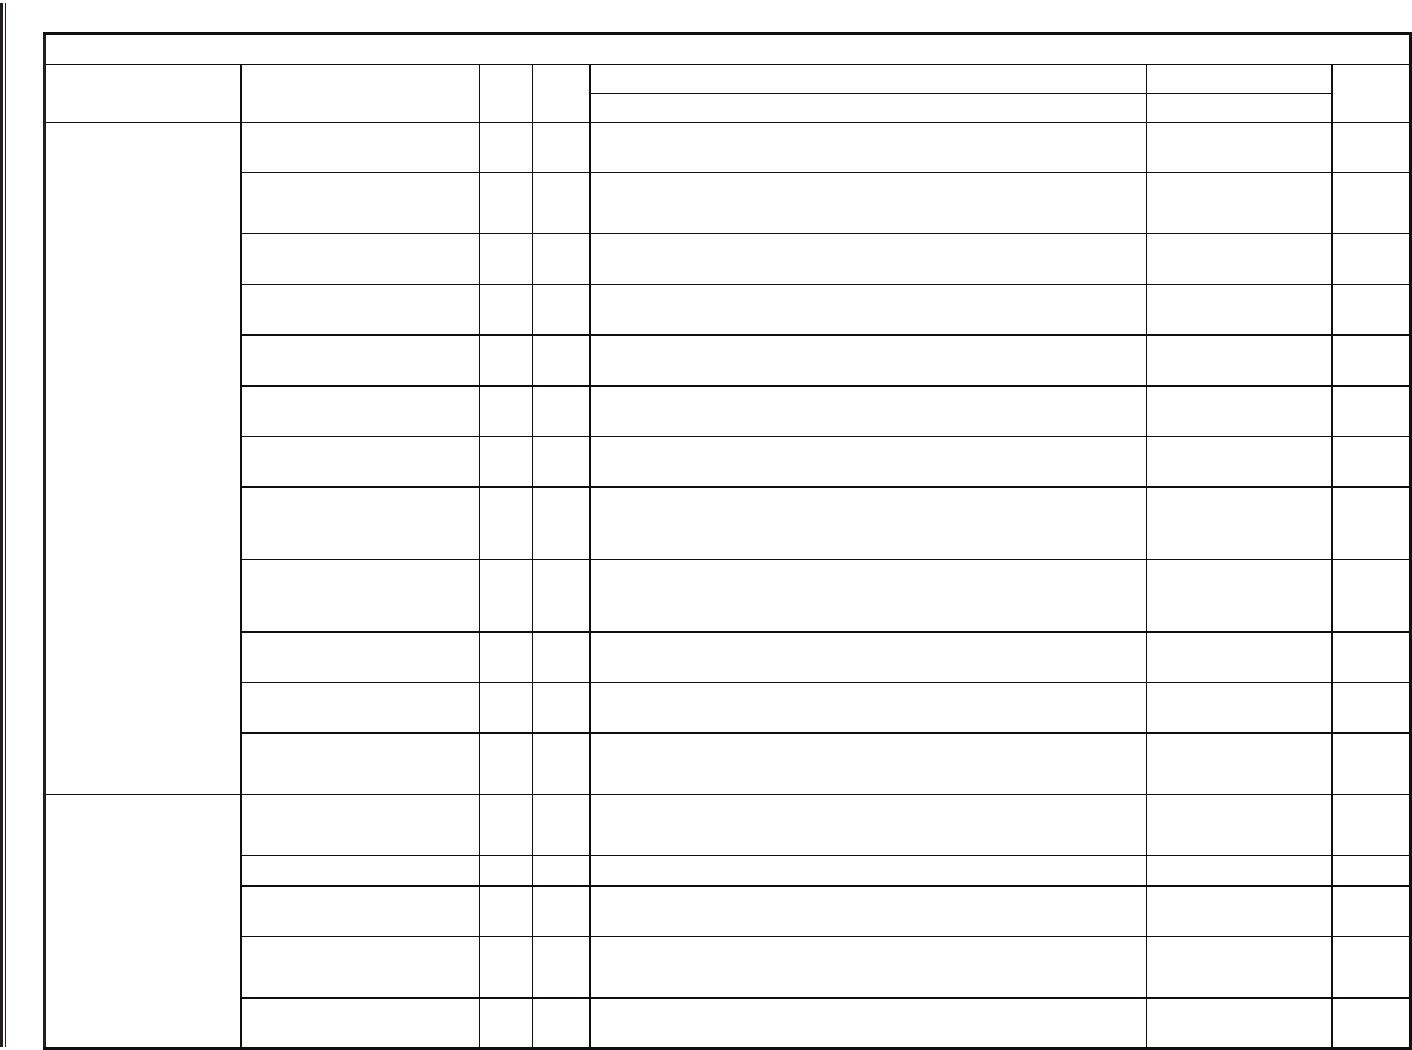
Washington State Sport Catch Report 2020
July 2022
54
Table 31. 2020-2021 Steelhead Sport Catch, by Area and Month (continued)
COASTAL RIVERS AND MARINE CATCH AREAS
System Area Code Run
2020 2021
Total
April May Jun Jul Aug
Sep
Oct Nov Dec Jan Feb Mar
Columbia R. Mainstem Columbia R 01: Buoy 10 to
Tongue Pt.-Rocky Pt.
519 S 115 75 190
Columbia R 02: Tongue Pt.
Rocky Pt. to Longview Br.
521 S 207 585 617 1,409
W 41 41
Columbia R 03: Longview
Br. to I-5 Br.
523 S 8 77 266 351
Columbia R 04: I-5 Br. to
Bonneville Dam
525 S 7 228 235
Columbia R 05: Bonneville
to The Dalles Dam
527 S 76 6 6 12 6 106
Columbia R 06: The Dalles
to John Day Dam
529 S 18 6 6 30
Columbia R 07: John Day to
McNary Dam
531 S 6 6 6 6 106 24 18 6 178
Columbia R 08: McNary
Dam - Hwy 395 Bridge @
Pasco
533 S 253 71 53 377
Columbia R 09: I-182
Bridge to old Hanford
townsite
535 S
6
71 65 29 171
Columbia R 12: Rock Island
to Rocky Reach Dam
541 S 6 6
Columbia R 14: Wells to
Chief Joseph Dam
545 S 47 12 59
24
142
Columbia R. Mainstem
Totals
S 221 837 1,298 71
30
77 430 142 83 6 3,195
W 41 41
Cowlitz R. System Blue Creek (Lewis Co.) 507 S 15 9
6
9 39
W 12 36 48
Coweeman River 557 W 5 5
Cowlitz R. above Cowlitz
Falls Dam
559 W 5 5 5 15
Cowlitz R. below Mayeld
Dam
561 S 210 597 4,254 2,318
791
254 8,424
W 128 112 368 896 3,12 9 4,633
Cowlitz R. between Mayeld
& Cowlitz Falls Dams
563 W 11 21 32
COLUMBIA RIVER AND TRIBUTARIES
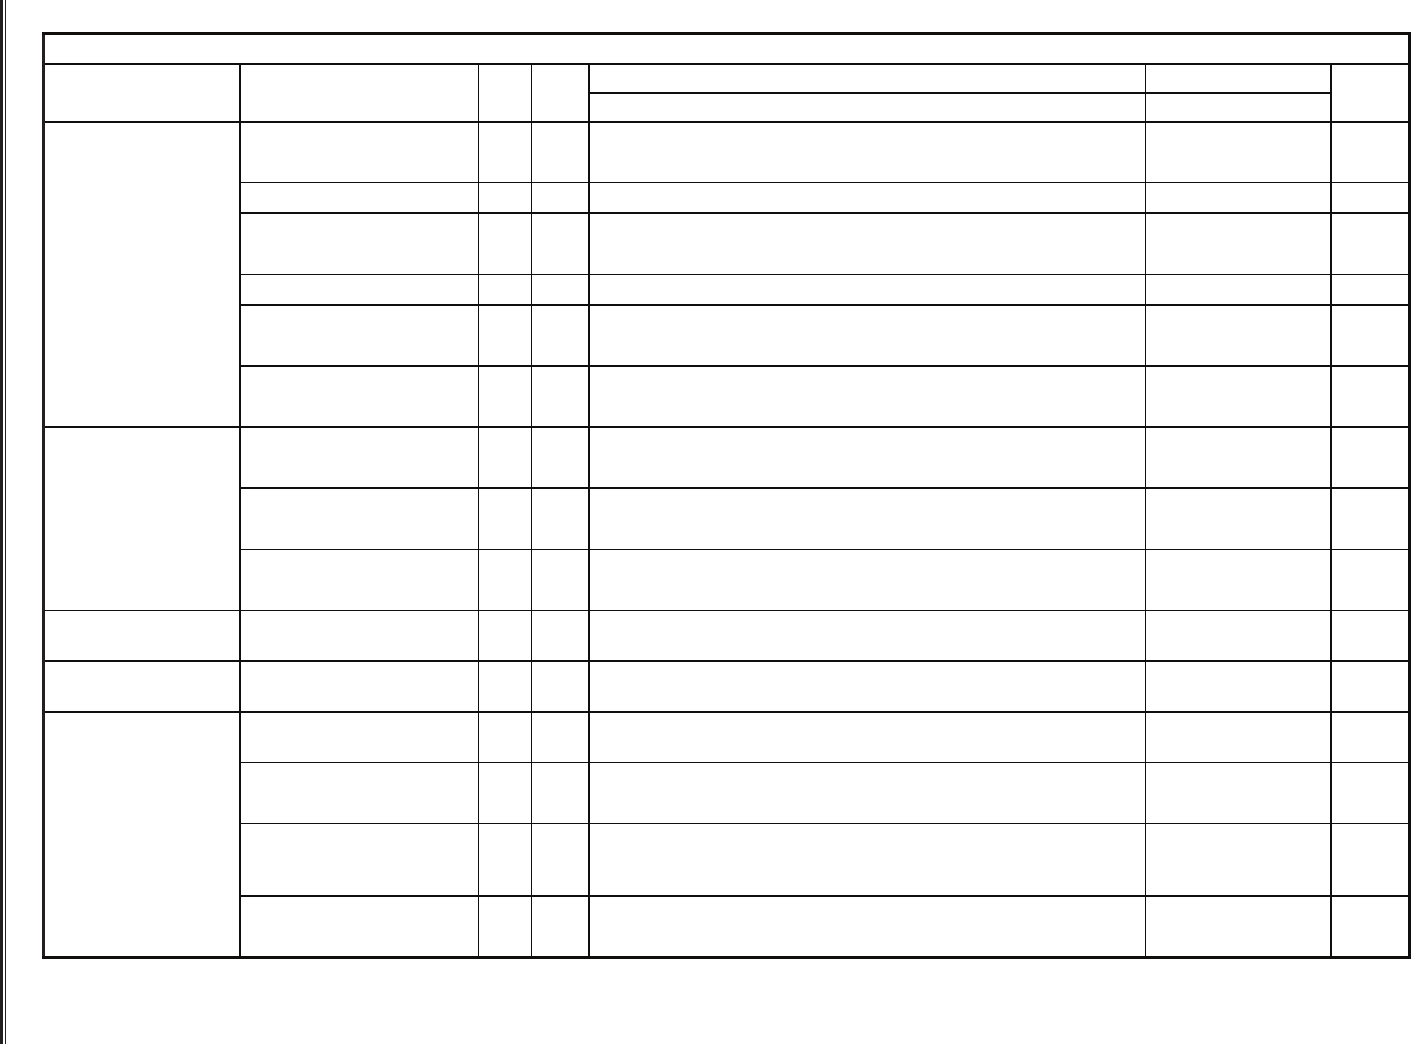
Washington State Sport Catch Report 2020 July 2022
55
Table 31. 2020-2021 Steelhead Sport Catch, by Area and Month (continued)
COASTAL RIVERS AND MARINE CATCH AREAS
System Area Code Run
2020 2021
Total
April May Jun Jul Aug
Sep
Oct Nov Dec Jan Feb Mar
Cowlitz R. System
(continued)
Green River (Cowlitz Co.)
below Toutle Hatchery
565 S 6 6
W 11 11
Olequa Creek (Cowlitz Co.) 569 S 6 6
Toutle River 573 S 33 33
W 16 16
Toutle River, No. Fork 575 S 6 6
Toutle River, So. Fork 577 S 11 33 55 66
22
28 215
W 5 5
Cowlitz R. System Totals S 221 630 4,354 2,384
813
288 8,690
W 11 26 133 112 384 901 3,150 4,717
Elochoman R. System Elochoman River above
Foster Rd Bridge
584 S 30 30 12 3 75
W 12 30 54 6 102
Elochoman River below
Foster Rd Bridge
583 S 6 6 12
W 18 6 24
Elochoman R. System
Totals
S 30 36 18 3 87
W 12 48 60 6 126
Grande Ronde R.
System
Grande Ronde River 592 S
7
218 168 126 175 126 379 1,199
Grays R. System Grays River above Barr Rd
Bridge
595 W 18 18
Kalama R. System Kalama River above Kalama
Falls Hatchery
602 S
3
3
Kalama River below Mod-
row Bridge
604 S 3 27 3
3
3 39
W 7 13 53 73
Kalama River between
Modrow Bridge and Kalama
Falls Hatchery
603 S 16 11 60 33
8
14 142
W 13 13 53 53 59 191
Kalama R. System Totals S 19 11 87 36
14
17 184
W 20 13 66 53 112 264
COLUMBIA RIVER AND TRIBUTARIES
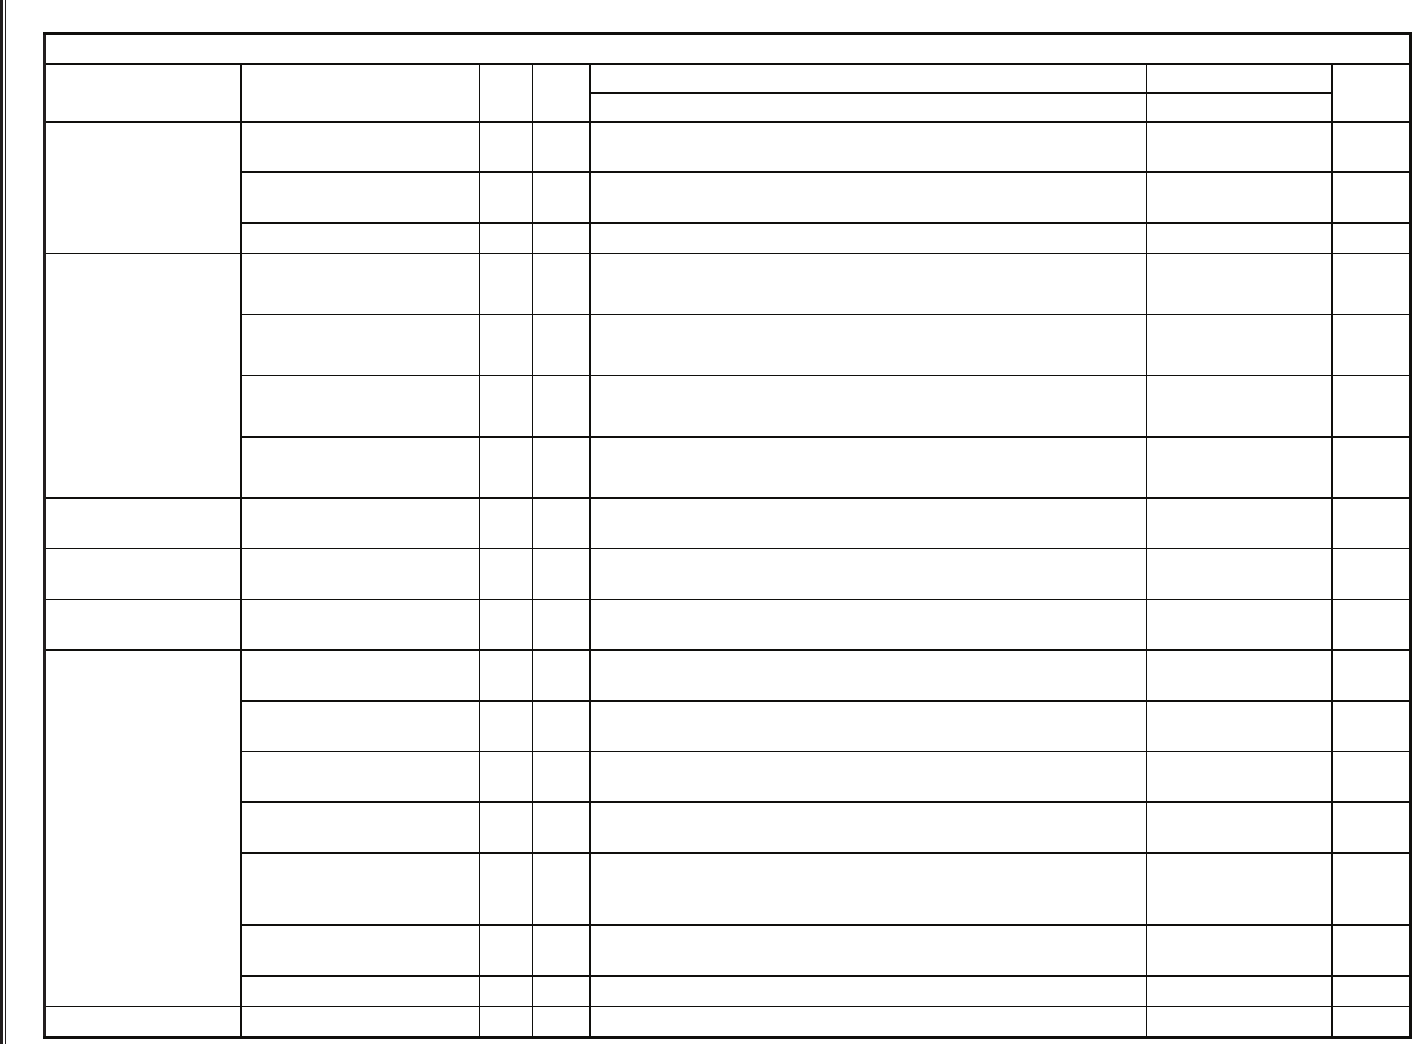
Washington State Sport Catch Report 2020
July 2022
56
Table 31. 2020-2021 Steelhead Sport Catch, by Area and Month (continued)
COASTAL RIVERS AND MARINE CATCH AREAS
System Area Code Run
2020 2021
Total
April May Jun Jul Aug
Sep
Oct Nov Dec Jan Feb Mar
Klickitat R. System Klickitat River above
Fishway 5
608 S 22 131 164 349
109
196 33 1,004
Klickitat River below
Fishway 5
607 S 11 11 33 22 11 88
Klickitat R. System Totals S 22 142 164 360
109
229 55 11 1,092
Lewis R. System Lewis River (below E. Fork) 611 S 13 19 51 77
6
6 172
W 4 4
Lewis River, E. Fork 613 S 13
19
26 58
W 16 8 4 4 32
Lewis River, No. Fork 615 S 19 504 268
51
6 848
W 16 12 4 12 44
Lewis R. System Totals S 13 38 555 358
76
38 1,078
W 16 24 12 12 16 80
Little White Salmon R.
Sys.
Little White Salmon River &
Drano Lake
618 S 12 12
Mill Cr. System
(Cowlitz)
Mill Creek (Cowlitz Co.) 624 W 6 6
Salmon Cr. System
(Clark)
Salmon Creek (Clark Co.) 635 W 6 6 12
Snake R. Mainstem Snake R 1: below Ice
Harbor Dam
640 S
11
16 22 5 5 5 64
Snake R 2: Ice Harbor to
Lower Monumental Dam
642 S
296
480 313 167 97 86 97 1,536
Snake R 3: Lower Monu-
mental to Little Goose Dam
644 S
32
92 59 65 102 11 16 377
Snake R 4: Little Goose to
Lower Granite Dam
646 S
11
11 70 65 92 59 22 330
Snake R 5: Lower Granite
Dam to Interstate Bridge,
Clarkston
648 S
189
296 415 146 38 43 11 1,138
Snake R 6: upstream of the
Interstate Bridge, Clarkston
650 S
108
243 313 92 22 38 816
Snake R. Mainstem Totals S
647
1,138 1,192 540 351 242 151 4,261
Tucannon R. System Tucannon River 653 S 3
6
6 15
COLUMBIA RIVER AND TRIBUTARIES
Washington State Sport Catch Report 2020 July 2022
57
Table 31. 2020-2021 Steelhead Sport Catch, by Area and Month (continued)
COASTAL RIVERS AND MARINE CATCH AREAS
System Area Code Run
2020 2021
Total
April May Jun Jul Aug
Sep
Oct Nov Dec Jan Feb Mar
Walla Walla R. System Touchet River 657 S 3 56 59
Walla Walla River 659 S
3
15 3 15 36
Walla Walla R. System
Totals
S
3
15 3 15 3 56 95
Washougal R. System Little Washougal River 661 S 6 6
Washougal Hatchery on
Washougal River
663 S 3 3
Washougal River above
County Line Access
668 W 6 6
Washougal River below
County Line Access
667 S 12 24 36
W 42 36 12 18 108
Washougal R. System
Totals
S 6 15 24 45
W 48 36 12 18 114
Wenatchee R. System Lake Wenatchee 670 S 3 3
Wenatchee River 674 S 3 3 6
Wenatchee R. System
Totals
S 3 3 3 9
White Salmon R.
System
Big White Salmon River 508 S 3
3
3 9
W 6 6
Columbia River and Tributary System Totals (All non-Boldt)
S 535 1,709 6,518 3,224
1,714
2,050 1,848 826 623 371 592 20,010
W 11 26 181 269 576 984 3,385 5,432
COLUMBIA RIVER AND TRIBUTARIES
Washington State Sport Catch Report 2020
July 2022
58
Table 31. 2020-2021 Steelhead Sport Catch, by Area and Month (continued)
COASTAL RIVERS AND MARINE CATCH AREAS
System Area Code Run
2020 2021
Total
April May Jun Jul Aug
Sep
Oct Nov Dec Jan Feb Mar
Marine Water Area 6: E Juan de Fuca 6 W 11 11
Area 9: Admiralty Inlet 9 S 8 8
Marine Water Totals S 8 8
W 11 11
Dewatto R. System Dewatto River 732 W 6 6
Dungeness R.
System
Dungeness River 738 W 6 6
Green-Duwamish R.
Sys
Green (Duwamish River)
(King Co.)
746 S 11 11 8
4
4 38
Hoko R. System Hoko River 752 W 17 17
Nooksack R. System Nooksack River, No. Fork 790 W 6 6
Nooksack River, below
North Fork
794 W 6 6
Nooksack R. System Totals W 6 6 12
Sekiu R. System Sekiu River 818 W 6 6
Skagit R. System Cascade River 826 W 6 6
Skagit River 830 S 8 8 16
Skagit R. System Totals S 8 8 16
W 6 6
Snohomish R. System Skykomish River 844 S 22 82 193 15
22
334
W 75 100 25 200
Skykomish River, No. Fork 846 W 33 33
Snohomish River 850 S 15 15
W 17 17
Snoqualmie River 852 S 15
15
30
W 8 8 16
Tokul Creek 856 W 17 8 25
Wallace River 860 S
7
7
W 17 8 25
Snohomish R. System
Totals
S 22 112 193 15
44
386
W 25 116 142 33 316
PUGET SOUND AND STRAIT OF JUAN DE FUCA RIVER SYSTEMS AND MARINE CATCH AREAS
Washington State Sport Catch Report 2020 July 2022
59
Table 31. 2020-2021 Steelhead Sport Catch, by Area and Month (continued)
COASTAL RIVERS AND MARINE CATCH AREAS
System Area Code Run
2020 2021
Total
April May Jun Jul Aug
Sep
Oct Nov Dec Jan Feb Mar
Stillaguamish R.
System
Stillaguamish R, No. Fork 872 S 30 30
W 6 6
Stillaguamish River 876 S
4
4
W 39 17 56
Stillaguamish R. System
Totals
S
4
30 34
W 6 39 17 62
Puget Sound, Strait of Juan de Fuca River Systems
and Marine Catch Area Totals (All are Boldt Case
Areas)
S 22 123 212 31
52
42 482
W 31 184 183 44 442
PUGET SOUND AND STRAIT OF JUAN DE FUCA RIVER SYSTEMS AND MARINE CATCH AREAS
Table 31. 2020-2021 Steelhead Sport Catch, by Area and Month (continued)
COASTAL RIVERS AND MARINE CATCH AREAS
System Area Code Run
2020 2021
Total
April May Jun Jul Aug
Sep
Oct Nov Dec Jan Feb Mar
Unknown Area Totals
S 45
15
60
W 14 14 14 42
UNKNOWN
Table 31. 2020-2021 Steelhead Sport Catch, by Area and Month (continued)
COASTAL RIVERS AND MARINE CATCH AREAS
System Area Code Run
2020 2021
Total
April May Jun Jul Aug
Sep
Oct Nov Dec Jan Feb Mar
Statewide Totals
S 568 2,022 7,768 3,963
2,023
2,291 1,848 826 623 371 592 22,895
W 11 26 407 1,799 1,517 1,851 3,617 9,228
Grand
Total
568 2033 7794 3963
2023
2291 2,255 2625 2 ,140 2222 4,209 32 ,123
STATEWIDE TOTALS

Washington State Sport Catch Report 2020
July 2022
60
Table 32. 2020-2021 Washington Sport Steelhead Fishing, by Residence
County of
Residence
Number of
Catch Record
Cards
Population by
County
% Catch Record
Card Holders
Total
Steelhead
Average Catch
per Card
Adams 1,709 20,027 8.5 14 0.01
Asotin 2,211 22,820 9.7 521 0.24
Benton 21,045 206,426 10.2 1,056 0.05
Chelan 7,72 2 7 7,574 10.0 43 0.01
Clallam 9,964 78,067 12.8 637 0.06
Clark 42,999 496,865 8.7 2,360 0.05
Columbia 557 4,048 13.8 29 0.05
Cowlitz 19,033 111,371 17.1 3,924 0.21
Douglas 3,722 43,560 8.5
Ferry 391 7,75 9 5.0
Franklin 9,569 97,075 9.9 652 0.07
Gareld 355 2,290 15.5 102 0.29
Grant 5,770 99,377 5.8 29 0.01
Grays Harbor 11,124 75,950 14.6 2,722 0.24
Island 11,18 8 86,014 13.0 29 0.00
Jefferson 3,651 32,700 11.2 43 0.01
King 95,682 2,274,315 4.2 2,114 0.02
Kitsap 23,373 272,787 8.6 232 0.01
Kittitas 3,671 49,204 7.5 29 0.01
Klickitat 3,329 22,697 14.7 188 0.06
Lewis 11,492 82,109 14.0 3,329 0.29
Lincoln 808 11,09 0 7.3 29 0.04
Mason 6,697 68,224 9.8 73 0.01
Okanogan 3,269 42,620 7.7 58 0.02
Pacic 4,172 22,984 18.2 304 0.07
Pend Oreille 529 14,144 3.7
Pierce 63,487 913,890 6.9 3,649 0.06
San Juan 2,267 17, 49 2 13.0
Skagit 16,544 130,789 12.6 174 0.01
Skamania 1,388 12,107 11.5 43 0.03
Snohomish 59,358 830,393 7.1 1,317 0.02
Spokane 16,377 528,225 3.1 1,549 0.09
Stevens 3,077 46,360 6.6 14 0.00
Thurston 22,529 294,074 7.7 1,621 0.07
Wahkiakum 1,057 4,498 23.5 406 0.38
Walla Walla 5,127 61,292 8.4 477 0.09
Whatcom 19,524 231,016 8.5 145 0.01
Whitman 2,044 49,500 4.1 391 0.19
Yakima 20,552 251,879 8.2 1,390 0.07
Unknown WA 1,254 29 0.02
Washington Total 538,617 7,693,612 7.0 29,722 0.06
Other State Total 35,210 2,403 0.07
Canada 89
Other 94
Grand Total 574,010 32,125 0.06
Source: Table 1: Annual Estimates of the Resident Population for Counties of Washington: April 1, 2010 to July 1, 2020.
Source: Population Division, U.S. Census Bureau. Release Date: July 2020

Washington State Sport Catch Report 2020 July 2022
61
Table 33. 2020-2021 Frequency Distribution of Estimated Steelhead Catch Record Cards and Catch
#Steelhead
per Catch Re-
cord Card
Number of
Cards
Cumulative
Number of
Cards
Percent
Cards
Cumulative
Percent Cards
Total
Catch
Cumulative
Total Catch
Percent
Catch
Cumulative
Percent Catch
0 562,813 562,813 98.0% 98.0% 0 0 0.0% 0.0%
1 5,683 568,496 1.0% 99.0% 5,683 5,683 17.7% 17.7%
2 2,239 570,735 0.4% 99.4% 4,478 10,161 13.9% 31.6%
3 780 571,515 0.1% 99.6% 2,340 12,501 7.3% 38.9%
4 809 572,324 0.1% 99.7% 3,236 15,737 10.1% 49.0%
5 289 572,613 0.1% 99.8% 1,445 17,18 2 4.5% 53.5%
6 303 572,916 0.1% 99.8% 1,818 19,000 5.7% 59.1%
7 231 573,147 0.0% 99.8% 1,617 20,617 5.0% 64.2%
8 202 573,349 0.0% 99.9% 1,616 22,233 5.0% 69.2%
9 101 573,450 0.0% 99.9% 909 23,142 2.8% 72.0%
10 43 573,493 0.0% 99.9% 430 23,572 1.3% 73.4%
11 43 573,536 0.0% 99.9% 473 24,045 1.5% 74.8%
12 72 573,608 0.0% 99.9% 864 24,909 2.7% 77.5%
13 72 573,680 0.0% 99.9% 936 25,845 2.9% 80.4%
14 101 573,781 0.0% 100% 1,414 27, 25 9 4.4% 84.8%
15 29 573,810 0.0% 100% 435 27,694 1.4% 86.2%
16 29 573,839 0.0% 100% 464 28,158 1.4% 87.6 %
17 14 573,853 0.0% 100% 238 28,396 0.7% 88.4%
18 14 573,867 0.0% 100% 252 28,648 0.8% 89.2%
20 14 573,881 0.0% 100% 280 28,928 0.9% 90.0%
21 29 573,910 0.0% 100% 609 29,537 1.9% 91.9%
22 43 573,953 0.0% 100% 946 30,483 2.9% 94.9%
27 14 573,967 0.0% 100% 378 30,861 1.2% 96.0%
28 14 573,981 0.0% 100% 392 31,253 1.2% 97.3%
30 29 574,010 0.0% 100% 870 32,123 2.7% 100%
Total 574,010 100% 32 ,123 100%

Washington State Sport Catch Report 2020
July 2022
62
Table 34. 2020-2021 Sport Steelhead Inventory of Catch Record Cards Reported
Response Type
With
Catch
No
Catch
Total
Reports
Number of
Steelhead
Catch
per Card
Prior to reminder 31 9,257 9,288 50 0.01
After 1st reminder postcard 595 25,847 26,442 1,708 0.06
After 2nd reminder postcard 145 3,843 3,988 466 0.12
Total 771 38,947 39,718 2,224 0.06
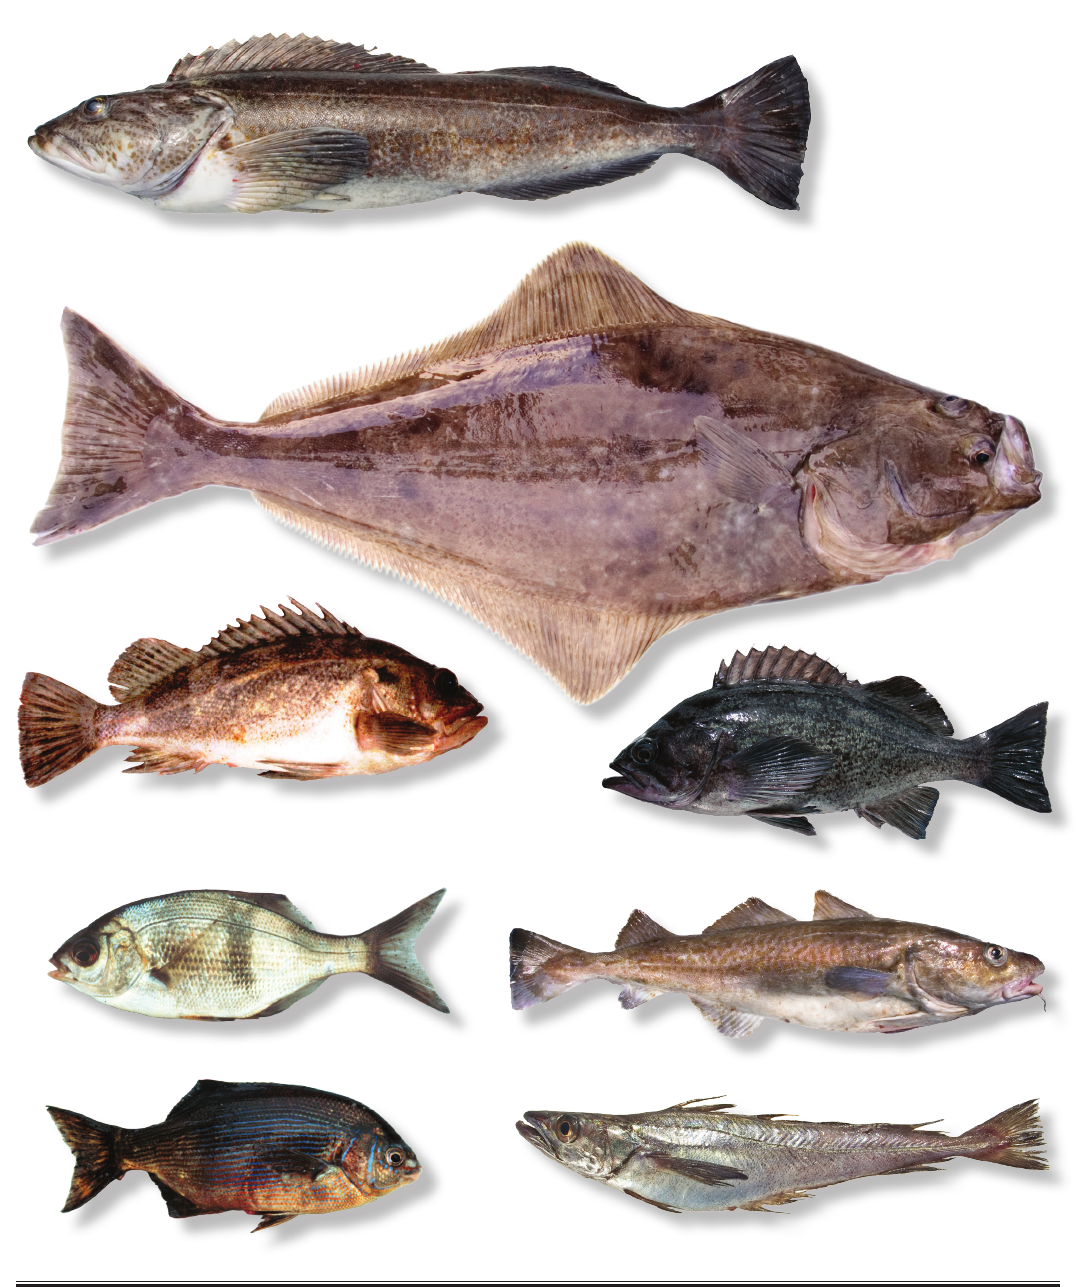
Washington State Sport Catch Report 2020 July 2022
63
Marine Fish
Washington State Sport Catch Report 2020 July 2022
64
Table 35. 2020 Coastal Marine Fish Catch
Species
Catch Area
Total
Area 1
Ilwaco
Area 2
Westport
Area 3
La Push
Area 4
Neah Bay
(Ocean)
Area 4B
Neah Bay
(Strait)
Black Rocksh 16,302 67,834 1,458 12,413 6,533 104,540
Blue Rocksh 21 62 37 835 477 1,432
Yellowtail Rocksh 9,315 36,785 114 461 87 46,762
China Rocksh 25 9 14 294 41 383
Quillback Rocksh 101 373 5 206 46 731
Copper Rocksh 66 100 22 217 110 515
Canary Rocksh 943 4,482 75 243 54 5,797
Yelloweye Rocksh 7 8 3 18
Tiger Rocksh 100 53 26 15 194
Vermillion Rocksh 31 2 6 158 31 228
Other Rocksh 113 113
Boccaccio 251 80 2 13 346
Lingcod 4,078 19,287 662 4,838 2,961 31,826
Kelp Greenling 563 288 251 616 1,718
Pacic Cod 24 2 182 59 267
Other Cod 4 11 37 15 7
Cabezon 423 413 12 623 559 2,030
Flatsh 661 7,169 70 57 7,957
Surf Perch 542 10 552
Albacore Tuna 12,335 15,077 27,412
Sharks and Skates 47 7 54
Miscellaneous 1,675 3,410 26 234 32 5,377

Washington State Sport Catch Report 2020 July 2022
65
Table 36. Coastal Washington Recreational Pacic Halibut Catch 2000-2020
Year
Columbia
Catch Area 1
South Coast
Catch Area 2
North Coast
Catch Areas 3-4
2000 370 1,980 4,286
2001 387 2,085 5,752
2002 347 1,644 5,219
2003 327 2,482 5,576
2004 447 3,455 5,627
2005 518 2,981 5,046
2006 693 2,377 4,562
2007 585 2,017 3,136
2008 667 2,375 4,408
2009 391 2,328 4,841
2010 428 2,259 5,438
2011 480 2,613 4,931
2012 350 2,588 5,130
2013 292 2,664 5,387
2014 540 2,465 6,064
2015 590 2,557 5,247
2016 702 2,543 6,003
2017 949 3,835 5,683
2018 931 3,258 6,365
2019 1,082 4,138 8,011
2020 352 3,087 3,328
Washington State Sport Catch Report 2020 July 2022
66
Table 37. 2020 Sport Bottomsh Catch by Boat-Based Anglers in Puget Sound
Species
Marine Area
Puget
Sound
Total
5 6 7 8-1 8-2 9 10 11 12 13
Pacic Halibut 1,427 2,074 558 42 4,101
Starry Flounder 17 485 149 27 0 23 27 7 57 792
Soles 34 7 150 280 168 619 269 440 1,968
Sanddabs 32 26 429 199 29 2,437 2,595 239 14 56 6,055
Misc. Flatsh 26 106 518 457 4,616 26,864 17,430 21,109 384 5,945 77,454
Sablesh 23 23
Lingcod 405 178 3,495 373 18 292 112 42 149 5,065
Greenlings 416 78 1,721 1,065 61 2 43 3,387
Copper Rocksh 87 87
Quillback Rocksh 35 35
Brown Rocksh 9 6 15
Black Rocksh 2,794 6 2,800
Blue Rocksh 79 79
Yellowtail Rocksh 23 23
Vermillion Rocksh 18 18
Yelloweye Rocksh 0
Canary Rocksh 2 2
China Rocksh 26 26
Greenstriped Rocksh 0
Other Rockshes 54 54
Pacic Cod 42 42
Walleye Pollock 2 2
Pacic Tomcod 2 2
Pacic Hake 0
Other Cod 9 9
Cabezon 103 65 726 11 4 47 33 988
Other Sculpins 6 2 59 99 9 24 198
Perches 5 135 150 569 859
Spiny Dogsh 4 48 205 27 27 233 67 137 32 778
Ratsh 0
Skates 6 5 84 95
Total 5,629 3,073 8,099 2,348 5,124 30,835 20,867 21,871 398 6,711 104,956
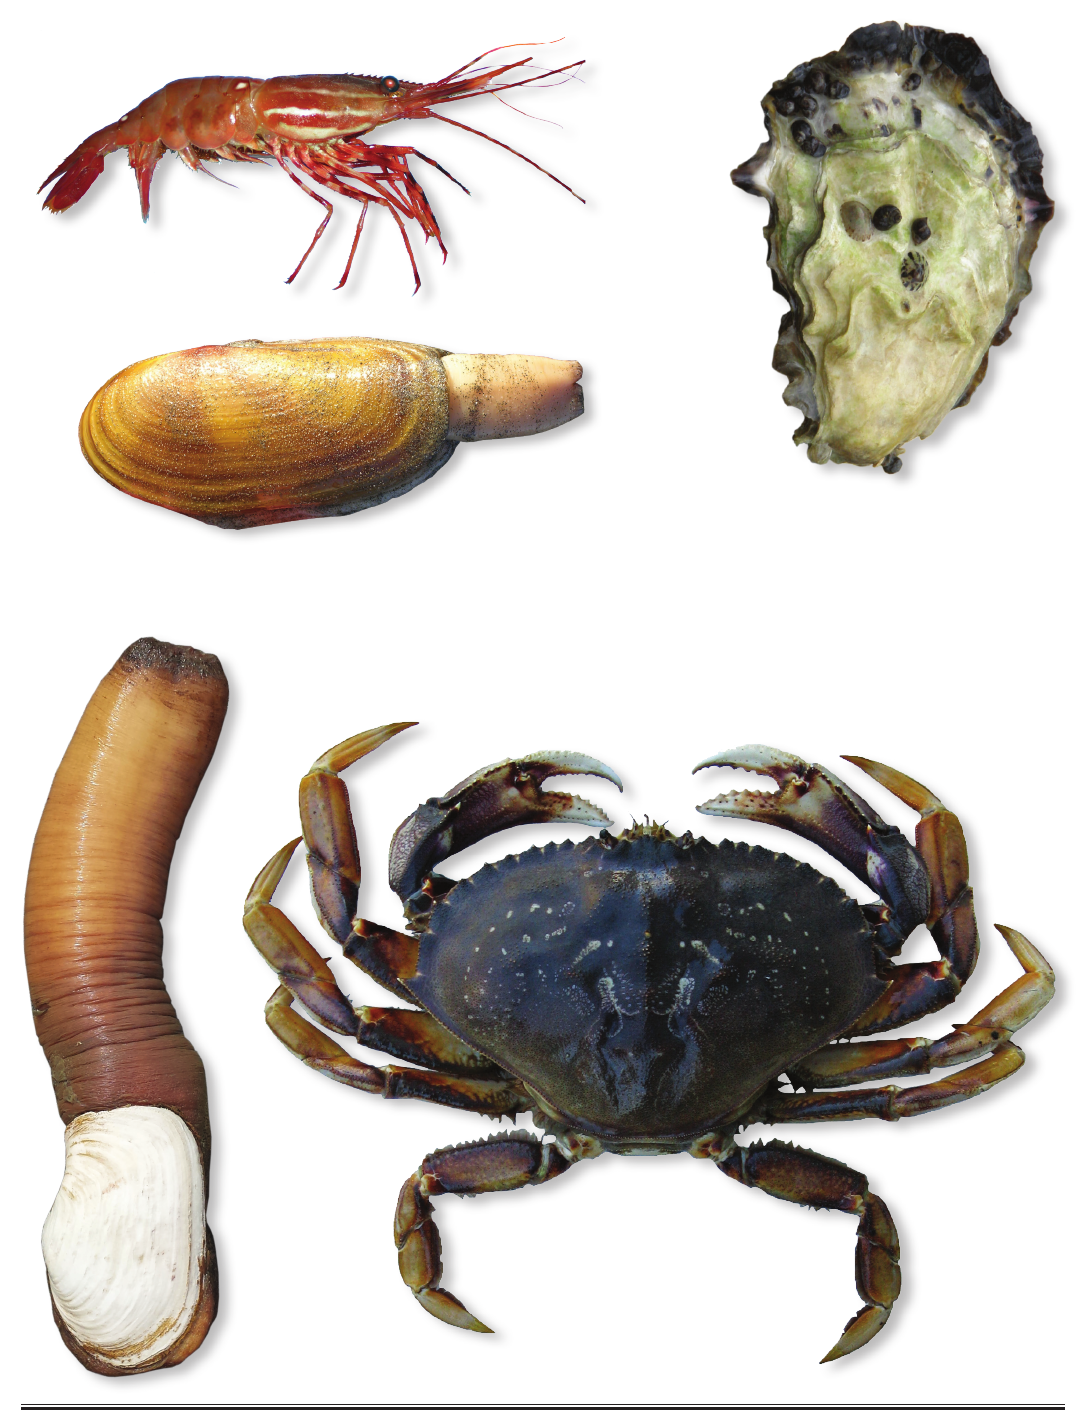
Washington State Sport Catch Report 2020 July 2022
67
Shellsh

Washington State Sport Catch Report 2020 July 2022
68
Table 38. 2020-2021 Seasonal Summary of Sport Razor Clam Digging on Ocean Beaches
Fall/Winter Spring
2
Location
Digger
Trips
Clams
Per Trip
Number
of Clams
Digger
Trips
Clams
Per Trip
Number |
of Clams
Long Beach 32,020 15.0 480,298 0 0 0
Twin Harbors 19,403 15.0 291,158 0 0 0
Copalis 15,177 15.0 227,65 8 0 0 0
Mocrocks 14,908 15.0 223,619 0 0 0
Kalaloch 0 0 0 0 0 0
Total 81,508 15.0 1,222,732 0 0 0
¹ During the 2020/2021 Season, Fall and Winter openers occured on evening (PM) tides on all beaches between
September 16, 2020 and October 20, 2020, closing early due to domoic acid toxicity.
² During the 2020/2021 Season, Spring openers occured on the morning (AM) tides between May 15, 2021 and May
30, 2021 on Mocrocks beach only due to domoic acid toxicity.
Washington State Sport Catch Report 2020 July 2022
69
Table 39. 2020 Clam and Oyster Recreational Use and Harvest Estimates from Intertidal Areas East of Dungeness Spit
Marine
Areas
Beach Name
User
Trips
Pounds of Clams Harvested
Number of
Oysters
Manila Littleneck Butter Cockle Softshell Horse Geoduck Total
6 Sequim Bay SP 1,373 109 2,174 23 2,058 105 825 5,294 13,377
7 Birch Bay SP 6,568 1,826 2,758 27,587 1,473 43 1,976 35,663 1,174
Drayton West 31 32 4 21 1 58 58
8-1 West Penn Cove 5,064 144 1,014 19,421 4,957 12 519 26,067 18,073
Freeland CP 8 12 2 9 23
9 Fort Flagler SP 776 658 2,704 421 30 812 64 4,689
Oak Bay CP 75 21 8 355 23 45 452 1
Indian Island CP 205 244 14 326 3 5 25 617 59
Port Gamble 5,087 9,253 2,225 2,985 1,285 435 3,481 75 19,739 34,986
Wolfe + Shine SP 2,386 2,177 255 3,985 802 77 2,030 16 9,342 10,694
12 Dabob Broad Spit 801 2,487 236 11 2,734 1,520
Quilcene Bay WDFW Tidelands 3,435 5,084 8 5,092 19,964
Dosewallips SP 12,865 24,434 37 65 58 24,594 85,531
Pt. Whitney Tidelands 1,793 1,318 119 122 7 2 22 1,590 13,023
Eagle Creek 2,442 155 99 3,026 122 227 1,786 7, 857 55,383
DNR-44A W Dewatto 1,391 2,647 29 3 4 2 2,685 9,691
Rendsland Creek 961 784 32 10 121 3 950 12,817
Potlatch SP 31,682 31,246 2,517 15,009 12,840 179 799 62,590 246,964
Belfair SP 12,503 15,071 8 51 15,130 111,733
Duckabush 771 877 1 7 6 71 962 5,996
Triton Cove Tidelands 2,104 1,055 99 112 199 1 30 1,496 16,702
Lilliwaup SP 3,133 11 395 5,217 859 95 6,577 31,086
Twanoh SP 4,967 1,291 3 259 1 1,554 52,686
13 North Bay 2,310 4,895 237 25 5,157 19,095
Total 100,289 107,4 6 0 12,980 7 7,9 9 6 28,409 1,161 10,894 2,012 240,912 760,613
Washington State Sport Catch Report 2020 July 2022
70
Table 40. 2020 Puget Sound and Hood Canal Sport Spot Shrimp Fishery
Area Date
Angler
Trips
Pounds
CPUE
(lbs. per trip)
4, 5
May through Sept (111 days) 425 1,300
3.1
6
May June Aug (26 days) 3,451 17,444
5.1
6 (Discovery Bay)
June (2 days) 389 1,702
4.4
7
May through Sept (39 days) 9,865 47,737
4.8
8-1 & 8-2
June (1 day) 2,694 14,926
5.5
9
June Aug (2 days) 1,137 5,238
4.6
10
June (1 day) 2,606 13,698
5.3
11
June (1 day) 1,001 4,285
4.3
12
June July (5 days) 19,999 95,653
4.8
13
None na na
na
Total
41 ,567 201,983
4.9
This table summarizes the recreaonal take of spot shrimp (Pandalus platyceros) in these areas for the 2020 spot
shrimp season. No esmates of angler trips or pounds harvested of “non-spot” shrimps are included in this table.
Table 41. 2020 Sport Dungeness Crab Catch (all gear types)
Area 13 was closed for both summer and winter seasons. Areas 10 and 11 were open on a limited basis during the
summer. Areas 10, 11, and Areas 12 south of Ayock Point were closed during the winter season.
Marine Area and location
Summer
Season
(lb. of crab)
Fall/Winter
Season
(lb. of crab)
4 Neah Bay 1,10 6 67
5 Sekiu/Pillar Point 4,325 416
6 Port Angeles Harbor, Dungeness & Sequim Bays, Discovery Bay 112,613 17,015
7
Gulf of Georgia, North of San Juan Islands, Bellingham Bay,
Samish Bay, San Juan Islands, Anacortes
424,038 71,520
8-1 Skagit Bay, North Saratoga Passage, Holmes Harbor 371,807 27,9 07
8-2 South Saratoga Passage, Port Susan, Port Gardner 353,126 39,663
9
1
Admiralty Inlet, Port Townsend Bay, Useless Bay 66,678 13,074
10 Seattle/Kingston, Port Orchard 35,615 285
11 Colvos Pass, East Pass 26,585 65
12, 9
2
Port Ludlow/Port Gamble, Upper Hood Canal, Central Hood
Canal, Lower Hood Canal
62,635 19,418
13 South Puget Sound 101 36
Total 1,458,629 189,466
1
Excluding all waters of Marine Area 9 south of a line from Foulweather Bluff to Olele Point.
2
Including all waters of Marine Area 9 south of a line from Foulweather Bluff to Olele Point.

This program receives Federal financial assistance from the U.S. Fish and
Wildlife Service Title VI of the Civil Rights Act of 1964, Section 504 of the
Rehabilitation Act of 1973, Title II of the Americans with Disabilities Act
of 1990, the Age Discrimination Act of 1975, and Title IX of the
Education Amendments of 1972. The U.S. Department of the Interior and
its bureaus prohibit discrimination on the bases of race, color, national
origin, age, disability and sex (in educational programs). If you believe
that you have been discriminated against in any program, activity or
facility, please contact the WDFW ADA Program Manager at P.O. Box
43139, Olympia, Washington 98504, or write to
Department of the Interior
Chief, Public Civil Rights Division
1849 C Street NW
Washington D.C. 20240
