Introduction
Monocyclic aromatic hydrocarbons are important commodity chemicals used to
manufacture polymers. ASTM Committee D16 designates purity specifications for
many of these chemicals. The ASTM D7405 method supports these specifications by
using gas chromatography to measure overall chemical purity and the content of key
impurities. These analyses are often performed by manufacturing technicians who are
not trained analytical chemists. To simplify the technique while maintaining precision,
the D7504 method eliminates sample preparation and instrument calibration by using
Effective Carbon Number (ECN) responses. For this technique to be effective, sample
components from 10
–4
to 99.5 weight % must be detected in a single run.
The Agilent Intuvo 9000 GC is Designed to Make Routine Chemical
Purity Analysis Fast and Easy
• Click-and-run column design removes the need for expert column installation skills.
• An auto-ranging flame ionization detector can quantitatively measure peak
response across a large concentration range without overload.
• Small footprint and low resource usage is suited for production labs.
• Simple, intuitive touchscreen interface.
CHEMICAL PURITY ANALYSIS
Technology Advantage: Agilent Intuvo 9000 GC with FID
For more information, visit:
www.agilent.com/chem/intuvo
Methodology
GC Instrument Conditions
Parameter Value
Inlet 100:1 split, 270 °C
Injection volume 0.5 µL
Column Agilent Intuvo HP-Innowax, 60 m × 0.32 mm, 0.5 μm (p/n 19091N-216-INT)
Constant column flow 2.1 mL/min helium
Column temperature 60 °C for 10 minutes
5 °C/min to 150 °C hold 10 minutes
Detector Flame ionization 300 °C
Results and Discussion
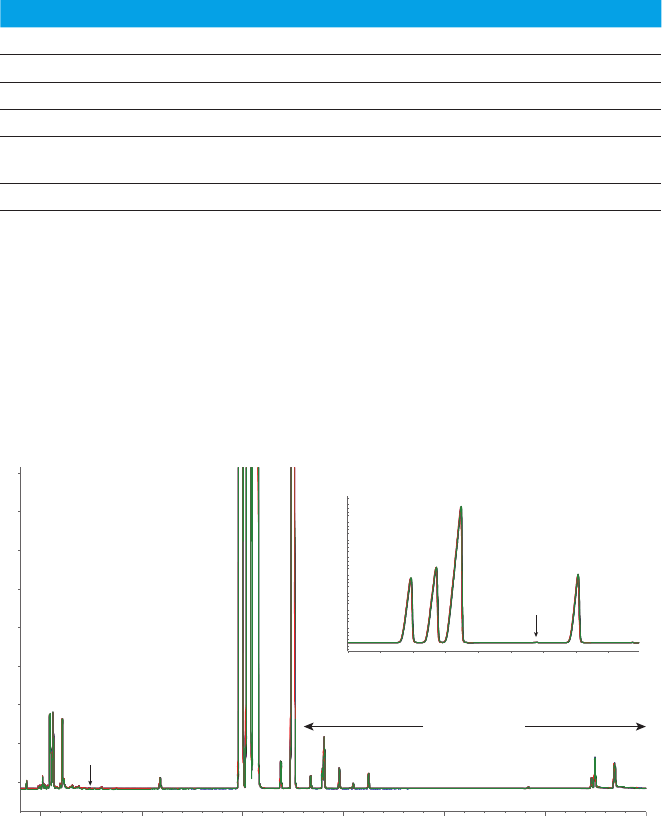
Figure 1 shows 10 sequential injections of a mixed xylene sample. In a single
injection, the Agilent Intuvo 9000 GC flame ionization detector (FID) is able to
quantify the four large C8 aromatic peaks along with the smaller impurities. Table1
shows the quantitative results. Single lab precision was met for all components found
in this sample.
Time (min)
51015202530
pA
10
20
30
40
50
60
70
80
Toluene
Cumene
Non-aromatics
Benzene
C9 + aromatics
mi
n
14 15 16 17 18
pA
0
1,000
2,000
3,000
4,000
5,000
6,000
7,000
Ethylbenzene
p-Xylene
m-Xylene
o-Xylene
Cumene
Figure 1. Ten overlays of mixed xylene analysis. Autoranging FID quantitatively detects small and large peaks
in a single run.
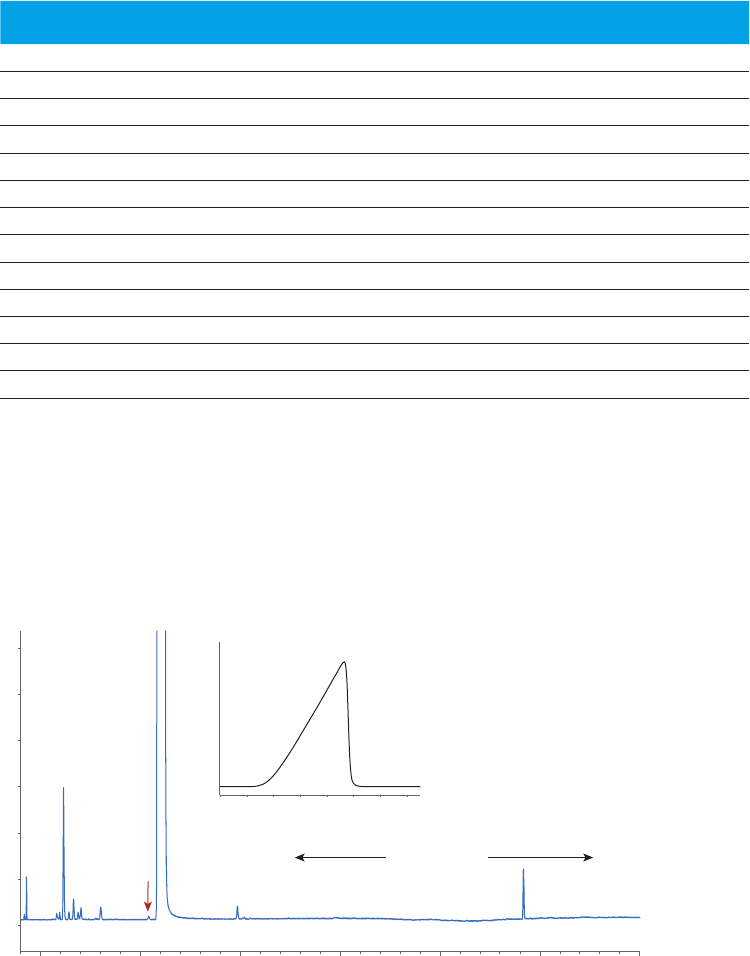
A high purity toluene sample was also run to demonstrate the large, automated
response range of the Intuvo 9000 FID (Figure 2). Note that the detector is able
to respond to peaks from 0.16 pA to 13,500 pA. This represents a concentration
difference from 18ppm to 99.97 weight %.
51015202530
pA
8
10
12
14
16
18
20
min10.8 10.9 11.0 11.1 11.2 11.3
pA
0
2,000
4,000
6,000
8,000
10,000
12,000
14,000
Toluene
Ethylbenzene
Non-aromatics
0.16 pA
13,500 pA
C9 + aromatics
Time (min)
Figure 2. D7504 Analysis of purified toluene. Very large components (99.97 %) and very small components
(18 ppm) were measured in a single run.
Table 1. Results for 10 D7504 analyses of mixed xylenes.
Run
Nonaromatics
wt %
Toluene
wt %
Ethylbenzene
wt %
p-Xylene
wt %
m-Xylene
wt %
Cumene
wt %
o-Xylene
wt %
C9+ Aromatics
wt %
1 0.1982 0.0101 16.84 21.05 46.43 0.0221 15.29 0.1667
2 0.1991 0.0100 16.83 21.05 46.43 0.0219 15.30 0.1662
3 0.1986 0.0100 16.84 21.05 46.43 0.0218 15.29 0.1646
4 0.1994 0.0100 16.83 21.05 46.43 0.0219 15.30 0.1595
5 0.1984 0.0100 16.83 21.04 46.43 0.0219 15.30 0.1623
6 0.1993 0.0101 16.84 21.04 46.43 0.0219 15.31 0.1651
7 0.2008 0.0100 16.83 21.04 46.43 0.0219 15.30 0.1632
8 0.1998 0.0101 16.84 21.04 46.43 0.0219 15.30 0.1566
9 0.2005 0.0100 16.83 21.04 46.43 0.0219 15.30 0.1624
10 0.2005 0.0100 16.83 21.04 46.43 0.0219 15.31 0.1633
Mean 0.1995 0.0100 16.83 21.04 46.43 0.0219 15.30 0.1630
StdDev 0.00092 0.00005 0.004 0.004 0.003 0.00007 0.006 0.00307
ASTM SD 0.00700 0.01400 0.007 0.029 0.021 0.00003 0.010 0.00100

www.agilent.com/intuvo
Information, descriptions and specifications in this
publication are subject to change without notice.
© Agilent Technologies, Inc. 2016
Published in USA, September 1, 2016
5991-7220EN
Conclusion
The chemical industry has recognized the need for simple, easy-to-use methods for
the routine GC analysis of monocyclic aromatics. A significant development towards
this goal was the development of ASTM method D7504, which uses ECN response to
eliminate the need for expert sample preparation and calibration. To support this drive
for easier GC methods, the Agilent Intuvo 9000 GC incorporates click-and-run column
installation technology so that operators with any level of experienced can quickly and
correctly change GC columns. Additionally, the auto-ranging FID makes implementing
ECN response methods easy and effective, providing analysis results with a high level
of precision.
Reference
1. ASTM D7504-15e1, Standard Test Method for Trace Impurities in Monocyclic
Aromatic Hydrocarbons by Gas Chromatography and Effective Carbon Number,
ASTM International, West Conshohocken, PA, 2015, www.astm.org
