
1
SMART
MOBILITY
ROADMAP
Austin, Texas
2017
AUSTIN’S APPROACH TO SHARED, ELECTRIC,
AND AUTONOMOUS VEHICLE TECHNOLOGIES
DRAFT FOR PUBLIC RELEASE
6
EXECUTIVE SUMMARY
Mobility in a community can be an economic driver or divider. It can facilitate commerce or create barriers to
accessing the full opportunities of the workforce. As Austin’s growth curve continues on a rapid trajectory,
nearly doubling the population in the city and the Austin region over the next two
decades, the mobility challenges of sprawl, congestion, lack of access, safety,
affordability and more – will likely double too.
With rapidly emerging and disruptive technologies for shared, electric,
and autonomous vehicles on the short-term horizon, Austin is at
an inflection point to learn how to direct and harness the new
technologies’ best attributes and reduce the risks of an uncertain
future. For example, the advent of autonomous or “self-driving”
vehicles on the horizon may help with some aspects, like safety
and convenience, but may negatively impact congestion levels if
consumers choose to ride alone.
THE CONVERGENCE OF SHARED USE, ELECTRIC AND
AUTONOMOUS VEHICLES
Shared, electric and autonomous vehicle technologies each offer their
own sets of benefits and challenges. Electric vehicles will decrease emissions
over existing gas-powered vehicles, while autonomous vehicles can increase safety
and provide mobility solutions for seniors, the disabled and people without driver’s
licenses. However, autonomous vehicles also have the strong potential to increase
single-occupancy vehicle use and significantly increase vehicle miles traveled on city
roadways.
Pairing electric motors with autonomous vehicles can bring these environmental, safety and accessibility
benefits together. The challenges lie in motivating consumer behavioral changes, when the financial and
convenience aspects of shared, electric and autonomous vehicles meet or exceed current technologies.
The biggest game changer for mobility, however, is in shared-use mobility which allows options to travel
without needing to own a vehicle. Shared-use mobility can reduce congestion, greenhouse gas emissions and
household transportation costs, even without the benefit of electric and autonomous vehicles, offering a more
immediate way to shape the future with affordable, accessible and equitable multimodal options.
The convergence of shared, electric and autonomous vehicle services can offer a lower cost, more
efficient and accessible, less polluting and less congested transportation system. Therefore, this plan will
seek to address the synergy to incorporate all three platforms – shared, electric and autonomous into a
comprehensive strategy.
FOCUS ON OUTCOMES
The Austin City Council and the Capital Metropolitan Transportation Authority (Capital Metro) Board of
Directors each requested their organizations create a roadmap for achieving smart mobility technologies
and services for the Austin region, with resolutions Resolution 20170302-39
1
, AI-2017-463, respectively. Each
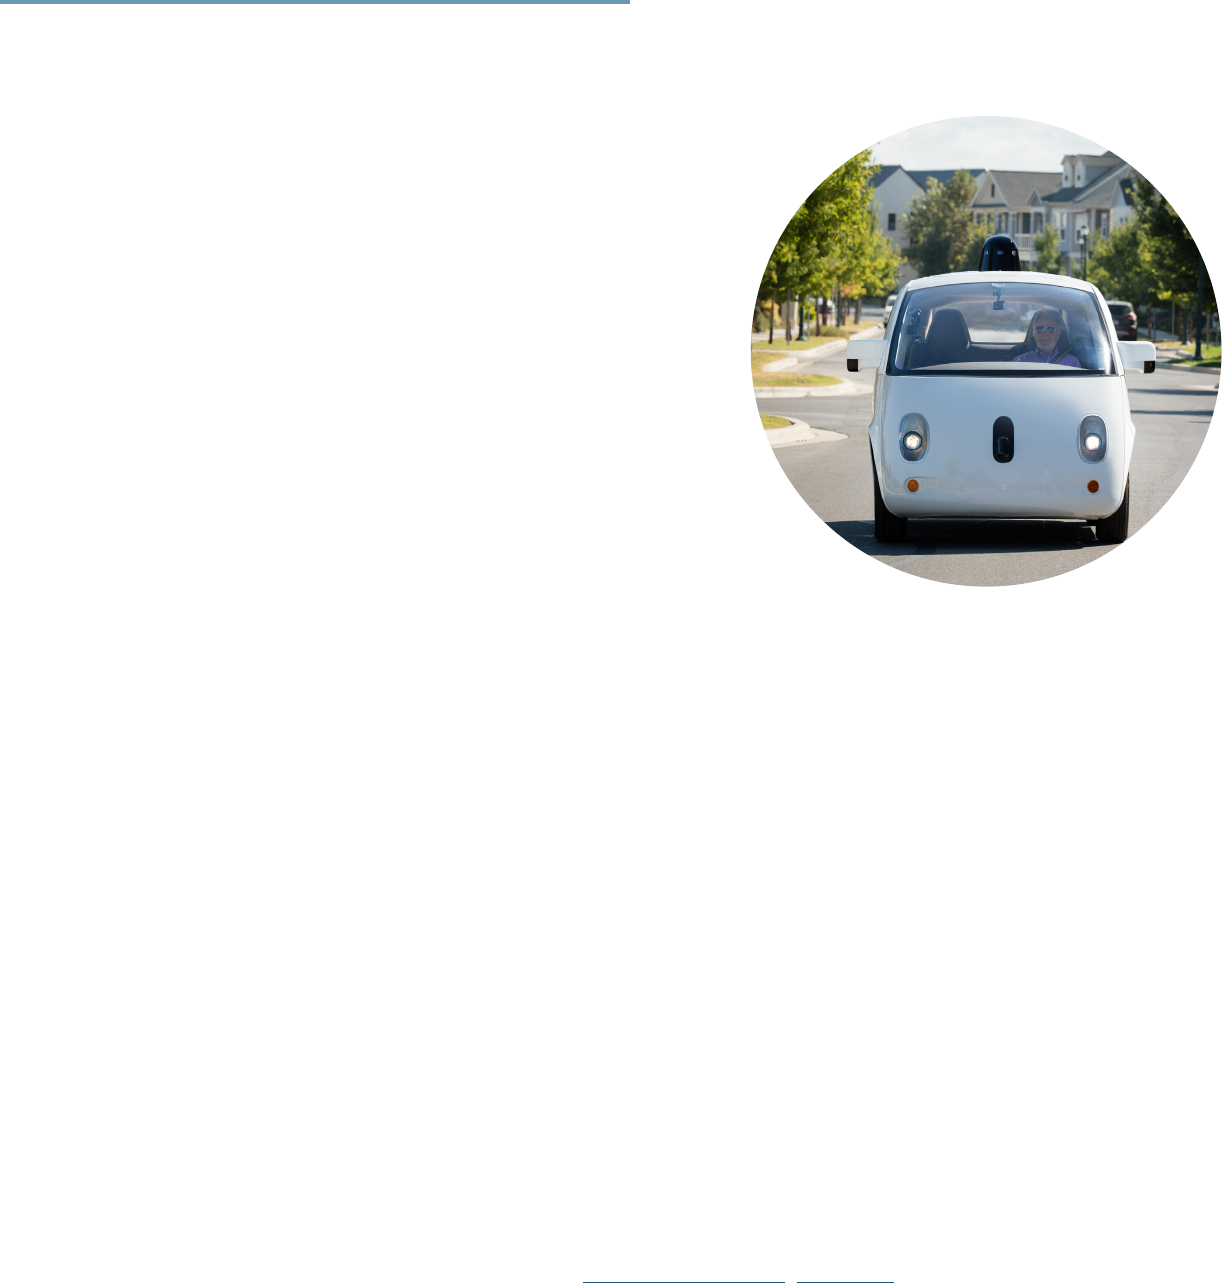
Above: A legally blind man
serves as a passenger in an
autonomous Google (now
Waymo) car in Austin’s Mueller
neighborhood in 2015.
I
m
a
g
e
u
s
e
d
w
i
t
h
p
e
r
m
i
s
s
i
o
n
o
f
W
a
y
m
o
7
I
m
a
g
e
u
s
e
d
w
i
t
h
p
e
r
m
i
s
s
i
o
n
o
f
W
a
y
m
o
organization focused on the outcomes the technologies can provide to their constituents – such as safety,
mobility, access, affordability and equity – versus the technologies alone. The City of Austin and Capital Metro
staff, supported by numerous agencies and institutions, prepared this joint initial roadmap, which will be
available for public comment before a final document will be proposed.
As a strategic roadmap, this document does not commit to specific budgets or metrics but serves as a vision
and communications document to capture a wide variety of viewpoints into Austin’s mobility future. This
roadmap will be incorporated into the larger Austin Strategic Mobility Plan to be finalized and approved at
a future date. Critical to the development of the broader Mobility Plan will be an extensive analysis of the
resource requirements for implementation of this shared, electric and autonomous vehicle (e-av) Roadmap.
Only with an understanding of those requirements can appropriate decisions about resource allocation, cost
and project prioritization be made. Interim projects may be pursued through public–private pilots with little
or no cost to the City or Capital Metro, or with specific authorization from City Council and Capital Metro for
early projects or studies.
As such, the vision described in Imagine Austin, the City’s comprehensive plan, was the starting point in
developing this roadmap:
“Austin is accessible. Our transportation network provides a wide variety of
options that are efficient, reliable, and cost-effective to serve the diverse
needs and capabilities of our citizens. Public and private sectors work
together to improve our air quality and reduce congestion in acollaborative
and creative manner.”
2
- Imagine Austin
This shared, electric and autonomous vehicle roadmap is the start of a community discussion about the
emerging mobility opportunities within the Austin region. That dialogue will be coordinated with the Austin
Strategic Mobility Plan, Capital Metro’s Project Connec, and will be shared with the Capital Area Metropolitan
Planning Organization (CAMPO) for broader regional context.
Pilots, policies and programs are called out that may jump-start this vision, while continued in-depth planning
and integration into the Austin Strategic Mobility Plan is needed to shape the opportunities ahead. The
roadmap will evolve as the technologies and policies that it discusses continue to develop and are analyzed
for their ability to support and accelerate our community’s preferred mobility outcomes.
Today, the City of Austin is already home to some of the most advanced autonomous mobility testing.
Google X chose Austin as its second city, after its home town of Mountainview, California to deploy its
autonomous vehicles. Continuing a proactive and deliberate approach to these new mobility capabilities will
ensure a future that is equitable, affordable, prosperous and data-driven.
The City of Austin and Capital Metro’s Smart Mobility Roadmap encompasses five key areas:
• Shared-Use Mobility
• Electric Vehicles and Infrastructure
• Autonomous Vehicles
• Data and Technology, and
• Land Use and Infrastructure
The first section of this roadmap will provide insight into each of these areas as well as the convergence of
technology. It also discusses national efforts related to shared, electric and autonomous mobility.
8
The second section looks at how this technology will affect Austin, through the lenses of equity,
affordability and safety. Economic impacts and workforce implications are also investigated, especially as
they relate to autonomous vehicles.
The final section encompasses the nuts and bolts of the roadmap, discussing the current Council and
Board resolutions and initiatives. It uses historical data from Austin and other cities on how executing a
plan like this relates to project and operational resources.
SHAREDUSE MOBILITY
Shared-Use Mobility encompasses transportation services that are
shared among users, including public transit; taxis and limos;
bikesharing; carsharing (round-trip, one-way and personal vehicle
sharing); ridesharing (car-pooling, van-pooling); ridesourcing/
ride-splitting; scooter sharing; shuttle services; neighborhood
jitneys; and commercial delivery vehicles providing flexible goods
movement.
3
It is the use of any combination of shared mobility
services, above, that have the effect of improving options to
travel without a vehicle.
Promoting shared-use practices now will have immediate benefits
of taking drivers off the road and reducing the congestion,
greenhouse gas emissions and household transportation costs,
even without the benefit of electric and autonomous vehicles,
offering a more immediate way to shape the future with affordable,
accessible and equitable multimodal options. Cultivating shared mobility
practices now is important to start the behavioral shift towards a shared, electric
autonomous vehicle future.
Shared-use vehicle technology is already here and is rapidly advancing. Using public
transportation service as the backbone of the transportation network, shared services
can provide first and last mile options; or multi-passenger “micro-transit” options operated in areas where
high-capacity transit is not feasible. The alternative, less desirable scenario—is one of individually owned
and operated electric autonomous vehicles.
ELECTRIC VEHICLES AND INFRASTRUCTURE
Currently in the Austin area there are approximately 4,000 EVs that represent approximately 22 percent
of the Texas EV market and a 55 percent annual EV growth rate over the last three years.
4
Global EV
projections vary widely with some of the more aggressive models predicting EVs overtaking internal
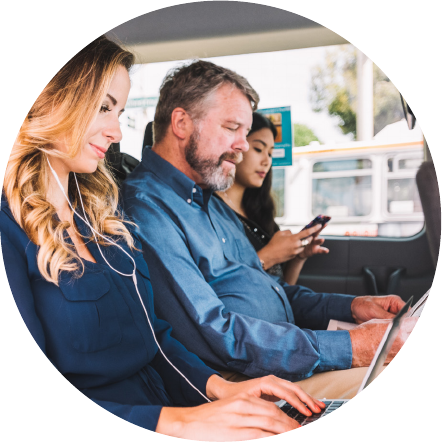
Image used with permission
of Chariot, a division of Ford
Smart Mobility.
“Shared-use mobility, from bike-sharing to ride-sourcing, car-sharing
and public transit is part of a ‘seismic shift’ in mobile technology and
changes in travel behavior, that is altering our transportation landscape.”
- Sharon Feigon, executive director of the Shared-Use Mobility Center, a national
clearinghouse for mobility research and policy development
9
combustion sales by as early as 2038. But regardless of source, each major model does predict a continued
growth curve in EV sales.
5
The rate of adoption is important because the increased deployment of electric
vehicles in lieu of internal combustion engine (ICE) technology is an important strategy to reduce emissions,
total cost of ownership and energy usage in the transportation sector.
But the pairing of electric motors and autonomous vehicles is not a given.
.6
In order for Austin to help
accelerate EV adoption on a wider consumer scale beyond fleets, incentives and innovative policies to
purchase and drive EVs will need to be complemented with increased electric charging infrastructure.
Infrastructure
Autonomous
Driving
Connectivity and
Internet of Things
Shared Moblity
Public Transit
Decentralization
of Energy System
Electrification
of Vehicles
6
6
8
4
4
1
1
5
5
3
3
2
2
7
7
8
1 2 3 4 5
Full Autonomy
(no human)
INDUSTRIAL PROCESS
Associated with manufacturing
METHANE PRODUCED BY LANDFILLS
Caused by the trash we generate
TRANSPORTATION
Such as cars, buses and trucks
In 2015, there were approximately
700,000 light-duty single occupancy
cars and trucks on the road in Travis County*
*City of Austin Office of Sustainability, Austin Community Climate Plan, June 10, 2015
40%
30%
20%
10%
0%
50%
City of Austin
Fully Autonomous
Source: Boston Consulting Group, "Revolution in the Driver's Seat:
The Road to Autonomous Vehicles," 2015.
Graphic recreated, with permission, from "Taming the Autonomous
Vehicle: A Primer for Cities,” March 2017, Bloomberg Philanthropies.
Graphic recreated, with permission, from "Austin Community Climate Plan Summary,”
January 2017, City of Austin Office of Sustainability."
Source: American Community Survey
Graphic recreated, with permission, from "Dashboard 2017: Key Economic Indicators for Greater
Austin and Travis County,” May 2017, Community Action Network.
Graphic recreated, with permission, from "Austin Community Climate Plan Summary,”
January 2017, City of Austin Office of Sustainability."
Graphic recreated, with permission, from "Taming the Autonomous Vehicle: A Primer for Cities,” March 2017, Bloomberg Philanthropies.
Recreated with permission from “Advanced Energy
Jobs in California.” 2016, AEE Institute
Graphic recreated with permission, from “New Mobility: Today’s Technology
and Policy Landscape,” July 2017, International Council on Clean Transportation.
Graphic recreated, with permission, from “Smart City Challenge,” U.S. Department of Transportation
Graphic recreated, with permission, from “Stick Shift: Autonomous Vehicles,
Driving Jobs, and the Future of work,” 2017, Center for Global Policy Solutions.
Graphic recreated, with permission, from “Shared Mobility Benefits Calculator,” Shared-Use Mobility Center.
*Per city staff evaluation. May be subject to change.
Graphic recreated, with permission, from “Future Autonomous Vehicle Driver Study,” September 2016, Kelley Blue Book.
Source: SAE J3016™
Graphic recreated, with permission, from "An integrated perspective on the future of mobility,”
October 2016, McKinsey & Company, www.mckinsey.com. Copyright (c) 2017 McKinsey & Company.
All rights reserved.
An uptake in shared mobility will accelerate electrification,
as higher utilization favours the economics of electric vehicles
Electric vehicle production at scale would accelerate
baery cost reductions, with multiple effects
Self-driving electric vehicles will have different usage and
hence different requirements for charging infrastructure
Increasing renewable power generation will make electric
vehicles more aractive as a means to reduce the carbon intensity
of the transport sector
Self-driving vehicles might accelerate the uptake of IoT applications
Self-driving could merge shared mobility business models
into a single proposition competitive with private car
ownership and public transport
Self-driving –private and shared –vehicles are likely to
increase mobility consumption in which case electric
vehicles offer lower total cost of ownership
An uptake in shared mobility will affect public transit
Graphic recreated, with permission, from "Taming the Autonomous Vehicle: A Primer for Cities,”
March 2017, Bloomberg Philanthropies.
Source: American Community Survey
Graphic recreated, with permission, from "2017 City of Portland
Electric Vehicle Strategy," December 2016, City of Portland
Bureau of Planning and Sustainability.
Source: A.T. Kearney
Graphic recreated, with permission, from "Taming the
Autonomous Vehicle: A Primer for Cities,” March 2017,
Bloomberg Philanthropies.
Graphic recreated, with permission, from, “Downton Austin
Parking Strategy,” June 2017, Downtown Austin Alliance.
On-demand mobility
Safety considerations
Improved air quality
Opportunities to shed
private vehicle
Mobility for seniors
The vehicle type fully addresses the stated goal
The vehicle type partially addresses the stated goal. The level at which
the goal is achieved depends on the specific situation or regulations involved.
The vehicle type either does not address the stated goal or more
information is needed
Mobility for persons
with disabilities
Partially Autonomous
Not Autonomous
Travis County Austin MSA
Owners Renters
Texas USA
ENERGY
Produced and used. Such as
electricity and natural gas.
Full Autonomy
(+ human)
Partial Autonomy
Adult Non-Drivers
Percent of New
Global Vehicle Sales
Additional Vehicle Miles Traveled (US)
Medically
Impaired Adults
Healthy
Elderly
Modern PlusModern VehicleHuman Only
194B 55B 46B
$51B
$83B
$189B
$95B
$298B
$260B
Uber, GM/Lyft, nuTonomy
4
4,000-6,000 lbs
4-6 passengers
25-35 mph
Pisburgh, San Francisco, Singapore
Autovot: AV taxi providing sequential private
rides Taxibot: AV taxi shared simultaneously
by several passengers
Automated minibus for carrying groups of people
over short distances, usually on pre-mapped routes
AV cart providing last-mile
light goods distribution
Single or platooned tractor-trailer
providing long-haul freight transport
Navya, Local Motors, Easymile,
Auro Robotics
4
6,000-8,000 lbs
10-12 passengers
25-35 mph
Lyons, Helsinki, Washington D.C.
Starship Technologies
6
40-55 lbs
0 passengers
4 mph
Talinn, London, Bern,
Redwood City, CA,
Washington D.C.
Oo (Volvo), Scania
18
33,000 lbs
44,000 lbs cargo
55 mph
Colorado, Roerdam, EU (various)
Advanced
Grid Technologies
Advanced Fuels
Advanced
Generation
Advanced
Transportation
Building
Energy Efficiency
SEATTLE – shared data would provide
dynamic routing for truck traffic, promote
off-peak and overnight deliveries, and enable
car share operators to deliver packages
LAS VEGAS – new connected autonomous
shules would transport workers to Las
Vegas Boulevard, and new solar powered
electric vehicle charging stations would help
reduce emissions
NEW ORLEANS – dynamically routed
on-demand minibuses would provide
affordable first mile/last mile transportation
options to underserved communities
ATLANTA – a network of
multimodal transportation
centers serving as hubs for
mobility, economic development,
and community activity
DETROIT – partnerships with industry leaders
in the automotive and technology fields and
academic institutions would help provide access
to electric car shares, automated shules, and
on-demand delivery trucks through integrated
mobility apps
BOSTON – “radically programmable” city
streets with dynamic markings that can
change from loading zones, to thoroughfares,
to spaces for street hockey, depending on
the time of day and season
VMT VMT
53%
36%
5%
6%
Currently, 13.7 Million Metric Tons of Greenhouse Gases
Are Emitted Community-Wide From:
Key Trends
Reinforcing Eects
Levels of Vehicle Autonomy
Who Will Travel More with AVs
2012 Work Commute Mode
Share for Multnomah County
2012 Work Commute Mode
Share for Austin/Travis County
2030 Target Commute Mode
Share for Multnomah County
AVs will potentially grow the total VMT by 14 percent,
totalling up to 295 billion additional VMT
Software Will Be a Big AV Business
Advanced Energy Employment by Segment, 2015
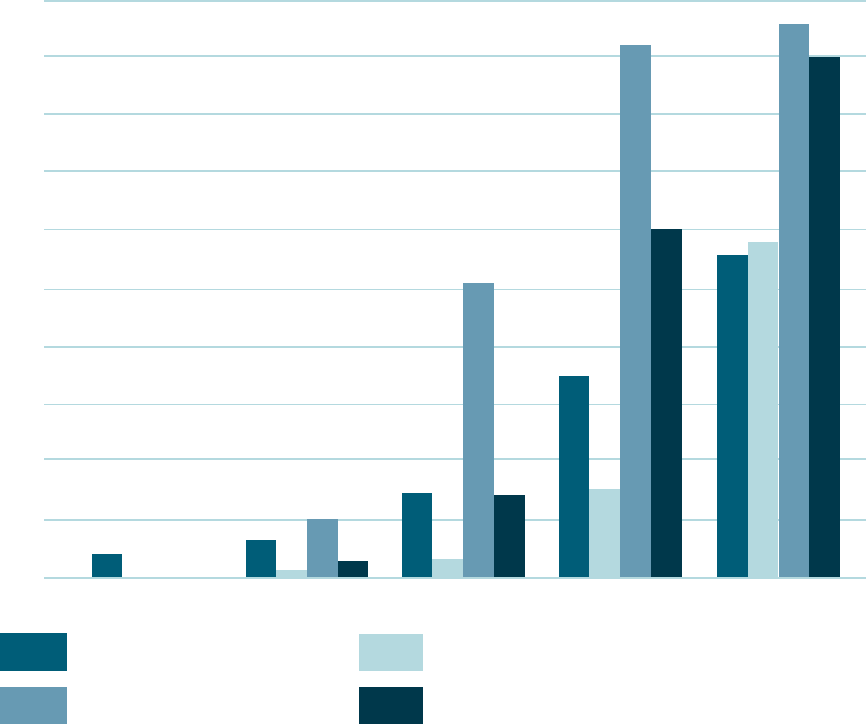
Projections of Electric, Semi-Autonomous, and Fully Autonomous Vehicle Sales
Number and Percent of Workers in Driving
Occupations by Occupation, 2010-2014
Austin-Area EV 3-Year Growth
Shared Mobility Benefits Calculator
Autovot/Taxibot Driverless Shuttle
Deliverybot
Software Train
TRANSPORT FREIGHTTRANSPORT PEOPLE
To Stay on Track with Net-Zero Goal, We Need to Reduce Emissions to:
Austin City Council has set the goal of reaching net-zero
community-wide greenhouse gas emissions by 2050.
Vehicles in Service, Worldwide (%)
Percent of Owner and Renter Households
that are Housing Cost-Burdened, 2015
Human Drivers Become the Minority
13.7 MILLION METRIC TONS
Our Current Footprint
11.3 MILLION METRIC TONS
8 MILLION METRIC TONS
4.6 MILLION METRIC TONS
TO DAY202020302040
2025
2035
$500B
$400B
$300B
200B
$100B
$600B
2020 2025 2030 2035
64%
$3.65 $1.20
36%
Fully autonomous vehicles
Private Parking
Majority is Off-Street
Transit Commuters
36,507
Carshare Vehicles
9,238
Shared Bikes
6,748
Rideshare/Carpoolers
Fewer miles traveled
by personal vehicles
Fewer metric tons of GHG emissions
related to personal vehicle ownership
Saved in prsonal vehicle
transportation costs
17,889
Average Hourly Rate
Demand for Parking Demand for Parking
Average Hourly Rate
Majority is On-Street
Public Parking
TOTAL
PARKING
SUPPLY
Apps, accessories & services
6
38 39 23
5836
VMT
295B
Drive alone
61%
Transit
25%
Bike
25%
Walk
10%
Work at
home
10%
Carpool
10%
Drive alone
20%
Carpool
9%
Walk
6%
Bike
5%
Transit
11%
Taxicab, motorcycle
or other means
1%
Taxicab,
motorcycle or
other means
1%
Bike
1%
Transit
3%
Work at
home
7%
Drive alone
74%
Carpool
10%
Work at
home
Walk
7%
2%
2030 Target Work Commute
Mode Share for Austin/Travis County
?
AUSTIN
PORTLAND
Figures may not add up to 100 percent due to rounding
Source: Carnegie Mellon University, Department of Civil and Environmental Engineering (2016).
24%
25%
24% 24%
21%
46% 46% 46%
47%
3500
3000
3000
2500
2000
1500
1000
500
0
4500
4000
2015
3972
4
6 8 10 12 42 6 8 10 12
2016
2017
Data provided quartlerly from EPRI for Travis and Williamson County.
Plug-in hybrid electric vehicle
Total Registrations
Baery electric vehicle
Cumulative Registrations by Type
Achievement of Resolution Goals*
Accessibility
Affordability for individuals
and community
Reduced congestion
Ability to evolve future technology
Residents without a driver’s
license access to a car
ELECTRIC
SHARED
AUTONOMOUS
63%
28%
4%
4%
1%
0
40%
30%
20%
10%
0%
50%
90%
80%
70%
60%
100%
2020 2025 2030
Electric vehicles (ICCT) Fully autonomous vehicles (IHS)
2035 2040
Level 3+ autonomy (McKinsey)
Fully autonomous vehicles (McKinsey)
BUS DRIVERS: 596,213
DELIVERY AND HEAVY
TRUCK DRIVERS: 3,187,046
TO REDUCE
PERSONAL
VEHICLES BY
20%
IN AUSTIN...
1,140,027,400
409,100
$401,912,300
TAXI DRIVERS
AND CHAUFFEURS: 338,366
77%
14%
8%
=
+
42 426 8 10 12
Projections of Electric, Semi-Autonomous
and Fully Autonomous Vehicle Sales
10
AUTONOMOUS VEHICLES
How quickly fully autonomous, or self-driving, vehicles are on our streets is widely debated amongst experts,
with predictions ranging from 15 to 50 percent of sales by 2030. There is consensus that fleet services will be
the first to use autonomous vehicles because of their ability to use the vehicle for longer periods to offset the
higher technology-rich vehicle price. Expect to see semi- and fully autonomous vehicle fleet services as early as
2025.
7
There will be numerous pilots, testing and controlled environment uses for AVs in the coming decade. Policies
and actions, such as dedicated lanes, data collection and analysis, and human-centered engineering approaches
will need to be considered so that semi- and fully automated cars can safely co-exist with human-driven
vehicles in the interim period of 10 plus years.
The University of Texas and other research organizations have begun framing the types and magnitude of
changes that will impact society due to the wide availability of AVs. From this research, various themes for
further analysis are worth noting, including
8
:
• Expanded mobility options for all,
• Opportunities for system capacity gains,
• Opportunities for data-driven development,
• Potential increase in vehicle miles traveled,
• A potential threat to the viability of traditional transit services, due to the affordability and
convenience that will likely accompany autonomous ridesourcing,
• A significant increase in roadway safety, with a corresponding reduction in crashes,
• An extended adoption period in which there will be mixed traffic (AVs and human-driven vehicles),
lasting decades, due to the disruptive nature of new technologies, and
• Significant economic and social changes
DATA AND TECHNOLOGY
To manage transportation for specific access, mobility, affordability, safety and emission outcomes, city and
regional partners need to rely on current, live, reliable data—the kind of data and analysis that we often lack
today. The data of tomorrow for shared, electric and autonomous vehicles will be even more sophisticated,
elaborate, voluminous and complicated.
Cities are starting to collect and manage data from a wide variety of sources including connected Dedicated
Short Range Communications (DSRC) infrastructure, bluetooth and smart phone data, along with a host of
new sensors that can measure air quality to road temperatures and conditions and more. Expansion of DSRC
or 5G technology could be the connective tissue that delivers smart mobility, linking shared/EV/AV vehicle
information to the infrastructure and to the cloud.
LAND USE AND INFRASTRUCTURE
From a land use perspective, autonomous vehicles have the potential to encourage individuals and households
to move further away from the city center under the assumption that long drive times can be used for
work or entertainment purposes. If those same vehicles were electric, it may reduce emissions, but not the
area’s congestion problem. To get ahead of this issue, the City of Austin will need the bold land use policies
prescribed in the City’s Imagine Austin comprehensive plan to be adopted into the CodeNEXT regulatory
document that will encourage densification and discourage single-occupancy commuting options.
11
To achieve the maximum benefit of the emerging technologies and outcomes such as mobility, affordability,
access and more, the City of Austin should pursue a collaborative process across disciplines, city, and regional
partner systems. The City also plans to engage the public as Austin moves forward with various pilots and
strategies to ensure that the community’s needs are met.
While the price of this technology may reduce costs for personal mobility, autonomous vehicles will have an
impact on city and agency budgets in significant ways. Examples of possible impacts and the opportunities to
explore new revenue sources are discussed later in this document.

12
Shared-Use Mobility Services
RECOMMENDED ACTIONS:
1. Engage citizens, businesses and visitors on
how this technology can meet their needs
and address community issues
2. Incentivize alternative means of
transportation
3. Provide on-demand service—accessed via
smartphone app or call
4. Seek regional recognition of registered
private mass transit vanpool/shuttle
operators to access regional toll lanes for
free
5. Expand bikeshare system(s); Launch shared
e-bike system
6. Launch an electric scooter shared system
7. Develop a report card that requires an
annual assessment of progress on action
items
8. Test various first/last mile solutions with
public and private transportation providers
9. Develop and promote a comprehensive
Shared-Use Mobility Plan
10. Create multi-modal mobility hubs adjacent
to transit stops to offer a variety of
first-and last-mile options
11. Encourage public and private operators to
accept pay-as-you-go cards
12. Pair regional park-and-ride lots with regular
and on-demand shuttle service to major
employment areas
13. Explore downtown transit “ride free” zone
or shuttle route to encourage driverless
commutes
14. Pursue regional integrated multi-modal
transportation and payment platform,
including cell phone app and integrated
payment method
RECOMMENDED ACTIONS:
1. Engage citizens, businesses and visitors on
how this technology can meet their needs
and address community issues
2. Hire an Executive level Officer of EV/AV
Transportation
3. Develop a Master Plan roadmap for emerging
electric – connected and autonomous vehicle
(E-CAV) technologies
4. Create an interdisciplinary AV Work Group
5. Create an infrastructure task force to
examine electric, technology and land use
infrastructure requirements
6. Test Dedicated Short Range Communication
(DSRC) technology for vehicle to
infrastructure (V2I) reciprocal safety
messages
7. Test 5G technology for vehicle to
infrastructure (V2I) reciprocal safety
messages; compare to DSRC
8. Increase public awareness of electric
autonomous (E-AV) shuttles in various Austin
locations through EV/AV pilots
9. Increase public awareness of last mile E-AV
delivery robots
10. Establish an EV/AV Commercialization
Opportunities/ Economic Development
Work Group
11. Create Shared/EV/AV focused team
12. Increase public awareness of electric and
autonomous vehicle benefits
13. Create a regional New Mobility Workforce
Training task force for new job training and
educational opportunities for those with
legacy occupations
RECOMMENDED ACTIONS:
1. Promote community dialogue, public engagement and education on data and mobility innovations
2. Invest in and leverage technology to improve mobility through open data; Support traffic “Data
Rodeo” collaboration
3. Promote public-private data partnerships for transportation information to optimize mobility
options; Support Austin CityUP and community data hack-a-thons
4. Create a data analysis contract and grow internal capability
5. Examine kiosk technology for multi-modal transportation information; Wi-Fi access
6. Create “One System” regional integrated approach to traffic operations
7. Equip City fleet with DSRC technology and/or other vehicle sensors
8. Develop a technology-driven universal way-finding system to optimize parking assets and manage
congestion
9. Reexamine curb and parking technology applications to actively manage use of curbs
10. Reexamine right of way technology applications to actively manage use of right of way
RECOMMENDED ACTIONS:
1. Engage citizens, businesses and visitors
on how this technology can meet their
needs and address community issues
2. Launch electric technology
demonstrations; (See the Shared Mobility
Recommendations section)
3. Adopt buy/lease "Electric First" or “Zero
Emission” policy for all City fleet vehicles
unless business case or technology
limitations preclude early adoption
4. Deploy shared-electric mobility and
charging infrastructure to include low
income neighborhoods
5. Increase public awareness of EV benefits
6. Deploy ‘smart’ public, private and fleet
charging infrastructure
7. Expand rapid charging station on-street
network; Examine free parking options
for EVs
8. Create electric vehicle-for-hire priority
access incentives for Austin-Bergstrom
International Airport (ABIA)
9. Conduct vehicle managed charge and
grid integration pilots
RECOMMENDED ACTIONS:
1. Engage citizens, businesses and visitors on
how this technology can meet their needs
and address community issues
2. Allow reduced or zero parking requirements
with TDM, on-site access to shared mobility
guarantees
3. Establish market-based performance
pricing for parking
4. Allow for shared parking between
businesses
5. Enhance compact and connected land use
along key urban transit/travel corridors and
transit oriented developments using E-AVs
6. Create policies to actively manage the curb
space on public streets
7. Unbundle parking costs from city building
leases and purchases
8. Encourage adaptable parking garages for
future re-use as residential buildings, office
spaces and retail spaces
9. Implement building codes to support
EV-ready and EV infrastructure
requirements
SHARED, ELECTRIC, AND AUTONOMOUS
ROADMAP RECOMMENDATIONS
Electric Vehicles
and Infrastructure
Autonomous Vehicles
Land Use and Infrastructure
Data and Technology
