
LEARNING SEQUENCE 3
TEACHER GUIDE
THE GLOBE PROGRAM
Storms on the Move
Heating Up
Air Movement in the Tropics
A Curveball
ENGAGE
EXPLORE
EXPLAIN
ELABORATE
TEACHER GUIDE

GLOBE Weather | LS3: Worldwide Weather
99
| TEACHER GUIDE
© 2019 University Corporation for Atmospheric Research. All Rights Reserved
Worldwide Weather
Why do storms move in predictable patterns
around the world?
The purpose of this learning sequence is for students to gure out why storms move the way they do,
on a global scale. While the weather can change day-to-day, the investigative phenomenon anchoring
this learning sequence is that prevailing winds at dierent latitudes move moisture in predictable pat-
terns. Students investigate how solar radiation leads to uneven heating of the atmosphere. Students
leverage existing Model Ideas from Learning Sequence 1 and new ideas about solar radiation to ex-
plain how this uneven heating causes convection on a global scale. They develop a model to explain
air movement in the tropics and test their models to see if they can explain precipitation movement
patterns near the equator. Students realize their current models only explain the north to south
movement of winds. They read and develop understandings about how the Coriolis eect causes
winds to curve, accounting for the east to west movement near the equator. Students can then pre-
dict the directions storms would travel in various locations around the world. This sequence shifts the
spatial scales and focus, as students move from examining what causes storms to form over several
days across a region to explaining why storms move in predictable patterns around the world.
Concentrated sunlight heats the Earth more at the equator than at the poles. This causes warm,
moist air to rise near the equator, creating areas of low pressure that lead to clouds and rainfall,
releasing water vapor and cooling the air. This air cools more as it is forced away from the equator,
sinks at 30˚N and 30˚S and is pulled toward the low pressure area at the equator to replace the ris-
ing air. This is convection on a global scale. The Earth’s rotation creates three areas of circulation in
each hemisphere. In the tropics, winds move across Earth’s surface toward the equator—prevailing
winds known as the trade winds. The Earth’s rotation causes prevailing winds to curve due to the
Coriolis eect. In the tropics, prevailing winds move from east to west. In the midlatitudes, they
move from west to east, leading to predictable patterns of storm movement around the world.

GLOBE Weather | LS3: Worldwide Weather
100
| TEACHER GUIDE
© 2019 University Corporation for Atmospheric Research. All Rights Reserved
Background Science Content
THE SUN’S ENERGY AND LATITUDE
The Sun’s energy heats the Earth’s surface unevenly. Latitudes at or near
the equator are warmer overall than places that are far from the equator
(towards the North and South Poles), which receive less sunlight per unit of
area. This is because the Sun is most directly overhead and most intense near
the equator and lower in the sky at higher latitudes where the same amount
of energy is spread out over a larger area. As you listen to student ideas
about why it is warmer near the equator, note that some students might
think that temperatures are warmer near the equator because those places
are “closer to Sun,” and temperatures are cooler in the midlatitudes because
those places are “farther from the equator and therefore farther from the
Sun.”
Additionally, locations far from the equator have strong seasonal dierences
in temperature, and locations at or near the equator have little or no
seasonal dierences in temperature (aside from that caused by storms or
other weather phenomena). This occurs because Earth’s axis is tilted, so a
location far from the equator receives more sunlight at times of year when its
hemisphere is tilted towards the Sun and less sunlight at times of year when
its hemisphere is tilted away from the Sun.
These variations with latitude are explored in Lesson 13, in which students interpret data that shows general dierences in
temperature between Earth’s poles and the equator.
GLOBAL ATMOSPHERIC CIRCULATION
While weather can change day-to-day, surface winds at dierent latitudes move in predictable ways. These surface winds are
part of a pattern of global atmospheric circulation, which is the result of the Sun heating the Earth more at
the equator than at the poles (because there are dierences in air temperature around the Earth,
the air circulates). In places where warm air is rising, air pressure is low. In places where cool
air is sinking, air pressure is high. The systematic rising of warm air and sinking of cool
air is called convection and describes the circulation of air in predictable patterns,
or circulation cells, around the Earth. There are three circulation cells in each
hemisphere: the Hadley cell, Ferrel cell, and polar cell as shown in the image.
The Hadley cells are located between the equator and 30° north and
south of the equator. At the equator, warm, moist air rises, creating
areas of low pressure that leads to clouds and rainfall, releasing water
vapor as air rises to the top of the troposphere (the tropopause). The
air, now cooler, is forced north and south of the equator, and it cools
even more. At 30° north and south of the equator, the cooler, drier
air sinks towards the ground creating high pressure. Some of the
sinking air travelsto higher latitudes,forming the Ferrel cell,and rises
at about 60° north and southlatitude. Some of that rising air moves
towards the poles then sinks as part of the polar cell.
High pressure areas are found at 30° north and south. These latitudes
have stable weather (warm/dry). Many deserts are located near 30° north
and south where high pressure areas are located. Low pressure areas are
located at the equator and at 50°-60° north and south and have unstable
weather (more clouds and precipitation). In the midlatitudes and at the equator,
there is more precipitation especially along the west coast of continents associated
with low pressure areas.
Equator
30 ºN
60 ºN
60 ºN
Low angle of incoming sunlight
Low angle of incoming sunlight
Sunlight directly overhead
Incoming sunlight at various latitudes
(Credit: SA Geography)
equator
North
Pole
South
Pole
L
L
L
H
H
H
H
Hadley cell
Hadley cell
Ferrel cell
polar cell
polar cell
Ferrel cell

GLOBE Weather | LS3: Worldwide Weather
101
| TEACHER GUIDE
© 2019 University Corporation for Atmospheric Research. All Rights Reserved
THE CORIOLIS EFFECT
Global atmospheric circulation is also aected by the spin of the Earth. The Earth spins from west to east on its axis. Because
the Earth is widest at the equator, it rotates faster at the equator than at the poles, and surface winds (or objects) are
deected, or turned, by the Coriolis eect.
The Coriolis eect is zero at the equator and then increases in magnitude towards the poles. The Coriolis eect is the apparent
acceleration of a moving body as a result of the Earth’s rotation (deecting the direction of the north-south air). If the Earth
didn’t spin, there would be just one large convection cell between the equator and poles. The deecting winds split the one cell
into three convection cells.
• The NOAA SciJinks website (https://scijinks.gov/coriolis/) provides an explanation about the Coriolis eect that may
be helpful for students.
The Coriolis eect greatly impacts the prevailing wind direction on a global scale (see image below).
The prevailing winds at the Earth’s surface, caused by convection, are deected by Earth’s rotation, causing them to curve to
the right in the Northern Hemisphere and to the left in the Southern Hemisphere. The (surface) trade winds in the tropics are
associated with the Hadley cells and move towards the equator, southwest in the Northern Hemisphere and northwest in the
Southern Hemisphere. In the midlatitudes, where the Ferrel cells are located, warmer surface air moving poleward is deected
east by the Coriolis eect, which leads to prevailing westerly surface winds (west to east) in both hemispheres. At the higher
latitudes, where the polar cells are located, the prevailing surface winds are easterly (east to west) in both hemispheres.
In addition, on a smaller scale, air moving toward an area of low pressure and away from high pressure is also inuenced by
the Coriolis eect. Air moves counterclockwise around low pressure in the Northern Hemisphere and clockwise around low
pressure in the Southern Hemisphere. This is why storms in the Northern Hemisphere rotate counterclockwise, while storms
in the Southern Hemisphere rotate clockwise.
60° N
30° N
30° S
60° S
0°
Intertropical
convergence
zone
Polar cell
Mid-latitude cell
Hadley cell
Hadley cell
Mid-latitude cell
Polar cell
Westerlies
HIGH
HIGH
Northeasterly Trades
Southeasterly Trades
Westerlies
Credit: Kaidor
creativecommons.org/licenses/by-sa/3.0
GLOBE Weather | LS3: Worldwide Weather
102
| TEACHER GUIDE
© 2019 University Corporation for Atmospheric Research. All Rights Reserved
It is warmer at the equator be-
cause it is closer to the Sun.
While it is true that the Earth “bulges” at the equator, there is no signi-
cant dierence in the distance to the Sun, whether measuring from the
equator or from the poles. The reasoning for warmer temperatures at
the equator is because of the angle of the Sun; at the equator the Sun
is directly overhead, providing more heat, while areas further from the
equator receive less direct sunlight and thus less heat.
For more information, visit:
https://serc.carleton.edu/sp/library/guided_discovery/examples/sea-
sons.html
Summer occurs when the Earth
is closest to the Sun and winter
when the Earth is farthest from
the Sun.
Similar to the reasoning in the misconception above, it is not the dis-
tance between the Sun and the Earth that causes the extreme changes
in latitudinal and seasonal temperatures (In fact, the Earth is closest
to the Sun in January, which is winter for the Northern Hemisphere,
and farthest from the Sun in July, when the Northern Hemisphere is
experiencing summer). The reason for the seasons is the 23.5° tilt of
the Earth on its axis, which means that each hemisphere experiences
warm seasons when it is pointed more directly at the Sun and cold
seasons when it is pointed away from the Sun.
For more information, visit:
https://spaceplace.nasa.gov/seasons/en/
Heat from the Earth’s core is
responsible for heat at the Earth’s
surface.
While it is true that the Earth’s core and mantle are extremely hot
(the source of this heat is the decaying of radioactive elements within
the Earth as well as residual heat from when the Earth formed), as
students discovered in Learning Sequence 1, Earth’s surface tempera-
ture is a result of incoming radiation from the Sun. The amount of heat
energy owing to the surface from the Earth’s interior is only about
1/10,000
th
of the amount of energy ow from the Sun to the Earth’s
surface.
For more information, visit:
https://www.skepticalscience.com/heatow.html
COMMON MISCONCEPTIONS:
The following science misconceptions were identied by GLOBE Weather eld test teachers. Watch out for them as your
students are learning about weather.
MISCONCEPTION CORRECT EXPLANATION

103
| TEACHER GUIDE
GLOBE Weather | LS3: Worldwide Weather
© 2019 University Corporation for Atmospheric Research. All Rights Reserved
STORMS ON THE MOVE
How do storms move around the world?
AT A GLANCE
ACTIVITY DESCRIPTION MATERIALS
(50 minutes)
Global Precipitation Patterns
Students watch a video and record observations of precip-
itation movement patterns rst in North America and then
globally. They share observed patterns and generate ques-
tions in small groups, followed by a whole class discussion.
Students add new questions to the Driving Question Board.
Lesson 12: Student Activity Sheet
North America storm movement time-lapse
video
NASA rainfall and snowfall video
Whiteboard, smart board, or chart paper
and markers (to make the Driving Question
Board)
Develop Initial Explanations
Students develop initial ideas to explain these patterns in
global precipitation movement, drawing on prior experi-
ence and Model Ideas from Learning Sequences 1 and 2.
GLOBE Weather | LS3: Worldwide Weather
104
| TEACHER GUIDE
© 2019 University Corporation for Atmospheric Research. All Rights Reserved
NGSS Sensemaking
Students observe patterns of storm movement across North America and around the world
to identify the phenomenon anchoring Learning Sequence 3: there are predictable patterns of
precipitation movement around the world, and patterns are dierent in the tropics and midlatitudes.
Students generate questions about what is causing these patterns. Students develop initial
explanations, drawing on their understanding about how temperature and pressure cause water
vapor movement from Learning Sequences 1 and 2.
PERFORMANCE OUTCOME
• Make observations to describe the large-scale motion of water in the atmosphere.
• Describe patterns of how water moves through the atmosphere around the world.
NGSS DIMENSIONS (GRADES 6-8)
• Ask questions that arise from careful observation of phenomena to seek additional
information.
• Develop a model to describe unobservable mechanisms.
• Apply scientic ideas to construct an explanation for real-world phenomena.
• Images can be used to identify patterns in data.
• The complex patterns of the changes and the movement of water in the atmosphere are
major determinants of local weather patterns.
STORMS ON THE MOVE
How do storms move around the world?
105
| TEACHER GUIDE
GLOBE Weather | LS3: Worldwide Weather
© 2019 University Corporation for Atmospheric Research. All Rights Reserved
Teacher Procedures
Global Precipitation Patterns
1. Navigate from the previous lesson. At the end of the previous lesson, students followed one
storm moving across the United States. Help the class think about how that is a very long way
for moisture to travel.
Pose the questions:
• Where do you think the storm was a day before? Where was it two days before?
• Where do you think the moisture for that storm came from?
Tell students that in this activity they are going to investigate the global pattern of storm move-
ment.
Note: Prior experience with world maps and the global view of Earth will allow the remaining
activities to go more smoothly. Introduce world maps, a globe, and/or Google Earth if needed.
2. Observe storm movement patterns across North America. Tell students that one way to
identify regular patterns in storm movement is to look at weather patterns from a satellite
point of view from above instead of from locations on the ground. Introduce students to
the North America Storm Movement video context (see below). Tell students they will make
observations from the video:
• While students watch the video for the rst time, have them make observations without
taking notes. Point out a cold front over the central U.S. to connect with what students
learned in Learning Sequence 2.
• Watch the video a second time, and now have students take notes and draw the path
of the storms on their student activity sheets (Lesson 12: Step 1). Focus students on
monitoring the direction that storms travel.
STORMS ON THE MOVE: How do storms move around the world?
Storyline Link
Continuing a discussion
of storm movement is a
critical link to maintain
coherence as students
move from Learning
Sequence 2 to Learning
Sequence 3.
Patterns in Data
Students identify patterns
in storm movement across
North America.
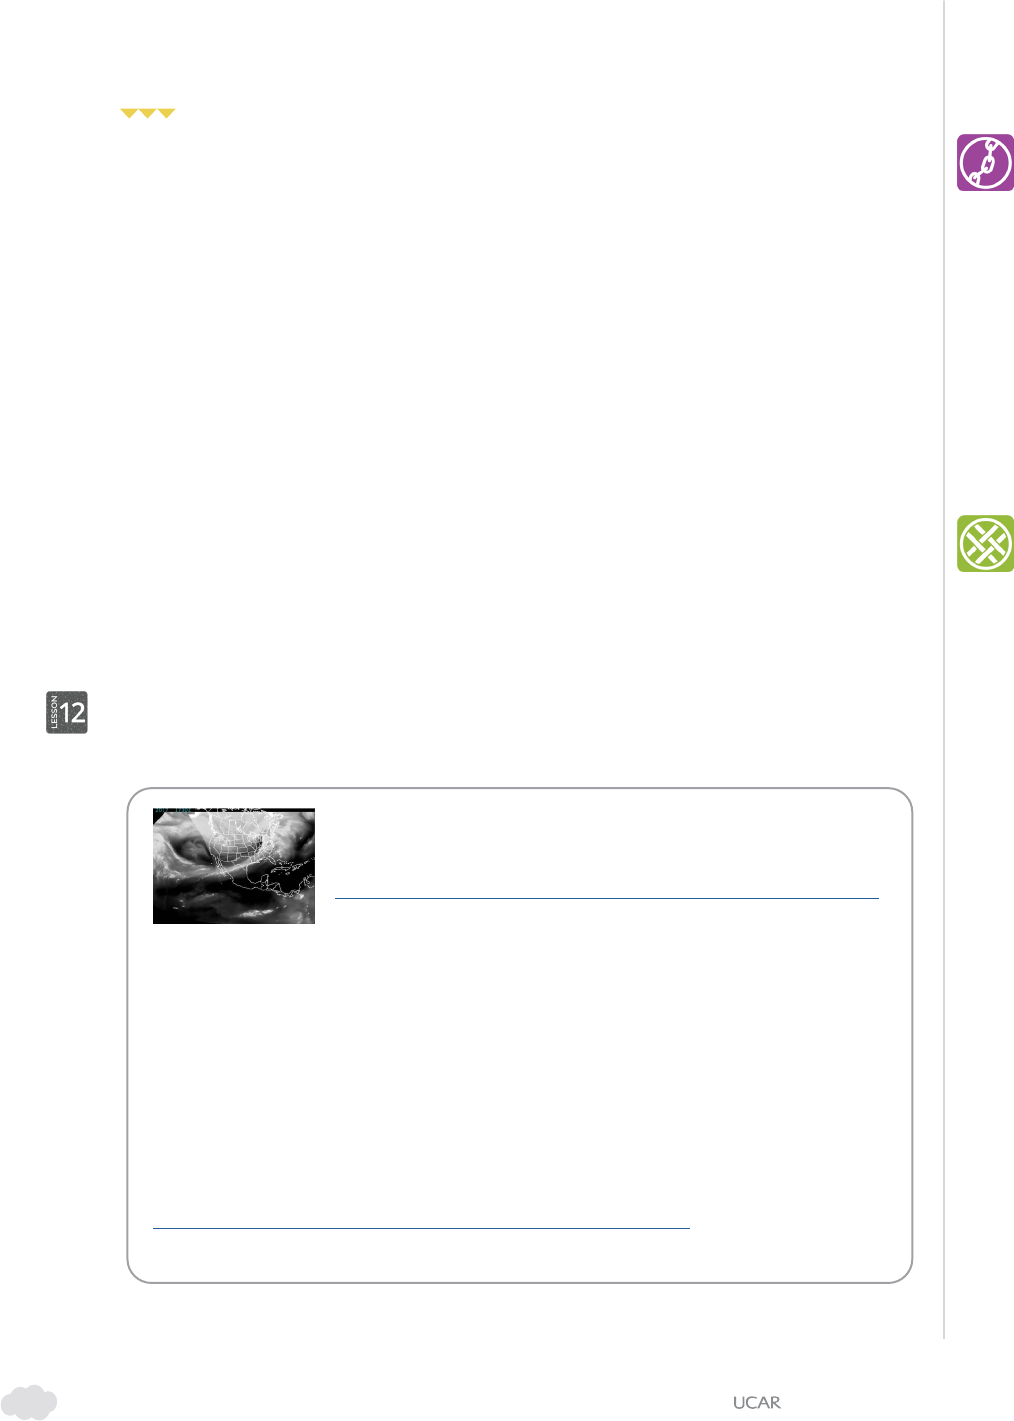
NORTH AMERICA STORM MOVEMENT TIME-LAPSE VIDEO
Time-lapse video of storm movement across North America from
March to April 2017
https://www.youtube.com/watch?v=jC3H2k8lONU&feature=youtu.be
In this video, the white areas are places with more water vapor (moisture) in the air, which
indicates where precipitation is happening. The date appears in the upper left. Students are
seeing the curvature of Earth in this video because the satellite is so far away, so due east is
in the upper right and due west is in the upper left.
Two cold fronts pass though this video:
• The best option is March 6–8
• A second option is March 29–31
If students would like to see if the same pattern is visible at another time of year, have them
watch the time-lapse video from January to February:
https://www.youtube.com/watch?v=ntC070Sh9t0&feature=youtu.be
STEP 1
106
| TEACHER GUIDE
GLOBE Weather | LS3: Worldwide Weather
© 2019 University Corporation for Atmospheric Research. All Rights Reserved
Storyline Link
The patterns in the NASA
global rainfall and snowfall
video are the phenomena
anchoring Learning
Sequence 3. Students will
return to these patterns
several times.
STORMS ON THE MOVE: How do storms move around the world?
3. Discuss observations as a class. Draw out ideas around the west to east pattern across North
America. Patterns students might notice are as follows:
• Air with water vapor in it generally travels west to east across North America.
• Air with water vapor in it travels in squiggly, curling, and/or spinning lines.
• Certain areas have repeated patterns in cloud cover (e.g., the West Coast gets a lot
of water vapor from the Pacic Ocean, and some areas, like Mexico, have a “pulsing
pattern” in water vapor).
4. Have students think about why it’s important to understand why storms move
in predictable patterns. In Lesson 12: Step 2, have students record ideas about why
understanding storm movement patterns might be helpful to people and their communities.
Have students share some of these ideas.
5. Consider how air moves around the world. Ask students if they think there are similar
patterns in other parts of the world and prepare them to look for that in the next video.
6. Observe precipitation movement patterns around the world. Introduce students to the
NASA rainfall and snowfall video context (see below). Tell students they will make observations
from the video. Play the video and mute the sound.
• The rst time students watch the video, have them make visual observations without
taking notes. Discuss their initial observations of storm movement patterns across North
America.
• Watch the video a second time, now taking notes and drawing on the map in Lesson 12:
Step 3. You may want to show the video multiple times or pause the video to allow for
note taking.
SUGGESTED PROMPTS SAMPLE STUDENT RESPONSES
How could understanding patterns of
storm movement be helpful to people
and communities?
For people, it’s helpful to prepare for rain (e.g.,
like knowing what to wear).
For communities, it’s helpful to know when an
event is going to happen (e.g., so that people
can prepare and stay safe).
Patterns in Data
Students identify patterns
in storm movement
globally.
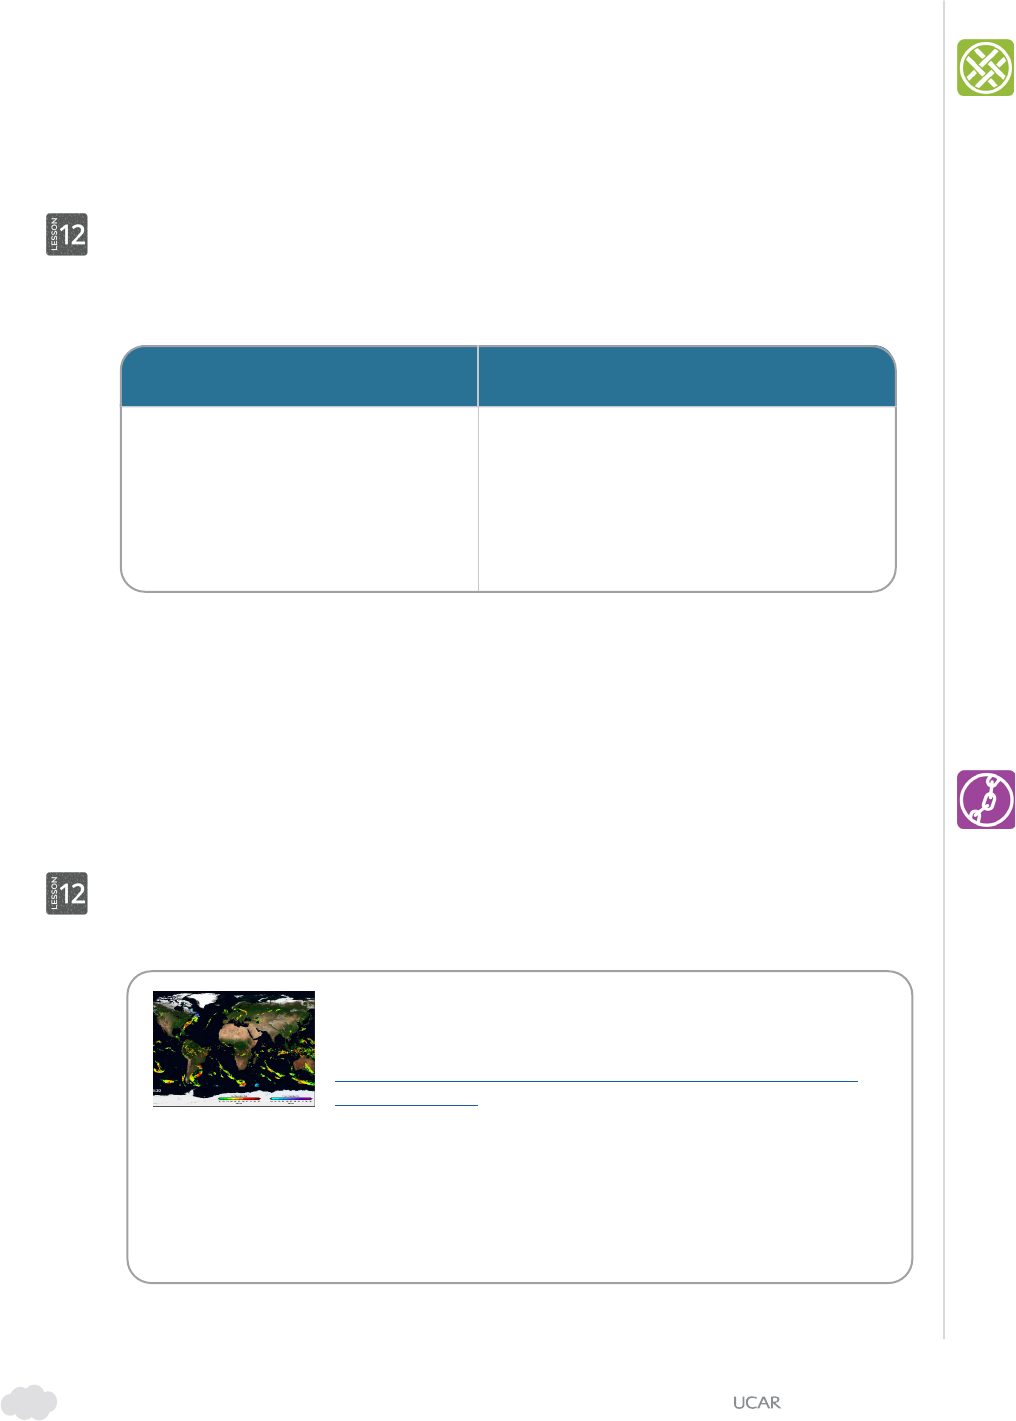
NASA GLOBAL RAINFALL AND SNOWFALL VIDEO
Satellite measurements of global precipitation from April to
September 2014.
https://pmm.nasa.gov/education/videos/gpms-rst-global-rainfall-
and-snowfall-map
This two-minute video shows how precipitation moves globally from April to September
2014, with data collected just below the clouds. The green-yellow-red colors indicate rainfall
and the blue-purple colors indicate snowfall, which students may not notice in the video. The
voiceover explains how the data was collected and some patterns students might notice,
so we suggest muting. The video provides a global view and zooms in on the United States
(0:25), South America (0:50), and the Atlantic Ocean (1:25).
STEP 3
STEP 2

107
| TEACHER GUIDE
GLOBE Weather | LS3: Worldwide Weather
© 2019 University Corporation for Atmospheric Research. All Rights Reserved
7. Share observations and generate questions in small groups. Have students discuss their
observations and generate questions about those observations in small groups or pairs.
Question prompts for discussion are in Lesson 12: Step 4.
• What patterns do you notice about how precipitation moves around the world?
• What questions do you have about those patterns?
8. Conduct a whole class discussion. Discuss the guiding question: “How does precipitation move
around the world in predictable patterns?” Draw out students’ ideas working toward the following
key patterns:
KEY PATTERN: Precipitation near the equator moves from east to west.
KEY PATTERN: Precipitation in the midlatitudes moves from west to east.
9. Generate questions to investigate in Learning Sequence 3. Have students share their
questions about the observed patterns. Add these questions to the Driving Question Board
to reference throughout the learning sequence. Focus students on causal questions and elicit
responses to the following key questions:
• Why do storms move in predictable patterns around the world?
• Why do storms in the tropics move in dierent directions than the midlatitudes?
• Why do storms move from east to west near the equator in the Northern Hemisphere?
• Why do storms move from west to east in the midlatitudes in the Northern Hemisphere?
Develop Initial Explanations
1. Navigate from the previous lesson. Tell students that they’ll try to answer the following
questions in Learning Sequence 3:
• Why do storms move in predictable patterns around the world?
• Why do storms move in dierent directions in the tropics and midlatitudes?
2. Form initial ideas about causes of precipitation movement patterns, based on what we
already know. Have students answer the questions in Lesson 12: Step 5 of their student activity
sheets to begin to explain what could be causing the patterns of storm movement. Pull out the
Model Idea Tracker and encourage them to use what they learned from Learning Sequences 1
and 2. As students work, circulate and prompt students who are stuck:
• What do you already know about what causes rain?
• What do you already know about what causes air to move?
• What would cause storms to move?
• How could the same processes aect the whole world?
Model Ideas that might help students:
• Hot air rises as part of convection (Learning Sequence 1).
• Cool air sinks as part of convection (Learning Sequence 1).
• Air moves from areas of high to low pressure (Learning Sequence 2).
STORMS ON THE MOVE: How do storms move around the world?
STEP 4
STEP 5
Storyline Link
These questions set the
stage for what students
will investigate in Learning
Sequence 3.
Storyline Link
These questions guide
student investigations in
Learning Sequence 3.
Cause-Effect
Students start thinking
about what could be
causing precipitation
movement patterns.
Asking Questions
Students generate
questions based on
observed patterns of
worldwide precipitation
movement.

108
| TEACHER GUIDE
GLOBE Weather | LS3: Worldwide Weather
© 2019 University Corporation for Atmospheric Research. All Rights Reserved
3. Facilitate a whole class discussion about students’ initial explanations. Have students
share their initial explanations (answers to Lesson 12: Step 5: Question 3). Consider recording
multiple and conicting student ideas in a public place to be revised later (e.g., chart paper,
PowerPoint, smart board). If students have conicting ideas, pull out the important Model Ideas
they are drawing on.
4. Look forward to the next lesson. Allow multiple explanations to linger. Tell students
that there are a few things to investigate. In the next lesson, they’ll start by investigating
temperature:
• How might temperature cause air to move on a global scale?
STORMS ON THE MOVE: How do storms move around the world?
Developing Explanations
Students develop initial
explanations for the
observed patterns.

GLOBE Weather | LS3: Worldwide Weather
109
| TEACHER GUIDE
© 2019 University Corporation for Atmospheric Research. All Rights Reserved
AT A GLANCE
HEATING UP
Why is it hotter at the equator than other places on Earth?
ACTIVITY DESCRIPTION MATERIALS
(90 minutes)
Latitudinal Patterns of Temperature
Have students revisit the patterns of moving air (Lesson 12)
and think about how heat may be involved. Students explore
patterns in average annual temperatures worldwide and no-
tice that heat is concentrated at the equator. This leads to the
question: Why is it hotter at the equator than other locations
around the world?
Lesson 13: Student Activity Sheet
Global map of average annual temperatures
scied.ucar.edu/sites/default/les/images/ba-
sic-page/annual_mean_temperature_graph-
ic_ls3.jpg
Energy Angles
Students investigate dierent angles of light to think about
how the surface of Earth is curved, causing incoming solar
radiation to hit more directly at the equator and spread out
toward the poles.
Inatable globe
Clipboard
Flashlight
Ruler
Graph paper
Colored pencils
Temperature Data Investigation
Using GLOBE temperature data for ve locations at dierent
latitudes, students use what they have learned about uneven
heating at dierent latitudes to explain the patterns in the
ve locations.
GLOBE Temperature and Latitude Data card
sets (see pages 128-132 of this Learning
Sequence)
Model Idea Tracker
Students revisit their Model Ideas about uneven heating pat-
terns on Earth and revisit the lesson question: “Why does air
move in dierent ways around Earth?” They think about how
uneven heating might help them answer part of this question.
Whiteboard, smart board, or chart paper and
markers (to make the Model Idea Tracker)
GLOBE Weather | LS3: Worldwide Weather
110
| TEACHER GUIDE
© 2019 University Corporation for Atmospheric Research. All Rights Reserved
NGSS Sensemaking
Students identify patterns in average annual temperatures worldwide and gure out the equatorial
region is much warmer consistently throughout the year and the midlatitudes have, on average,
generally cooler temperatures (although there is seasonal variation). Students then conduct an
investigation using a model to explore the causal mechanisms for these temperature dierences by
latitude and gure out that they are caused by uneven heating of a spherical earth. Students apply
this new understanding to explain patterns in temperature in ve cities around the world. They will
also use this knowledge to help explain global convection in Lesson 14.
PERFORMANCE OUTCOME
• Analyze a model to describe latitudinal variations in the concentration of sunlight and to
explain variations in temperature.
• Analyze data to describe global patterns in average annual temperatures.
NGSS DIMENSIONS (GRADES 6-8)
• Use a model to generate data to test ideas about phenomena in natural systems, including
those at unobservable scales.
• Analyze and interpret graphical displays of data to identify relationships.
• Construct an explanation using models or representations.
• Construct a scientic explanation based on valid and reliable evidence obtained from
students’ own experiments.
• Graphs, charts, and images can be used to identify patterns in data.
• Weather and climate are inuenced by interactions involving sunlight. These interactions
vary with latitude.
HEATING UP
Why is it hotter at the equator than other places on Earth?
111
| TEACHER GUIDE
GLOBE Weather | LS3: Worldwide Weather
© 2019 University Corporation for Atmospheric Research. All Rights Reserved
Teacher Procedures
Latitudinal Patterns of Temperature
1. Navigate from the previous lesson. At the end of the previous lesson, students discussed
what they noticed about the movement of weather in North America and globally. Remind
students that they have been thinking about how heating can cause air to move and that
heating can also cause pressure dierences.
The question they are trying to answer now is:
• How might temperature cause air to move in dierent ways on a global scale?
2. Ask students: “What are some ideas we have about how temperature aects air
movement?” Encourage students to use models and rules of thumb from Learning Sequences
1 and 2 as well as prior knowledge that might help them explain why air would move. Track
student thinking on the board. Students will likely say something about hot or cold air (based
on what they learned in Learning Sequence 1). Use this idea to link to the next step.
3. Show students a global map of average annual temperatures (Lesson 13: Step 1). Ask
students to study the map and write down patterns they notice. Then, as a whole class, ask
students to share the temperature patterns they noticed. Most students will notice that it is
much warmer at the equator than the poles, and there is a gradient between. They may also
point out the parallel pattern between the northern and southern hemispheres.
• KEY PATTERN: Temperatures are warmer at the equator and cooler at the poles.
• KEY PATTERN: Temperature follows a pattern of warmer bands in the middle (and
around the equator) and cooler bands toward the poles.
4. Ask students: “Why is it hotter at the equator than other places on Earth?” Give students
time to think about this and write down some initial ideas below the map in Lesson 13: Step
1 of their activity sheets. Ask students to share their thinking with the class. (Note: Students
might say, “The equator is hotter because it’s closer to the Sun.” This is a common student
misconception, which should be cleared up by the Energy Angles activity below. If students
have this misconception, make sure to address it directly after the Energy Angles activity.)
Tell students that in the next activity, they will use a model to explore why it’s hottest at the
equator.
Energy Angles
1.
Set up the Energy Angles activity. Tell students: “We are going to use a ashlight, clipboard,
and graph paper to study what happens when sunlight strikes Earth’s surface.” Prior to starting,
ask students to explain what the following parts of the set-up represent:
• What does the ashlight represent? [Sunlight]
• What does the clipboard represent? [The Earth’s surface]
STEP 1
Storyline Link
Revisit the question posed
at the end of Lesson 12 to
remind students of the
focus of this lesson.
Developing & Using
Models
Students use a model to
think about how the Sun’s
incoming energy affects
temperatures on Earth.
Patterns in Data
Students identify patterns
in annual average global
temperatures.
Going Deeper
Try this additional
activity to help students
understand the relative
size of Earth and the Sun
and the distance between
them:
sunearthday.nasa.
gov/2007
/materials/solar_pizza.pdf
HEATING UP: Why is it hotter at the equator than other places on Earth?

112
| TEACHER GUIDE
GLOBE Weather | LS3: Worldwide Weather
© 2019 University Corporation for Atmospheric Research. All Rights Reserved
Data Analysis &
Interpretation
Students analyze and
interpret data from their
graph paper to think about
where solar radiation is
more concentrated and
more spread out on Earth.
Going Deeper
To collect more data, you
can tilt a small photovoltaic
cell that is connected to a
small motor or voltmeter.
Have students measure the
amount of tilt and record
the amount of energy.
2. Give students about 10 minutes to complete the activity. Use Lesson 13: Step 2 in the
student activity sheet.
HEATING UP: Why is it hotter at the equator than other places on Earth?
STEP 2
NOTES:
• This activity works best in groups of three: one student to hold the clipboard (the
surface of the Earth), one student to hold the ashlight and ruler (the Sun), and one
student to trace where the light falls on the graph paper (the recorder).
• If possible, darken your classroom or move to a room without windows.
• Students will shine their ashlights down on the paper from straight above while
the clipboard is lying at on the table and
again when the clipboard is tilted at an
angle (with one edge resting on the table).
When creating the angled set-up, tilt the
clipboard to about 45˚ or more.
• Both times the recorder will outline the
area that the ashlight lights up. Consider
having students use dierent colors and
overlap the images (e.g., shine the light in
approximately the same spot both times) to
accentuate the dierences.
• The distance between the ashlight and
the paper will vary depending on how
bright your ashlight is. Students will want
to choose a distance that allows the entire image
to t on the paper with ample space around the
borders. The investigation works best when the
ashlight is fairly close to the paper, at a distance
of less than 5 cm.
• It is important that the distance between the
ashlight and the clipboard stay the same the
whole time, but also equally important that the
ashlight remain pointing straight down towards
the table, even when the clipboard is titled at an
angle. If it helps, point out to students that the
Sun is not changing position, but rather we are
changing where we are on the Earth; when the
Earth’s surface is at we are at the equator, and
when the Earth’s surface is tilted we have moved
far from the equator. Use a globe to point out
hypothetical locations on the Earth where we
might be “standing.”
**To do this activity as a demonstration instead, shine a flashlight straight above
onto the ceiling of a darkened room and then angled at the ceiling.**
STRAIGHT ON
TILTED

113
| TEACHER GUIDE
GLOBE Weather | LS3: Worldwide Weather
© 2019 University Corporation for Atmospheric Research. All Rights Reserved
3. Make sense of the data. As a whole class, ask students to share their ndings from the
investigation. Ask students: “When did the light cover more of the paper, straight on or tilted?”
Consider asking if any of the groups counted the number of squares illuminated, and if so,
which way lighted more squares. Students will notice that there were more squares lit when
the clipboard was tilted.
Use the following questions to guide a discussion to make sense of what this means:
• Was there any dierence in the amount of light coming from the ashlight? Did it change or
stay the same?” [The amount did not change.]
• So what happened when you tilted the clipboard? [The area got bigger; the light spread
out.]
• If you were standing in one of the squares on the clipboard, within which one do you think
you would feel the most heat? Why? [Help students realize that it would be hotter in the
circle where the heat is more concentrated and cooler in the circle where the heat is
more spread out.]
Now, let’s think about what this means for Earth. Demonstrate shining the ashlight
directly at the equator of the inatable globe, holding the ashlight horizontally. Then, keeping
the ashlight horizontal, shine the light toward the poles. If students need support relating
their clipboard model to the Earth, have a student hold their clipboard at the equator (so that
it is vertical) and then at a high latitude location (so that it’s at an angle). Have them make
connections between where the light is more concentrated (the smaller circle on the graph
paper) and where the light is more spread out. (Alternatively, project the “What does this mean
for Earth’s surface?” slide with the image of the Earth instead of using the physical model.)
4. Have students apply these ideas to diagrams of what this means for uneven heating on
Earth. Say: “We are going to use what we just did with the ashlights and clipboards to think
about what this would look like on Earth’s surface.” Direct them to Lesson 13: Step 3. Ask, “What
do you notice about this image?” Students should notice that the “clipboard” from Lesson 13:
Step 2 is now placed at certain points on Earth (e.g., the slanted clipboard could be the Earth’s
surface at midlatitudes and the non-slanted clipboard could be the Earth’s surface at the
equator). Students should think about where solar radiation is more concentrated and where it
is more spread out (less concentrated) as they answer the questions.
5. What did this activity help us gure out related to our question: Why is it hotter at the
equator than other places on Earth? Ask students to summarize what they learned from the
Energy Angles activity.
Write these ideas on the Model Idea Tracker.
• Sunlight (solar radiation) is more concentrated at the equator because incoming sunlight
shines directly on the equator, concentrating it in a smaller area.
• Sunlight (solar radiation) is more spread out toward the poles because incoming sunlight
hits the surface at an angle, spreading the light out over a larger area.
• The amount of concentrated solar radiation that warms the land inuences air
temperatures just above the land. More concentrated solar radiation causes higher air
temperatures. More spread out solar radiation causes cooler air temperatures.
Note: This is where you can end the lesson for the rst day.
HEATING UP: Why is it hotter at the equator than other places on Earth?
STEP 3
Storyline Link
Revisit where students are
in Lesson 13 if this lesson
is taught across multiple
class periods.

114
| TEACHER GUIDE
GLOBE Weather | LS3: Worldwide Weather
© 2019 University Corporation for Atmospheric Research. All Rights Reserved
Temperature Data Investigation
1. Tell students they are going to look closer at temperature data by latitude. If you split
this lesson across two days of class time, begin day two by asking students to describe general
dierences in temperature between Earth’s poles and the equator and why they believe there
are dierent temperatures. Revisit the Model Idea Tracker as needed to remind students where
they are in the investigation of uneven heating between the equator and the poles.
2. Divide students into groups and preview the GLOBE Temperature and Latitude data
graph cards, location cards, and maximum/minimum temperature cards to orient
students to the activity. Pass out a card set to each group. Ask students what they notice
about the graphs. Students may notice the following:
• The x-axis is time and this data was collected over several years.
• The data in dierent places was not collected over the same time period.
• Some graphs have strong shifts in temperature over seasons, and some locations have
little variation.
Tell students that GLOBE students in ve locations around the world took measurements
of maximum daily temperature (the warmest temperature each day) and that these are the
graphs of that data. Their task is to gure out the location of the data based on what they
understand about how temperatures vary by latitude. (Note: The graphs introduce seasonal
shifts in temperature, which is NOT part of this unit. If you have already taught seasons in your
class, this is a good place to have students make connections. If you have not taught seasons in
your class, ask students to focus on the range of temperatures, focusing on where warmer and
cooler temperatures are and not the seasonal shifts within the year.)
GLOBE Locations:
• Juuan Lukio/Poikolan Koulu, Finland
• WANAKA Field Station, Vermont, USA
• Many Farms High School, Arizona, USA
• Hamzah Bin Abdulmutalib Secondary School at Jeddah, Saudi Arabia
• Wp/Minu/D S Senanayake College, Sri Lanka
3. Allow students time to match the graphs/temps/locations for each of the ve locations.
Have the groups share their initial matches with another group and discuss any dierences
before they begin to record them on the student activity sheet.
4. In Lesson 13: Step 4, have students complete
their explanations of locations based on the
temperature and latitude data. Using the clues
below, students can revisit their matches and
then write down their nal best guesses.
CLUE 1: Seasonal dierences (uctuations from
cold to warmer temperatures) are stronger at
higher latitude (further from the equator). At or
near the equator, there is usually no seasonal
dierence in temperature.
CLUE 2: Temperatures are warmer at low latitude (close to the equator) than at high latitude
(far from the equator).
STEP 4
HEATING UP: Why is it hotter at the equator than other places on Earth?
Data Analysis &
Interpretation
Students analyze and
interpret temperature data
and latitude for ve GLOBE
locations.
CORRECT MATCHES
Location Graph High/Low
Finland B I
Vermont E J
Arizona A H
Saudi Arabia C F
Sri Lanka D G

115
| TEACHER GUIDE
GLOBE Weather | LS3: Worldwide Weather
© 2019 University Corporation for Atmospheric Research. All Rights Reserved
Model Idea Tracker
1. Revisit the Model Idea Tracker to summarize Model Ideas about uneven heating.
Summarize the Model Ideas from this lesson.
• Sunlight (solar radiation) is more concentrated at the equator because incoming sunlight
shines directly on the equator, concentrating it in a smaller area.
• Sunlight (solar radiation) is more spread out toward the poles because incoming sunlight
hits the surface at an angle, spreading the light out over a larger area.
• The amount of concentrated solar radiation inuences air temperatures; more
concentrated solar radiation causes higher air temperatures and more spread out solar
radiation causes cooler air temperatures.
Then ask students: “So we know that Earth is heated unevenly by the Sun. Some places have
more direct solar radiation; other places have more spread out solar radiation. That causes
temperature dierences on Earth. But how does that have anything to do with how air moves?”
Give students a few minutes to ponder this question. Ask if they can pull from the Model Idea
Tracker, particularly as it relates to pressure dierences and air temperatures. Some students
may say something about dierent air temperatures being related to convection. Push them
to explain how temperature dierence might cause convection. Build on this idea by telling
students that they will think about temperature dierences and how they cause air to move in
the next lesson.
Tell students: “We saw dierent patterns of storm movement in the tropics and the midlati-
tudes. Next time, we’ll start by thinking solely about the tropics and how uneven heating and air
movement relate in that region.”
• How does uneven heating relate to air movement in the tropics?
HEATING UP: Why is it hotter at the equator than other places on Earth?

GLOBE Weather | LS3: Worldwide Weather
116
| TEACHER GUIDE
© 2019 University Corporation for Atmospheric Research. All Rights Reserved
ACTIVITY DESCRIPTION MATERIALS
(90 minutes)
Develop a Working Model
Students pull their ideas together from Learning Sequences
1, 2, and 3 to develop an initial model to explain how and
why air moves in the atmosphere in the tropics.
Lesson 14: Student Activity Sheet
Optional: NASA rainfall and snowfall video
Convection Demonstration
Students observe convection in a class demonstration.
Students gure out that winds move toward the equator
in global convection. Students then add these ideas to the
Model Idea Tracker.
Clear tub
Cold water
Red and blue food coloring
Two pipettes
Kettle and near boiling water
Five insulated cups
Optional: Device for time-lapse/
slow-motion video
Global Air Circulation Diagram
Students review a diagram of global air circulation and
record observations, initial explanations, and questions. In
a whole class discussion, students discuss how convection
happens on a global scale and add additional Model Ideas
to the Model Idea Tracker.
Whiteboard, smart board, or chart paper
and markers (to make the Model Idea
Tracker)
Consensus Model: Air Movement in the Tropics
Students use the Model Idea Tracker to develop a Consen-
sus Model for explaining how and why air moves in the
tropics. Students develop models in small groups and then
share their models with the class and come to consensus.
Whiteboard, smart board, or chart paper
and markers (to make the Consensus
Model)
AIR MOVEMENT IN THE TROPICS
How and why does air move in the tropics?
AT A GLANCE

GLOBE Weather | LS3: Worldwide Weather
117
| TEACHER GUIDE
© 2019 University Corporation for Atmospheric Research. All Rights Reserved
NGSS Sensemaking
Students develop a model to explain how and why air moves in large-scale convection in the tropics.
Students develop an initial model drawing on understandings from Learning Sequences 1, 2, and
3. Students gather evidence about how air moves in global convection from critical review of a
diagram and a convection demonstration. Students revise models in small groups and develop a class
Consensus Model.
PERFORMANCE OUTCOME
• Develop a model to show how air is circulating through the atmosphere in the tropics and
midlatitudes.
NGSS DIMENSIONS (GRADES 6-8)
• Develop a model to describe unobservable mechanisms.
• Construct an explanation using models or representations.
• Weather and climate are inuenced by interactions involving sunlight and the atmosphere.
These interactions vary with latitude, which can aect atmospheric ow patterns.
AIR MOVEMENT IN THE TROPICS
How and why does air move in the tropics?

118
| TEACHER GUIDE
GLOBE Weather | LS3: Worldwide Weather
© 2019 University Corporation for Atmospheric Research. All Rights Reserved
Teacher Procedures
Develop a Working Model
1. Revisit the Learning Sequence 3 phenomenon and question: Why do storms move in
predictable patterns around the world? Remind students that the class is investigating how
air moves on a global scale because air movement is related to patterns in storm movement.
(Optional: Show the NASA global rainfall and snowfall video from Lesson 12 to remind students
of the precipitation movement pattern in the tropics.)
2. Navigate from the previous lesson. At the end of the previous lesson, students gured out
that solar radiation causes uneven heating of Earth, which leads to air temperature dierences.
Students gured out that air at the equator will be warmer than air in the midlatitudes. Remind
students of the next question to investigate:
• How does uneven heating relate to air movement in the tropics?
3. Prepare students to develop a Working Model. Tell students they will develop a Working
Model to explain how and why air moves in the tropics. Have students review the Model Idea
Tracker to draw on ideas from lessons 1 to 13. Tell students that not all ideas will be helpful, but
some might.
• Encourage students to draw on ideas from the previous lesson about solar radiation as
well as ideas from Learning Sequence 1 about how temperature relates to air movement
and ideas from Learning Sequence 2 about how pressure relates to air movement.
• Remind students that the purpose is for them to try to draw on their existing knowledge
to start developing an explanation. They don’t need to be certain about their models at
this point.
4. Orient students to the illustration of the Earth’s atmosphere in Lesson 14: Step 1 of the
student activity sheet. Show the cross section of Earth’s atmosphere (slide: Layers of the
Atmosphere) and relate it to the illustration on their activity sheets. While the atmosphere does
have four distinct layers, the illustration on their activity sheets is focusing just on the Earth’s
surface and the troposphere layer of the atmosphere, because this is where all weather occurs.
5. Students record an initial Working Model. In Lesson 14: Step 1 of their student activity sheets,
students record a model that explains how air movement in the tropics relates to latitude.
Encourage students to share their working models with others as they nish.
Use the following prompts to guide students as you circulate the class:
• Where might air be rising from Earth’s surface to the atmosphere and why?
• Where might air be sinking from the atmosphere to Earth’s surface and why?
STEP 1
Storyline Link
Students remember
that they’re exploring
air movement because
precipitation is moisture in
the air, and they are trying
to explain patterns in
global storm movement.
Developing & Using
Models
Students draw on Model
Ideas from Learning
Sequences 1, 2, and 3 to
develop a Working Model to
explain how air moves in
the tropics.
AIR MOVEMENT IN THE TROPICS: How and why does air move in the tropics?

119
| TEACHER GUIDE
GLOBE Weather | LS3: Worldwide Weather
© 2019 University Corporation for Atmospheric Research. All Rights Reserved
AIR MOVEMENT IN THE TROPICS: How and why does air move in the tropics?
Convection Demonstration
1. Introduce the goal of the Convection Demonstration. Tell students that the goal of this
demonstration is to help them think about how and why air moves across the Earth’s surface in
global convection near the equator. Students can also make observations about the rest of the
convection cycle.
Storyline Link
In this activity, students
think about how air
would move across
Earth’s surface in global
convection, which would
cause patterns in storm
movement.
CONVECTION DEMONSTRATION
MATERIALS:
• Clear tub (about the size of a shoebox)
• Cold water (enough to ll the clear tub ¾ full)
• Red and blue food coloring
• Two pipettes
• Hot water
• Device to heat water (e.g., kettle)
• Five cups of the same height (four to hold up the tub and one for hot water)
PREPARATION:
• Fill the clear tub with cold water and place the tub on top of four cups. Let the
water settle. Place the tub in front of a light-colored background.
TO BE DONE WITH STUDENTS IN CLASS:
1. Heat water using a kettle and ll an insulated cup.
2. Use a pipette to carefully place a large drop of red food coloring at the bottom
of the center of the tub.
3. Use a pipette to carefully place two large drops of blue food coloring at the
bottom of each side of the tub.
4. Place the cup with hot water underneath the red drop of food coloring at the
center of the tub.
This video shows the set-up: https://scied.ucar.edu/convection-demonstration
BLUE
HOT
WATER
BLUERED
30
º
N 30
º
S0
º
(equator)

120
| TEACHER GUIDE
GLOBE Weather | LS3: Worldwide Weather
© 2019 University Corporation for Atmospheric Research. All Rights Reserved
2. Discuss what each part of the tank represents. Orient students to the demonstration set-up
and discuss what each part represents. Students can ll in the middle column (“Part of the real
world”) in Lesson 14: Step 2 as you discuss.
• The water in the tank represents air. This model uses water to simulate air because both
air and water are uids, so they behave similarly, but water can be seen.
• The red food coloring represents air at the equator.
• The blue food coloring represents air at 30°N and 30°S.
• The cup full of hot water represents solar radiation.
• The bottom of the tank represents Earth’s surface.
Have students work with a partner to ll out the third column (“Why are they alike?”) of the
analogy map in Lesson 14: Step 2. Students should come up with reasoning to explain why the
analogy works (e.g., Why is red coloring a good choice to represent air at the equator?).
3. Prepare for observations. Students may wish to make a video or take photos. They might
sketch or write about the changes. Explain that having several ways to document what is
happening is a good idea because dierent types of data can be used together to help us
understand what is happening. Have students plan how they will document what happens in
the tank.
4. Set-up the demonstration. Explain how the demonstration will be completed. The key idea
here is that students watch what is happening along the bottom of the tank, as it represents
air movement, or winds, across Earth’s surface. Ask students to predict what will happen when
the cup of hot water is added. Put the red and blue food coloring drops at the base of the tank.
Heat the water, add it to the cup, and place the cup with hot water under the red food coloring
in the tank. It will take about one minute for the red dye to start rising and convection to start.
The blue dots should also slowly begin to pull towards the center of the tank (towards the red
dot).
5. Make observations. Have students draw what they notice happening in the tank in Lesson
14: Step 3 of their activity sheets. Students should observe that the red food coloring rises and
the blue food coloring is pulled in from the sides of the tank to the middle of the tank. Have
students record their ideas about what they see, why they think it is happening, and what they
wonder about in the boxes below their drawings.
6. Relate the convection demonstration to how and why air moves in the tropics. Orient
students to the model, pointing out that we are focusing only on the convection cells near
the equator. Have students develop a model in Lesson 14: Step 4, using their observations of
the tank to describe how air is moving in the tropics (between 30°N and 30°S of the equator).
Students should be able to explain why air is rising and sinking.
7. Share observations and lead a discussion of the demonstration. Have students explain
what they observed and why it happened. Use the following questions to guide this discussion:
AIR MOVEMENT IN THE TROPICS: How and why does air move in the tropics?
STEP 2
STEP 3
STEP 4

121
| TEACHER GUIDE
GLOBE Weather | LS3: Worldwide Weather
© 2019 University Corporation for Atmospheric Research. All Rights Reserved
Disciplinary Core Idea
Students deepen their
conceptual understanding
about how temperature
and pressure causes air
movement in convection.
Students expand their
understanding that
convection also happens
on a global scale.
AIR MOVEMENT IN THE TROPICS: How and why does air move in the tropics?
SUGGESTED PROMPTS SAMPLE STUDENT RESPONSES
What happened to air at the surface
of the Earth when it received direct
heat?
The air near the equator heated up from the
Sun and rose.
What happened to the pressure where
the warm air rose?
The warm rising air caused an area of low
pressure.
Why would the air move from the cool
location to the warm location?
As the warm air rises, it creates an area of low
pressure. Cool air moved toward the area of low
pressure across the Earth. That’s the wind we
would feel.
Students may need support to understand why the cool air is pulled across Earth’s surface
toward the equator. This is a good time to remind students what they know about pressure
and how air moves from high to low pressure. Students may also not realize that this horizontal
movement represents winds. Have them think about what they would feel if they stood at the
bottom of the tank. Remind them that the bottom of the tank represents the Earth’s surface.
8. Revisit the Model Idea Tracker to summarize Model Ideas about air movement.
Summarize the new Model Ideas from this lesson and record them on the Model Idea Tracker.
Model Ideas:
• As warm air rises at the equator, it creates an area of low pressure.
• Cooler air with higher pressure moves across Earth’s surface toward the area of low
pressure to replace the rising warm air.
• Horizontal movement of air across Earth’s surface is wind.
Global Air Circulation Diagram
Note: Do not hand out Lesson 14: Step 5 until students get to this point, as the previous steps involve
students discovering the pattern of convection cells that is provided here.
1. Introduce the Global Air Circulation Diagram in Lesson 14: Step 5. Orient students to this
diagram and point out that it shows how air moves around the whole world, not just in the
tropics.
2. Have students create a model of air pressure and humidity. Annotating the illustration
in Lesson 14: Step 5, students should create a model locating the areas of low and high
atmospheric pressure and the locations that are likely to be cloudy because air is rising. Use
the arrows indicating air movement as clues.
3. Lead a class discussion about the diagram. Focus students on convection near the equator
and encourage students to draw on their understanding of convection from Learning Sequence
1 and high and low pressure from Learning Sequence 2 to explain air movement in tropical
convection. The one important thing for students to notice in the midlatitudes at this point is
that convection moves in the opposite direction. This will be revisited in Lesson 15. Use the
prompts below to guide your discussion.
STEP 5

122
| TEACHER GUIDE
GLOBE Weather | LS3: Worldwide Weather
© 2019 University Corporation for Atmospheric Research. All Rights Reserved
4. Document new Model Ideas on the Model Idea Tracker at the end of the discussion.
Students figure out the following:
• Warm air is rising at the equator because of concentrated sunlight (solar radiation),
which heats air, causing it to rise. An area with rising air has low pressure.
• Cool air is sinking at 30°N and 30°S, which is an area of high pressure.
• Convection happens on a global scale.
5. Ask students what we would experience on the surface of the Earth. Have students
wonder about what the air movement would be like if we were standing at the surface of the
Earth near the equator. Tell students that air movement across Earth’s surface is what we
experience as wind. It’s okay if students are not sure about this yet.
• If you stood just north of the equator, where would you feel winds coming from?
• If you stood just south of the equator, where would you feel winds coming from?
Consensus Model: Air Movement in the Tropics
1. Revisit the Learning Sequence 3 phenomenon and question: Why do storms move in
predictable patterns around the world? Remind students that the class is investigating air
movement patterns because precipitation is moisture in the air. Remind students that we’re
focusing only on air movement in the tropics for now. Review the question that the Consensus
Model will help us answer:
• How and why does air move in the tropics?
SUGGESTED PROMPTS SAMPLE STUDENT RESPONSES
Where is air rising from Earth’s surface
into the atmosphere and why?
Warm air is rising at the equator because there
is more concentrated sunlight (solar radiation)
there. Warm air is also rising at the top of the
midlatitudes.
Worldwide, where is air sinking from
the atmosphere to Earth’s surface
and why?
Cool air is sinking at 30°N and 30°S. Cool air is
also sinking at the poles.
How is air moving across Earth’s
surface and why?
We’re not sure, but the arrows are pointing
toward the equator, so it looks like air is moving
toward the equator.
Where do you think there are areas of
high and low pressure and why?
We think there’s low pressure at the equator
where the warm air is rising, like the isolated
storm. There’s probably high pressure around
30°N and 30°S where cool air is sinking.
Assessment
Use this discussion to
formatively assess student
learning about global
convection.
Storyline Link
Students remember
that they’re exploring
air movement because
precipitation is moisture in
the air, and they are trying
to explain patterns in
global storm movement.
Developing & Using
Models
Use the Model Idea Tracker
to document new rules
students gured out
about air circulation in
the tropics. Remember
these are general rules of
thumb that will be helpful
for explaining global storm
movement patterns.
AIR MOVEMENT IN THE TROPICS: How and why does air move in the tropics?

123
| TEACHER GUIDE
GLOBE Weather | LS3: Worldwide Weather
© 2019 University Corporation for Atmospheric Research. All Rights Reserved
2. Take stock of ideas from the Model Idea Tracker that will help answer this question.
Have students nominate ideas from the Model Idea Tracker that they think will be helpful for
answering this question. All of the ideas from Learning Sequence 3 will be helpful as well as
some ideas from Learning Sequences 1 and 2 about warm air rising, cool air sinking, and air
moving from high to low pressure.
3. Develop a class Consensus Model. Have small groups consider ideas from the models they
created in Lesson 14: Step 4 and Step 5 and the ideas from the Model Idea Tracker. Have each
group present which ideas they propose including in the Consensus Model. As small groups
present, have students discuss if they agree or disagree with the ideas in each groups’ model.
Come to consensus about what should be in the model and document a Consensus Model in a
public space that reects agreed upon ideas.
KEY MODEL IDEAS THAT SHOULD BE REPRESENTED IN THE CONSENSUS MODEL
• As warm air rises at the equator, it creates an area of low pressure.
• Sunlight (solar radiation) is more concentrated at the equator because incoming sunlight
shines directly on the equator, concentrating it in a smaller area.
• Sunlight (solar radiation) is more spread out toward the poles because incoming sunlight
hits the surface at an angle, spreading the light out over a larger area.
• The amount of concentrated solar radiation inuences air temperatures; more
concentrated solar radiation causes warmer air temperatures and more spread out solar
radiation causes cooler air temperatures.
• There are more areas where warm air is rising near the equator and more areas where
cool air is sinking at 30°N and 30°S.
• Cooler air moves along the surface of the Earth toward the area of low pressure to
replace the rising warm air.
• Horizontal movement of air along the surface of the Earth is wind, which causes storms
to move.
Developing & Using
Models
Students use ideas from
the Model Idea Tracker to
develop a class Consensus
Model to explain how
and why air moves in the
tropics. As students work
in groups, they do not need
to agree on all parts of the
model. They contribute
questions to the Consensus
Model discussion. Have the
Model Idea Tracker and
evidence from previous
activities ready to revisit
during the consensus
discussion to help resolve
disagreements.
Assessment
Students’ small group
models may serve as tools
for formative assessment.
AIR MOVEMENT IN THE TROPICS: How and why does air move in the tropics?
GLOBE Weather | LS3: Worldwide Weather
124
| TEACHER GUIDE
© 2019 University Corporation for Atmospheric Research. All Rights Reserved
A CURVEBALL
When air and storms move, why do they curve?
ACTIVITY DESCRIPTION MATERIALS
(55 minutes)
Use the Consensus Model
Students use the Consensus Model to predict how air
moves across Earth’s surface in the tropics. Students re-
view observed storm movement patterns in the tropics and
realize that the model doesn’t explain why precipitation at
the equator moves from east to west.
Lesson 15: Student Activity Sheet
Coriolis Eect Reading
Students gather evidence from an article that explains the
Coriolis eect and how Earth’s rotation causes air to curve.
Students discuss the Coriolis eect in a whole class discus-
sion and add new ideas to the Model Idea Tracker.
Round balloons, markers
Explaining Storm Movement
Students use their global air circulation models and new
ideas about the Coriolis eect to explain where precipita-
tion would travel in the Philippines and where they live.
AT A GLANCE

GLOBE Weather | LS3: Worldwide Weather
125
| TEACHER GUIDE
© 2019 University Corporation for Atmospheric Research. All Rights Reserved
NGSS Sensemaking
Students use the Consensus Model to explain precipitation movement patterns near the equator and
realize their model does not account fully for the phenomenon. Students critically read a scientic
text to gather information about how the rotation of Earth causes winds to curve, the Coriolis eect.
Students use their Consensus Model and new ideas about the Coriolis eect to explain patterns of
storm movement in two new locations.
PERFORMANCE OUTCOME
• Use knowledge of surface wind patterns to make a prediction about the movement of a
storm.
NGSS DIMENSIONS (GRADES 6-8)
• Use a model to predict phenomena.
• Evaluate limitations of a model for a proposed tool.
• Critically read scientic texts adapted for classroom use to obtain scientic information to
describe evidence about the natural world.
• Weather and climate are inuenced by interactions involving sunlight and the atmosphere.
These interactions vary with latitude, which can aect atmospheric ow patterns.
• Phenomena may have more than one cause.
NGSS DIMENSIONS (GRADES 3-5) (REINFORCING)
• Patterns of change can be used to make predictions.
A CURVEBALL
When air and storms move, why do they curve?

126
| TEACHER GUIDE
GLOBE Weather | LS3: Worldwide Weather
© 2019 University Corporation for Atmospheric Research. All Rights Reserved
Teacher Procedures
Use the Consensus Model
1. Navigate from the previous lesson. Remind students that they just developed a Consensus
Model to explain air movement in the tropics. Remind students of the Learning Sequence 3
question and how it connects to air movement.
• Why do storms move in predictable patterns around the world?
2. Use the model to predict how storms move in the tropics. Have students use their Air
Movement in the Tropics Consensus Model to predict how air or wind moves across Earth’s
surface in the tropics. Orient students to where storms would occur in their model (at the
bottom of the atmosphere). Students should deduce that, because of convection, storms would
move towards the equator in the tropics.
• Based on what you know about air movement in the tropics, predict storm movement in the
tropics.
3. Compare predictions to observed storm movement patterns. Re-watch the NASA global
rainfall and snowfall video from Lesson 12: Step 3 and focus students on storm movement
in the tropics. After watching the video, students record the answer to the question below in
Lesson 15: Step 1 of their student activity sheets. Students should notice very obvious patterns
of storms moving from east to west that our model doesn’t explain.
• What kind of movement do you see that isn’t explained by the model for air movement in the
tropics that you made at the end of Lesson 14?
4. Discuss the limitations of the model. Remind students that all models need to be revised
and tested and revised again. This model is not yet helping us fully explain observed patterns
of precipitation movement at the equator, nor is it addressing questions about precipitation
movement generated in Lesson 12 that are on the Driving Question Board:
• Why does precipitation move from east to west near the equator?
• Why does precipitation move from west to east in the midlatitudes?
• Why does precipitation move in dierent directions in the tropics and midlatitudes?
Storyline Link
Students review the
phenomenon and
remember that they’re
exploring air movement
because precipitation is
moisture in the air, and
they are trying to explain
patterns in global storm
movement.
A CURVEBALL: When air and storms move, why do they curve?
STEP 1
Developing & Using
Models
Students realize the
limitations of their model
and that their model does
not yet fully help them
explain the observed
phenomenon.
NASA GLOBAL RAINFALL AND SNOWFALL VIDEO
https://pmm.nasa.gov/education/videos/gpms-rst-global-rainfall-
and-snowfall-map
This two-minute video shows how precipitation moves globally from April to September
2014, with data collected just below the clouds. The green-yellow-red colors indicate rainfall
and the blue-purple colors indicate snowfall, which students may not notice in the video.
The voiceover explains how the data was collected and some patterns students might
notice, so we suggest muting. The video provides a global view and zooms in on the United
States (0:25), South America (0:50), and the Atlantic Ocean (1:25).

127
| TEACHER GUIDE
GLOBE Weather | LS3: Worldwide Weather
© 2019 University Corporation for Atmospheric Research. All Rights Reserved
Coriolis Eect Reading
1. Navigate from the previous activity. Tell students that the model they developed explains
the north-south aspect of storm movement in the tropics but not the east-west movement.
2. Read the rst paragraph in Lesson 15: Step 2 about the Coriolis eect. Read this aloud with
your students to introduce the new idea that the spinning of the Earth deects winds.
3. Observe the Coriolis eect with a quick activity: Provide pairs of students with a round
balloon and marker. Instruct students to inate the balloon and draw an equator around the
widest point in the center of the balloon. Also draw on the balloon “about” where the 30˚N
latitude and 30˚S latitude lines would be. Tell students that this is a simple model of the Earth.
Have one student hold the balloon at chest height (they should be able to look down at the
top of the balloon) while the other draws an arrow starting at 30˚N going toward the equator.
Then have the student holding the balloon slowly rotate it counterclockwise (to model the Earth
spinning on its axis) as their partner draws another arrow, starting again from the same point
on their balloon. Students should notice that when their model of Earth was turning, the arrow
curved, but when their model wasn’t spinning, it did not.
4. Finish Reading about the Coriolis eect in Lesson 15: Step 2. Set the purpose of reading
an article as a method to help students gather evidence to explain the east-west storm
movement they observed in the video as well as additional evidence to explain the west-east
storm movement in the midlatitudes. Students can read individually or as a whole group.
Prompt students to Stop and Think as they encounter questions in the text. These questions
are to help students make connections between the information they read and their previous
observations.
5. Discuss the Coriolis eect. Lead a whole class discussion about the Coriolis eect. The big
ideas students should walk away with are that the winds do move north and south, caused by
convection, and they also move east and west, caused by the Earth’s rotation.
The unit thus far focused on explaining the north-south movement of air in tropical convection.
Students may struggle to see how air moves across Earth’s surface toward the poles in
midlatitude convection. You can help students see that convection in the midlatitudes travels in
the opposite direction.
Storyline Link
Students are motivated to
gather more evidence to
explain the phenomenon.
Literacy Connection
Students read non-ction
texts and are prompted to
make connections and to
synthesize ideas.
Going Deeper
Have students blow up a
balloon and use a marker
to draw an equator. Make
the knot the South Pole
and the top of the balloon
the North Pole. Have one
partner rotate the balloon
left to right, simulating
Earth’s rotation, while
the other partner slowly
tries to draw a straight
line from the North Pole
to the equator. Next, the
partner with the marker
will draw a straight line
from the South Pole to the
equator. Students see how
the movement “curves”
in opposite directions in
the northern and southern
hemispheres.
A CURVEBALL: When air and storms move, why do they curve?
SUGGESTED PROMPTS SAMPLE STUDENT RESPONSES
Why does the air in the tropics curve
east to west?
The Earth rotates so air that was moving toward
the equator curves and moves to the west.
How does air move across Earth’s
surface in midlatitude convection?
Air moves toward the poles. This is the opposite
direction as in the tropics.
Why does the air in the midlatitudes
move west to east?
The Earth rotates so air that was moving
towards the poles curves and moves to the east.
STEP 2

128
| TEACHER GUIDE
GLOBE Weather | LS3: Worldwide Weather
© 2019 University Corporation for Atmospheric Research. All Rights Reserved
6. Add new ideas to the Model Idea Tracker. Summarize the new model ideas developed out of
this discussion and add them to the Model Idea Tracker.
Model Ideas
• In the tropics, air moves across Earth’s surface towards the equator due to convection.
• In the tropics, air moves across Earth’s surface east to west due to the Earth’s rotation.
• In the midlatitudes, air moves across Earth’s surface toward the poles due to convection.
• In the midlatitudes, air moves across Earth’s surface west to east due to the Earth’s
rotation.
Explaining Storm Movement
1. Navigate from the previous activity. Tell students that with their new ideas about the
Coriolis eect, they are now prepared to explain more of the patterns in storm movement they
observed in the tropics and the midlatitudes.
2. Record a nal explanation. In Lesson 15: Step 3, have students use their model and new ideas
about the Coriolis eect to record an explanation that describes where it is likely that storms
will originate in the Philippines and where they live.
3. Lead a whole class discussion. Have students share their explanations for where weather
comes from where they live and why this understanding is important for their daily lives. Have
them connect back to their responses from Lesson 12.
• Where is it likely that storms originate where we live?
• Why is being able to anticipate where storms come from important for communities?
• How can we use our understanding of weather to prepare for the impacts of storms?
4. Connect back to the Anchor. Have students look back at their Lesson 11 weather map
model. On a world map, globe, or Google Earth, indicate the location of Colorado. Ask students
to identify what direction storms are likely to travel based on its latitude. (Students should
recognize that it is in the midlatitudes so storms will tend to move from west to east.) Have
students add an arrow to their weather map models to indicate the direction that the storm is
trying to move. Ask students what stopped the storm from moving (high pressure to the east,
north, and south).
End of Sequence Assessment
Assess student learning with the Learning Sequence 3 assessment. You can nd the assessment
item bank and rubric in the Assessments section of GLOBE Weather.
Assessment
This nal individually
written explanation
can serve as one of the
summative assessments
for this learning sequence.
A CURVEBALL: When air and storms move, why do they curve?
Storyline Link
Students are motivated to
gather more evidence to
explain the phenomenon.
STEP 3
STEP 2
LOOK
BACK
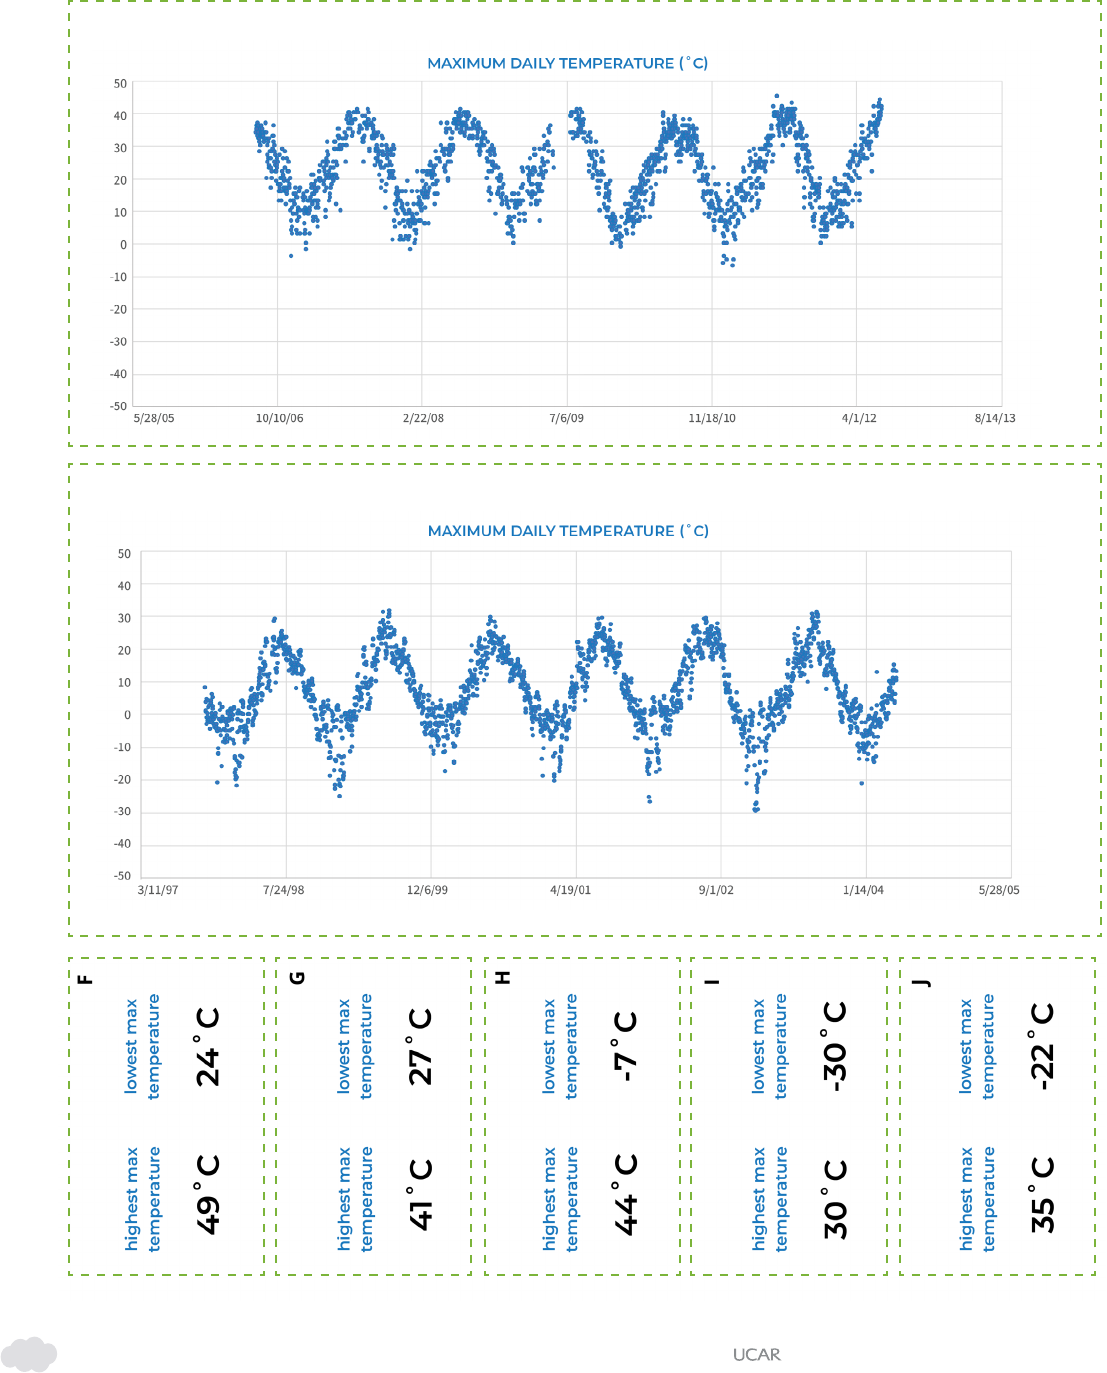
GLOBE Weather | LS3: Worldwide Weather
129
| TEACHER GUIDE
© 2019 University Corporation for Atmospheric Research. All Rights Reserved
GLOBE Temperature and Latitude Data Cards: Page 1
NOTE: Cut apart the graphs and maps on the following four pages for each student group. (Use the
highest/lowest temperature cards if students need support to interpret graphs.)
A
B

GLOBE Weather | LS3: Worldwide Weather
130
| TEACHER GUIDE
© 2019 University Corporation for Atmospheric Research. All Rights Reserved
GLOBE Temperature and Latitude Data Cards: Page 2
C
D
E

GLOBE Weather | LS3: Worldwide Weather
131
| TEACHER GUIDE
© 2019 University Corporation for Atmospheric Research. All Rights Reserved
GLOBE Temperature and Latitude Data Cards: Page 3
Location:
Saudi Arabia
Latitude:
21.3725
Distance from
the equator:
2,372 km
Location:
Sri Lanka
Latitude:
7.1438
Distance from
the equator:
793 km
Location:
Finland
Latitude:
63.2377
Distance from
the equator:
7,020 km
Polar
Polar
Midlatitudes
Midlatitudes
Tropics
Tropics
equator
Polar
Polar
Midlatitudes
Midlatitudes
Tropics
Tropics
equator
Polar
Polar
Midlatitudes
Midlatitudes
Tropics
Tropics
equator
N
O
K
GLOBE Weather | LS3: Worldwide Weather
132
| TEACHER GUIDE
© 2019 University Corporation for Atmospheric Research. All Rights Reserved
GLOBE Temperature and Latitude Data Cards: Page 4
Location:
Vermont, US
Latitude:
44.675
Distance from
the equator:
4,959 km
Location:
Arizona, US
Latitude:
36.4493
Distance from
the equator:
4,046 km
Polar
Polar
Midlatitudes
Midlatitudes
Tropics
Tropics
equator
Polar
Polar
Midlatitudes
Midlatitudes
Tropics
Tropics
equator
L
M
