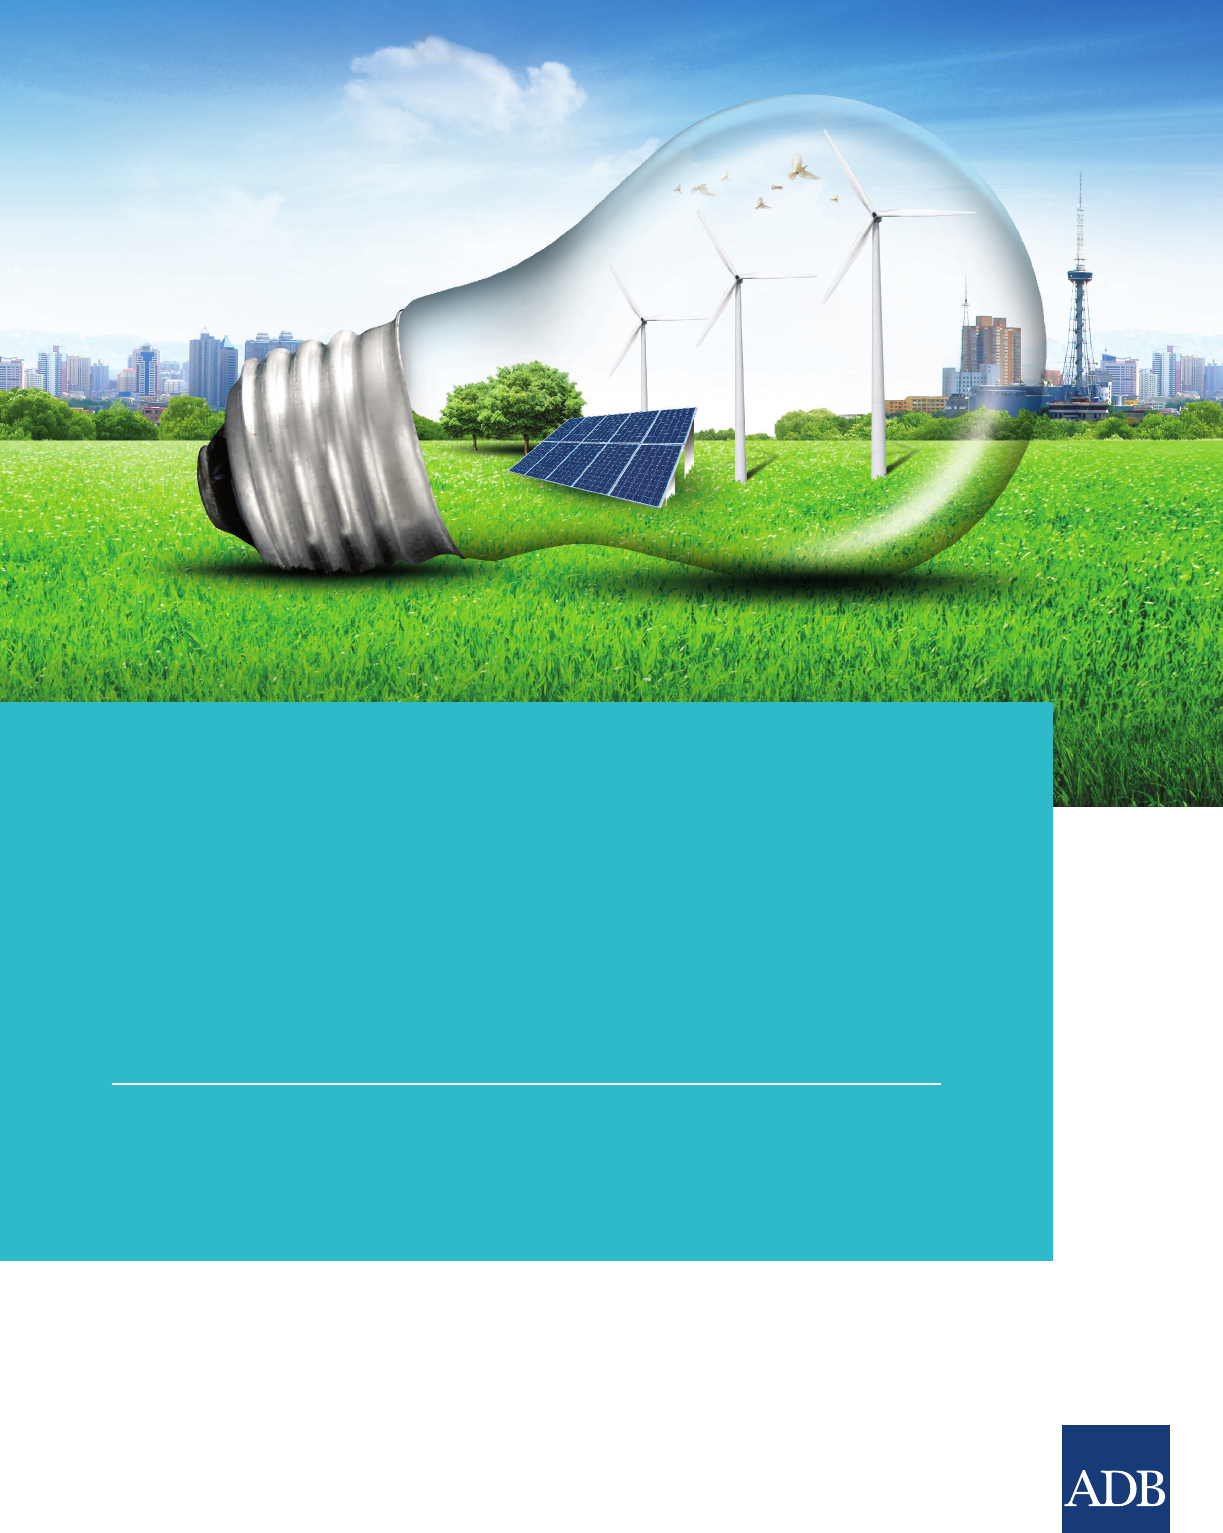
ASIAN DEVELOPMENT BANK
RENEWABLE ENERGY
FINANCING SCHEMES
FOR INDONESIA
NOVEMBER 2019

ASIAN DEVELOPMENT BANK
RENEWABLE ENERGY
FINANCING SCHEMES
FOR INDONESIA
NOVEMBER

Creative Commons Attribution 3.0 IGO license (CC BY 3.0 IGO)
© 2019 Asian Development Bank
6 ADB Avenue, Mandaluyong City, 1550 Metro Manila, Philippines
Tel +63 2 8632 4444; Fax +63 2 8636 2444
www.adb.org
Some rights reserved. Published in 2019.
ISBN 978-92-9261-832-2 (print), 978-92-9261-833-9 (electronic)
Publication Stock No. TCS190522
DOI: http://dx.doi.org/10.22617/TCS190522
The views expressed in this publication are those of the authors and do not necessarily reflect the views and policies
ofthe Asian Development Bank (ADB) or its Board of Governors or the governments they represent.
ADB does not guarantee the accuracy of the data included in this publication and accepts no responsibility for any
consequence of their use. The mention of specific companies or products of manufacturers does not imply that they
are endorsed or recommended by ADB in preference to others of a similar nature that are not mentioned.
By making any designation of or reference to a particular territory or geographic area, or by using the term “country”
inthis document, ADB does not intend to make any judgments as to the legal or other status of any territory or area.
This work is available under the Creative Commons Attribution 3.0 IGO license (CC BY 3.0 IGO)
https://creativecommons.org/licenses/by/3.0/igo/. By using the content of this publication, you agree to be bound
bytheterms of this license. For attribution, translations, adaptations, and permissions, please read the provisions
andterms of use at https://www.adb.org/terms-use#openaccess.
This CC license does not apply to non-ADB copyright materials in this publication. If the material is attributed
toanother source, please contact the copyright owner or publisher of that source for permission to reproduce it.
ADB cannot be held liable for any claims that arise as a result of your use of the material.
Please contact pubsmarketing@adb.org if you have questions or comments with respect to content, or if you wish
toobtain copyright permission for your intended use that does not fall within these terms, or for permission to use
theADB logo.
Corrigenda to ADB publications may be found at http://www.adb.org/publications/corrigenda.
Note:
In this publication, “$” refers to United States dollars.
Cover design by Francis Manio.

Contents
Tables, Figures, and Boxes vi
I. Introduction and Background
II. Current Situation
III. Challenges
IV. Definition of Design Parameters and Design Options
A. Viability Gap or Lack of Profitability
B. High Transaction Costs, Risks of Project Development, andLimited
CapacitybyDevelopers and Financial Institutions
C. High Perceived Risk by Banks and Other Financial Institutions
V. Evaluation and Recommendations on Financing Instruments for
IdentifiedFinancial Intervention Needs
A. Viability Gap Funding
. Option Viability Gap Funding : Fixed Tari
. Option Viability Gap Funding : Fixed Premium
. Option Viability Gap Funding : Competitive Auction of Power
Purchase Agreements
. Option Viability Gap Funding : Competitive Auction of Premium
. Option Viability Gap Funding : Investment Grant
. Summary, Conclusions, and Recommendations
B. Project Development Funding
. Option Project Development Funding : Technical Assistance and
Capacity Building
. Option Project Development Funding : Project Development Grants
. Option Project Development Funding : Project Development
Risk Finance
. Summary, Conclusions, and Recommendations
C. Credit Enhancement Fund
. Option Credit Enhancement Fund : Guarantee
. Option Credit Enhancement Fund : Onlending or Credit Line
. Option Credit Enhancement Fund : Colending, Syndication, A/B Loans
. Option Credit Enhancement Fund : Stand-Alone Debt Fund
. Option Credit Enhancement Fund : Interest Rate Subsidy
. Summary, Conclusions, and Recommendations

Renewable Energy Financing Schemes for Indonesia
iv
VI. Brief Summary of Similar Schemes Applied in Other Countries
A. Introduction
B. Global Energy Transfer Feed-in Tari, Uganda
. Background
. Description of the Scheme
. Governance Structure and Funding Sources
. Relevance and Lessons for Indonesia
C. Private Finance Advisory Network, Global
. Background
. Description of the Scheme
. Governance Structure and Funding Sources
. Relevance and Lessons for Indonesia
D. Renewable Energy Performance Platform, Sub-Saharan Africa
. Background
. Description of the Scheme
. Governance Structure and Funding Sources
. Relevance and Lessons for Indonesia
E. Competitive Bidding of Long-Term Premium Tari, Finland
. Background
. Description of the Scheme
. Governance Structure and Funding Sources
. Relevance and Lessons for Indonesia
F. Accelerating Renewable Energy in Central America
. Background
. Description of the Scheme
. Governance Structure and Funding Sources
. Relevance and Lessons for Indonesia
G. Turkey Sustainable Energy Financing Facility, European Bank for
Reconstruction and Development
. Background
. Description of the Scheme
. Governance Structure and Funding Sources
. Relevance and Lessons for Indonesia
VII. Governance Structure of the Energy Resilience Fund
A. Introduction
B. Governance and Organizational Structure of the Energy Resilience Fund
VIII. Concept Design of the Viability Gap Fund
A. Description of the Instrument
B. Eligibility Criteria
C. Determination of the Premium Tari
D. Competitive Bidding Process, Ranking, and Contract Award
E. Timing and Volume Considerations
F. Sanctions and Incentives

v
Contents
IX. Concept Design of the Project Development Fund
A. Description of the Instrument
B. Eligibility Criteria
C. Main Terms and Conditions of the Project Development Fund
D. Selection Process
E. Timing and Volume Considerations
F. Technical Assistance Linked to the Project Development Fund
X. Concept Design of the Credit Enhancement Fund
A. Description of the Instrument
B. Eligibility Criteria
C. Main Terms and Conditions of the Credit Enhancement Fund
D. Selection Process
E. Timing and Volume Considerations
F. Technical Assistance Linked to the Credit Enhancement Fund
XI. Capitalization Structure and Potential Sources of Funding
A. Viability Gap Funding
. Type of Viability Gap Funding
. Sizing of Viability Gap Funding
. Sources of Viability Gap Funding
B. Project Development Funding
. Type of Project Development Funding
. Sizing of Project Development Funding
. Potential Sources of Project Development Funding
C. Credit Enhancement Funding
. Type of Credit Enhancement Funding
. Sizing of Credit Enhancement Funding
. Potential Sources of Credit Enhancement Funding
D. Summary
XII. Conclusions
A. General
B. Viability Gap Fund
C. Project Development Fund
D. Credit Enhancement Fund
E. Other Approaches
XIII. References

Tables, Figures, and Boxes
Tables
Summary of Similar Schemes in Other Countries Included in the Review
Illustrative Timeline for One Bidding Round
Illustration of Potential Viability Gap Fund Sizing at Dierent Assumptions on
Support per Megawatt-Hour and Targeted Cumulative Capacity
Basic Structuring and Capitalization of the Project Development Fund
Basic Structuring and Capitalization of the Credit Enhancement Fund
Summary of the Capitalization vis-a-vis Components of the
Energy Resilience Fund
Figures
Development of Power Demand and Installed Generation Capacity
Development of the Power Generation Mix in Indonesia in –
Investment Barriers and Relevant Stakeholders to Address Them
Proposed Three Types of Financial Interventions, and
Potential Solutions for Each
Governance Structure and Organization of the GET FiT Program
Main Level Governance and Organizational Structure of the
Energy Resilience Fund, Option
Main Level Governance and Organizational Structure of the
Energy Resilience Fund, Option
Main Level Governance and Organizational Structure of the
Energy Resilience Fund, Option
Illustrative Example of Bid Premium Tari Levels in a Bidding Process
Deal Process of the Project Development Fund
Summary of the Three Funding Windows of the Energy Resilience Fund
Boxes
Recommendation for the Viability Gap Fund Window of the Energy
Resilience Fund
Recommendation for the Project Development Fund Window of the
Energy Resilience Fund
Recommendation for the Credit Enhancement Fund Window of the
Energy Resilience Fund

I. Introduction and Background
T
he Government of Indonesia is exploring alternatives to introduce new energy
eciency and clean energy technology regulations that are of high importance
to the Sustainable and Inclusive Energy Program of the Asian Development Bank
(ADB). In particular, the government is looking at new financing and incentive models to
increase the deployment of clean and ecient technologies.
The increase and promotion of renewable energy generation resources are the priorities
of the government under the National Energy Policy and the Medium-Term Development
Plan –. However, recent policy changes have led to mixed results for renewable
energy development as the rules, regulations, and financial incentives enacted by the
government created an uneven playing field for renewable depending on the location, and
created questions over the long-term bankability and viability of projects. The high cost of
financing and the low power purchase agreement (PPA) taris are serious concerns and
roadblocks to renewable energy development in the country, which is why the government
intends to provide financial incentives for renewable energy developers via an Energy
Resilience Fund (ERF).
ADB has commissioned a study and a proposal by an independent consultant on possible
financing schemes for such an ERF, the rules and criteria governing access to the ERF, and
supporting the drafting of an initial concept for the ERF. An important premise for the
assignment is to avoid a complex financial structure and aim at a time-limited support
scheme that helps jump-start the development of renewable energy generation resources
and can be implemented on a fast-track basis.
It is important to understand that the ERF in this context does not have to mean a separate
new fund entity and structure, but the proposed ERF concept(s) can also be embedded
into one or more existing or planned structures in Indonesia.
The tasks of this study include but are not limited to the following:
(i) presentation of options for an ERF based on international experiences and a
review of Indonesia’s current situation;
(ii) suggestions for a basic structure and rules and criteria for access to the ERF; and
(iii) draft concept paper for an easy establishment and use of funding scheme.
This report summarizes the analysis, findings, and recommendations by the consultant
regarding a possible scope, structure, institutional design, as well as functioning and

Renewable Energy Financing Schemes for Indonesia
2
operation of an ERF. The report also discusses the potential sources of funding, based
on the nature and sizing of the financing instruments included in the ERF concept.
The current situation is described in chapter II. The data and analysis are based
on available reports and statistics concerning the Indonesian energy sector and
finance sector as well as bilateral discussions with various stakeholders. Most
of these stakeholder discussions were held during a fact-finding mission on
–August.
The barriers faced by renewable energy power generation projects in Indonesia are
idenfitifed and summarized in chapter III. Some of the barriers can be addressed by
various financing instruments, whereas some of them are of such nature that the
means of intervention other than financing have to be used. Therefore, many but not
all barriers can be addressed by the ERF concept presented in this report, but if other
issues are not addressed, the financing instruments alone might not help to jump-
start the renewable energy power generation market.
Chapter IV categorizes the barriers faced and identifies the main types of
financial interventions available to address such barriers. These interventions
include (i)viability gap funding, (ii) project development funding, and (iii) credit
enhancement funding.
Description and analysis of pros and cons of possible financing instruments for
each type of financial intervention are provided in chapter V. The list of financial
instruments identified and evaluated in the chapter is not exhaustive (theoretically,
there could be an indefinite number of instruments), but it makes an attempt to list
the main instruments mostly used to address similar investment barriers in renewable
energy markets in other countries. Chapter V also makes a suggestion on preferred
financial instrument(s) for each type of financial intervention needed.
Chapter VI includes a review of similar schemes in other countries. The chapter
takes the suggestions in chapter V as a starting point, and provides successful
real-life examples of each proposed financial instrument from other countries.
The description and evaluation of instruments and experiences in other countries
also include an assessment to which extent these experiences are applicable in the
context of Indonesia.
Chapter VII makes a proposal for institutional setup, governance structure,
organization, and a rough assessment of needed resources and expertise of the ERF.
The more detailed concept for each of the three funding windows of the ERF
(Viability Gap Fund [VGF], Project Development Fund [PGF], and Credit
Enhancement Fund [ECF], and the technical assistance embedded in these) is
presented separately for each funding window in chapter VII to chapter X. The
concept design addresses the following topics separately for each proposed window
(or financing instrument):

Introduction and Background
3
(i) description of the instrument,
(ii) eligibility criteria,
(iii) main terms and conditions of the instrument,
(iv) solicitation and selection process,
(v) timing and volume considerations, and
(vi) technical assistance needs.
Chapter XI addresses the challenges to capitalize the ERF and potential sources of
funding. Since the funding instruments are fundamentally dierent from each other
(especially the VGF), this discussion is split in separate subchapters for each of the
three instruments. The discussion includes the type of funding needed for each
financing instrument, volume and sizing aspects, as well as potential sources available
for each type of funding and possible blending of dierent types of financing within
the ERF.
W
ith its over million people, Indonesia has the fourth largest population
in the world. At the same time, the per capita power consumption is low,
about megawatt-hour (MWh) in , leading to total power demand of
terawatt-hours (TWh), total installed capacity of about gigawatts (GW) and power
generation of about TWh, according to PricewaterhouseCoopers (PwC ).
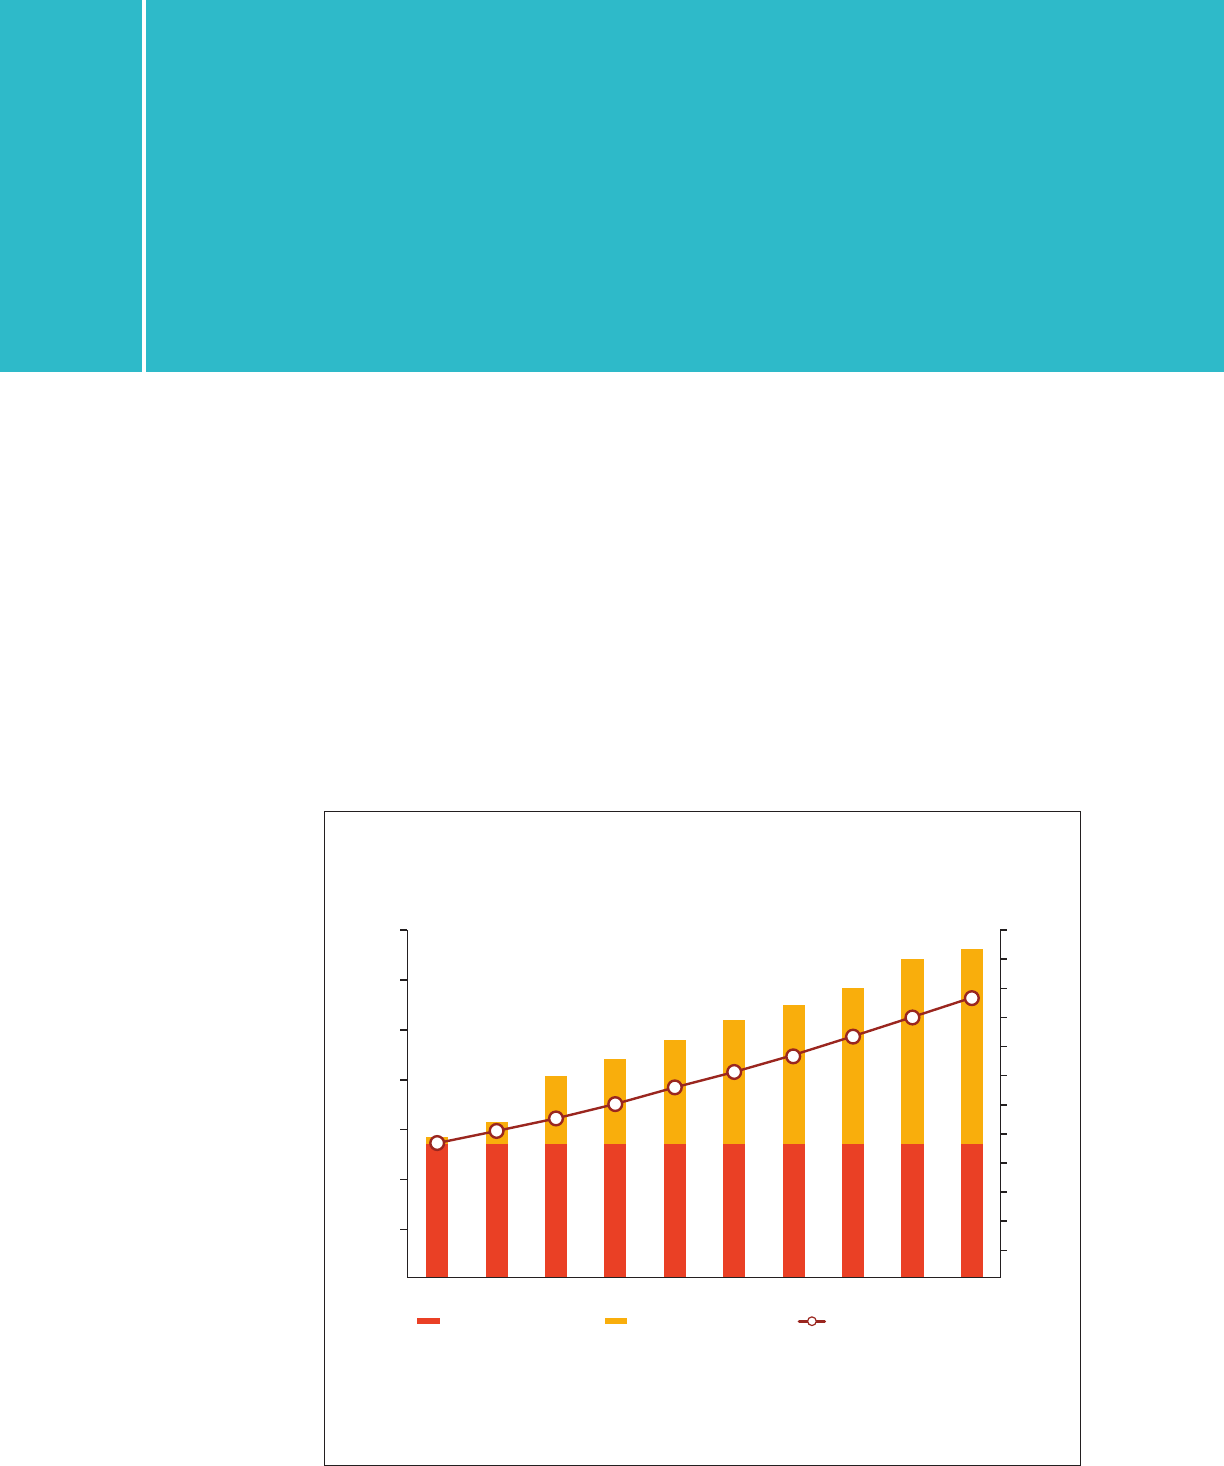
The economy of Indonesia is estimated to grow at per annum in the next years (The
Economist ). At the same time, the growth of power consumption is estimated to be as
high as ., leading to more than doubling of electricity demand to TWh by and
installed power generation capacity to GW as shown in Figure (PT Perusahaan Listrik
Negara ). In other words, by the power consumption will increase by about
TWh and the installed capacity by GW.
Figure 1: Development of Power Demand and
Installed Generation Capacity
(–, according to Rencana Umum Penyediaan Tenaga Listrik)
GW gigawatt, GWh gigawatt-hour, MW megawatt, TWh terawatt-hour.
Sources: State electricity company PT Perusahaan Listrik Negara () and
PricewaterhouseCoopers ().
Total capacity (GW)
TWh
140 600
550
500
450
400
350
300
250
200
150
100
50
120
100
80
60
40
20
2017 2018 2019 2020 2021 2022 2023 2024 2025 2026
Electricity demand (GWh)Existing capacity (MW) Additional capacity (MW)
II. Current Situation
Current Situation
5
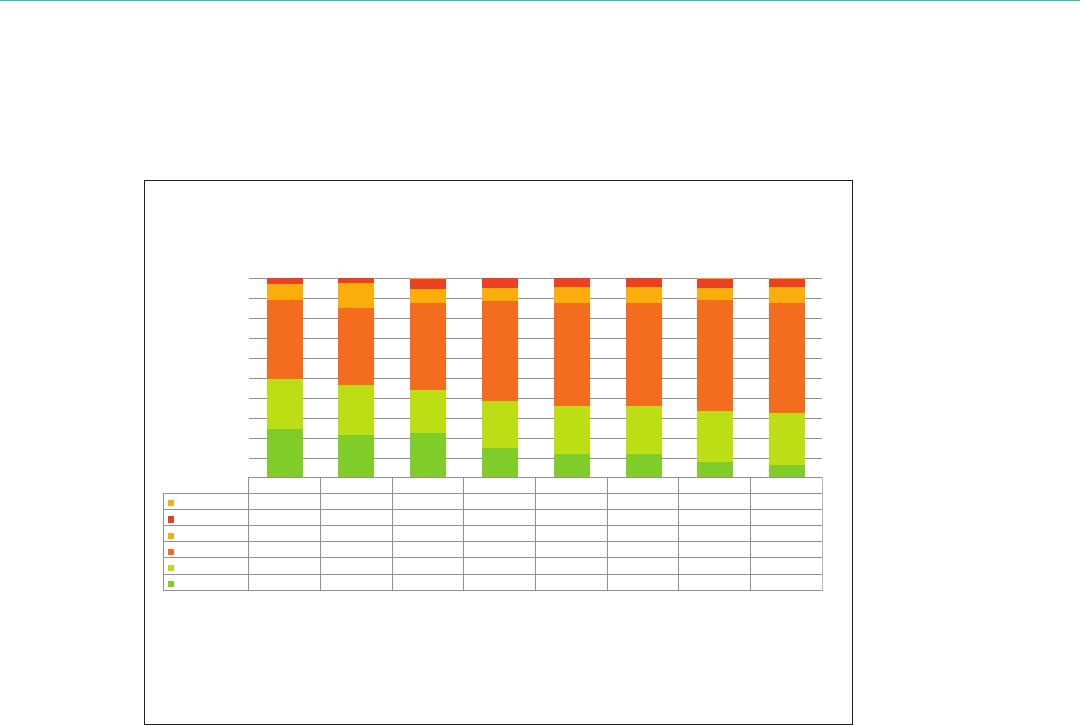
Another challenge in the power sector in Indonesia is the rapid increase of the use of
coal and generally high dependence on fossil fuels, as shown in Figure .
Although Indonesia is committed to a greenhouse gas emission reduction target
from the baseline in its Nationally Determined Contribution to the Paris climate
agreement under the United Nations Framework on Climate Change (UNFCCC),
and has a conditional commitment to reduction with international climate
finance (IRENA ), it has not been able to remarkably increase the share of
low-carbon power generation in its power generation mix. Instead, the share of coal
has increased from below to about today, and the share of all fossil fuels in
power generation mix has remained close to during the whole decade.
Increasing the share of renewable energy in the total energy mix would be good not
only for Indonesia’s greenhouse gas emission reduction targets but also for gross
domestic product, employment, trade balance, and welfare. According to IRENA
(), accelerated renewable energy deployment to double the share of renewable
energy in the energy mix from to could increase Indonesia’s gross
domestic product by .–. in compared with baseline, mainly as a result
of higher overall levels of investment in the energy sector. Indonesia’s trade balance
could improve by .–. by . The number of renewable energy-related
jobs in Indonesia could increase to . million by , respectively, compared with
about , in . At present, more than of renewable energy jobs are
in the labor-intensive palm oil-based biodiesel industry, but mobilizing investment
in the electricity and industry sectors, for example, would lead to diversification of
renewable energy-related jobs in Indonesia. The increased share of renewable energy
would also lead to positive social and environmental impacts, such as reduction of
Other NRE
Geothermal
Hydro
Coal
Gas
Oil
100%
0.00%
3.00%
8.00%
39.00%
25.00%
25.00%
0.00%
3.00%
12.00%
38.00%
25.00%
22.00%
0.07%
5.13%
6.80%
44.06%
21.00%
22.95%
0.11%
4.85%
6.39%
50.27%
23.41%
14.97%
0.16%
4.42%
7.73%
51.58%
23.56%
12.54%
0.11%
4.44%
6.70%
52.87%
24.07%
11.81%
0.20%
4.34%
5.93%
56.06%
24.89%
8.58%
0.24%
4.33%
7.88%
54.69%
25.89%
6.97%
90%
80%
70%
60%
50%
40%
30%
20%
10%
0%
2009 2010 2011 2012 2013 2014 2015 2016
Figure 2: Development of the Power Generation
Mix in Indonesia in 2009–2016
NRE new and renewable energy.
Sources: PricewaterhouseCoopers () and Laporan Kinerja Direktorat Jendaral
Ketenagalistrikan ().

Renewable Energy Financing Schemes for Indonesia
6
local pollution and related negative health impacts and environmental and material
degradation.
However, renewable energy power generation is facing a number of challenges that
are prohibiting project development pipeline from being implemented. For example,
currently, there are small-scale renewable energy projects and project developers
under the independent power producer (IPP) scheme that have signed a PPA with
the PT Perusahaan Listrik Negara (PLN, State Electricity Company), but which face
challenges to implement the projects. Some of these challenges are attributable to
the resources and capabilities of the project developers to develop bankable projects,
but it is also widely accepted that the PPAs signed between IPPs and the PLN are not
bankable. One reason in many cases is the very low-price level, but also other terms
and conditions are posing prohibitive challenges to raise financing to implement
these projects. Also, PLN’s lack of experience in managing variable renewable energy
generation as part of the power mix is seen as a challenge by some stakeholders.
These challenges are identified and discussed more in the next chapter.
Further, based on the stakeholder discussions during the fact-finding mission, it is
not likely that, in the short term, the existing or new PPAs signed by the PLN would
be modified to have cost-reflective taris making the internal rates of return (IRRs)
of the projects sucient to make them bankable. It was also considered unrealistic
by various stakeholders to propose a new regular competitive auction scheme for
renewable energy, whereby the PLN would invite bids and award bankable long-term
PPAs through IPP or public–private partnership (PPP) schemes. Therefore, in the
near future, any fund structure should be based on the current state of unoptimal
and (at least in many cases) non-bankable PPAs with too low prices. According
to stakeholder meetings during the fact-finding mission, the same applies to the
concessions under the electrification scheme, which is another current and important
part of the renewable energy project pipeline in Indonesia.
Reflecting the current situation against the design criteria for the contemplated
Renewable Energy Fund (REF), specifically that the REF should “avoid a complex
financial structure and aim at a time-limited support scheme that helps jump-start
the development of renewable energy generation resources and can be implemented
on a fast-track basis,” it can be concluded that:
(i) the REF concept should not assume project development and PPA
procedures, nor the terms of PPAs, as currently applied by PLN to be
changed, but the REF should work in the current context;
(ii) the same applies to other renewable energy sectors, including concessions
under the electrification scheme;
(iii) therefore, the most feasible way forward to jump-start the renewable energy
market with a time-limited support scheme implemented on a fast-track
basis is to create “PPA- and concession-external” interventions only;
(iv) jump-starting the market fast also indicates that the intervention should
target the existing project pipelines—instead of proposing to create new
project pipelines, which is time consuming;

Current Situation
7
(v) even if the current project pipelines consist mostly of small-scale projects
(such as IPP and electrification schemes), this seems to be a needed step
to help create and mobilize the renewable energy market in Indonesia, and
also beneficial from PLN’s perspective to gain experience and track record to
manage variable renewable energy generation in its power system;
(vi) therefore, the REF concept proposed in this report could also be called
“phase interventions”;
(vii) if the proposed “phase interventions” in this report are implemented and
turned out to be eective, the target, scope, and resources of the REF can be
expanded in the next phase to provide more funding to a larger number of
larger projects;
(viii) therefore, one of the first steps of jump-starting the market is likely to be
a demonstration and piloting phase in the range of MW and less than
TWh of new generation, while the needed scale of tens of gigawatts should
be targeted in the next phases; and
(ix) therefore, the objective of the REF is building the market and capabilities as
much as adding new renewable energy capacity, which should be clearly seen
in the structure, modalities, and resource allocation of the REF.

he main challenges for financing renewable energy power generation investments
have been analyzed in earlier studies and identified as:
(i) low taris, making renewable energy investments unprofitable in many cases;
(ii) high interest rates of loans, further reducing the returns of typically capital-
intensive renewable energy investments;
(iii) high collateral requirements and absence of project finance, making it dicult to
raise debt financing for renewable energy investments;
(iv) build–own–operate–transfer (BOOT) structure in PPAs, instead of build–own–
operate structure;
(v) project scale of small and medium-sized projects increases the project
development and transaction costs, and related risks in relation to investment cost,
creating challenges to do high-quality project development work, which reduces
options in financial structuring and arrangements (especially project finance);
(vi) capacity of project developers (technical and financial) and financial institutions
(technical) is too limited on average, making it challenging to develop high-
quality projects by developers, and evaluating projects and structuring finance by
financiers;
(vii) local content requirements make it challenging to design projects in a cost-
ecient way; and
(viii) uncertainty related to requirements, timelines, and outcomes of licensing and
permitting procedures create unreasonably high risks for project developers.
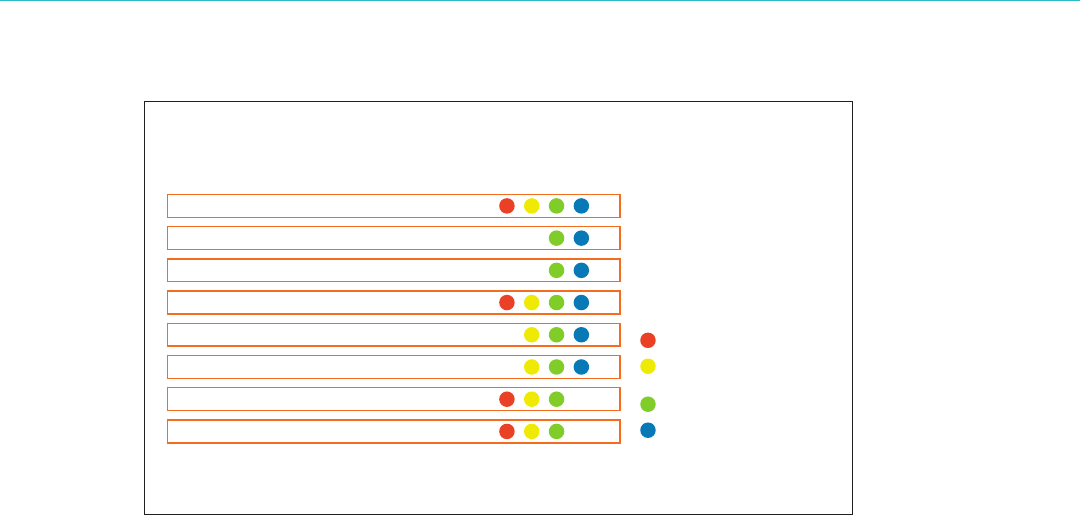
Removing or mitigating the above investment barriers requires work by and cooperation
between multiple stakeholders in various forms. In fact, removing a single barrier often
requires more than just one intervention by one stakeholder. Therefore, also a potential
REF could help overcome many but not all of the challenges, and not all of them alone.
Figure summarizes the relevant investment barriers, and the primary stakeholder groups
needed to address each of them.
Financial institutions—private or public—are not capable of eciently solving challenges
related to local content, license, and permit issues. These need to be addressed by the
government and regulators, preferably in cooperation with project developers and sponsors.
In contrast, the first six challenges can be directly addressed by financial interventions
and institutions, especially public financial institutions, and in close cooperation with the
government and the power utility in most cases.
III. Challenges
T
Challenges
9
Theoretically, some of these barriers would be most eciently addressed by
improving the investment frameworks to reduce the real underlying risks and
internalize external costs and benefits. However, in a second-best world, such barriers
may exist, therefore justifying the need for financial interventions. This does not
mean that the government, electricity utility, regulators, developers, sponsors, banks,
and other stakeholders should not work toward developing a better investment
framework to reduce the need for specific financial interventions and direct subsidies.
In fact, as mentioned, one of the main objectives of the proposed ERF concept is to
help the relevant stakeholders build capabilities and improve market and investment
frameworks.
The proposed ERF concept seeks to find solutions to mitigate, or contribute positively
to the mitigation of, the following investment barriers labeled with blue dot in
Figure:
(i) typically, too low tari (e.g., PPAs or concessions), making the internal rate of
return (IRR) of renewable energy investments too low for investors;
(ii) high interest rates of debt, leading to high cost of finance of projects,
therefore reducing the (equity) IRR further and making the investments less
attractive to investors;
(iii) high collateral requirements by banks, making it dicult to raise debt in the
absence of large balance sheets by developers and project sponsors;
(iv) BOOT structure of PPAs limiting the potential revenue-generation period of
projects;
(v) project scale and related high development and transaction costs in relation
to size of the total investment, combined with generally high-risk profile of
project development; and
(vi) limited financial and technical capacity of project developers, and limited
technical capacity, experience, and track record of financial institutions.
1. Tariff
2. Loan interest
3. Collateral
4. Build–operate–own–transfer
: Government
: PT Perusahaan Listrik Negar
a
(State Electricity Company)
: Developer/investor
: Financial institutions
5. Project scale
6. Project developer and financial institution capacity
7. Local content
8. License and permits
Figure 3: Investment Barriers and Relevant Stakeholders
to Address Them
Source: ADB.

Renewable Energy Financing Schemes for Indonesia
10
The following section will elaborate each of these challenges separately and present
potential solutions to them. The list of financial instruments or approaches is not
exhaustive since, theoretically, there could be an indefinitive amount of financial
interventions. The objective is to list all the main instruments that are mostly used
to address similar barriers in various countries around the world. The defined design
parameter that is “easy-to-implement” also justifies using experiences and lessons
from existing and tested solutions in other countries as much as possible.

S
ome of the listed barriers share same features and/or causes. Therefore, it may be
feasible to try to cluster the barriers. This enables both finding suitable financial
interventions and reducing the amount of the financial interventions; some of the
barriers can be addressed by one type of intervention. The identified barriers that can be
targeted through financial interventions can be grouped into three, which will be discussed
in this chapter:
(i) viability gap or lack of profitability,
(ii) lack of technical and financial resources during project development stage, and
(iii) lack of debt finance at reasonable terms and conditions.
A. Viability Gap or Lack of Profitability
In Indonesia, the renewable energy power taris in grid-connected projects depend on the
location and are generally set at maximum or of the prevailing tari in the same
region as applied by the PLN. In many cases, this tari level is too low to provide suciently
high return for project sponsors on their investment. In addition, the definition of
“maximum tari” means that PLN, as the otaker, has certain level of freedom to negotiate
these taris case by case, making the pricing process intransparent and the resulting PPA
prices dicult to estimate beforehand by developers. These are fundamental issues that
have to be solved by defining a tari level that is sucient for project sponsors to make an
investment decision, and the level of which is established in a clear and transparent way.
The main approaches to address the viability and profitability issues in other countries are:
(i) fixed feed-in tari,
(ii) fixed premium,
(iii) competitive auctioning of long-term PPAs,
(iv) competitive auctioning of a top-up premium on top of predetermined tari or
market price, and
(v) investment grants.
Among the most fundamental dierences is the award or selection process. Traditionally,
during the previous decade, the “first come, first served” approach was more popular, i.e.,
developers and sponsors whose projects met certain predetermined eligibility criteria were
automatically granted the predetermined fixed feed-in tari or premium tari, or were
awarded this tari after case-by-case evaluation against such eligibility criteria.
IV. Definition of Design Parameters
and Design Options

Renewable Energy Financing Schemes for Indonesia
12
In this decade, dierent types of competitive auctioning procedures have come to
dominate the selection and award processes of PPAs and premium taris, both in
developed and developing country renewable energy markets. Typically, auctioning
is arranged so that the lowest bids until the targeted volume is contracted will be
awarded a bankable long-term PPA at the price (/MWh) the bidder indicated in
its bid (pay-as-bid). Subsequently, the national utility or other market operator is
required (as the counterparty to the PPA) to o-take the power generated by the
project at the specified pay-as-bid price.
In rarer cases, the competitive auctioning has concerned a premium that is paid on
top of the prevailing tari or PPA or a wholesale power market price. In such schemes,
the awarded projects will sell the power in the market (or under the PPA) according
to normal regulations or the market price and will receive a premium on top of the
market price or prevailing regulated tari (i.e., primary revenue stream). The reasons
for auctioning the premium instead of the total price of electricity have been twofold
in dierent countries.
First, premium taris have been seen as less market-distorting in more privatized and
competitive electricity markets where the market price fluctuates and the producers
have to continuously respond to the price signal provided by the changes in supply
and demand balance. If the renewable energy producers were awarded a fixed-
price PPA (instead of a premium on top of the market price), the renewable energy
producers would have no market price risk and not need to take the fluctuations
in supply and demand and the resulting price fluctuations into account; thereby
lowering the average market price, increasing the price volatility in the market, and
causing market distortions. This is one of the reasons why, for example, Finland chose
to go for competitive auctioning of long-term premium rather than PPA for renewable
energy projects.
Second, in some cases, it may be useful to clearly and transparently separate the
subsidy or incentive component from the base power price or tari. This is related
to the funding of the scheme. Again, for example, in Finland where the additional
cost is charged to taxpayers, it has been seen important to distinguish clearly the
subsidy component from the market price component (in addition to aiming for
less market-distortion). Similarly, in some developing countries where development
finance institutions may provide funding to support such schemes, it is important
to distinguish the base tari or PPA price and the premium component clearly, and
in an unambiguous manner since the funding for these revenue streams come from
dierent sources.
Of the PPA auctions, there is a vast amount of increasingly encouraging examples,
and, in fact, it has become globally the main approach to award PPAs and determine
price levels in the renewable energy sector. Of the premium auctions, the Global
Energy Transfer Feed-in Tari (GET FiT) scheme of German development
cooperation through Kreditanstalt für Wiederauau (KfW, Credit Institute for
Reconstruction) in Uganda and Zambia, as well as the auctioning scheme to be
implemented in Finland in are good examples, and will be described in more
detail later in this report.

Definition of Design Parameters and Design Options
13
Investment grants have been more popular in the early days of renewable energy
technologies and are still used often in the context of newer and still unproven
technologies. However, investment grants are less typical when promoting mature
renewable energy technologies; the profitability is typically stimulated by enhancing
the cash flows of the project rather than contributing to the initial investment cost
directly. But both systems exist and, in some cases, are even used as a combination, as
will be shown later.
B. High Transaction Costs, Risks of Project Development,
andLimited Capacity by Developers and Financial Institutions
Renewable energy investments are often (although not always) smaller compared
with conventional power generation projects. More often, the renewable energy
projects are in the range of single- and double-digit MW of installed capacity,
whereas the conventional power generation projects are in the range of double- or
three-digit MW of installed capacity, or more. For example, in project finance (also
known as non- or limited-recourse lending), smaller banks often have a lower limit
of million– million for projects, and in larger banks the lower limit can be in
the range of million– million because of high transaction costs of project
finance. Also, since permitting and other regulations tend to be less clear for newer
renewable energy tehchnologies than they are for conventional power generation
investments, the relative risks, project development, and transaction costs tend to
be higher and lead times longer, reducing the incentive for project development, and
increasing the required returns (i.e., cost of capital) and, therefore, the levelized cost
of electricity for renewable energy investments.
Also, renewable energy project developers tend to be more diverse, many of them
being small and medium-sized enterprises with limited financial (and sometimes
also technical) capacity to produce high-quality documentation and develop
high-quality projects that are solid enough to obtain needed permits, licenses, and
financing.
The identified challenges can be bundled in a broad group of project development
stage barriers and related financial challenges. In the context of renewable energy
project development, typical financial interventions that have been used to address
these challenges are the following:
(i) Technical assistance and capacity building, i.e., by providing external
experts free of charge to help not only project developers but also lenders
and regulators in project development process; this provision of external
expertise can be both direct project-specific support and more general or
programmatic activity, such as training and education.
(ii) Provision of grant funding for project developers, which help them to
develop higher-quality projects and related documentation, especially by
using external experts (technical, financial, legal, and others) to produce
bankable resource analyses and production estimates, grid studies,
environmental and social impact assessments (ESIAs), technical design

Renewable Energy Financing Schemes for Indonesia
14
documents, financial models and plans, drafting bankable agreements, and
other required documentation.
(iii) Provision of risk finance for project developers to help them do the same.
Project development support has often been based on provision of technical
assistance and cash grants on a discretionary basis after case-by-case evaluation.
However, more recently, (i) more competitive selection procedures (e.g., so-called
“challenge funds”), as well as (ii) use of more financial instruments and reimbursable
grants can be observed.
C. High Perceived Risk by Banks and Other Financial Institutions
High perceived risk by lenders can result in higher required returns (i.e., interest rates)
and stricter risk mitigation measures (including collateral, liquidity, and covenants).
In this case, the main barriers resulting from high perceived risk are high interest rates
required and short tenors allowed by financial institutions (Barrier ) and excessive
collateral requirements (Barrier ). In addition to real risks, these issues can result
from (i) lack of information, understanding, and track record; (ii) lack of or conflicting
incentives; and (iii) lack of competition among financial institutions because of
shallow domestic capital market.
In some stakeholder meetings, it has been observed that the banking sector in
Indonesia is generally much more accustomed to corporate (balance sheet) finance
and less to project finance.
In this context, typical financial interventions that have been used to address lending
challenges are:
(i) providing partial guarantees for lenders either covering part of all credit risks,
or covering certain specific risks;
(ii) colending between development finance institutions (who may have more
experience and/or higher risk tolerance) and commercial lenders;
(iii) onlending whereby development finance institutions provide credit lines for
commercial lenders on softer or concessional terms, who then can blend
this funding with their own commercial funding when exending debt for
renewable energy investing;
(iv) a debt fund operating as an independent lender, which may or may not invest
together with commercial lenders;
(v) interest rate subsidy or interest rate buy-down as a direct subsidy for banks
and project sponsors to pay part of the interest rate required by the banks
that is seen excessive from projects’ perspective, thereby lowering the cost of
capital of renewable energy investments; and
(vi) capacity building for financial institutions to help them understand
renewable energy investments and to support them in investment appraisal
and financial structuring.
The aforementioned approaches may enable private financial institutions to
(i)extend debt to renewable energy investments at reasonable terms and conditions

Definition of Design Parameters and Design Options
15
even in the existence of high perceived risk and (ii) gain experience, build capacity,
and track record to provide debt with limited or no support in further lending to
similar investments. There are remarkable dierences between the approaches.
Guarantees on one hand are indirect funding, i.e., in the base case the funds are not
disbursed at all, just committed to cover potential losses borne by lenders. Colending
and onlending as well as stand-alone debt fund are direct financing in the sense that
the funds are actually disbursed and used to implement projects, and become part
of the renewable energy project’s balance sheet, and will be gradually repaid with a
return. Finally, the interest rate buy-down is a direct subsidy instead of a financing
instrument. In contrast to guarantees and lending, it is not repaid or released and it
will not generate returns; it is “lost money” by definition from the ERF’s point of view.
This can also be seen as a rough order of prioritization between these instruments:
the better functioning, deeper, and more liquid debt capital market, the more it
usually makes sense to provide guarantees in the first place and let the debt capital
market reprice the debt and do the lending. If the capital market is too shallow,
illiquid, or otherwise nonfunctional, the case for direct colending and onlending, or a
stand-alone debt fund, may become more relevant. Finally, if nothing else works, and
a direct subsidy intervention is needed, the interest rate subsidy may be an option.
However, it is recommendable and usually more cost ecient first to seek ways to
reduce the real and perceived risk and incentivize the market to reduce the interest
rates.

B
ased on the previous section, the main options for financial inverventions can be
summarized as shown in Figure . It is proposed to establish three funding
instruments/sub-funds under the ERF to address the specific barriers. In this
chapter, the pros and cons of the main options, as listed under each sub-fund, are
evaluated, and recommendations for preferred instrument(s) for each sub-fund will be
proposed.
A. Viability Gap Funding
. Option Viability Gap Funding : Fixed Tari
Pros:
• successful in initially establishing renewable energy markets “from scratch” in many
countries
• incentivizes investors and lenders by securing long-term stable cash flow as long as
the perceived technology risk is low, i.e., the technology is considered proven
• incentivizes project development by providing predetermined tari level and
eligibility criteria for developers; developers know already in project development
stage that their project will be eligible for the tari, which will also make it easier
to secure financing, if they are able to carry out the needed studies and obtain the
needed land-use rights, permits, licenses, and agreements
• usually simple, transparent, and clear
Figure 4: Proposed Three Types of Financial Interventions,
and Potential Solutions for Each
PPA power purchase agreement.
Source: ADB.
Viability Gap Funding
1. Fixed tariff
2. Fixed premium
3. Competitive auction of PPAs
(i.e., tariff)
4. Competitive auction of premium
5. Investment grant
Project Development Funding
1. Technical assistance and
capacity building
2. Project development grants
3. Project development risk finance
Credit Enhancement for
Investments
1. Guarantee
2. Onlending/credit line
3. Colending
4. Stand-alone debt fund
5. Interest rate subsidy
6. Technical assistance and
capacity building
V. Evaluation and Recommendations
on Financing Instruments
for Identified Financial
Intervention Needs

Evaluation and Recommendations on Financing Instruments for Identified Financial Intervention Needs
17
Cons:
• setting taris is challenging; the political process often results in unoptimal level
• too low tari will not encourage project development and investment, and can
put the sector in a standstill
• too high tari overstimulates the sector, leading both to high cost for the
government in the form of excessive taris, encouraging implementation
of projects in unoptimal locations as projects can be profitable even in low-
resource locations, and possibly leading to bottlenecks in supply chains and
increase of development and implementation costs
• political risk related to tari levels and their stability in future can be
questionable, especially if the energy or fiscal policies are unstable more
generally
• dicult to take into account the development of the cost-competitiveness
of technologies; sometimes an annual percentage reduction of taris for new
projects is applied, but this cannot be accurately matched with the actual cost
development of technologies
• would be a parallel and duplicate procedure for the current regulations in
Indonesia, not complementing the existing ones
. Option Viability Gap Funding : Fixed Premium
Pros:
• may be less distorting in a competitive or liberalized electricity market where
prices fluctuate based on demand and supply, and where the generators have
market price risk
• may be better than fixed tari for the renewable energy sector in the long-term
by incentivizing the renewable energy generators in market integration (both
in terms of managing potential price risk as well as technical power system
integration)
• makes the subsidy component in power pricing more transparent
• provides investors and lenders with higher revenues, but same market risk as for
other forms of generation
• incentivizes project development by providing preset eligibility criteria for
developers; developers know already in project development stage that their
project will be eligible for the tari, which will also make it easier to secure
financing, if they are just able to get the needed land-use rights, permits, and
licenses
• usually simple, transparent, and clear
• can work as a complementary mechanism to an existing market or revenue
mechanism
Cons:
• compared with fixed taris, riskier for investors and lenders in markets where
underlying market prices tend to fluctuate, leading to higher cost of capital, and
sometimes even non-bankability of the projects because of too high expected
cash flow volatility

Renewable Energy Financing Schemes for Indonesia
18
• in markets with price risk, leads to higher required subsidy, especially as
renewable energy-based power generation is generally more capital intensive
than conventional power generation
• setting taris is challenging; the political process often results in nonoptimal
level
• too low tari will not encourage project development and investment, and can
put the sector into a halt
• too high tari overstimulates the sector, leading both to high cost for the
government in form of excessive taris, and encourages implementation of
projects in nonoptimal locations as projects can be profitable even in low-
resource locations
• political risk related to tari levels and their stability in the future can be
questionable, especially if the energy or fiscal policies are unstable more
generally
• dicult to take into account the development of the cost-competitiveness
of technologies; sometimes a fixed percentage reduction of taris for new
projects is applied, but this cannot match with the actual cost development of
technologies
• if the price setting procedures (through PPAs or fixed taris) are intransparent
and speculative, the combination with a premium can cause unnecessary
subvention; i.e., taris are negotiated lower by the o-taker than in the base
case, in anticipation of higher premium or subsidy provided by the government
or VGF
• in practice, has not be very widely used compared with fixed taris
. Option Viability Gap Funding : Competitive Auction of Power
Purchase Agreements
Pros:
• provides the investors and lenders with long-term cash flow certainty in the
same way as fixed tari scheme, therefore lowering the cost of capital and
improving the bankability of projects
• after some unsuccessful and nonoptimal implementations in s (such
as in the United Kingdom), and after the “golden age of feed-in taris”
in –, competitive auctions of PPAs have been implemented
increasingly successfully in increasing number of countries to promote
renewable energy investments within this decade; a vast amount of good
practices and success stories is available to be learned and applied
• many renewable energy developers, investors, and lenders are already
knowledgeable and experienced in PPA auction systems and can participate
routinely
• leads to more ecient price setting than fixed taris by compelling the
developers and investors to reveal their true competitive price level
• tracks automatically the changes in cost-competitiveness of renewable
energy technologies; a competitive setting prices of subsequent auctions are
adjusted by the bidders to take into account lowered investment costs, higher
productivity, and lower cost of capital of renewable energy technologies as they
develop further

Evaluation and Recommendations on Financing Instruments for Identified Financial Intervention Needs
19
• allocates resources more eciently; projects in better locations and with better
designs will be more competitive than those less professionally developed and
located in less-attractive areas
• better government control than in fixed tari and premium: it is possible
to define a maximum price to cap the cost of the scheme, and possible for
government to control the volume by capping the capacity to be contracted at
a time and during a specified period
Cons:
• riskier for project developers and, therefore, does not provide as strong
incentive for project development as fixed taris (or premium) since there is
no similar certainty of cash flow as in these schemes. The developer or sponsor
needs to compete against other market players.
• requires more market and renewable energy sector understanding from the
regulator and the government in order to design a good scheme than fixed tari
and premium schemes
• requires more resources to plan, implement, and monitor the system than fixed
tari and premium schemes
• risk of opportunistic behavior; if the sanctions of nondelivery or delays are low
or do not exist at all, can lead to extremely low pricing and unviable projects,
which will finally not be implemented (as what happened in the United
Kingdom’s Non-Fossil Fuel Obligation scheme in s)
• even appropriate sanctions in some countries have led to such a high level
of competition and aggressive pricing that policy makers and regulators have
become concerned about the viability of winning projects
• the bankability of a competitive auction system depends largely on the
creditworthiness of the o-taker and the bankability of the PPA; if one of these
are inadequate, some form of external support is required
• as a separate viability gap funding measure, duplicates the existing regulations
and solicitation procedures instead of complementing them
. Option Viability Gap Funding : Competitive Auction of Premium
Pros:
• similar to competitive auctioning of PPAs regarding ecient price setting,
adapting to cost changes, governance requirements, and government control
• similar to fixed premium schemes regarding the market integration especially
in more liberalized, open, and competitive electricity markets with fluctuating
prices, and regarding making the subsidy component more transparent
• can work in context where the expected price level is higher than the prevailing
market price or general tari level, therefore complementing rather duplicating
existing PPA solicitation and negotiation procedures
• if the price setting procedures (through PPAs or fixed taris) are intransparent
and speculative, the combination with a premium can cause unnecessary
subvention; i.e., taris are negotiated lower by the o-taker than in the base
case, in anticipation of higher premium or subsidy provided by the government
or a viability gap scheme

Renewable Energy Financing Schemes for Indonesia
20
Cons:
• much less used than competitive auctions of PPAs, therefore less experiences
and lessons from schemes in other countries; however, examples can be found
in Finland, Uganda, and Zambia
• not suitable in cases where renewable energy is expected to be cheaper than
the prevailing market price or general tari; in such case, the auction should
lead to winning contracts at zero premium requested, unless negative premium
is allowed. In order to materialize the cost-competitiveness of renewable
energy, the scheme should be based on PPA auction (enabling bids lower than
the market price/regulated tari)
. Option Viability Gap Funding : Investment Grant
Pros:
• from investor perspective, lower risk; allocates more risk from investors to
the government or VGF since all cash is received upfront before the actual
generation takes place, while the other schemes are more results based, i.e.,
rewarding according to the actual generation
• helps in financial arrangements directly and decreases the absolute amount
of financing required as the funds are made available at the time of initial
investment or construction stage already, whereas the other schemes support
the financial arrangements of initial investment only indirectly
• in theory, if the government or VGF’s cost of capital (and, therefore, discount
factor applied) is lower than that of investor, investment grant would be
cheaper for the former, and more valuable for the latter; lower total amount of
subsidy would be required
• simple scheme from governance point of view
• vast amount of experiences and lessons from other countries
• typical instrument when supporting the demonstration and commercialization
of new technologies
• can complement existing PPA solicitation procedures and other prevailing
price setting mechanisms, rather than duplicating them and creating a parallel
market.
Cons:
• upfront funding transfers risk from investor to government or viability gap
scheme; less of a problem for proven low operational expenditure technologies
such as solar, wind, and hydro, which will most likely maximize their generation
in all scenarios, but can be an issue in case of bioenergy projects where
generation could be lower than expected (or project totally terminated)
because of high cost of unavailability of biofuel, or biofuel could be replaced by
fossil fuels
• requires substantial upfront disbursements from the government or VGF in a
relatively shorter term than in the other schemes where the cost acculumates
over longer term; could be an issue from the budgeting perspective
• although the funds are disbursed faster, rules and monitoring of
implementation must be in place also afterwards to ensure that the projects are
implemented and operated according to the initial eligibility criteria

Evaluation and Recommendations on Financing Instruments for Identified Financial Intervention Needs
21
• if the price setting procedures (through PPAs or fixed taris) are intransparent
and speculative, the combination with investment grant can cause unnecessary
subvention; i.e., taris are negotiated lower by the o-taker than in the base
case, in anticipation of higher grant/subsidy provided by the government/VGF
. Summary, Conclusions, and Recommendations
Currently, the revenues of renewable energy investments are based on a predefined
tari structure that, on the other hand, in many cases, is negotiable and therefore
uncertain, and with a cap that in many cases is too low for investors to generate
sucient returns. On the other hand, in some locations, the tari levels could be
sucient to justify an investment. The electricity market is noncompetitive, primarily
a single-buyer market, where market-based (supply and demand balance) price
fluctuations do not exist.
As there is no competitive electricity market and related price risk, market integration
(or avoidance of distortion) is not as important as in countries with liberalized and
competitive electricity market. Also, as long as the underlying power price (through
PPA or concession taris) is not predefined, there is a risk that a premium (either
fixed or competitive) or an investment grant can lead to “game-playing” where
unnecessarily low taris/PPA prices emerge, with the anticipation of a viability
gap funding scheme to cover larger part of the revenues of projects. Therefore,
the scheme should be such that it gives the developers an incentive to always
maximize the tari in the PPA or other primary revenue streams determined in PPA
negotiations (IPP scheme), concession taris (electrification scheme), or other.
Based on the fact-finding mission, currently it seems not possible to propose changes
to the current PPA or concession procedures, and therefore a PPA or a fixed tari
scheme would need to be separate from the current procedures, and therefore
would create a parallel market, which is not feasible. Probably, it would also require
regulatory changes. Therefore, only way forward would be to work on the basis of the
current PPAs and concessions and create a VGF mechanism (see Box ) that would
complement rather than duplicate/circumvent the current system. In practice, PPA
auctions or fixed taris are not an option, and the remaining options are premium
(fixed or auctioned) and investment grant.
Production-based premium or investment grant on top of the primary revenue stream
would make the subsidy element more transparent for the government and funders of
the VGF. Such scheme could be justified if the underlying power price was suciently
transparent, and not aected by anticipated existence of a subsidy scheme. Also, it
would be able to work independently from the current PPA or concession procedures
by PLN and the government, complementing them instead of intervening them or
creating a duplicate/parallel procedure.
Further, in some locations, if it is likely that some project types would be competitive
against/cheaper than prevailing tari levels, in some cases a premium should result to
zero, and in fact theoretically be negative in order to materialize the cost-eciency of
renewable energy in best locations. Therefore, since the tari levels and profitabilities

Renewable Energy Financing Schemes for Indonesia
22
between renewable energy projects can be expected to vary considerably, seeking to
establish an ecient and competitive price premium for renewable energy projects
would be reasonable. Projects that have a signed PPA, concession, or similar revenue
stream will be able to calculate the lowest additional premium level they would need
to make their projects profitable. Therefore, such projects could bid for premiums in a
competitive process.
B. Project Development Funding
. Option Project Development Funding : Technical Assistance and
Capacity Building
Pros:
• The provider of the technical assistance and capacity building, such as the PDF
in this case, has more control on the procurement and provision of the services.
For example, it is possible to have a list of accredited service providers from
which project developers can select, or the PDF can use competitive process to
select suitable service providers.
Box 1: Recommendation for the Viability Gap Fund Window of the
Energy Resilience Fund
Based on the aforementioned considerations, it is proposed that competitive
auctioning of premium payments would be selected for the main instrument of the
viability gap funding, being available for projects that already have secured a clear
and fixed revenue stream.
This secured, clear, and fixed revenue stream can mean power purchase agreements
signed by developers under the independent power producer or IPP scheme, or
developers with a concession and explicit power price under the electrification
scheme. This would give the project developers an incentive to negotiate power
purchase agreements or PPAs (or other revenue streams) as high as possible,
therefore enabling competitiveness in a subsequent (possible) competitive bidding
of a premium tari. Such scheme would also not require formal changes or linking to
the existing regulations and power purchase agreement solicitation procedures, but
would complement them and work independently in the current context.
The auction could either aim at maximal cost-eciency, having all projects bidding
in same process, or, for example, there could be location-specific priorities (or
prioritization of certain technologies). In the latter case, the auctioned volume
would be allocated separately for dierent areas (or technologies), depending on
which areas (or technologies) are prioritized for new generation capacity. This could
lead to very dierent price levels in dierent regions (or technologies).
When considering splitting the total allocation, the level of competition needs to
be carefully evaluated. For example, if there are very few eligible bidders in a certain
region, it may not enable sucient competition between bidders.
Source: ADB.

Evaluation and Recommendations on Financing Instruments for Identified Financial Intervention Needs
23
• The scope and costs of the technical assistance and capacity building, and
therefore the budget of the PDF, can be known and planned better beforehand.
• The fund manager can be able to use/direct the use of funds more strategically
from the sector point of view as a whole, therefore aiming at broader benefits
than just project level support.
Cons:
• The procedure may not be flexible enough from the project developers’ point of
view, if they are not able to procure the services they need by themselves, from
wherever they want. The eligible service providers might not include exactly the
type of expertise as required by a developer from time to time.
• Timing of the services may not go exactly as wished by the developer, if the
fund manager is actively involved, which may be an issue since timing can be
critical in project development.
• May require deeper involvement and, therefore, resources from the fund
manager to coordinate and manage the technical assistance/capacity building
and can therefore also lead to delays and bottlenecks.
• In practice, this is grant funding, i.e., once the service provider has been paid for
services, the money is used and lost from the PDF perspective.
. Option Project Development Funding : Project Development Grants
Pros:
• Providing grants is relatively straightforward, and project evaluation, award, and
disbursements can be done eciently, enabling higher volume.
• Possibility to standardize the process (e.g., web-based online procedures,
standard nonnegotiable agreements) can also make it easier for developers to
apply funding
• It can be possible to arrange eciently – calls for proposals per annum with
several projects approved per call, resulting in a large number of approved
grants per annum.
• Grant funding is attractive to developers and sponsors for obvious reasons;
no repayment obligations, no risk of default, and larger impact on profitability
compared with financial instruments.
• For the above reasons, grant financing does not only improve the bankability
of the project or equity IRR but, unlike financial instruments, grant funding
improves the underlying project IRR.
• Usually, grant funding is flexible also from the developers’ point of view. They
can procure services freely from capable service provider they want and when
needed, as long as rules are met (such as procurement rules imposed by the
ERF).
Cons:
• Compared with financial instruments/risk finance, where there is possibility for
repayment and even returns, grants are inecient from the ERF’s perspective
since, once used, the money is used and lost, with no option to reinvest, which
can lower the eectiveness and leverage eect of grants compared with
financial instruments.

Renewable Energy Financing Schemes for Indonesia
24
• When using grants in a context where, at least, some private finance can be
available, there is a risk of market distortion, over-subsidizing, and crowding
out of private finance. Therefore, project award should be done carefully in this
sense, but is challenging in practice.
• Grant funding usually does not require as much from developers than risk
finance. In the latter case, the evaluation, comments, and requirements are
often tougher, thus often also improving the overall quality of the project. In
some cases, it could be argued that grant funding has been “too lazy money.”
. Option Project Development Funding : Project Development Risk Finance
Pros:
• Risk finance (meaning in practice equity, quasi-equity, or mezzanine loans)
can be more ecient from a broader perspective, i.e., be able to leverage more
other finance, including private finance. Once a project development stage
mezzanine loan is being repaid with interest (either in installments or at the
financial close of the project) the funds can be reinvested in a new project. This
can make the use of public funds more ecient.
• Depending on the risk profile/strategy of the PDF, it can aim at
o taking a lot of risk, thereby losing its capital gradually, but being able to
recover and reinvest some of its funds more than once;
o aiming at self-suciency and cost-neutrality, i.e., the returns will cover its
operating costs and losses, and the capital will be preserved in the long term; or
o being close to a commercial financial investor, pricing its financing to
account for high risk and high administrative costs of the fund, and aiming at
generating positive post-fees net returns.
• Risk finance can and needs to be tailored for the purpose, meaning that the
project development status, available funding, expected schedule, and risks
can be taken into account to structure the project development funding in the
most meaningful way for the project. This will not only serve the interests of the
project and the PDF, but can also help mobilize other finance, including private
investors.
• Use of financial instrument can be less market-distorting than use of grants.
Financial instruments can and should also be tailored from the financial market
situation perspective too, meaning that, in more commercial cases, where
private finance may also be involved, also the project development funding
should apply more commercial features to avoid crowding-out eect, whereas
in financially less-viable projects, where private funding is very unlikely, the
project development funding can take softer forms.
• When investing in form of a financial instrument (in contrast to grants), there
are often stricter due diligence process, stricter agreements, requirements,
covenants, and other control mechanisms in place for the financier (i.e., PDF
in this case). Although this may be seen critically by the project developer, it
can improve the quality of the project and project development, and forces the
developer to be clear, transparent, and professional in their procurement, use of
money, and documentation.

Evaluation and Recommendations on Financing Instruments for Identified Financial Intervention Needs
25
Cons:
• Since investing in form of financial instrument(s) requires more tailoring and
structuring, the transaction costs tend to be higher than in grant facilities, and
respectively the volume of funded projects may be lower than in case of a grant
facility. In contrast, this may reduce the eectiveness and leverage of the PDF.
• If project development funding provided by PDF is repayable (possibly with
interest), the cash flow to repay the project development funding is away from
cash flow for other purposes. Therefore, compared with grants or technical
assistance, it inevitably reduces the project IRR and equity IRR of the project,
and it also aects negatively certain debt-related ratios such as debt service
coverage ratio, meaning that the borrowing capacity of the project is reduced
respectively. However, project development funding, and especially PDF’s likely
minor share of it, is typically small compared with the investment cost of the
project itself. Therefore, in many cases, this impact is not remarkable, but needs
to be addressed, however.
• Managing the financial investments requires more eort than monitoring
of the use of disbursed grants. Especially, equity can be burdensome since
(i) the shareholder role and possible board membership brings additional
responsibilities in decision-making; and (ii) the exit of the equity investment
needs to be separately planned and executed (in contrast to repayment of a
loan), which can turn out to be very dicult or even impossible. Also managing
a loan portfolio requires careful monitoring that debt servicing of projects
happens as in loan agreements, but as long as there are no defaults of other
special events, the debtor does not need to be involved with the portfolio
companies, and in fact has no access to decision-making.
. Summary, Conclusions, and Recommendations
Traditionally, the project development funding support has been based on technical
assistance and grant funding, which are attractive for the developers as well as
straightforward, easy, and cost-ecient to manage. On the other hand, grant funding
may be an inecient use of public funds in cases where there is a business case, and
therefore does not achieve as high as possible leverage eect since, once money is
used, it is lost from the funders’ point of view. In the worst case, such grant finance
may crowd out private commercial finance that would be available but will not be
used since developers prefer “free and easy money” from grant facilities. Recently, an
increasing amount of more market-based approaches and financial instruments have
been used. However, even in one country and within one category of projects, there
will be a lot of variation between individual projects, some being better able to absorb
funding at commercial terms, while some will still require clearly subsidized funding.
Therefore, it may be advisable for the PDF to seek commercial financing options to
promote project development activities, while also preserve the option to provide
softer grant financing in cases where the projects’ capability to absorb commercial
finance is more limited. From instrumentation/structuring point of view, both grants
and financial instruments can be structured in a more or less commercial way.
For example, the PDF could be formally a grant facility, but to the extent possible

Renewable Energy Financing Schemes for Indonesia
26
distribute “reimbursable grants,” possibly carrying an interest, meaning that, in case
the project is successful, it would repay the grant, possibly with an interest/multiple,
at the financial close, or the grant could be converted to a short-term loan, repayable
during the operational phase from project cash flows. In this case, even if the funding
was legally a grant, it would be structured as risk finance such as mezzanine loan/
quasi-equity. Alternatively, the PDF could provide grants and risk financing. The
practical dierence between these could eventually be limited, depending much on
the detailed legal specifications of these (see Box ).
This approach would enable more sophisticated tailoring opportunities on the project
level funding. It would also lead to additional management resource requirements for
the PDF. In such case, in contrast to more traditional grant finance, the PDF should
have more personnel resources, including people with specific expertise in project
development and financial structuring. This would both increase the transaction
costs and reduce the volume of projects that can be taken through the PDF on an
annual basis.
Therefore, the choice and detailed specifications of the PDF instrument depend
greatly on the volume and timing targets of the ERF. If the size and volume targets of
the ERF are large, it may be more ecient to (at least partly) formulate the PDF as a
grant facility, possibly based on frequent online call for proposals (CfP) procedure. To
the extent the volume targets of the ERF allow, it is recommendable that the PDF at
least consider ways to use financial instruments and aim at higher leverage and less
market distortion.
Bilateral first come, first served approach may be challenging from public funding
point of view, which often prefers/requires competitive procedures such as calls for
proposals. However, the former approach is preferred if financial instruments are
used. The latter does not enable tailored structuring and the needed level of project
evaluation and due diligence as required when using financial instruments. There are
funds with public sources of funding using bilateral noncompetitive approaches, and
it would be recommendable to seek for such solutions also in this case.
Primarily, the funding should be directed at more advanced projects where clear
progress has been achieved already, and preferably with a relatively clear path towards
bankability. The developer should demonstrate its skills in project development,
including previous track record, and the applicant should also provide stong
contribution to the remaining project development cost together with the PDF.
C. Credit Enhancement Fund
. Option Credit Enhancement Fund : Guarantee
Pros:
• If the perceived risk by banks is high while the real risk is low, the case for a guarantee
scheme is strong. This means that there is room for pricing of the guarantee,
accounting for both expected losses and administrative costs, thereby improving
the financial sustainability, leverage ratio, and impact of the guarantee fund.

Evaluation and Recommendations on Financing Instruments for Identified Financial Intervention Needs
27
• Guarantee is not direct funding, and the funds are never disbursed in the
base case. The funds need to be committed and allocated to guarantee
specific loans (often provided by commercial banks and development finance
institutions). Funds need to be drawn on only in case a guaranteed debt is in
default and the bank (or the project sponsor, depending on what is guaranteed)
is making a claim to the guarantor according to the guarantee agreement.
• By this indirect involvement, it leaves the actual funding, funding process, and
decisions to capital market.
• By incentivizing the debt capital market to provide loans, a guarantee scheme
can also be very useful for capacity building and market creation purposes. The
guarantee scheme oers cushioning for local banking sector in their first steps
to get involved with renewable energy projects. It is typical and often useful to
complement a guarantee scheme with a capacity building component.
• If a country has a suciently deep and well-functioning capital market, direct
lending by a public funding instrument may lead to crowding out private
financing, whereas guarantee scheme does not have such risk.
• Guarantee is relatively easy to administer. A guarantee fund can be able
to leverage banks’ due diligence processes (or vice versa), and the loan
Box 2: Recommendation for the Project Development Fund Window of
the Energy Resilience Fund
Based on the aforementioned considerations, it is proposed that project
development funding can be provided through continuous project identification,
bilaterally case by case either as grants, reimbursable grants, or financial instruments.
Financial instruments should be preferably in form of mezzanine debt rather than
equity instrument to make the post-investment portfolio management more
ecient. If equity is used, it should be structured so that it actually works like debt,
in practice meaning no remarkable decision-making responsibilities on project
company level as well as prenegotiated exits.
The Project Development Fund (PDF) could apply dierent levels of commerciality
in its financing, depending on the commercial viability and investor interest in the
project. This would serve the purposes of (i) using public funds in as ecient way
as possible and preserving the capital to the extent possible; and (ii) maximize the
leverage of other finance and minimizing the crowding-out eect and, thus, avoid
unnecessary market distortions. In some more viable cases, the funding could
apply almost normal commercial terms, whereas grants could be used in other less
viable cases.
The operation of the PDF should primarily be based on case-by-case, bilaterial first
come, first served process, i.e., the fund manager evaluating each project individually
and making decisions based on predetermined eligibility criteria of projects, targets
of the fund, and detailed set of key performance indicators steering fund manager’s
activities towards the desired direction at a desired pace.
Source: ADB.

Renewable Energy Financing Schemes for Indonesia
28
administration does not take much eort as long as there is no default situation,
and even in these situations it is primarily the lender’s responsibility to act.
Cons:
• Guarantee should not be for of the outstanding debt, or it may lead to
moral hazard. Some risk has to be left for the lenders and project sponsors to
ensure prudent actions and operations. Having a balanced guarantee scheme,
covering enough credit risk to incentivize lending but not too much in order to
avoid moral hazard and agency problems may be challenging.
• In most cases, the expected default and loss rates can be very dicult to
estimate beforehand since, typically, there is no relevant market information
available to actually model these (since the very reason of the guarantee
scheme is to kickstart the nonexistent market). Consequently, the sizing and
pricing of the fund is challenging as it is not possible to say what the realistic
leverage rate could be, i.e., how many dollars of debt of guarantee could
support or mobilize.
• If the real risk (in contrast to perceived risk) of the investments is high, then
real losses can be expected, and therefore the financial sustainability and
the usefulness of a guarantee fund may be more limited; at least, its subsidy
element will become higher.
• Sometimes there are unrealistic expectations for guarantee funds, i.e., that they
could preserve the capital and generate returns even if the underlying projects
have high real risk.
• To some extent, guarantee instrument helps, but if a bank is very unfamiliar with
a new sector or otherwise sees remarkable risks, it may not be willing to provide
debt even if partially covered by the third-party guarantee; a guarantee should
not make a bad project look good.
• Guarantee brings an additional player to the financial structure, financing
process, and negotiations, which can add to the complexity and transaction
costs. If the guarantee scheme has very dierent and specific requirements
compared with banks for example, this may cause problems in due diligence
processes, fianncial structuring, and negotiating agreements.
. Option Credit Enhancement Fund : Onlending or Credit Line
Pros:
• Receiving a credit line with softer terms from a development finance institution
enables a local financial institution to extend loans at better terms to renewable
energy projects.
• Using special credit lines, the banks can preserve their core capital
requirements and risk positions even if they are providing debt for a sector that
is perceived riskier.
• Credit lines enable capacity building, creating track record and expertise by the
financing instutions by getting hands-on with renewable energy projects. It is
typical and often useful to complement a credit line with a capacity building
component.

Evaluation and Recommendations on Financing Instruments for Identified Financial Intervention Needs
29
• Credit line as a form of direct financing can help if the domestic capital market is
shallow and the market is seen as unattractive for international lenders. In such
case, direct financing from a development finance instution that use credit lines
can be ecient, and help leverage other finance, instead of crowding it out.
• A traditional arrangement with a vast amount of experience and lessons from
dierent countries and by various development finance institutions.
Cons:
• The financial intermediary should have considerable own stake in the
financing too, not only onlending the credit line. Otherwise, there is risk for
moral hazard since the intermediary would not have the incentive to do due
diligence, financing decision as well as portfolio management properly. On
the other hand, too much own stake required may disencourage the financial
intermediaries to utilize the credit line. Finding the balance may be challenging,
as in the guarantee scheme.
• Indirect intervention will give less control for the CEF on the financing
decisisions and portfolio management. As said above, there is the risk that the
credit line will not be used in the first place and, second, that the due financing
decisions will not suciently reflect the objectives of the fund. Channeling
the objectives and the investment strategy of the CEF through the financial
intermediaries to the project level financing needs to be carefully planned and
communicated with suciently strict rules for financial intermediaries.
. Option Credit Enhancement Fund : Colending, Syndication, A/B Loans
Pros:
• Colending or A/B loan structure remarkably lowers the threshold for banks
and institutional investors to provide debt for projects. Led by a development
finance institution, a loan syndication instrument could lead and coordinate
the financing process towards a project, be the lender of record, carry out the
necessary project appraisals and due diligence processes, and then syndicate
this loan with commercial lenders.
• Depending on how the instrument is structured and governed, the banks and
institutional investors as B lenders could benefit from the possible preferred
creditor status of the A lender, i.e., the development finance institution-led
financing instrument.
• The structure helps the private financial institutions to get track record in
renewable energy lending and, therefore, has capacity building benefits.
• From the CEF instrument and funders’ perspective, syndication structure
enables high control of transaction processes and portfolio management since
the CEF instrument would be the sole counterparty (the lender of record)
towards the project on behalf of the B lenders. Therefore, the management
team could aect the deal volume and achievement of the targets with its own
actions better than in the case of a guarantee scheme or credit line scheme.
• By lowering the risks and costs of lending for private financiers, these can
provide debt at more attractive terms from projects’ perspective.

Renewable Energy Financing Schemes for Indonesia
30
Cons:
• The fundamental reasons of the unattractiveness of renewable energy
investments need to be identified and solved. These may still prohibit banks
and institutional investors from providing debt even with the existence of the
syndication instrument, in which case it will become dicult for the syndication
vehicle to close any transactions.
• The operational responsibility of the scheme in this structure would be heavily
dependent on the management team of the scheme. It can be an advantage
by providing a higher degree of control, as mentioned above, but it can also be
a weakness, in case the management entity or team is not capable of carrying
out its tasks properly, it will put the whole scheme at risk. This risk is higher in
the syndication and stand-alone fund CEF options, compared with other CEF
options where the roles are distributed more on other financial institutions too.
• Since a syndication instrument would need to play a big role throughout the
transactions and portfolio management, the resource requirements would
be higher, respectively, both in terms of amount of people and special project
finance deal structuring expertise.
• The capacity building impact might be lower compared with credit line option
since a syndication fund manager would do much of banks’ work in the deal
process. However, this depends largely on the detailed procedures of how the
fund works.
. Option Credit Enhancement Fund : Stand-Alone Debt Fund
Pros:
• This may be easier and more straightforward from the individual project’s point
of view.
• Mobilization is likely to be faster and more straightforward than when working
with or through local banks or other financial institutions since the fund could
deal directly with projects.
• This could be easily outsourced to existing private fund manager(s) with strong
track record, if needed, thus also contributing to faster implementation and
mobilization
• Use of external private fund manager could also ensure the needed experience
and track record when selecting a capable service provider through a
competitive selection process.
• From the CEF funders’ point of view, a standalone fund would provide more
control of the actual terms of finance at project level, whereas working on a
guarantee scheme or via local or commercial financial institutions, this control
could be more limited or indirect.
• If the real risk is considered significantly lower than what is reflected in the
pricing by the private sector, it could be possible to provide lower interest
rate debt for renewable energy projects raised from development finance
institutions. To some extent, these typically oer softer terms in their financing.
However, in such case, serious consideration needs to be given to the market
rates and the potential crowding-out eect. At some point a fund oering
very concessional pricing and other terms can also be considered interest rate
subsidy.

Evaluation and Recommendations on Financing Instruments for Identified Financial Intervention Needs
31
Cons:
• Aspects of building the market and capacity (especially among capital markets)
likely to be more limited since the fund would be an independent/stand-alone
entity, operating as the sole lender in many cases, thereby not “radiating” the
experiences more broadly in the sector.
• Additionality should be justified in each project; would a stand-alone debt fund
promoted by development financiers be something more than what the private
sector players should be able to do?
• If the additionality argument is based on some kind of softer elements in
funding, risk of becoming too risk averse compared with the mandate of
providing softer/riskier finance, and therefore not being able to achieve the real
additionality and impact.
• In this scheme, the management entity/team would have higher control
and responsibility of the success of the scheme (such as in the syndication
scheme) whereas in other schemes, the roles are distributed to other financial
institutions too.
• There could be a risk of crowding out other finance, especially in a country with
a deep and well-functioning capital market.
• If the CEF funders were more of public sector financers, there is a risk of too
close political influence at the project level, consequently compromising sound
financial decision-making. This risk is present in all publicly funded financing
schemes, programs, and instruments, but the risk seems to be larger the more
direct control and intervention channels the policy makers have in the fund
investment decision-making.
. Option Credit Enhancement Fund : Interest Rate Subsidy
Pros:
• This is a direct way to intervene with high interest rates in cases where they are
prohibitive.
• This is a traditional ocial development assistance mechanism widely used in a
development finance context.
Cons:
• It does not tackle the underlying root causes of high interest rates.
• Due to the above reason, it may not be able to address the other possible
probihitive terms and conditions of lending.
• It is a form of direct subsidy instead of financing.
• It can have more dicult issues (than the other options) regarding rules and
regulations on state aid or international trade
• It could be the last option, if nothing else works.
. Summary, Conclusions, and Recommendations
In principle, it would be advisable to only play an indirect role in mobilizing debt for
renewable energy projects and let the capital market provide the needed debt. For
example, this could be done by providing the needed VGF and PDF instruments,
and then providing CEF in the form of indirect intervention only, i.e., as guarantee

Renewable Energy Financing Schemes for Indonesia
32
instrument(s), liquidity facilities, capacity building. However, in practice, there may
be lending barriers that are not related to renewable energy only but are more general
challenges in the capital market (see Box ).
Although Indonesia has an investment-grade credit rating, its central bank interest
rates and government bonds are at a relatively high level, and the debt capital market
of the country can be described as shallow and less liquid. Also, during the fact-finding
mission, it became clear that there is a risk that some banks may already face their limits
in energy sector lending because of heavy exposure to PLN credit risk. Even if such
limits were not close, it was also mentioned that continuing to lend to PLN in the energy
sector could still be the easiest option for banks which might not be willing to make the
eort needed and use their balance sheets for other energy sector lending.
In addition to a guarantee scheme, an additional debt funding instrument in the CEF
window of the fund should be considered. If the banks and institutional investors
show interest towards the sector and it is likely that they would have interest to play
an active role to develop their capabilities and the sector, a scheme based on credit
lines could be considered, and this could bring a lot of leverage and capacity building
impacts relatively eciently.
On the other hand, if the assumption is that the capital market remains uninterested
in the sector and a rather passive attitude can be expected, a syndication instrument
could become more relevant. In this arrangement, the CEF instrument would play
more active and leading role, such as in identifying and evaluating opportunities,
doing the due diligence, carrying out negotiations, and managing the portfolio. This
would give more control and responsibility for the fund manager but would not have
as high expected leverage eect as an onlending/credit line instrument.
As the last option, a stand-alone debt fund can be considered. It also gives the fund
manager good control and responsibility of the success of the scheme, and it may
be useful to mobilize debt funding at the fund level. On the other hand, the capacity
building and capital market development impacts would probably be more limited
than in the case of syndication and credit line instruments. In all cases, but especially
in the case of a stand-alone fund, it would be recommendable to put special
coordinated eort to capacity building of the local capital market. It has to be kept
in mind that building the market and improving the investment frameworks are, at
least, as important objectives as the new installed capacity achieved in the context
of the ERF.

Evaluation and Recommendations on Financing Instruments for Identified Financial Intervention Needs
33
Box 3: Recommendation for the Credit Enhancement Fund Window of
the Energy Resilience Fund
Based on the aforementioned considerations, it is proposed that the credit
enhancement funding should consist of a guarantee and a credit line instrument.
The credit line should seek to mobilize the local capital market. It would do so by
playing a central role in identification, evaluation, negotiation, and due diligence
processes together with the banks “in the frontline” like in case of syndication, rather
than playing a background role as a passive credit line provider. By definition, these
instruments will involve banks and institutional investors in the project level deals
and, therefore, help them get understanding, build track record, and gain experience
in renewable energy sector.
This activity should be complemented with a strong, well-planned technical
assistance and capacity building program targeted primarily at the lenders and
developers, but also at other crucial stakeholders playing a role in making projects
bankable.
Source: ADB.

A. Introduction
In this chapter, similar schemes as outlined and suggested in chapter V will be briefly
described. In addition to describing the functioning and main level procedures, the
descriptions will also attempt to explain the situation and rationale of these interventions,
and how they are similar to or dierent from the situation and challenges in Indonesia. This
will help in evaluating to which extent these cases could be replicable in Indonesia. Some of
the schemes are broader, including two or more of similar interventions as contemplated for
Indonesia, whereas some of them represent only one of the three proposed mechanisms.
A positioning of each presented example case, vis-à-vis the proposed concept in Indonesia,
is in Table .
Table 1: Summary of Similar Schemes
in Other Countries Included in the Review
Scheme Technical
Assistance
Premium Tari Project
Development
Funding
Credit
Enhancement
Funding
Bidding
process
First
come,
first
served
Call for
Proposals
First
come,
first
served
Guarantee Credit
line
GET FiT
X X X
PFAN
X (X) (X)
REPP
(X) X X
Finland
X
ARECA
X X
SEFF
X X
ARECA Accelerating Renewable Energy in Central America, GET FiT Global Energy
Transfer Feed-in Tari, PFAN Private Finance Advisory Network, REPP Renewable Energy
Performance Platform, SEFF sustainable energy financing facility.
Source: ADB.
VI. Brief Summary
of Similar Schemes Applied
in Other Countries

Brief Summary of Similar Schemes Applied in Other Countries
35
B. Global Energy Transfer Feed-in Tari, Uganda
. Background
GET FiT Uganda was launched in to address especially the low renewable
energy taris and various high risks faced by investors and financiers in the field
of renewable energy in Uganda. The core of the GET FiT scheme is a premium
tari oered for projects that could be bankable but are not profitable with the
government-set price level in their PPAs. In addition to this premium, the scheme
includes a partial risk guarantee as well as technical assistance to various stakeholders,
especially public sector policy makers, regulator, and grid operator.
. Description of the Scheme
Competitive Premium Tari
The premium tari aims at providing a “top-up” to the governmental feed-in tari
as set by the Energy Regulatory Authority (ERA) working under the supervision
of the Ministry of Energy and Mineral Development. The scheme was launched in
with three bidding rounds arranged for small hydro and biomass, and one solar
photovoltaic-specific round in . GET FiT has supported small hydro, two solar
photovoltaic, and one bagasse projects awarded the premium. The total installed
capacity of these projects is MW, i.e., the average size of the projects is MW.
The award procedure of the premium tari is based on competitive bidding process.
Each developer submits a proposal for the need of a premium they would need to
make their projects profitable. As a result, the developers in need of lowest premiums
are awarded the premium they are asking (pay-as-bid), and the volume of projects
and support is determined by the availability of funds from donor countries. The
premium is front-loaded, and of it was paid as a lump-sum immediately after
the commercial operation date (COD), and the remaining was paid during
the first years of operation. Remarkable, this cash flow profile helps projects’ debt
servicing capacity in the early years of operation, and the first part can actually
be considered as an investment grant, or partial refinancing of construction stage
finance.
The bidding process is a two-stage and multi-criteria procedure, where in the first
phase (prequalification round) the interested developers will be scored according
to their experience, track record, and capabilities, and the quality and readiness of
the project. In the second stage (request for proposals [RfP]), the bidders are ranked
based on price ( of total score) and technical/qualitative basis ( of total
score).
The proposal phase documentation included the RfP, the PPA, premium payment
contract (i.e., separate agreements and respective revenue streams from PPA with
the utility and premium payment contract with GET FiT), implementation agreement,
and the direct agreement. Financing for the project had to be tentatively in place, and
the equity and debt providers had to sign a letter approving the above agreements.

Renewable Energy Financing Schemes for Indonesia
36
To avoid opportunistic proposals, the GET FiT required a bid bond (standby letter
of credit from a bank) placed by bidders at the time of submitting their proposals,
the amount being ,/MW, which can be considered relatively high. Successful
bidders then had to provide ,/MW completion and performance bond to
show commitment to project implementation. In addition, delays were sanctioned
by introducing a ,/day penalty for delayed COD. Finally, both the PPA and the
premium payment contract had performance-based sanctions; if the actual capacity
of the plant was lower than indicated in the bid, the rates could be reduced and, after
certain thresholds, the contracts could even be terminated.
The bidding schedule in the GET FiT was relatively relaxed. First, the bidders had
months to submit their bids and, after award decision, they had months to reach
the financial close. After the financial close, the projects had – months to reach
the COD.
Risk Mitigation Instruments
The GET FiT scheme includes dierent types of risk mitigation instruments for the
benefit of the lenders. First, the implementation agreement included eectively a
government guarantee to support the utility’s payment obligations, and the direct
agreement (as usual) included provisions for step-in rights for the bank in case of
debt service default by the project company. Moreover, the World Bank made its
partial risk guarantee instrument available to projects, although none of the projects
finally used it, probably because of high upfront cost.
Grid Infrastructure Investment Costs
In Uganda, the project owner is responsible for grid construction up to the connection
point to the grid, whereas the transmission system operator is responsible for the
so-called “deep works” to strengthen the grid. To support the latter, GET FiT worked
together with the transmission system operator to help design and construct the
needed grid reinforcements, and also paid part of these costs of the transmission
system operator.
Technical Assistance
Technical assistance in the GET FiT scheme was provided primarily to the regulator,
bidding process operator, and the grid company—not much to developers nor banks.
As mentioned, the transmission system operator received help and even financing
from GET FiT in planning, designing, and constructing the grid (deep connection
costs). Especially the solar photovoltaic bidding processes included considerable
support for the Energy Regulatory Authority (ERA) to design the standard templates
for agreements, and detailed design of the bidding process. Moreover, the GET FiT
donors paid the operative costs of the specific bidding agent working under the
supervision of the energy sector regulator ERA, ensuring the availability of sucient
personnel resources and skills to run the process in a timely and professional manner.
. Governance Structure and Funding Sources
The GET FiT was implemented under the Ministry of Energy and Mineral
Development, the main responsibility of operationalization at the ERA, which hosted
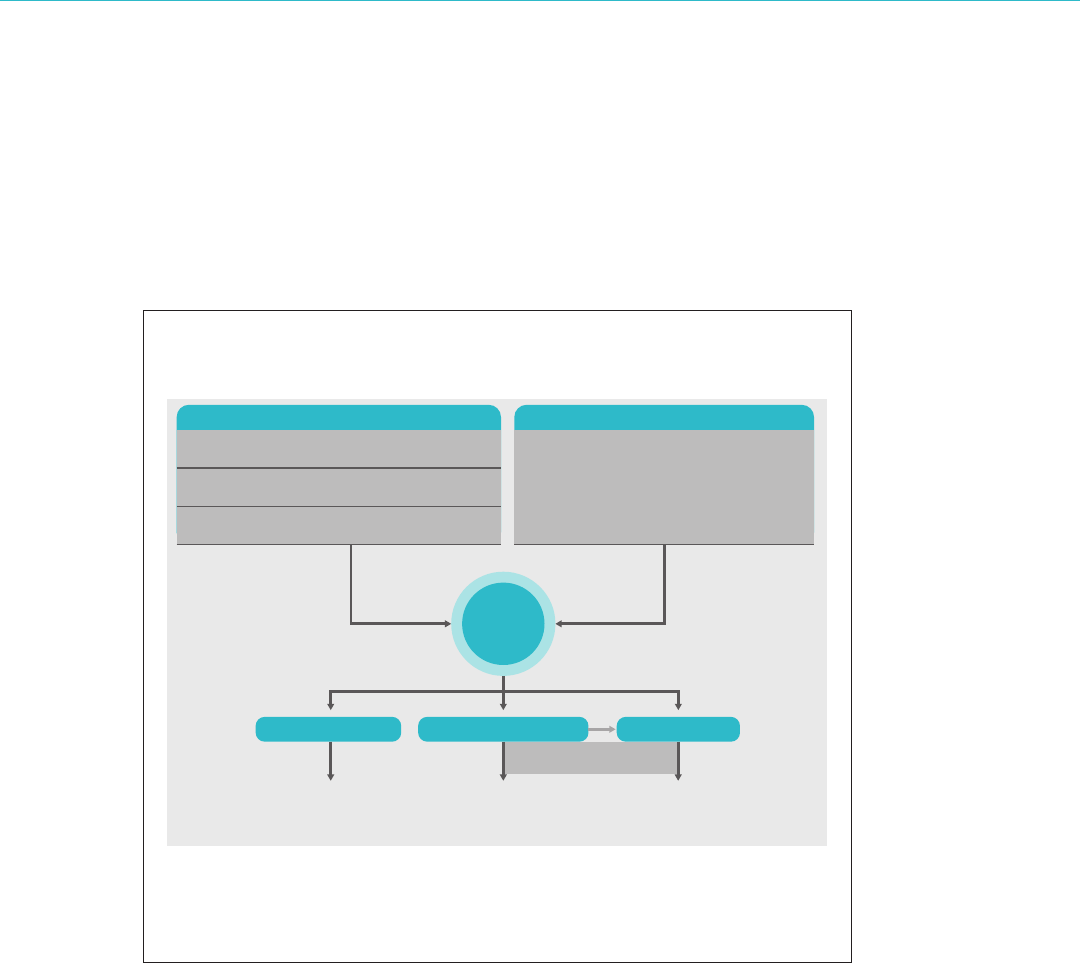
Brief Summary of Similar Schemes Applied in Other Countries
37
the GET FiT Secretariat. Supported by a private sector implementation consultant,
the secretariat was mainly responsible for the daily operation and management of the
GET FiT. The secretariat and implementation consultant were supervised by the GET
FiT Steering Committee with the relevant ministries and funding donors as members.
The Investment Committee consisting of the funders finally approved the projects
based on the work and proposal by the secretariat. The governance structure of the
GET FiT scheme is shown in Figure .
The lead-financier and the original inventor of the GET FiT concept is KfW from
Germany. In addition, Norway, the United Kingdom, and the European Union have
all provided funding and technical assistance to the scheme. The World Bank made
its existing partial risk guarantee instrument available to winning projects. After
successful experiences in Uganda, the GET FiT scheme is now being implemented in
Zambia, targeting MW of new solar power generation.
. Relevance and Lessons for Indonesia
Although Uganda is smaller and a generally less-developed country than Indonesia,
the GET FiT scheme includes several interesting aspects. First, it applies a fully donor-
funded premium tari scheme based on competitive bidding. As also in Indonesia,
one of the fundamental issues is the insucient tari level, the GET FiT represents
one concrete example of how to tackle this challenge.
Figure 5: Governance Structure and Organization
of the GET FiT Program
GET FiT Global Energy Transfer Feed-in Tari.
Source: Global Energy Transfer Feed-in Tari .
STEERING COMMITTEE FACILITATORS AND OBSERVERS
Ministry of Energy and Mineral Development
Ministry of Finance, Planning and Economic Development
Development Partners (Norway, Germany,
United Kingdom, European Union)
Appraisals,
recommendations,
supervision
Staffing and day-to-day
management
Project selection and
payment commitment
decisions
Develop follow-up,
reporting and communication,
overall program coordination
KfW, Energy Regulatory Authority, World Bank,
Ministry of Energy
and Mineral Development
GET FiT
Steering
Committee
Implementation Consultant GET FiT SecretariatInvestment Committee

Renewable Energy Financing Schemes for Indonesia
38
The GET FiT projects were small, less than MW on average, and several projects
about MW. Also in Indonesia, especially the projects under the IPP scheme are of
similar size. On the other hand, the electrification project can be remarkably smaller,
whereas PPP projets can be remarkably larger. In principle, the projects can be larger
too, mainly depending on the amount of funding available and the resulting capability
of the scheme to support projects.
The GET FiT scheme provided broad-based support for the public entities having
remarkable responsibilities in the scheme. It supported the grid operator in planning,
designing, and construction to lower its threshold to play its role of connecting the
plants. It also supported the ERA to establish and manage the GET FiT Secretariat,
paid the costs of professional implementation consultant to help in project
evaluation and recommendations, and GET FiT also provided the templates for
key documentation to ensure the bankability of the documentation. All this would
probably be needed in an Indonesian scheme too. In addition, it would be advisable to
also provide support and project development funding for developers, and technical
assistance to banks to encourage them to play an active role in the scheme.
For more information: https://www.getfit-uganda.org/.
C. Private Finance Advisory Network, Global
. Background
The Private Finance Advisory Network (PFAN) was established in . Its rationale
is based on the observation of the so-called “missing middle” between the project
developers and investors/financiers. Therefore, PFAN was established to facilitate
interaction between these two key stakeholders by supporting developers in
developing their projects and financial planning to meet investors’ requirements and
needs, preparing project pipelines and portfolios ready for investors, and identifying
and making contacts with potential investors.
. Description of the Scheme
PFAN is a multidonor program (with the United States Agency for International
Development as the largest donor) that has developed a network of professional
clean energy and climate sector financial advisors covering most of the developing
countries and emerging markets. These advisors are experienced persons having
worked in the sector and region for a long time, and therefore are approved by PFAN
to be part of its global pool of financial advisors. The advisors usually do not work
full-time for PFAN but receive part of their assignments and income through PFAN
projects.
PFAN identifies and helps projects that are fundamentally sound and have good
commercial potential, but which face project development and financing challenges.
Projects are being identified and evaluated continuously on a case-by-case basis
by the PFAN coordinators, based on an application template that the developers
and entrepreneurs must use. In addition, projects are identified through calls for

Brief Summary of Similar Schemes Applied in Other Countries
39
proposals. PFAN issues regular calls for proposals in dierent regions inviting project
developers to submit applications.
Successful proponents will be provided with technical assistance in the form of a
financial advisor to support them in project development, financial planning, and
identification of and interaction with investors and financiers. The donor-based PFAN
pays a smallish fixed upfront share of the fees of financial advisors on behalf of the
developers, but PFAN and the local advisors also make a success fee agreement with
developers, which is payable only in case the project is successful. With this blending
and covering the upfront cost of hiring financial advisors, PFAN is able to mobilize
financial advisors eciently by using only a limited amount of public funding.
In addition to identifying projects and appointing financial advisors to projects the
PFAN works actively with investors. It identifies investors and prepares project
portfolios to be presented to them. Projects are being presented to investors in
dierent ways, including bilaterally and publicly. A key match-making activity is
PFAN’s flagship event Clean Energy Financing Forum that is organized regularly in
dierent regions. Potential investors and the most credible projects are invited to the
events, where the project developers have the opportunity to pitch their projects to
investors, and to have bilateral meetings with them.
Although PFAN focuses on the “missing middle,” coaching and mentoring project
developers in financial issues and training finance sector players in clean energy
issues, PFAN also supports the energy transition to clean energy by actively engaging
in policy dialogues. In this work, PFAN leverages its host organizations’ and donors’
activities, outreach, and resources in addition to its own resources.
. Governance Structure and Funding Sources
Originally implemented under the Climate Technology Initiative (CTI) in cooperation
with the United Nations Framework Convention on Climate Change Expert Group
on Technology Transfer, the PFAN is nowadays (since ) hosted by the United
Nations Industrial Development Organization (UNIDO) and the Renewable Energy
and Energy Eciency Partnership (REEEP). PFAN has a steering committee through
which UNIDO, REEEP, and the funding governments are represented. PFAN has its
own core sta, and is additionally supported by REEEP sta and UNIDO with regard
to professional and administrative services. Also, PFAN has regional coordinators who
coordinate project identification and facilitation activities in their respective regions.
Individual financial advisors are appointed case by case to support specific projects
selected for support by PFAN.
The current funding government partners of PFAN include the United States (United
States Agency for International Development), Japan (Ministry of Economy, Trade
and Industry), Sweden (Swedish International Development Cooperation Agency),
Norway (Ministry for Foreign Aairs), and Australia (Department of Foreign Aairs
and Trade). PFAN is also able to negotiate more targeted and temporary finance with
donors; for example, for an individual donor country to support certain country or
region for a more limited and specific period and scope.

Renewable Energy Financing Schemes for Indonesia
40
. Relevance and Lessons for Indonesia
Already, PFAN is actively working in Indonesia, and in terms of projects supported
by PFAN, Southeast Asia is the largest region for PFAN. In Indonesia, PFAN has
an existing network of local individual financial advisors, and it has also financial
institutions and advisory companies as network members, including the SMi and
BAPPENAS as resource partners of PFAN.
Other Indonesian PFAN network members include SucorInvest, PermataBank, Bank
Negara Indonesia (BNI), Bank Central Asia (BCA), Insight Investments Magements,
Independent Research & Advisory Indonesia (IRAI), Indonesian Electrical Power
Society (MKI), Indonesian Renewable Energy Society (METI), and ADB’s Energy for
All Partnership Program.
PFAN’s operations are well-established with strong proof of concept by .billion
leveraged finance in projects in countries. Its current project portfolio includes
about projects, of which more than are in Southeast Asia.
Therefore, PFAN could be considered not only a potential model to be replicated, but
an organization that actually links banks to the project development support services
for developers and technical assistance oered by the REF. As an example, a donor
country currently funding PFAN, or an entirely new donor country to PFAN, could
provide targeted technical assistance funding for project developers through PFAN as
part of the technical assistance activities of the REF.
For more information: http://pfan.net/.
D. Renewable Energy Performance Platform, Sub-Saharan Africa
. Background
Renewable Energy Performance Platform (REPP) concept was initially developed
by the European Investment Bank (EIB), although the funding is mainly provided
by the Government of the United Kingdom. Also, the United Nations Environment
Programme is part of the scheme and played a crucial role, especially in the design
and implementation phase of REPP. The initiative was launched in with the aim
to promote small and medium-sized renewable energy power generation projects
up to MW in Sub-Saharan Africa, with a focus on project development support,
viability gap funding, and facilitation of financial close. The current funding volume is
£million (about million) and is provided by the United Kingdom Department
of Business, Energy and Industrial Strategy.
. Description of the Scheme
REPP focuses on projects in relatively advanced stage of development and provides
these with funding and technical assistance to finalize project development stage and
achieve bankability and financial close. The REPP manager is a private sector advisory
company specializing in the sector and was selected through a competitive bidding
process to run REPP. The team consists of about experts.

Brief Summary of Similar Schemes Applied in Other Countries
41
The main financing instruments of REPP are project development finance and
viability gap finance for project developers. In addition, the REPP team provides help
in connections with investors, financiers, and risk mitigation providers.
Project development finance is structured as risk finance to match with specific
project development phase expenses of the projects as well as to be repaid with
interest/return in case the project is successful. The project development funding has
to be repaid if the project is successful. If the project is not successful, the developers
do not have to repay the funding. To receive project development funding, the
project should have an identifiable path and plan to bankability and financial close,
including the specific activities, milestones, and related budget needed to finalize
the project development stage. REPP funds specific well-defined expenses of the
remaining project development activities, such as drafting of bankable PPA and ESIA,
the developer also being requested to cover a share of these remaining expenses. In
many cases, project development capital investments are in the range of ,–
, per project, but in some cases can be even ,–,.
In case the project is otherwise sound but there is a financing gap in the
implementation phase or returns are not sucient to compensate for the risk,
REPP can also provide viability gap funding. This can be simple top-up premium, to
complement the PPA the project has with the utility, or on top of the national feed-
in tari price. In that sense, the REPP viability gap funding is similar with the GET
FiT scheme described above. However, the REPP viability gap funding is provided
on case-by-case basis, not through competitive bidding, and it can be much more
flexible than GET FiT top-up premium. In case of every request, the team will
carefully look at the project, its financial model, to see whether the viability gap
financing could be tailored to be more commercial and repayable risk financing rather
than a grant. For example, the funding can be provided as construction stage funding,
then refinanced after COD or repayable from longer-term cash flows in case it is
feasible from the project’s cash flow perspective.
In addition to project development funding and viability gap funding, REPP team
provides transaction support (i.e., technical assistance in financial issues). This
includes help in financial structuring of the project, and identification of and
matchmaking with suitable potential risk-mitigation providers, investors, and
financiers.
. Governance Structure and Funding Sources
The REPP Management Board is responsible for the high-level direction and strategic
governance of the REPP. The Management Board includes one representative from all
three founding partners of REPP: the EIB, United Kingdom Department of Business,
Energy and Industrial Strategy, and UNEP Finance Initiative (UNEP FI).
The REPP Investment Committee assumes certain delegated responsibilities from
the REPP Management Board, including the technical and financial assessments of
individual projects. Its members represent the same three founding partners of REPP,
and in addition the REPP manager.

Renewable Energy Financing Schemes for Indonesia
42
The REPP manager is responsible for the operation and implementation of the REPP.
The REPP manager is a private sector financial advisory company specializing in clean
energy finance in Africa and was awarded the REPP management contract based
on a competitive bidding process. The REPP manager is responsible for creating
and implementing the procedures for project identification, evaluation, structuring,
negotiation, as well as portfolio management and monitoring. This work is done under
the guidance by the REPP Management Board and Investment Committee. Based on
approved strategic and other guidelines, the REPP manager operates independently
and prepares financing proposals for approval by the REPP Investment Committee.
. Relevance and Lessons for Indonesia
REPP is a good example of three interventions also needed to promote renewable
energy investment in Indonesia: viability gap funding, project development funding,
and technical assistance. It is interesting that REPP is fully based on case-by-case;
bilateral; and first come, first served approach. For example, in contrast to GET FiT
scheme as described above, REPP provides its viability gap funding case-by-case
at the sole discretion of the REPP manager, therefore working almost like a private
investor. The same approach is used in project development financing for projects.
The pros of this approach include that the financing can be better tailored as
risk finance according to the specific features of each project, and in many cases
is repayable in case the project is successful, therefore improving the financial
sustainability of the fund. This also distorts the market less, as the finance is always
“as commercial as possible.” Also, the likelihood of achieving the financial close is
higher as the project development financing is better planned, and REPP will look
at the whole financing needs of project development, and ensure that REPP’s and
the developer’s financial resources can realistically cover the remaining project
development expenses to reach bankability. This is not necessarily as explicit in grant
schemes based on calls for proposals. The expenses funded by REPP will not include
salaries and costs of the developer, but is explicitly limited to procurement of certain
well-defined professional services from third-party service providers, such as drafting
of agreements and ESIAs.
The cons of this approach are that such case-by-case structuring is time-consuming
and requires substantial personnel resources and skills. The approach works as long
as the project volume is limited, such as below projects per year. As the number
of projects to be funded annually increases, the bilateral dealing with projects
becomes increasingly burdensome, and it may be advisable to move to calls for
proposals, meaning more standardization, less tailoring, but at the same time ability
to provide funding for a larger number of projects. Another con of this approach is
lack of competition, which can reach to unnecessarily high levels of funding, although
to some extent this can be mitigated by professional evaluation, negotiation, and
structuring by the management team. However, competitive bidding, when sucient
level of competition is available, can result to even lower amounts of funding
requested by project developers. Case-by-case approach also leads to judgement
calls without clear scoring or other decision-making criteria. This may be a challenge
for some public sources of funding, which prefer clear and formal rules and criteria for
project selection.

Brief Summary of Similar Schemes Applied in Other Countries
43
For more information: https://repp.energy/.
E. Competitive Bidding of Long-Term Premium Tari, Finland
. Background
Finland introduced a feed-in tari scheme for renewable energy in power generation
in . The target volume of , MW was achieved fast since the tari level
was considered generous. Consequently, the feed-in tari scheme was replaced
by a competitive auctioning of production premium. In this scheme, the renewable
energy generators sell their generated electricity to wholesale power market at the
prevailing market price (or separate contract with a wholesale buyer), and receive the
premium on top of the price reveived from the market. This system is seen to be less
market-distorting than the previous feed-in tari scheme. The first premium auction
round opened in November , and the results were announced in the end of
March.
. Description of the Scheme
The scheme is open for any renewable energy-based electricity generation project
located in Finland that is not implemented before the auctioning. The scheme
is technology netural in principle, although it is widely believed that the most
competitive projects to be selected will be wind power projects. The bidders will bid
for the premium they require on top of the electricity market price for years of
operation, and the lowest bids up to the volume to be auctioned are full. The target
in the first auction will be annual estimated production of . TWh per annum, which
in the good locations in Finland will mean about MW– MW of installed
capacity.
Unlike the premium tari auction in Uganda GET FiT, the Finnish system does not
include any qualitative criteria (such as domestic content), but will be solely based on
price. The projects just need to fulfill certain minimum criteria regarding the technical
specifications and readiness of the project to be implemented. Also, the bidders have
to place a bid bond to avoid opportunistic bidders.
The scheme is a production subsidy without any other funding or technical assistance
features, with the target being to contribute to the national renewable energy and
climate targets of Finland.
. Governance Structure and Funding Sources
The system is fully operated by the Energy Authority of Finland, which is supervised
by the Ministry of the Economy and Employment. The funding will come from
the general state budget, i.e., will be collected from taxpayers; there is no specific
earmarked tax or charge to fund this scheme. Earlier when designing the feed-in tari
scheme, the plan was to pass the additional cost on to the end-users of electricity as
a special charge in the electricity bill, but this turned out to be in a contradiction with
the Constitution of Finland, and therefore the extra cost was finally funded from the

Renewable Energy Financing Schemes for Indonesia
44
state general budget. The same principle is followed in the funding of the premium
tari auction scheme.
After selection and implementation of the project, the generators will send their
monthly generation data to the Energy Authority, which will then pay the premium
according to the calculation method specified in the bidding process.
. Relevance and Lessons for Indonesia
The Finnish scheme is an example of a competitive premium tari scheme. Such
schemes are far less used compared with competitive bidding of long-term PPAs.
In this report, the exampes of Finland and Uganda represent the premium auction
approach.
Indonesia and Finland are also very dierent from the electricity market perspective.
While the Indonesian power market is dominated by the national state-owned
monopoly utility, in Finland there is a fully competitive electricity market, where a
producer can either sell to the power exchange at prevailing hourly spot price, and
also use derivatives (such as forwards and options) to hedge the sales prices in
the future. Moreover, a producer can also agree with a wholesale market buyer to
sell its generation to this specific buyer as a bilateral over-the-counter transaction.
Electricity consumers can buy electricity from whichever producer they want, and the
transmission and distribution companies are responsible for operating the grids and
distribute this electricity-based regulated transmission and distribution taris.
Therefore, the structure of price setting, premium calculation, and the auctioning
procedure in Finland is probably not suitable in Indonesia, and are not explained in
detail here.
For more information: https://www.roschier.com/newsroom/getting-ready-for-the-
new-finnish-renewable-energy-support-scheme/.
F. Accelerating Renewable Energy in Central America
. Background
The Accelerating Renewable Energy in Central America (ARECA) was established
in to address the financial barriers especially faced by small and medium-
sized renewable energy projects in Central American countries. Banks were not
comfortable with the perceived risks associated with these projects; did not have
expertise to evaluate these projects; had diculties with the transaction costs
involved with such small projects; and consequently the collateral requirements, debt
pricing, and other terms of debt for these projects were prohibitive.
The aim of the ARECA was to initiate the market by providing a guarantee scheme,
as well as capacity building and technical assistance for project developers and
banks in order to improve the debt financing landscape for small and medium-sized
renewable energy projects. The scheme has been run by the Central American Bank
for Economic Integration (CABEI).

Brief Summary of Similar Schemes Applied in Other Countries
45
. Description of the Scheme
Partial Credit Guarantee Scheme
The ARECA program consists of a very small Partial Credit Guarantee Fund of only
million, and a small fund for technical assistance of ,. The technical
assistance fund was supposed to be used to cover the remaining technical project
design documents to achieve bankability. ARECA has not applied any competitive
procedures, calls for proposals, or formalized procedures to solicit proposals from
developers, but has identified and evaluated projects on first come, first served basis.
The scheme targeted projects up to MW installed capacity.
By , ARECA had supported nine projects by providing a partial credit guarantee.
These projects are very small, ranging from about kW solar photovoltaic systems
to MW small hydropower projects, with a combined capacity of only about .MW.
The total outstanding guarantee is . million. In , ARECA was still evaluating
three projects with capacities between . MW and MW to commit the rest
, share of the million guarantee fund. ARECA was also able to get a
further million funding commitment from the Government of Finland, bringing the
total capacity of the ARECA Partial Credit Guarantee Fund to million.
In ARECA, the guarantee covered of the debt, but only up to ,. This low
absolute cap for guaranteed loans probably also has been the reason why ARECA has
supported very small projects on average. The guarantee fee of ARECA has been only
. as applied, instead of the more typical range of –. Coverage ratios and fee
structures for individual projects were fixed so far, but there is discussion whether, in
the next phase, these should be tailored case by case.
A remarkable achievement for ARECA has been its default and loss rate so
far, i.e., all loans provided by local banks to renewable energy projects have been
performing well. To this end, there is discussion regarding increasing the leverage
eect of the guarantee fund by increasing the guarantees without increasing the size
of the guarantee fund. In practice, this means that, so far, the guarantee fund has
had available for each dollar it has guaranteed. With the track record and data on
portfolio performance gained so far, it is possible for the lenders could to trust the
guarantee fund even if it guaranteed more loans than it has actual capital, since the
banks themselves have learned to understand renewable energy sector, and they also
see that (based on the actual data) it is very unlikely that all projects would default
entirely.
Technical Assistance Scheme
ARECA has provided its technical assistance funding for projects, with the most
typical amount being , or close to it, although in a couple of projects the
amount has been only about ,–,. Already these commitments have
led to funding commitments exceeding ARECA’s own budget, but, as the fund
manager, CABEI has been able to use its other sources of funds to complete the
limited ARECA technical assistance budget. In addition, CABEI has cofunded

Renewable Energy Financing Schemes for Indonesia
46
other renewable energy projects with other development finance institutions, totaling
. million, including contributions from other development finance institutions.
Therefore, between and , ARECA’s limited , technical assistance
budget had mobilized million for renewable energy projects from dierent
funding sources to provide project development funding for developers.
The technical assistance to project developers has been in the form of traditional
grants and allocated on first come, first served basis at the sole discretion of the fund
manager team at CABEI. However, it has been recently discussed whether ARECA
should change the technical assistance grants towards repayable grants or financing
instruments for successful projects, if the technical assistance scheme was to be
replenished.
An important feature of ARECA has been its strong eorts in gathering lessons and
information dissemination. It is likely that ARECA’s impact has reached far beyond
the project developers and banks directly involved, and that, through the information
dissemination activities, the knowledge and skills of these stakeholders have
remarkably improved.
. Governance Structure and Funding Sources
The ARECA program has been operatively managed by CABEI as the executing
agency, which is the regional multilateral development bank in Central America, more
specifically, CABEI’s Department of Development and Competitivity.
The Project Coordination Unit at CABEI Department of Development and
Competitivity was very narrowly resourced, consisting of only a project coordinator
and a young professional to assist the coordinator. This has been seen as a mistake
from the outset, since the active facilitation, project evaluation, support for project
developers, and banks across the region as well as information dissemination would
require much more personnel. Later, the team was expanded by adding two persons,
located in dierent countries in the region, therefore remarkably improving the
interaction between ARECA and the local stakeholders. Also, this was clearly seen as
a remarkable increase in the speed of signing guarantee agreements by ARECA.
Since the project was funded by the Global Environment Facility (GEF), the regional
oce of the United Nations Development Programme (UNDP) has acted as the
GEF implementing agency, responsible for day-to-day supervision of CABEI, and
monitoring of the fulfillment of the GEF objectives and requirements.
The ARECA Steering Committee consisted of representatives from CABEI, UNDP,
the Central American Environment and Energy Commission, and the energy and
environment ministries of all Central American countries in which ARECA operated.
Also, other stakeholders were occasionally invited to the steering committee
meetings, which were held once a year. The steering committee monitored the
progress and achievement of the targets by ARECA program, the operational work by
the Project Coordination Unit at CABEI, and provided strategic guidance.

Brief Summary of Similar Schemes Applied in Other Countries
47
ARECA was initially fully funded by the GEF, but later the Government of Finland
provided an additional million to the original million guarantee fund.
. Relevance and Lessons for Indonesia
The challenges that the ARECA program targeted in Central America were very
similar to those identified in the renewable energy sector in Indonesia:
(i) lack of appropriate financing structures,
(ii) high collateral and investor equity requirements,
(iii) lack of interest by large energy market participants in small projects,
(iv) high costs of project development costs, and
(v) lack of sector knowledge by local banks.
Also, the interventions of ARECA to tackle these challenges were very similar to the
three funding windows proposed for Indonesia:
(i) improving the catalytic role of CABEI in strategically promoting increased
lending on a project finance basis to small and medium-sized renewable
energy projects,
(ii) increasing technical and financial capacities of CABEI and the local banking
sector to finance these projects,
(iii) realizing a million GEF-funded partial credit guarantee facility to leverage
the availability of equity and debt financing for renewable energy projects
under MW, and
(iv) establishing a , technical assistance fund to develop final designs of
eligible projects.
The ARECA program has shown that guarantee schemes can have a huge impact
and leverage eect, but in order to succeed, all barriers need to be addressed. Since
a guarantee can only solve part of typical challenges present in these projects, a
successful guarantee instrument has to be complemented with other interventions,
including technical assistance and capacity building at both debt provider and
borrower sides. In the case of ARECA, technical assistance activity also included
broader outreach and information dissemination activities, not only funding and
other support for project developers. This was seen as having crucial impact on the
development of the whole renewable energy financing market in the region.
Initially, ARECA was clearly underresourced, which was seen as slow implementation
and low initial deal flow. The situation was improved when more sta were hired, who
were deployed in the field, not only in the CABEI headquarters. As a comparison to
REPP, although the latter being also financially much larger, REPP has an operative
management team of capable and experienced private sector professionals of
about persons, including regional representatives, such financial, technical, and
environment experts in the team. The stang plan and respective budget have to
be realistic and take into account the extent to which project level tailoring and
structuring are needed.

Renewable Energy Financing Schemes for Indonesia
48
Although the guarantee provided partial coverage for credit risk faced by the banks,
these still require collateral for the remaining uncovered part, and will typically never
have an open position. Therefore, the developers still face the challenge to provide
the needed collateral. Also, in the Indonesian context, it has to be considered how
the remaining share of the debt will be guaranteed and how the project sponsors can
provide the required equity contributions in addition to debt financing.
For more information (final evaluation report of ARECA): https://info.undp.org/docs/
pdc/Documents/HND/ARECAFinalReport.pdf.
G. Turkey Sustainable Energy Financing Facility, European Bank for
Reconstruction and Development
. Background
Sustainable energy financing facilities (SEFFs) are the standardized credit line
approach of the European Bank for Reconstruction and Development (EBRD) to
promote debt financing for renewable energy and energy eciency projects in its
target countries. Through SEFFs, the EBRD extends credit lines to local financial
institutions that seek to develop sustainable energy financing as a permanent area
of business. Local financial institutions onlend the funds which they have received
from the EBRD to their clients, which include small and medium-sized businesses,
corporate and residential borrowers, and renewable energy project developers.
In addition to credit lines, SEFFs always include a substantial budget and plan for
capacity building, technical assistance, marketing, and other implementation support.
In this chapter the SEFF implemented in Turkey (TurSEFF) will be described as an
example of EBRD’s SEFFs.
. Description of the Scheme
TurSEFF was established in to provide credit lines to local financial institutions
for onlending to small and medium-sized enterprises to finance energy eciency
and renewable energy projects. The credit lines blend commercial lending of EBRD
and the Japan Bank for International Cooperation with concessional lending from
the Clean Technology Fund (CTF, part of the Climate Investment Funds), the total
amount of lending capacity being million, most of it ( million) coming
from EBRD as commercial debt. In addition to credit lines, a substantial amount of
technical assistance was provided by the European Union (. million) and CTF
(. million).
Credit Lines
The credit lines were allocated to local banks according to banks’ own interests and
activities, although these were naturally incentivized to do so, for example by using
technical assistance to do awareness-raising and create demand for the loans in the
market.

Brief Summary of Similar Schemes Applied in Other Countries
49
All forms of renewable energy with project sizes up to MW were eligible. There
were clear eligibility criteria for each project category. In the field of renewable energy
and energy eciency, the maximum size of loans was million per project.
Loans were provided on a first come, first served basis. The process involved the
project developers sending a formal application with a feasibility study (or similar)
for evaluation to the TurSEFF project implementation team and a bank having signed
a credit line agreement. The project implementation team make its own evaluation
and either approved or reject the project for TurSEFF funding. In parallel, the bank
carries out its preliminary credit screening. If the outcomes of both TurSEFF project
implementation team and bank are positive, a consultant will prepare a so-called
Rational Energy Utilization Plan (REUP). A REUP summarizes the structure of the
investment, ensuring it is cost eective and meets eligibility criteria. REUPs also help
to identify suppliers and installers of recommended technologies and equipment
and support the loan application to the partner bank. TurSEFF also included a
system of eligible equipment and suppliers to be used. All this will help to reduce the
transaction costs when dealing with small and medium-sized projects.
After a slow start, all funds are committed in credit lines for five local banks
within –years. TurSEFF was so successful that it was later expanded with an
establishment of a MidSEFF, targeting medium-sized renewable energy projects, with
the maximum loan size increased to million.
Technical Assistance
In all SEFFs, including the TurSEFF, a substantial technical assistance plan with related
budget has been mentioned as a key success factor. TurSEFF enjoyed an about
million technical assistance support (i.e., about . of the size of the available
credit lines) from the European Union and the CTF. A projet implementation
team consisting of both local and international experts was established to manage
the implementation of the technical assistance and the TurSEFF as a whole. The
technical assistance activities of TurSEFF consisted of the following activities:
(i) Promotion of TurSEFF. Targeted marketing campaigns and public awareness-
raising created a recognizable financial brand.
(ii) Capacity building at local partner banks. Training enabled bank sta to
identify, evaluate, and process sustainable energy projects. In addition,
international and local experts were hired to support partner banks with
the development and implementation of lending procedures and policies,
including the formulation of eligibility criteria for sustainable energy loans.
The experts also helped partner banks to monitor their evolving loan
portfolios. This included both “in-the-class” training and “on-the-job”
training.
(iii) Capacity building at local businesses. Advisory support was made available
to local businesses and technical experts who received on-the-job-training
and support in the preparation of energy audits and feasibility studies.
(iv) Monitoring and reporting. Independent experts carried out this task to avoid
any conflict of interest during the assessment and evaluation of completed

Renewable Energy Financing Schemes for Indonesia
50
subprojects. The experts hired for this task were required to ensure that
TurSEFF objectives were met and to confirm the completion of subprojects
in accordance with the investment plans.
. Governance Structure and Funding Sources
SEFFs are a “brand” of the EBRD, which was the primary sponsor of the TurSEFF.
EBRD always works with other development finance institutions to cofinance the
SEFFs. In case of the TurSEFF, the sources of funding are:
Credit Line
European Bank for Reconstruction and Development: million commercial
debt
Japan Bank for International Cooperation: million commercial debt
Clean Technology Fund: million concessional debt
Total: million
Technical Assistance
European Union: . million
Clean Technology Fund: . million
Total: . million
The core of the governance and management structure of the TurSEFF was EBRD’s
project implementation team, located in the country and consisting of both local and
international experts to ensure all needed aspects of expertise, knowledge, skills, and
networks needed to operate the facility eciently. This team worked hands-on and
on a daily basis with banks, project developers, and other stakeholders to promote the
TurSEFF, identify and evaluate projects, and educate and negotiate with banks. The
team is also responsible for monitoring and reporting to the EBRD and other funders
to ensure that the facility is working within its mandate and progressing towards its
objectives, and that other rules and regulations are followed.
. Relevance and Lessons for Indonesia
The challenges faced by the renewable energy and energy eciency sector of Turkey,
to a large extent, were very similar to the ones faced by Indonesia.
(i) Investors lack familiarity with energy eciency projects, and therefore
misjudge the benefits and risks of such projects. Private sector investors
often associate energy eciency projects with high financial and technical
risks and poor financial returns. In addition, upfront transaction costs, which
may arise from energy audits and feasibility studies, can discourage investors.
These costs can be increased by a lack of experience among the engineering
service companies that would develop such projects.
(ii) Banks are not familiar with sustainable energy projects and have insucient
capacity to evaluate them. Most local banks have limited capacity and

Brief Summary of Similar Schemes Applied in Other Countries
51
experience in identifying, evaluating, and processing energy eciency
and renewable energy projects. As a result, they oer few, if any, financial
products designed specifically to finance sustainable energy projects, and
require substantial technical assistance to develop such products.
(iii) Financial resources and dedicated lending facilities are scarce. Sustainable
energy measures require long-term funding. In recent years financial
institutions have had limited access to long-term financing, and in Turkey
banks have traditionally relied on short-term financial products.
The SEFF concept, consisting of a credit line plus extensive technical assistance
package, covers many of the similar activities outlined for Indonesia’s potential
scheme. It does not include viability gap funding and direct financing for project
developers to cover costs and share risks of project development phase, but
addresses the other aspects.
It is interesting that the TurSEFF started as a small-scale facility, providing loans of
only up to million only at the project level and, in the subcategory of renewable
energy, the maximum capacity was MW. In the context of Indonesia, this could
be suitable for IPP projects and electrification projects, but many larger (or medium-
sized) projects could not benefit. Subject to availability of funds, and based on the
success of the TurSEFF for small-scale projects, the TurSEFF was expanded by the
introduction of MidSEFF, providing loans up to million per project, making it
more meaningful for projects of MW or more.
It could be considered also in Indonesia, whether a smaller first phase of the fund
could be taken first, supporting mainly IPP and electrification projects. Later, subject
to the track record and lessons of the first phase and availability of funding, the fund
could be expanded to provide loans for medium-sized projects, whith higher lending
cap per project. This approach would give time to provide the PLN with capacity
building and technical assistance to help integrate smaller plants in the first phase,
and only thereafter dealing with larger individual, possibly intermittent, renewable
energy plants.
For more information: http://www.turse.org/.

A. Introduction
The Energy Resilience Fund is a public funding intervention mechanism and therefore,
in addition to funders, governmental steering is crucial. This is ensured first by having
the relevant ministries represented in the steering committee of the ERF. During
the fact-finding mission, it became additionally evident that the two governmental/
semigovernmental entities most suitable to take the role as the fund manager would be the
PT Sarana Multi Infrastruktur (SMI), a state-owned enterprise engaged in infrastructure
project financing with its total capital shares owned by Indonesia through the Ministry of
Finance and the BLU under the same ministry and its specific mitigation window under the
Ministry of Environment and Forestry.
SMI already operates similar funds in various sectors and has many of the needed skills and
expertise to operate the EFF. SMI is also an accredited entity by the Green Climate Fund,
showing commitment to manage green funds, and is managing Indonesia’s first green bond.
However, the fact-finding mission also indicated that the current resources available at the
SMI might be insucient to take this responsibility.
The current understanding is that, in case of SMI being appointed the manager of the ERF,
the number of capable personnel to manage the ERF would need to be strengthened.
In addition, SMI’s experience with viability gap funding is limited and, in the stakeholder
meetings, it became evident that it would be recommendable to look for alternative
governance and management structures for viability gap funding. For this reason, it is seen
feasible to consider the BLU as the manager of the VGF vehicle as an economic incentive
mechanism, while SMI would be managing the financial instruments, i.e., PDF and CEF
windows.
Of the other relevant stakeholders needed to make the ERF a success the developers,
banks, investors, and the PLN seem to be the most crucial ones. Failure of one of these
stakeholders can lead to failure of the whole funding scheme by stalling any activities.
According to the fact-finding mission, it is questionable whether these stakeholders have
the needed expertise and incentives to play their roles to finance and implement renewable
energy-based power generation projects.
VII. Governance Structure
of the Energy Resilience Fund

Governance Structure of the Energy Resilience Fund
53
Therefore, the ERF should have a strong feature of technical assistance and capacity
building oered for these multiple stakeholders, provide concrete additional value
to these, and the ERF should be prepared to be the “renewable energy champion” to
drive the change, at least initially. Reflecting against one of the main objectives of the
ERF to build the market and capabilities, in addition to adding new renewable energy
capacity, this means that the fund management and technical assistance activities
should have proper budgets to respond to this challenge.
B. Governance and Organizational Structure of the Energy
Resilience Fund
The operational management responsibility of the ERF would be divided between
SMI and BLU. SMI would manage the PDF and CEF windows, whereas BLU would
manage the VGF window. Using two entities to manage the funding windows
may contain a risk of inecient resourcing, duplication of certain functions, and
coordination issues. However, in this case, the division between these could
be justified since the PDF and credit enhancement funding windows would be
fundamentally dierent from the viability gap funding window, and therefore dierent
personnel resources and skillsets are required in each.
In project development and credit enhancement funding windows, project
development and financial structuring skills are crucial, and these experts need to be
experienced in this field. SMI already manages similar funding vehicles, and therefore
it can be expected that it has good prerequisites to successfully manage these
funding windows. On the other hand, VGF does not require that much project hands-
on project development and financing skills, but rather expertise in running calls for
proposals and bidding processes.
Further, it is proposed that the ERF and fund managers SMI and BLU would be
supported by a strong team of experts, including local and international experts.
Either one or both of these fund managers would contract a service provider through
an international competitive bidding process. Since the contract would be a multiyear
(and multimillion United States dollars) agreement, the fund managers can expect
to attract and acquire the best experts, both domestically and internationally, to
work on the fund management. Fund managers would establish a fund management
unit consisting of its own personnel and the contracted service provider. This can
be done in many ways, and the fund managers need to have certain level of freedom
to organize the day-to-day operational fund management work between in-house
experts and the contracted service provider.
However, several international experiences have shown the benefits of using an
external private sector service provider working as a service provider for a public
sector fund manager (or directly under a governing body consisting of funders). In
fact, this is a typical arrangement. In practice, all of the case examples and success
stories described in chapter VI include some kind of private sector service provider in
the management of the financing vehicles.

Renewable Energy Financing Schemes for Indonesia
54
SMI and BLU would still be the formal and responsible fund manager and do the
day-to-day work; manage, monitor, and report the work and progress to a steering
committee, consisting of the funders and the relevant ministries. It could also include
other crucial stakeholders such as PLN and the financial supervisory authority OJK, at
least as observers.
The service provider team would work closely together with fund managers SMI
and BLU, but also relatively independently according to the mandate, targets, and
clear key performance indicators (KPIs) provided by the steering committee, and
supervized by and in close day-to-day cooperation with the SMI. The service provider
team would evaluate projects; help negotiating deals between projects, investors, and
financiers; and develop and prepare documentation and funding proposals to the
SMI. SMI would formally make funding proposals to the steering committee based on
the proposals prepared in cooperation with the service provider. The service provider
would also identify needs for technical assistance and capacity building activities, and
design and implement activities together with SMI and BLU.
Decisions made under each funding window would happen independently of other
funding windows, i.e., being selected to receive VGF, PDF, or credit enhancement
funding does not automatically imply receiving funding from other funding
windows.
At the time of writing, SMI is in the process of establishing a new fund structure called
SDG Indonesia One. According to the concept design, the fund has many similarities
with the ERF proposed in this report. However, the SDG Indonesia One will be a
broader concept both in terms of sectors covered and instruments to be oered.
Since dierent sectors can be very dierent from a financing point of view, the SDG
Indonesia One fund has to design more detailed sector-specific approaches and
instruments. It would be recommendable to develop the renewable energy sector
funding activities under SDG Indonesia One and the ERF in a coordinated manner.
For example, the concept designs for the ERF as proposed in this report could be
utilized when operationalizing the renewable energy sector financing activities within
the SDG Indonesia One.
There are certain challenges identified with this structure, of which resourcing and
mobilization of the activities is one. Notably, BLU is currently still a nonfunctional
entity, and there will be need for proper resourcing to mobilize the BLU, and still
there is a risk that it will take time. Also, the current capability and personnel
resources of the SMI is probably insucient and, in addition to an external private
sector service provider, also SMI’s internal resourcing needs to be strengthened.
It is proposed that, for all funding windows and the needed technical assistance
and administration, funding and other resources for a team of – full-time
persons would be reserved, including both funds, and both in-house personnel and
the service provider team. These teams should additionally receive management

Governance Structure of the Energy Resilience Fund
55
and administrative support from at least SMI and relevant ministries. Of these
personnel resource at least two thirds would be working in SMI and its service
provider managing the PDF and credit enhancement funding windows, and the rest
in the VGF window.
Although the technical assistance and capacity building are shown separately, it
should not be considered as a separate funding window, but instead the activities
would be embedded in the PDF and credit enhancement funding windows managed
by SMI and used in tandem with these, as explained in the respective chapters
in more detail. However, this activity is separately shown here because of to its
great importance, resource needs, and the fact that it has to be well-planned and
coordinated at the main ERF level in order to achieve the objectives of the ERF,
although operationalized through PDF and credit enhancement funding windows.
An important issue is that the PDF and credit enhancement funding will be available
to projects and project developers only, whereas technical assistance and capacity
building will be also available to all the other relevant stakeholders involved with
projects, such as banks, investors, and PLN, not developers and projects only.
One potential issue of concern in the governance structure is the tendency of risk aversion
of the financial entities. During the fact-finding mission, some stakeholders expressed
their concerns of general risk aversion of financiers, including SMI. The ERF would be
exposed to a relatively high level of risk, especially the PDF window, and the manager(s)
should be capable and willing to take this risk. This aspect should be addressed by setting
clear targets and KPIs to incentivize sucient (but balanced) risk-taking.
However, even if such incentives were introduced, there is still a potential
problem with the so-called “state-loss” issue, meaning that, in case public funds
are lost because of a risky investment, the fund manager could face serious legal
consequences. This includes both the individuals making investment decisions,
higher level directors of these organizations, and also these organizations as such. It
was believed by some stakeholders that such state-loss issue is remarkably aecting
decision-making in these institutions, and the issue should be explicitly addressed
and managed if the ERF was established. Otherwise, any targets or KPIs would not
have the desired impacts.
There are three main options proposed for the governance structure of the ERF.
These can be further fine-tuned into suboptions . Each of the three main options
include SMI and BLU as fund managers. The dierences of the options are related
to steering committee arrangements, organization, and procurement of the service
provider team(s), and the potential linkages between SMI and BLU. The final choice
of governance structure depends on the ministries and funding sources, and at this
stage it is not possible to make one proposal regarding this aspect.

Renewable Energy Financing Schemes for Indonesia
56
Option (Figure ): Assuming the sources of funding are the same for all three
funding windows, the ERF could consist of one steering committee only. It could
also be considered to appoint SMI as the advisor of BLU, thereby making it faster to
mobilize BLU. In fact, SMI already has a similar advisory role in the PPP scheme where
it carries out project evaluations although it is not involved in decision-making in the
PPP scheme. It is also possible to think this as an initial setup to mobilize the VGF
faster, with more independence of BLU once it is up and running.
- One steering committee for both
fund managers
- Strategic decision-making and
steering
- Target and KPI setting
- Final project level funding decisions
-
Embedded
in PDF and
CEF
- Independent
management of each
funding window
according to the
strategic mandate and
KPIs
- Cooperation with and
reporting to
SMI/steering
committee
- Operational responsibility for
respective funding windows
- Monitoring and reporting of
operation and achievement of
targets and KPIs
- Day-to-day work in fund
management with the service
provider and stakeholders
- Funding partners
- MOF, MOE, MOEF BAPPENAS,
SMI
- (PLN, OJK, other as observers)
Steering Committee
- Consortium of private
consultants/fund managers
selected through competitive
bidding process
Service provider
SMI’s other funding
instruments
Other stakeholders Projects
PDF and CEF
Fund Manager: SMI
Technical Assistance
Project Development
Fund
Credit Enhancement
Fund
Viability Gap Fund
VGF Fund Manager: BLU
Advisor
- Coordination and
possible cofinancing
Figure 6: Main Level Governance and Organizational Structure
of the Energy Resilience Fund, Option 1
BAPPENAS Badan Perencanaan Pembangunan Nasional (National Development
Planning Agency), CEF credit enhancement fund, KPI Key Performance Indicator,
MOEMinistry of Energy and Mineral Resources, MOEF Ministry of Environment and
Forestry, MOFMinistry of Finance, OJK Otoritas Jasa Keuangan (Financial Services
Authority), PDF project development fund, PLN Perusahaan Listrik Negara (State
Electricity Company), SMI Sarana Multi Infrastruktur, VGF Viability Gap Fund.
Source: ADB.
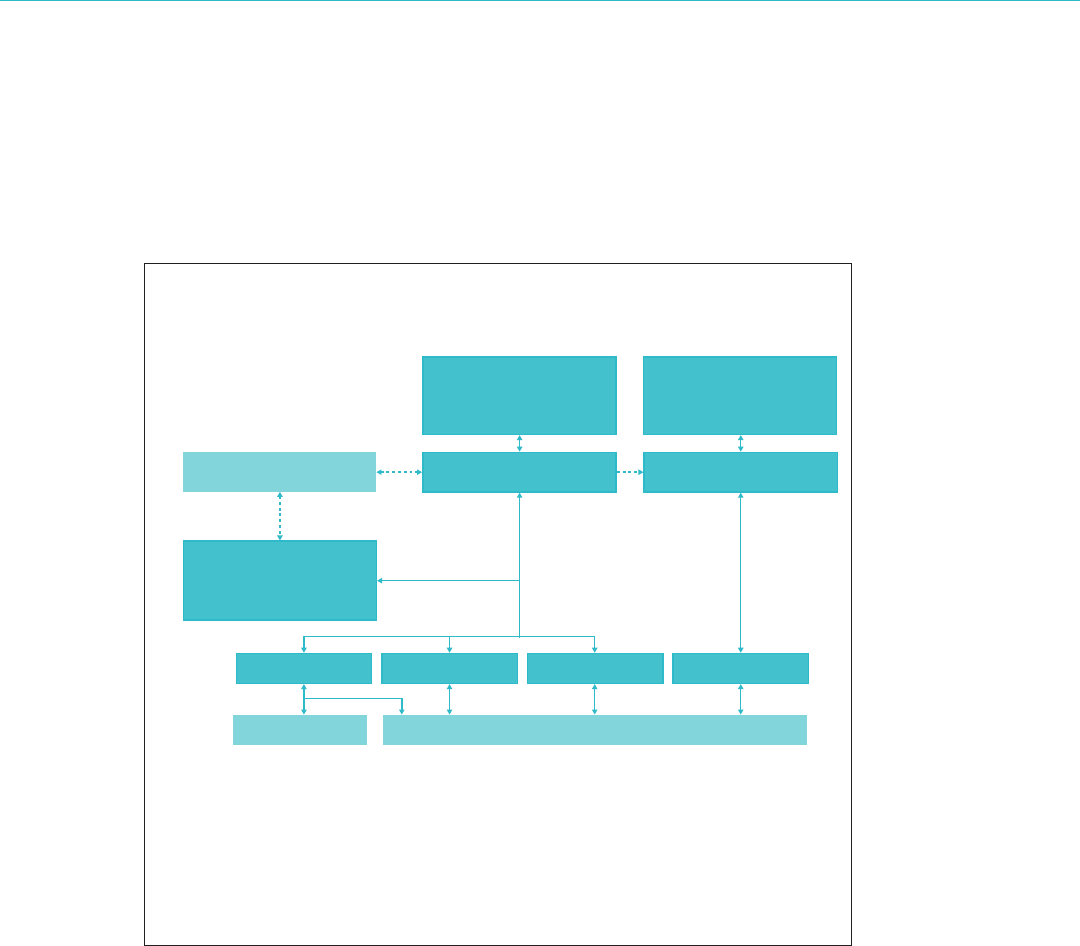
Governance Structure of the Energy Resilience Fund
57
Option (Figure ): Assuming the sources of funds are dierent under funding
windows, it could be recommendable to have separate steering committees for both
SMI and BLU. Since the ministries and other stakeholders in both streering
committees would be largely the same, this would enable sucient steering group
level coordination.
- Two separate steering committees
- Strategic decision-making and
steering
- Target and KPI setting
- Final project level funding decisions
- Funding partners
- MOF, MOE, MOEF BAPPENAS,
SMI
- (PLN, OJK, other as observers)
Steering Committee
- Funding partners
- MOF, MOE, MOEF BAPPENAS,
SMI
- (PLN, OJK, other as observers)
Steering Committee
- Consortium of private
consultants/fund managers
selected through
competitive bidding process
Service provider
SMI’s other funding
instruments
PDF and CEF
Fund Manager: SMI
VGF Fund Manager: BLU
Advisor
-
Embedded
in PDF and
CEF
Other stakeholders Projects
Technical Assistance
Project Development
Fund
Credit Enhancement
Fund
Viability Gap Fund
- Independent
management of each
funding window
according to the
strategic mandate and
KPIs
- Cooperation with and
reporting to
SMI/steering
committee
- Operational responsibility for
respective funding windows
- Monitoring and reporting of
operation and achievement of
targets and KPIs
- Day-to-day work in fund
management with the service
provider and stakeholders
- Coordination and
possible cofinancing
Figure 7: Main Level Governance and Organizational Structure
of the Energy Resilience Fund, Option 2
BAPPENAS Badan Perencanaan Pembangunan Nasional (National Development
Planning Agency), CEF credit enhancement fund, KPI Key Performance Indicator,
MOEMinistry of Energy and Mineral Resources, MOEF Ministry of Environment and
Forestry, MOFMinistry of Finance, OJK Otoritas Jasa Keuangan (Financial Services
Authority), PDF project development fund, PLN Perusahaan Listrik Negara (State
Electricity Company), SMI Sarana Multi Infrastruktur, VGF Viability Gap Fund.
Source: ADB.
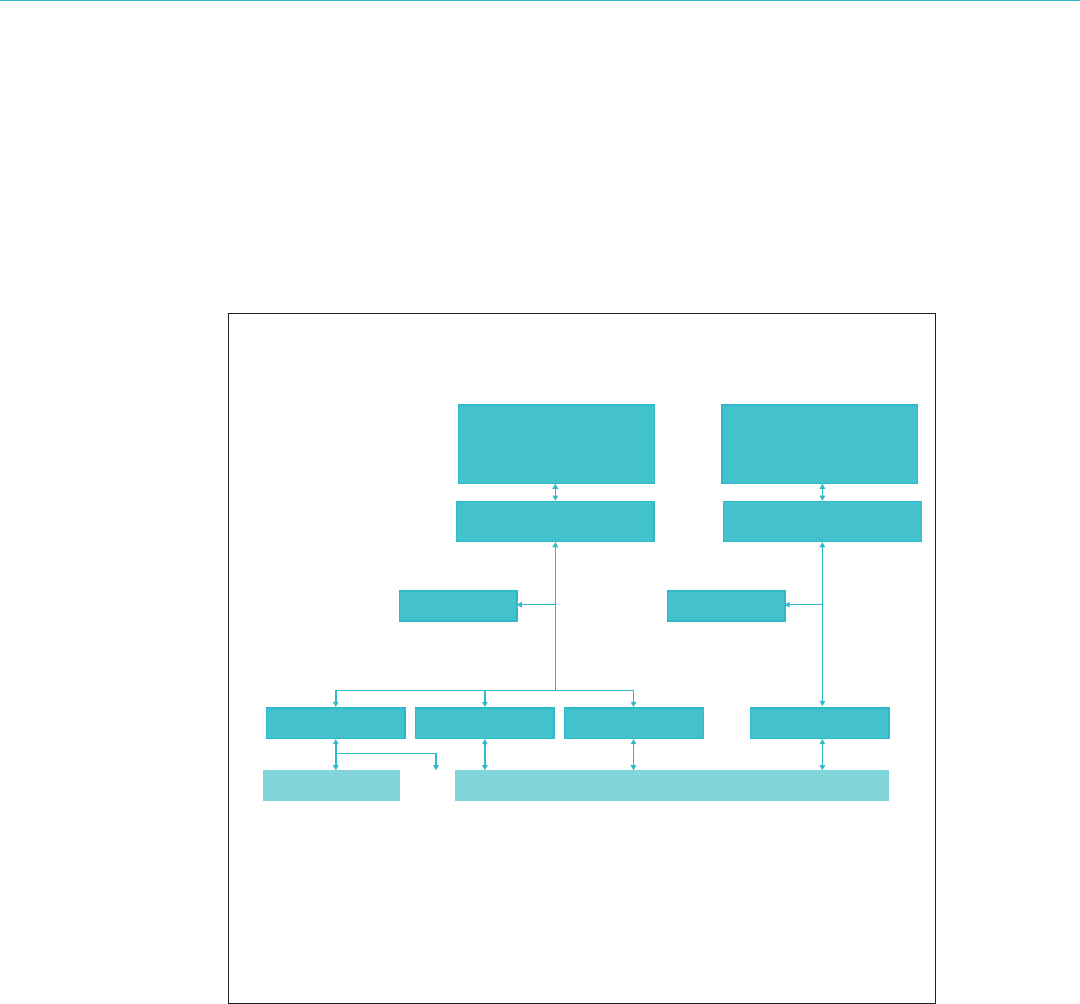
Renewable Energy Financing Schemes for Indonesia
58
Option (Figure ): It would also be possible to establish PDF and CEF under the
SMI and VGF under the BLU as entirely separate funds and respective governance
structures. In this option, SMI does not have an advisory or other role in the BLU
process, but the BLU would mobilize itself independently, and would have its own
budget to contract a separate service provider for VGF. As mentioned, this alternative
might still be ecient since the skill sets needed and the nature of the work are quite
dierent anyway from PDF and CEF.
- Two separate steering committees
- Strategic decision-making and
steering
- Target and KPI setting
- Final project level funding
decisions
- Two separate and independent
fund managers
-
Embedded in
PDF and CEF
Steering Committee
Service provider
Other stakeholders Projects
PDF and CEF
Fund Manager: SMI
Technical Assistance
Project Development
Fund
Credit Enhancement
Fund
Viability Gap Fund
VGF Fund Manager: BLU
- Separate service provider for SMI
Service provider
- Separate service provider for BLU
- Funding partners
- MOF, MOE, MOEF BAPPENAS,
SMI
- (PLN, OJK, other as observers)
Steering Committee
- Funding partners
- MOF, MOE, MOEF BAPPENAS,
SMI
- (PLN, OJK, other as observers)
Figure 8: Main Level Governance and Organizational Structure
of the Energy Resilience Fund, Option 3
BAPPENAS Badan Perencanaan Pembangunan Nasional (National Development
Planning Agency), CEF credit enhancement fund, KPI Key Performance Indicator,
MOEMinistry of Energy and Mineral Resources, MOEF Ministry of Environment and
Forestry, MOFMinistry of Finance, OJK Otoritas Jasa Keuangan (Financial Services
Authority), PDF project development fund, PLN Perusahaan Listrik Negara (State
Electricity Company), SMI Sarana Multi Infrastruktur, VGF Viability Gap Fund.
Source: ADB.

A. Description of the Instrument
The VGF window would be a competitive bidding process for a premium tari to top up
the power price the developers have already secured through a PPA under the IPP scheme,
concession under the electrification scheme, or other. Of the international example cases,
it would be close to the competitive auctioning of top-up premium in the GET FiT scheme.
The premium would be payable by the fund to successful bidders in addition to the PPA
price paid by PLN under the IPP scheme. Therefore, the projects would have two separate
revenue streams from two dierent counterparties: the power o-taker and the VGF.
The premium tari would be front-loaded to (i) be more attractive for investors because
of the time value for money, (ii) help in construction stage financing by providing a share of
VGF right after COD that can be used to refinance part of the construction stage finance,
(iii) help in the early years project cash flow when debt service burden is often heavy, and
(iv) shorten the time period required by the VGF to be involved and having to monitor the
projects, and therefore improving the cost eciency of the scheme.
B. Eligibility Criteria
. The VGF would be available to small-scale projects only (at least IPP and
electrification schemes); the size limit could be later expanded to larger projects
depending on (a)funding volume, (b) experiences on the VGF scheme, and
(c)experience gained by the PLN in the integration of renewable energy
generation. (In Turkey, the small-scale scheme was later expanded to medium-sized
projects after learning process, good track record, and higher market demand. The
GET FiT scheme is being replicated in Zambia after positive experiences and lessons in
Uganda.)
. As a starting point, the VGF would be available to all technologies in all regions
located in Indonesia.
. However, the scheme could also be split according to technologies or regions,
if this is seen as politically desirable. For example, there could be specific high-
priority regions where the needed premium is expected to be higher than in other
regions. If it is seen politically important to prioritize this region, the projects in
that region could be allocated a separate bidding window in the auction, where
the projects in the region would be competing against each other but not against
projects in other regions. This would ensure that the targeted volume of new
capacity for this specific region will be achieved.
VIII. Concept Design
of the Viability Gap Fund

Renewable Energy Financing Schemes for Indonesia
60
. However, such arrangements will increase the average premium levels and
lead to higher administrative cost of the scheme. In addition, if the bidding
is broken down into too small windows with too few projects participating
in the bidding, it might weaken the competition among projects, also
contributing to higher cost of the system. Therefore, such arrangements
must be carefully analysed beforehand.
. The projects should be ready for construction (“shovel-ready”) and must
have already conditional commitments from all investors and lenders. This is
needed to ensure that VGF does not commit funds to projects that will not
be implemented.
(a) PPA or concession signed,
(b) grid connection cleared,
(c) financing secured (financing agreements ready with conditions
precedent),
(d) needed other agreements in place, and
(e) needed ESIAs done and permits in place.
. Domestic content requirements and possible other development-related
minimum criteria.
C. Determination of the Premium Tari
. The bidders would be asked to provide a fixed /MWh (or rupiah/MWh)
price they would require/need to make the project profitable, and implement
it. The bidders can calculate this accurately as they know the financials of
their projects, and have the agreement for the respective revenue stream
(such as a PPA or a concession) signed when they participate in the auction.
Because of the competitive situation, the bidders would have incentive to
calculate the absolutely lowest level of top-up premium they would need.
. The VGF level would be fixed, i.e., no inflation indexes included.
. The payment would be front-loaded, and of it would be paid upfront at
the COD. The remaining VGF amount would be paid during the first years
of operation according to actual generation.
. The upfront payment would be calculated based on the estimated
generation during years at the commissioning, and would be considered
a advance payment for the years – of generation. In the end of the
top-up premium period (end of year ), in case the cumulative generation
during years – was lower than expected, the project would be required
to repay the advance payment for the part of generation that did not occur
(estimated cumulative volume at COD to calculate the advance payment
minus actual cumulative volume in the end of the top-up premium period).
. Alternatlively, the VGF could also be fully paid according to actual
generation only during – years of operation.
. One option to be explored in more detail would be a repayable VGF. In this
structure, VGF would be fully disbursed during the loan period. Once the
loan is fully repaid, the project would repay the VGF it has received. For
example, the project receives the VGF during the first years of operation,
and has a loan with a tenor of years. At the end of year , the project
would repay the VGF during years –. Eectively, the VGF in this

Concept Design of the Viability Gap Fund
61
structure would be years loan with years drawdown schedule, years
grace period, and zero interest rate.
. If the VGF need is large, this structure will not work since the repayment
would reduce the IRR too much. On the other hand, if the VGF need is
relatively small, such repayable VGF could work. In this assignment, it was
not possible to calculate this in more detail, and such analyses would need to
be made if this idea was to be explored further.
D. Competitive Bidding Process, Ranking, and Contract Award
. Two-stage process with first prequalification round and second RfP round.
. In the first stage (prequalification) the projects would be ranked according to
(a) experience and technical, organizational, and financial capablities of
the project sponsor; and
(b) technical merits and status of the proposed project.
. Projects meeting the minimum requirement of [e.g., ] of maximum
points will pass the prequalification stage, be short-listed to submit a full
proposal, and receive the RfP documentation.
. In the second stage (RfP), the projects would be ranked according to
combination of price and quality
(a) (e.g., ) of the points based on price; and
(b) (e.g., ) of the points based on quality/technical proposal.
. The technical criteria would be based on the eligibility criteria as well as on
the prequalification stage scoring. Again, projects should reach at least
of the maximum technical score in order to pass.
. The financial proposals of projects that pass the minimum technical score
would be opened, the lowest bid would get points in financial score,
and the rest of the projects would receive their points in relation to the
lowest bid: [ x lowest bid/own bid] points. For example, if the lowest bid
is /MWh, and another bid is /MWh, latter bidder’s financial score
would be [ x / points].
. Based in the weighting of price () and technical score () the final
combined score would be calculated as follows: [financial score x .
technical score x .].
. The projects receiving the highest final combined score would be awarded
the top-up premium at the price they have indicated in their proposal (“pay-
as-bid”). The highest-scoring projects would be selected until the financial
allocation in the bidding round would be fully committed, therefore setting
the limit for projects to be awarded the premium tari agreement.
. Example of the schedule of a competitive bidding process:
(a) Submit the expressions of interest (EoIs) by developers: deadline
months after publishing the prequalification documentation.
(b) Short-list projects by the VGF manager, sending the RfP
documentation to the short-listed projects: months after the
deadline of EoI submissions.
(c) Submit full proposals: months after short-listing and sending out the
RfP documentation.
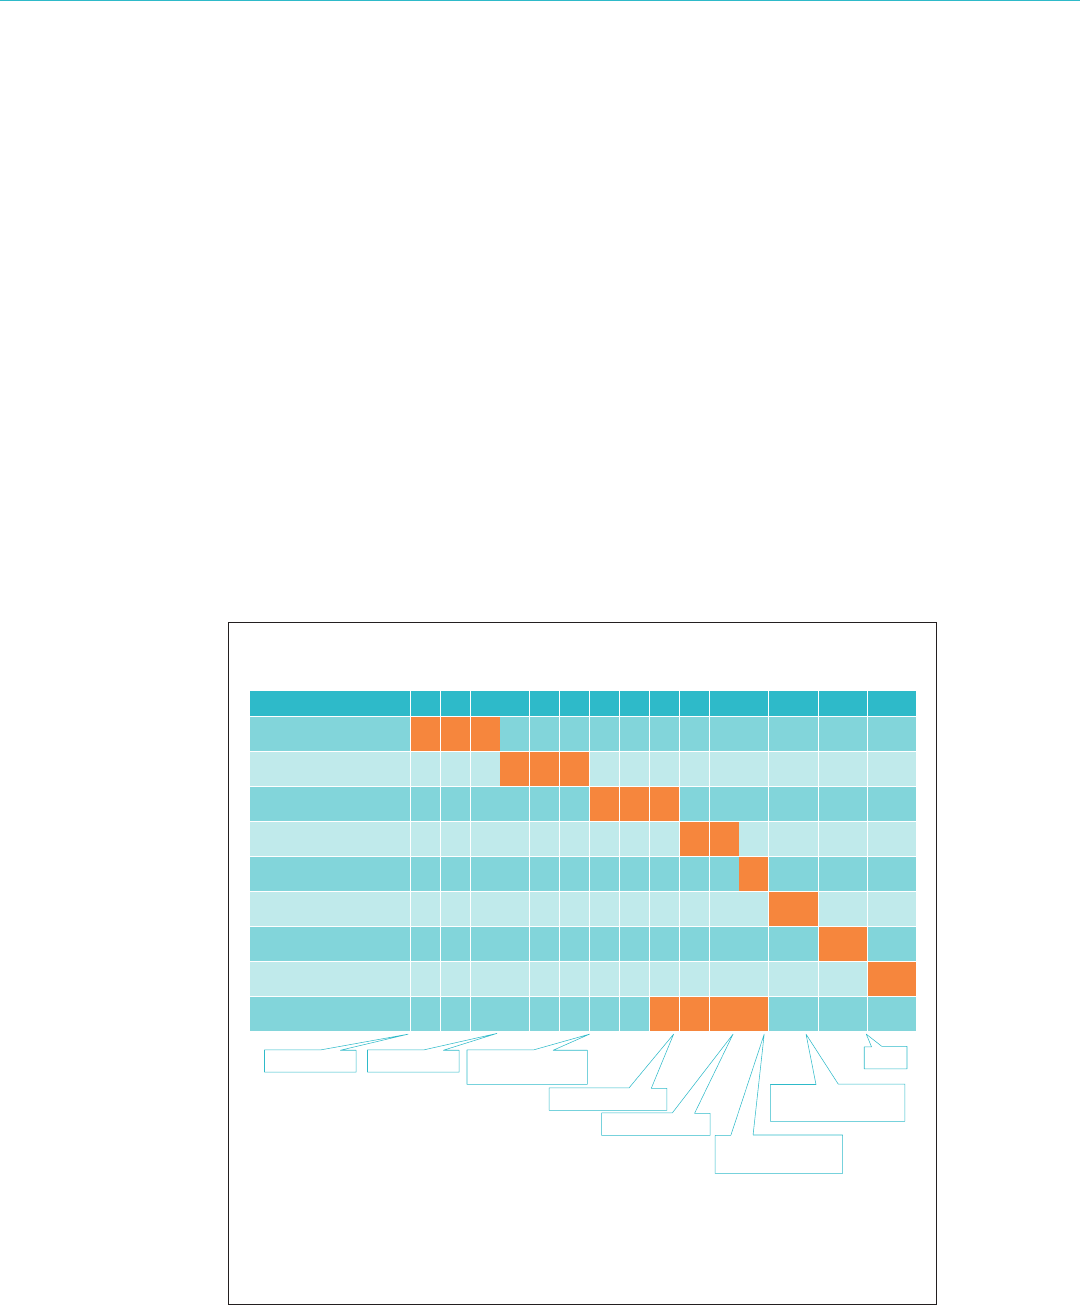
Renewable Energy Financing Schemes for Indonesia
62
(d) Score and rank the full proposals, publish the results, contract award:
months after the deadline of full proposals.
(e) Sign the premium tari agreement between the project company and
the VGF mnager: month after contact award.
(f) Financial close and start of construction: within months from signing
the premium tari agreement.
(g) COD: depending on project technology.
. Therefore, the bidding process would take about months from publishing
the prequalification to signing the premium tari agreement between VGF
manager and the project owner. In practice, therefore, the VGF manager
would always have to be preparing the new round partly in parallel with
running the current round.
. As an alternative to the combined price and technical scoring, the bidding
process could have the technical and quality requirements as eligibility
criteria only, and have the eligible projects evaluated and ranked purely
based on price only. This could make the evaluation of the bids easier and
more ecient.
An illustration of a possible timelime for one bidding round is in Table .
Table 2: Illustrative Timeline for One Bidding Round
COD commercial operation date, EOI expression of interest, PQ prequalification,
RFP request for proposal.
Source: ADB.
Phase
Publishing the PQ,
submitting EOIs
Evaluation of EOIs,
short-listing for RFP
Publishing the RFP,
submitting proposals
Evaluation of proposals,
selection
Contract award and
signing
Financial close
Construction and COD
Operation
Preparations for the
next bidding round
Jan Feb Mar Apr May Jun Jul Aug Sep Oct Nov Dec Year 2
Year 3
PQ published EOI deadline RFP to short-listed
candidates
Selection results
COD
Proposal deadline
Signing of premium
tariff agreement
Financial close, start
of construction
Year 4
onward

Concept Design of the Viability Gap Fund
63
E. Timing and Volume Considerations
. The bidding processes would be carried out once a year, five times during a
period of years.
. The total amount of funding and its distribution between individual years
and auctions would be defined or at least indicated in the beginning to help
developers to develop their projects and businesses better, and to anticipate
the upcoming auctions and expected volumes.
. At least in the beginning, the volume would be indicated as the financial
allocation rather than capacity or generation because of the uncertainty
regarding the required VGF levels per project. If it turns out that the funding
requirements are high, and the VGF had estimated lower support levels
beforehand, it could not support as many projects as it planned beforehand,
possibly leading to disappointments in the market because of lower-than-
expected volume of projects being awarded.
. The maximum level of support per MWh and per project should be
established before initiating the bidding process. These caps could be
published, or they could be used as “hidden caps,” which would be used in
the scoring process, with financial proposals exceeding either of these caps
being automatically rejected.
Figure shows an example of funding requested by four projects in a bidding process.
To illustrate the results in various situations, let us think of the two following cases.
In both cases, all four projects have received exactly the same technical score (in
order to simplify the example). In both cases, the total amount of funding available is
million.
. Case : There is no maximum caps for support per project or per MWh
generated. Projects – will be awarded a premium tari agreement since
their cumulative VGF need is . million, whereas adding project would
lead to exceeding the available budget, and therefore project will be
rejected. . million will remain uncommitted in this round and can be
rolled on to next rounds.
. Case : There is an absolute cap for VGF set at /MWh. Only projects
and will be accepted since projects and exceed the maximum /MWh
cap, even if there was still budget available to include project in the list of
winning projects. Therefore, . million funds will remain uncommitted in
this round and can be rolled on to next rounds.
Although a more detailed analysis on the expected premium tari bids should be
made, it can already be seen that the funding requirements may become extensive
even if the requests were relatively modest and the VGF was focused on small
projects only. As a minimum, the ERF should be prepared to a VGF of roughly
million as a minimum in order to make a dierence.

Renewable Energy Financing Schemes for Indonesia
64
F. Sanctions and Incentives
. Bid bond of [e.g., ,] /MW would be required to participate in the
bidding process. This should be placed at the same time when submitting
the full proposal in the second RfP stage of the process.
. The bid bond should be in form of a standby letter of credit by a bank
located in Indonesia.
. The bidders who are not successful in the bidding process would have their
bid bonds released/cancelled after the award of the VGF to the successful
bidders.
. The winning bidders shall double this bid bond to [e.g., ,] /MW after
being awarded the top-up premium tari, before signing the premium tari
agreement with the VGF manager (similar to a PPA).
. The performance bond would be released/cancelled at COD and validation
of the actual generation capacity.
. In case the bidder withdraws from the process during the bidding or
implementation phase, the bid bond or completion bond, respectively, would
be claimed by the VGF fund manager, as a sanction for the bidder in failing
to meet its obligations in the process.
. In case the project misses the COD set in the premium tari agreement
(the rules of calculating the COD deadline is clearly defined in the RfP
documentation already), the VGF manager will be able to claim part of the
completion bond on a daily basis until the delayed project achieves the
COD. The daily sanction would be [completion bond/]. Therefore, after
months the whole completion bond would be fully depleted.
. After months of delay from the agreed COD, the VGF manager would
have the right to terminate the premium tari agreement at its sole
discretion.
Peak load hours per annum 2,000.00
Annual generation, MWh/a 10,000.00
Cumulative generation, 10 years 100,000.00
Bid price for premium, $/MWh 5.00
Total funding request, $ 500,000.00
Project 1, Solar PV 5 MW
Peak load hours per annum 3,000.00
Annual generation, MWh/a 30,000.00
Cumulative generation, 10 years 300,000.00
Bid price for premium, $/MWh 10.00
Total funding request, $ 3,000,000.00
Project 2, Wind 10 MW
Peak load hours per annum 5,000.00
Annual generation, MWh/a 20,000.00
Cumulative generation, 10 years 200,000.00
Bid price for premium, $/MWh 15.00
Total funding request, $ 3,000,000.00
Project 3, Hydro 4 MW
Peak load hours per annum 6,000.00
Annual generation, MWh/a 18,000.00
Cumulative generation, 10 years 180,000.00
Bid price for premium, $/MWh 20.00
Total funding request, $ 3,600,000.00
Project 4, Hydro 3 MW
Figure 9: Illustrative Example of Bid Premium
Tari Levels in a Bidding Process
MW megawatt, MWh megawatt-hour, MWh/a megawatt hour per annum,
PV photovoltaic.
Source: ADB.

Concept Design of the Viability Gap Fund
65
. If any of the eligibility criteria of a project is lost during the premium tari
agreement disbursement period (such as a bioenergy project switching to
fossil fuels), the VGF manager has the right to terminate the premium tari
agreement at its sole discretion. In such a case, the project owner shall also
repay the part of advance payment it has received, but the respective
generation has not been materialized by the date of the termination. For
example, if the project has generated of the expected cumulative
generation as estimated at the COD and when determining the absolute
amount/cap for the premium tari available for the project, it has to
return of the received advance payment at the COD, which it has not
generated by the termination of the contract.

A. Description of the Instrument
The PDF window would provide reimbursable grants and/or risk finance for development
stage projects based on a continuous, bilateral, first come, first served evaluation,
negotiation, and contract award process. This process will help to use the public funds
more eciently by increasing the likelihood of project success and by requiring successful
projects to repay the funding (possibly with interest).
The projects to be funded through the PDF would be in an advanced stage of project
development, i.e., preferably in the feasibility study phase where remarkable progress with
regard to technical, economic, environmental and financial analyses, agreements, and
permits has been made. The projects to be funded also need to demonstrate an identifiable
path to financial close with explicit and detailed cost and timeline estimates.
Based on this identifiable path the developer and the PDF would agree on the sharing of
the remaining costs so that all of them will be covered by either of them, therefore not only
help projects “move forward” but really “achieve bankability and financial close.” Therefore,
in addition to advanced and active stage of development, the developer also needs to
demonstrate the technical and financial capabilities to finalize the project development
according to the detailed cost budget and timeline.
B. Eligibility Criteria
As the starting point, the PDF should be available to same type, size, and location of
projects as the VGF, i.e., target the same main segments.
. However, unlike the projects eligible for VGF, the projects eligible for PDF are not
yet bankable earlier stage projects, often without PPAs or other secured revenue.
They have remaining project development costs and risks that need to be covered
and taken before reaching bankability. (They can include also projects with PPAs,
but which still lack some crucial elements of bankability such as studies and
permits.)
. Although the projects are at an earlier stage, they need to be in “as advanced
stage as possible.” For example, early stage project ideas should not be considered
since they are too far from financial close and have too many uncontrollable
uncertainties. There should be no strict and clear-cut criteria for this, but the
service provider and fund manager need to evaluate the whole project portfolio,
IX. Concept Design of the
Project Development Fund

Concept Design of the Project Development Fund
67
and select the most suitable projects taking into account the project volume
target of the PDF.
. In addition to project quality and stage of development, the quality, track
record, and resources of the project developer also must be among the
eligibility criteria. The project developer needs to demonstrate sucient
capabilities to take the project to financial close.
. In principle, “additionality” should be also an elibigibility criteria, meaning
that the project faces a financing gap, which can be overcome in the
existence of PDF. If it is obvious that the project development stage would
be financed by the developer even in the absence of the PDF contribution,
project development funding would not be additional, and the project
should not be eligible for project development funding. In practice, proving
additionality or non-additionality is complex and speculative since it requires
contrafactual reasoning (what would happen if project development funding
was not available). Proving a contrafactual statement at certainty is
impossible by definition. Therefore, although the additionality has to be part
of the eligibility check of the projects to enhance the eciency and leverage
of public funding, a robust additionality analysis is not proposed, but rather
a commonsense case-by-case evaluation and justification of the financial
situation of the project.
C. Main Terms and Conditions of the Project Development Fund
Primarily, the PDF would be provided as risk finance for project developers, meaning
that it would be repayable with interest or return in the first place, and concessional
terms added only as required by a particular project. The main terms and conditions
would be as follows:
. The legal form of the instrument (from the ERF to project) could be either
grant or a financial instrument. In case of grant, the structuring would make it
eectively a financial instrument, however.
. Within the boundaries of the investment strategy and more detailed targets
by the steering committee, the fund manager and service provider would
independently structure the funding to tailor it according to the specific
needs, risks, and cash flow profiles of projects.
. Irrespective of the legal form of the funding (whether a financial instrument
or grant) the funding would resemble mezzanine loan or quasi-equity.
. Funding would be repayable and carry a fixed interest rate.
. However, the PDF financing would be repayable only in case the project
is successful. If the project is not successful and not implemented (the
definition to be clearly defined), the project sponsor/developer will not have
a repayment obligation, and the financing will not be shown as a liability in
the balance sheet of the project company.
. Funding would be primarily repayable at the financial close (paid out of
the construction finance package, which should include this repayment as
an explicit investment cost item), but the fund manager and the project
sponsor could also agree that the finance can be repayable out of project
cash flow during the operational phase. This would help the sponsor to reach

Renewable Energy Financing Schemes for Indonesia
68
financial close in case a financing gap still exists after a successful project
development stage.
. Since the pricing of the PDF is likely to have a minor impact on the project
IRR, it could be priced, to some extent, at commercial/semicommercial
terms, meaning in practice double-digit interest rates. This pricing and
repayment schedule should be tailored by the service provider and fund
manager to ensure that it will not endanger the financial stability and
existence of the project after financial close.
. From the fund manager/service provider control point of view, in order to
minimize administrative burden, a possible quasi-equity structure should
include an explicit prearranged exit clause, and not active participation in
the decision-making of the project company, since these tasks would add
the administrative costs of fund management remarkably. Instead, the
PDF financing agreement should include clear rules for the use of funds,
covenants protecting the interests of the PDF, sucient control of the use of
funds (e.g., right to audit and approve each payment separately beforehand),
and respective sanctions and control mechanisms to act if these rules or
covenants are breached (such as termination and early expiration, possible
step-in rights).
D. Selection Process
The service provider team, together with the fund manager, would identify projects
and invite funding requests from these on a continuous basis without a specific
solicitation or procurement procedure. Interested developers would submit the
required information to the fund manager/service provider. This information should
include:
. background information of the project developer/sponsor;
. detailed technical, economic, financial, environmental, and social description
of the project;
. activities and milestones achieved so far in project development, with
specification of related costs;
. detailed description of the remaining costs and planned timeline of the
project to achieve bankability and financial close; and
. detailed proposal of the sharing of these costs between the developer
and the PDF, covering all the remaining costs in the project development
process.
Based on this information, the fund manager and service provider would evaluate and
make decisions whether to fund a specific project. The criteria for decision-making
would be:
. overall quality of the project and the developer (only credible projects having
high probability of success will be considered, irrespective of the latter
criteria; therefore, this is an important eligibility criterion);
. stage of project development and expected timeline to bankability (more
advanced projects to rank higher);

Concept Design of the Project Development Fund
69
. remaining costs of development (the less costs needed to achieve
bankability, the higher ranking); and
. share of the costs borne by the developer (the smaller share of remaining
costs requested from the PDF, the higher ranking).
The process looks like a normal investment process of a private fund, being based on
bilateral negotiations, evaluation, and enabling detailed structuring and tailoring of
the finance. From documentation and decision-making perspective, the process is as
follows:
. initial contact between the developer and the fund manager/service
provider, submission of general information by the developer, including an
estimation of needed investment;
. evaluation of general information by service provider; in case the initial
eligibility is fulfilled, request for detailed information;
. submission of full set of information by the developer with a detailed
finalization plan, budget, and cost sharing;
. evaluation and requests for additional information and clarifications by the
service provider, close interaction enabling the fund manager to acquire
good understanding of the project;
. in case of a project fulfilling the criteria, proposal prepared by the service
provider to the fund manager (or by the fund manager) to start drafting a
term sheet (otherwise, rejection of the project and end of process);
. upon approval by the fund manager, the service provider drafts a term sheet
for funding, submits to the developer for review and comments;
. initial term sheet negotiation between service provider (or fund manager)
and developer;
. once term sheet negotiation is finalized, submission by service provider to
fund manager for evaluation and approval; signing of the term sheet between
the developer and the fund manager;
. after signing the term sheet and based on it, drafting of financing agreement,
start of due diligence process;
. submission of the financing agreement for approval by the steering
committee and signing by the fund manager, once the agreement
negotiation and due diligence are finalized;
. implementation of the financing agreement; disbursements according to
agreed milestones and actual expenses, supervision in procurement of
services by the project developer;
. monitoring and reporting of the project portfolio progress by service provider
to fund manager and steering committee; and
. in case a project reaches financial close, a request for repayment of financing
(with possible interest/return) sent by the fund manager; in case of project
failure (which needs to be clearly defined in the agreement), write-o by the
fund manager.
The possible project evaluation, contract negotiation, and signing process is
illustrated in Figure .
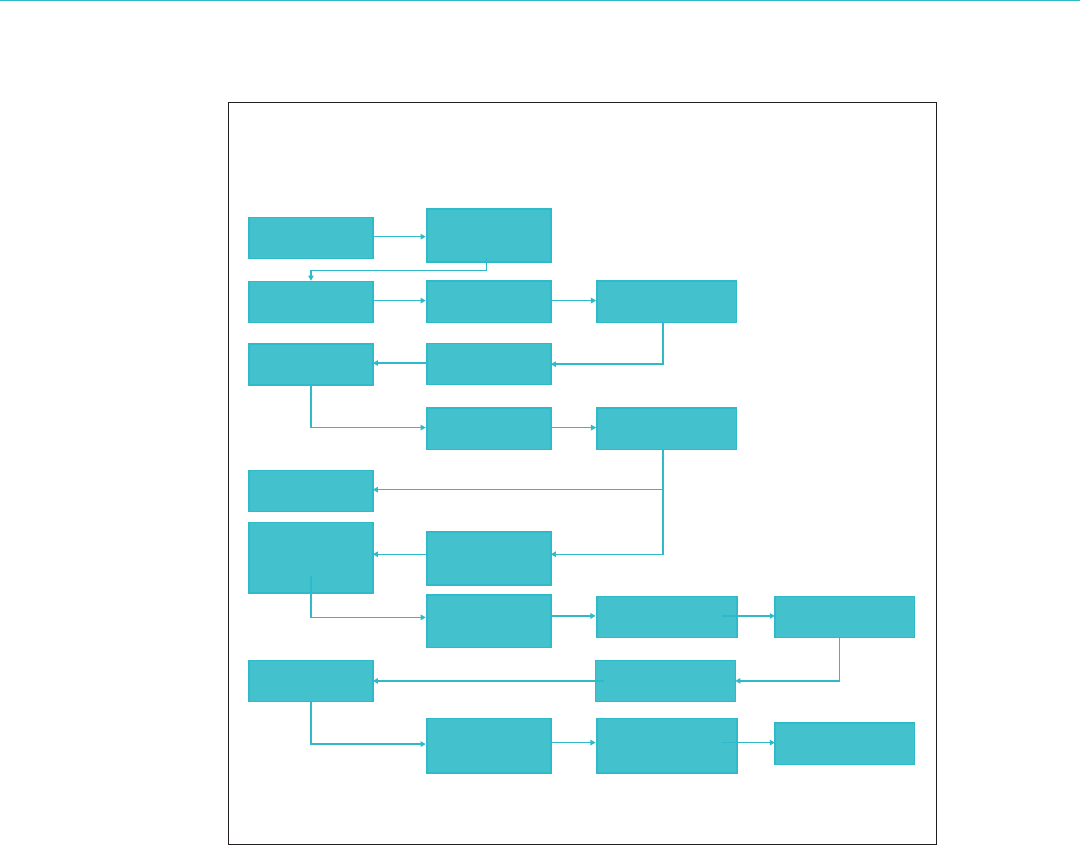
Renewable Energy Financing Schemes for Indonesia
70
Initial contact and
information
Project Developer
Initial evaluation,
request for detailed
information
Draft financing
agreement and due
diligence
Final Financing
Agreement/due
diligence complete
Comments to
Financing
Agreement/
negotiation
Service Provider Fund Manager Steering Committee
Detailed
information
Go-ahead decision
Detailed evaluation,
proposal to proceed
Comments to Term
Sheet/negotiation
Draft Term Sheet
Final Term Sheet
Signing of
Term Sheet
Approval and signing
of Term Sheet
Approval of Financing
Agreement
Approval of Financing
Agreement
Implementation,
monitoring and
reporting of project
Portfolio monitoring,
strategic supervision
Signing of Financing
Agreement
Signing of Financing
Agreement
Project and portfolio
monitoring and
reporting
Figure 10: Deal Process of the Project Development Fund
Source: ADB.
E. Timing and Volume Considerations
The bilateral first come, first served procedure with case-specific tailoring and
structuring works well as long as the amount of projects is relatively limited, roughly
up to projects per year, preferably less. If the target volume exceeds per annum,
it may become more ecient to use CfP and more standardized form of funding. In
such case, the financing can be in form of reimbursable grants, i.e., projects need to
repay if the projects are implemented, but the terms and conditions of the funding
cannot be tailored according to projects, which can make the repayment more
dicult for some projects.
In this proposal, the amount of projects receiving PDF is roughly – per annum, and
therefore – projects during the years commitment/investment period of the
ERF, and therefore the tailored bilateral first come, first served approach is proposed.
The service provider team supported by the fund manager can be expected to deal
with such volume, in parallel with other tasks and responsibilities.

Concept Design of the Project Development Fund
71
Funding need per project can vary considerably. Project development costs can easily
be million or much more, even in relatively small projects. As it is expected that the
project has already incurred considerable project development costs when applying
for funding from PDF, and as the developers is required to cover a remarkable share
of project development costs by themselves, the typical finaning commitments by the
PDF would be in the range of ,–, with an average of ,–
, per project. The assumption is that the PDF will not finance the early
stage exploration of geothermal projects, which has a specific funding and risk profile
and needs to be addressed by specific geothermal energy development funding
instruments. Geothermal projects that are applying for project development funding
under the ERF are likely to have passed this exploration phase successfully.
Based on the above, a rough range of the funding volume needed in the PDF would
be million– million, which must be understood as the order of magnitude. It
must also be noted that some of the first funding commitments to successful projects
will be paid back to the ERF during the years’ investment period, and these funds
can be reinvested in the projects in the later years of the years’ commitment period.
Therefore, the actual funding need is likely to be slightly smaller. These numbers
do not take into account the expenses of fund management and other technical
assistance provided by the fund manager and service provider to developers and
other stakeholders.
In addition to financing capacity, the PDF will also need a considerable management
budget, which is likely to be at least million per year during the years investment
period, i.e., at least million in total during this period, and a much smaller amount
after that. This cost is high compared with the relatively limited amount of project
development funding. However, if part of the management budget was transferred to
investment capacity of the PDF, it could invest in some more projects or larger tickets.
But the quality of deals would be worse, leading to more losses.
F. Technical Assistance Linked to the Project Development Fund
In addition to providing direct funding for project developers, the service provider and
fund manager will need to provide both broader capacity building and more project-
specific technical assistance to project developers since one of the main objectives
of the ERF is to build the market and capabilities, and improve the investment
framework more broadly. The broader capacity building means a planned program
of seminars, workshops, trainings, and other events addressing specific project
development issues, such as site selection, resource assessment, grid integration,
financial planning and fundraising, procurement of equipment. Also, in this process,
support from steering group members is expected (funders and relevant ministries,
regulators and other stakeholders).
The latter means more ad hoc support of the developers who receive funding from
the PDF. These developers often need help and advice in their day-to-day activities,
such as identifying suitable investors and financiers (and in the discussions with
them) as well as professional service providers to carry out the needed studies and

Renewable Energy Financing Schemes for Indonesia
72
analyses. This technical assistance is mainly directed at the developers but can
include ad hoc support to other stakeholders related to the project. As an example, in
this respect, the PDF could cooperate with the Private Financing Advisory Network
(see international experiences and success stories in chapter VI) or similar to channel
financial advisory services for projects.
Further, the PDF (see also CEF later) should include a plan for information
dissemination on best practices and possibly market data. This should be designed
in a way that it does not form an obstacle for developers to use project development
funding because of confidentiality issues, but at the same time, in a planned way, to
make sure that best practices, hard data on risks and other useful market information
will be available for a larger audience, including market players, regulators, and
policy makers. PDF financing agreements should include specific clauses on certain
reporting requirements to enable information collection and disseminaton that does
not endanger confidentiality, but at the same time adds value to market players,
regulators, and policy makers.
The PDF and related technical assistance should also be planned in close interaction
with the PLN as a crucial stakeholder for projects, with a remarkable eort in capacity
building and technical assistance directed at PLN too.

A. Description of the Instrument
The CEF window would consist of either Partial Credit Guarantee Fund or Credit Line Fund,
or it could be a combination thereof. In this chapter, both options are included, indicating
the combination of the two instruments. The project selection would happen on the basis
of a continuous; bilateral; first come, first served evaluation; negotiation; and deal-closing
process.
CEF would oer the guarantee and/or credit line for banks at predefined terms, conditions,
pricing, and tenors that would be similar to all interested or eligible banks. Primary
financing instrument oered would be the guarantee, but CEF could provide credit line
instead, depending on banks’ capability and interest. The project identification, evaluation,
negotiation, and deal-closing process would be primarily driven and managed by banks
(and developers). However, as it can be expected that the knowsledge, capacity, and
perhaps even the motivation of the banks to evaluate, negotiate, and close renewable
energy deals are limited, the service provider and fund manager sould be closely involved in
the process to support and motivate participating banks, and ensure that the debt capital
market for renewable energy is active.
B. Eligibility Criteria
The eligibility in the case of CEF needs to be defined for both participating banks and
projects. However, for banks, the eligibility criteria can be relatively liberal. The banks
need to operate in the corporate and/or project finance market in Indonesia. They should
demonstrate capability and interest in promoting their clean energy lending practice, and
they should meet the requirements by the financial market regulator OJK. It is suggested
that the detailed eligibility criteria will be defined in cooperation with the OJK, who has also
worked to establish green lending practices in Indonesia.
Regarding eligibility of projects, as the starting point, the CEF should be available for same
type, size, and location of projects as the VGF and PDF, i.e., target the same main segments.
. However, while the projects eligible for PDF are earlier-stage projects, the projects
eligible for CEF should be close to bankable and investment-ready. CEF can
provide soft commitments (e.g., comfort letters and indicative nonbinding oers),
but not give its full commitment before the projects are ready for construction.
In practice, the financing agreement can be signed at the final stages of financial
arrangements, but shall have all the actions needed to make the project
X. Concept Design of the
Credit Enhancement Fund

Renewable Energy Financing Schemes for Indonesia
74
construction ready as conditions of precedent with clear deadlines. By this,
CEF will make sure (a) its projects are only used when all needed financing
and other conditions to implement the project are absolutely in place, and
(b) in case a project is not able to fulfil the conditions precedent, the funds
conditionally committed to that project can be freed and used in another
project. This is the typical approach by lenders and is suggested for CEF too.
. In short, the eligibility criteria for projects should mirror the typical
requirements by banks, including the project and sponsor quality, bankability
of all documentation, agreements, studies, financial projections and revenue
certainty, and availability of all other components of financing.
. In principle, additionality should be also an elibigibility criteria, meaning
that the project faces a financing gap, which can be overcome with the
existence of CEF. If it is obvious that the project would be fully financed even
in the absence of the CEF contribution, the credit enhancement funding
would not be additional and the project should not be eligible for credit
enhancement funding. In practice, proving additionality or non-additionality
is complex and speculative since it requires contrafactual reasoning (what
would happen if credit enhancement funding was not available). Proving
a contrafactual statement at certainty is impossible by definition.
Therefore, although the additionality has to be part of the eligibility check of
projects to enhance the eciency and leverage of public funding, a robust
additionality analysis is not proposed, but rather a common-sense case-by-
case evaluation and justification of the financial situation of the project.
C. Main Terms and Conditions of the Credit Enhancement Fund
The main terms of the guarantee instrument would be:
. The guarantee would be partial credit guarantee, i.e., it would oer
protection for the lender in all default cases by the borrower, irrespective
of the reason (incontrast to partial risk guarantee, which would only cover
defaults because of specific risks).
. The guarantee would be on pari passu basis, meaning that the guarantee
would cover only its pro rata share of losses starting from first rupiah/dollar
of materialized loss (in contrast to first loss scheme, which would cover
of losses up to a certain amount). This will reduce the risk of moral
hazard as lenders and borrowers would have the same incentive to avoid
default situations.
. The guarantee would cover up to of losses per project, with maximum
share of of total project cost, and average (or target, or typical)
guarantee amount being about . Assuming the debt/equity ratio in
projects is about /–/, the guarantee would end up covering
typically about – of total investment cost, the rest being covered by
investors and financiers.
. To some extent, the pricing of the fund would be concessional, perhaps in
the range of – (– possibly being already commercial and possibly

Concept Design of the Credit Enhancement Fund
75
ensuring the financial sustainability of the guarantee fund), in order to help
drive down the total cost of financing of projects.
. In addition to reducing the total cost of finance for the project, the guarantee
scheme would help to extend tenors by providing guarantee tenors between
years and years (defined and agreed case by case)
. The CEF could provide indicative term sheets/conditional financing
agreements for the bidders in the VGF scheme to help reduce the premium
bid prices, and this link should be actively coordinated and promoted by the
fund manager and service provider.
. The CEF support would be conditional to all project development- and
financial close-related aspects as explained above, and therefore, when
bidding, the project developer/sponsor would take the risk of possibly being
awarded VGF, but not being able to reach financial close and therefore not
reaching the eligibility for CEF.
The main terms of the credit line instrument would be:
. The credit lines would be provided for the lenders that could blend the credit
lines in their own lending.
. The maximum amount of funding through the credit line would be of
the total cost, as in the guarantee scheme. For example, in a project having
debt/equity ratio of /, the credit line could provide –, the bank
itself –, and the investor(s) as equity/mezzanine finance. Even
in this case, the investors should be able to provide – of additional
collateral for the lenders share of the debt. Therefore, the sponsors/investors
would still need to be able to provide at least of the total investment
cost in the form of equity and collateral.
. The disbursements from the fund would be made on a pro rata basis with
the lender. For example, if the CEF provides of the loan for the project
through a credit line, and the bank of the total debt, the individual
disbursements during construction stage would always be done on /
basis between the CEF credit line and the lender’s own balance sheet.
. The credit line would have normal eligibility and disbursement criteria
typically applied by lenders (see above), and therefore the terms and
conditions of the credit line would be similar to normal loans in many
aspects.
. However, the credit line would be priced competitively, meaning single-digit
rupiah interest rates (or low-single-digit United States dollar interest rates),
driving down the total cost of finaning for projects.
. In addition, like in the guarantee scheme, the credit line would oer tenors of
– years, helping the financial structuring of projects and improving the
equity returns.
. In the first place, the credit line would not provide specific grace periods and
concessional elements, other than pricing and tenor.

Renewable Energy Financing Schemes for Indonesia
76
D. Selection Process
Like the PDF, the VGF also would be based on ongoing, bilateral, case-by-case
negotiations, not CfP or other competitive procedures. This will enable the needed
project level evaluation and structuring that is needed to help projects in reaching
financial close and using the public funds eciently at the same time.
This process would be primarily established by the banks, not the CEF, which
would merely support banks in their work. Therefore, the information needs and
the procedure would be typical loan negotiation processes. The documentation
requests would aim to ensure that the projects are bankable (permit procedures
and needed studies, assessments and analyses finalized, needed agreements either
signed or ready to be signed, all other financing unconditionally committed). Like
the loan by the lending bank, the credit enhancement funding/guarantee would
become unconditional only when everything is ready for the main equipment
purchase/engineering, procurement, and construction agreements to be signed
and construction to start. Of course, the agreement could be signed earlier with
conditions precedent to be fulfilled before the signed agreement actually enters into
force.
Although the project evaluation and negotiation procedure would be tightly
linked to banks’ own procedures, the CEF would need to play an active role in the
identification, evaluation, and due diligence together with the banks. In practice, the
developer would approach both a bank (or two to three banks) and the CEF with
an initial application and information package. This would create a trilateral process
where CEF would provide active support to the developer to run the process and to
the potential lender(s) to understand and evaluate the project, and to price and set
other terms and conditions of the loan agreement.
Therefore, from the impact of the fund point of view, it is crucial that the CEF would
not remain a passive guarantee or credit line provider for the banks, but would
actively work in the frontline as a visible player. This requires personnel resources, and
deep technical, financial, and project development skills from the fund manager and
service provider. Therefore, a crucial success factor of the CEF would be sucient
resourcing of this activity, including both local and international experts.
E. Timing and Volume Considerations
The CEF, like the ERF as a whole, would have an “investment period” of years, i.e., it
would need to be planned so that, by the end of year , all available funds have been
fully committed to projects. Since there is likely to be a considerable challenge in
building the market itself and creating both demand and supply of funding, the first
years will require more market and project identification and technical assistance,
which would be seen as lower deal volume in the early years, and increasing towards
the end of the investment period. A realistic amount of deals closed in a year could
be, for example, a few projects per annum in the beginning, reaching and more after
a couple of years, and up to projects in the latter years of the investment period,

Concept Design of the Credit Enhancement Fund
77
assuming that the banks will play an increasingly active and independent role after the
learning phase in the first half of the investment period.
In total, this could mean in the order of magnitude of – projects receiving credit
enhancement funding. This should be seen in relation to the existing pipeline of
about IPP projects with PPAs, electrification projects, and possible other project
types included in the eligibility criteria of the CEF and the whole ERF. Therefore, the
indicative sizing of the CEF could address a remarkable share of the total project
portfolio. Depending on the quality and readiness of the fund (and VGF’s and
PDF’s ability to bring projects to bankability and financial close), it might not be
recommended to have at least a bigger fund initially, since in that case there would be
a risk of the market of bankable projects being too small for the CEF, and therefore
part of the funds remaining uncommitted in the end of the investment period.
Assuming the project’s average investment cost is somewhere close to million,
the rough initial sizing assumption for more detailed work could be about
million– million CEF scheme the needed fund management and
technical assistance budget that could add (again rough order of magnitude)
million–million to the total budget. Of course, it has to be kept in mind that
most of the funds would be repaid with interest, the latter covering a share of the
management and technical assistance budget.
F. Technical Assistance Linked to the Credit Enhancement Fund
Like the PDF, the CEF should include a large concerted technical assistance and
capability-building eort targeted at the key players in the market, primarily the
lenders (banks and possible other debt providers) and developers, but also regulators,
the PLN, and local service providers (including consultants and engineers), who also
play a critical role in making projects bankable.
The technical assistance would mainly happen in the following ways. These activities
have turned out to be critical in many other markets to create an active renewable
energy market:
. Broader capacity building through general awareness-raising seminars, and
more specific and targeted workshops aimet at improving specific skills
of specific stakeholders. For example, the latter can include training for
developers and technical consultants in bankable resource assessments,
bankable technical and other studies and assessments, training for PLN in
grid connection and balance management in grids with variable renewable
energy generation.
. Hands-on work with banks and developers in developing ecient processes
to identify and evaluate projects, negotiate loan facilities, and carry out due
diligence processes.
. Active information dissemination work to disclose information on the
results of the ERF. This should be designed in a way that it does not form an
obstacle for developers, investors, and lenders to use credit-enhancement
funding because of confidentiality issues, but at the same time in a planned

Renewable Energy Financing Schemes for Indonesia
78
way to make sure that best practices, hard data on risks, and other useful
market information will be available for a larger audience. CEF financing
agreements might even include specific clauses on certain reporting
requirements to enable information disseminaton.
The primary responsibility in carrying out these tasks (as defined in detail in the the
strategy, targets, and KPIs) is with the fund manager, which, in turn, would outsource
much of the practical activities to the service provider. The fund manager and the
steering committee members (relevant ministries and financiers) would also have a
role in the technical assistance and capacity building activities.
Regarding technical assistance and capacity building oered for banks, OJK’s role
also should be strengthened. OJK has already worked for years with banks to promote
green lending by providing training and other capacity building. In the stakeholder
meetings, it was highlighted that this activity has helped building expertise at the
individual level, but more eort should be devoted to achieving institutional level
changes.

T
he three funding windows (and the related technical assistance and capacity
building), as presented above, are fundamentally dierent cases from potential
funding sources point of view.
A. Viability Gap Funding
. Type of Viability Gap Funding
VGF is clearly a subsidy mechanism. In principle, although it could be possible that such
premium tari could be repaid in some cases—being more like very long-term concessional
debt—in most cases, such front-loading of cash flow is not sucient, but the funding needs
to be in form of revenue-based subsidy. Moreover, dierent sectors to be supported can be
very dierent from funders’ point of view.
VGF for grid-connected IPP projects complementing the PPA revenues from PLN can be
seen as subsidy for PLN, enabling it to buy power cheaper than it could do otherwise. This
will enable cheaper electricity for end-users. However, as a starting point, tari level of grid-
connected electricity provided by a state utility should be cost reflective, and such subsidy
mechanism may seem questionable from donor perspective.
On the other hand, VGF for electrification projects is contributing to feasibility of projects
in areas currently without access to electricity. In such areas, both the higher system costs
as well as the lower payment capability of end-users may make such projects unfeasible as
a starting point (not to talk about risks), which has justified subsidy interventions by donor
countries or their development finance institutions in many similar cases around the world.
Therefore, as an example, the VGF in the IPP sector may be more dicult to justify for
any third-party financier, at least unless the Government of Indonesia makes a strong
contribution to such VGF scheme. Also, in the electrification sector, the host government
contribution would be crucial, but it can also be assumed that the foreign “appetite” for
such instrument would be higher because of positive development impacts.
As the viability gap funding is direct support, there are no commercial features in this
funding. The VGF is also dicult to blend in any such way that would enable a “commercial
tranche” oered for any financier with commercial or semicommercial requirements.
Therefore, the VGF is likely to be funded through grants only by such bilateral and
international financiers who can provide pure grants.
XI. Capitalization Structure and
Potential Sources of Funding

Renewable Energy Financing Schemes for Indonesia
80
. Sizing of Viability Gap Funding
In the scope of this study, it has not been possible to make a detailed analysis of the
amount of needed financing for the VGF. This analysis should include analysis of the
price levels, tenors, and other terms and conditions of the current and contemplated
PPAs; concessions; and other revenue streams of projects being developed. This data
should be combined with expert studies on the respective financial modeling of these
investments. Although the pricing in the VGF scheme would finally be determined by
the competitive bidding process, this analysis is required beforehand to estimate the
expected or needed size of the VGF.
However, there is some investment modeling done on the VGF needs, although these
calculations have not been published. Based on this modeling work and through
discussions with renewable energy experts in Indonesia, it was possible to roughly
estimate the order of magnitude of the potential viability gap funding window. The
estimate is based on the following assumptions:
(a) The number of projects in years’ period would be about – (i.e.,
–projects awarded with VGF per year), with average capacity of MW–
MW, leading to roughly MW– MW of cumulative capacity.
(b) Of the total capacity, would be small hydro with , peak load hours
per year (about capacity factor), would be solar photovoltaic with
, (about capacity factor), and wind with , peak load hours
per year (about capacity factor). This would lead to weighted average of
about , peak load hours per year.
(c) The financial modeling period is years, in line with the current BOOT
structure of the PPAs.
(d) The discount rate per annum is . This is considerably lower than a
commercial discount rate, and therefore the viability gaps resulting from this
example calculation are likely to be underestimations to some extent.
(e) The VGF would be provided at upfront and then according to
actual generation during the first years, i.e., equal to the assumed years of
cumulative generation.
(f) The required premium has been calculated as follows (based on expert
opinions):
(i) estimated hydropower viability gap: ,/MW
assuming , peak load hours annually, i.e., ,MWh
in years, the viability gap per MWh would be
,/,MWh ≈ $7/MWh;
(ii) estimated wind power viability gap: ,/MW
assuming , peak load hours annually, i.e., ,MWh
in years, the viability gap per MWh would be
,/,MWh ≈ $15/MWh; and
(iii) estimated solar photovoltaic viability gap: ,/MW
assuming , peak load hours annually, i.e., , MWh in
years, the viability gap per MWh would be ,/, MWh
≈$3.5/MWh.

Capitalization Structure and Potential Sources of Funding
81
Based on the above assumption, an average VGF need of ./MWh can be derived.
Table shows potential funding needs at the VGF range of –/MWh and at
cumulative installed capacity of MW– MW.
From this illustrative example, already it can be seen that, at a relatively low
cumulative volumes and support levels, the funding volume of the VGF becomes
relatively high, close to million after MW cumulative capacity and
./MWh is exceeded. This can be compared also against the specific investment
cost, whereby a premium level of ./MWh is equal to average ,/MW VGF
requirement. Due to time value for money, the subsidy required by investors would be
slightly lower if it was provided as upfront subsidy (since money received by an
investor today is more valuable for it, compared with money received in future), but
this illustration still shows the order of magnitude.
. Sources of Viability Gap Funding
As mentioned above, the viability gap funding needs to be traditional grant funding
from sources operating with such funding. In addition, the contribution by the
Government of Indonesia is crucial, especially in the case of VGF for IPP projects.
Therefore, the viability gap funding could be split between IPP/grid-connected
projects on one hand, and electrification projects on the other hand. The former
would be entirely/primarily funded by the Government of Indonesia. The latter would
be funded for large part/entirely by external climate or development finance.
Examples of potential sources of external climate or development finance could
include the following. The listed candidates are either currently large financiers in
Indonesia and in the Association of Southeast Asian Nations (ASEAN) region, and/or
financers of similar schemes in other countries:
(a) German development cooperation through GIZ (Germany) is already
working on a guarantee scheme for IPP projects, shares the same interest.
Table 3: Illustration of Potential Viability Gap Fund Sizing
at Dierent Assumptions on Support per Megawatt-
Hour and Targeted Cumulative Capacity
Capacity, MW
VGF support, $/MWh
.
,, ,, ,,
,, ,, ,,
,, ,, ,,
,, ,, ,,
MW megawatt, MWh megawatt-hour, VGF Viability Gap Fund.
Source: ADB.

Renewable Energy Financing Schemes for Indonesia
82
(b) Agence Française de Développement (AFD, French Development Agency)
(France) is already providing grant financing to fund a guarantee instrument
for construction stage financing of related projects in Indonesia.
(c) German development cooperation through KfW (Germany) has designed
and implemented the GET FiT scheme in Uganda and Zambia and is actively
promoting it as a success story. GET FiT is similar premium tari based on
competitive bidding as suggested for VGF, and the brand could be also used
in Indonesia, therefore increasing KfW’s interest to replicate the scheme in
the country.
(d) The Department of Business, Energy and Industrial Strategy, BEIS (United
Kingdom) is cofinancing the GET FiT in Africa together with KfW, as well as
many other related initiatives.
(e) The Government of Norway is cofinancing the GET FiT in Africa together
with KfW, as well as many other related initiatives.
(f) The European Union is cofinancing the GET FiT in Africa together with KfW,
as well as many other related initiatives.
(g) The United States Agency for International Development (United States) is
among the largest development financiers in Indonesia and can provide grant
financing, and is active in the field globally.
(h) The Japan International Cooperation Agency (Japan) is among the largest
development financiers in Indonesia and can provide grant financing, and is
active in the ASEAN region.
(i) The Government of Australia is among the largest development financiers in
Indonesia and can provide grant financing, and is active in the ASEAN region.
(j) UNDP (international) has shown initial interest for a guarantee scheme for
IPP projects in Indonesia.
(k) The Climate Investment Funds (international) is able to provide grant
funding combined with multilateral development bank funding. Therefore,
participation and leadership by ADB or the World Bank would be needed to
mobilize climate investment funding.
(l) The Green Climate Fund (international) is able to provide grant financing for
transformative interventions. As an accredited entity by the GCF, SMI would
help in applying funding. In principle, also ADB could act as the accredited
entity.
B. Project Development Funding
. Type of Project Development Funding
In principle, project development funding is risk finance, which could be commercial
or semicommercial since, if projects are successful and implemented, there is
usually a business case to repay a share of development costs, as this is relatively
low compared with total investment cost of a project and, therefore, has a limited
impact on profitability. This would also decrease the risk of market distortion; both
developers would be in a more equal position between themselves (no one receiving
pure free money). Also, in cases where private finance may be available, the project
development funding would not crowd out private finance as easily, and would
therefore cause less capital market distortion.

Capitalization Structure and Potential Sources of Funding
83
Similar schemes have typically been funded by donor grants (such as the similar
REPP scheme described in chapter VI.D). This would be the most recommendable
form of funding sought in this case too. However, the attractiveness of the scheme
from donors’ and development and climate finance institutions’ perspective could
be increased by blending a traditional grant element with a reimbursable grant or
equity component. Of more commercial development financial institutions are
sought for, a preferred equity or mezzanine loan tranche could be added on top of
the reimbursable grant or equity tranche. In principle, these tranches could be split
into even more tranches; for example, having both grant, reimbursable grant, equity,
and mezzanine loan tranches. If the track record of the PDF is good, the market is
expanding, and the PDF is expanded, it could be possible to add a senior loan tranche
on top of the initial tranches. However, this is probably not realistic nor needed in
the first phase of the PDF. An illustration of the structuring and possible blending is
described in Table .
In this kind of a blending structure, the grant funding would work as a risk buer for
equity investors, as well as cover the relatively high transaction costs required to
successfully run the PDF. In order to strike a balance between equity tranche risks
and returns, majority of the equity invested could have a fixed return like a debt
instrument and, therefore, not be in form of common/ordinary share. The fund
manager and service provider would then set their targets and budget to (i)achieve
the investment volume target of the PDF, (ii) provide technical assistance to
project developers and other stakeholders, (iii) resource its own management and
administrative functions properly but eciently, and (iv) create the fixed return to
equity tranche investors.
. Sizing of Project Development Funding
As already discussed in chapter IX.E, the meaningful funding per project in small
to medium-sized renewable energy projects is typically between , and
,. Smaller than , may not make a dierence when real bankable
studies, agreements, and related documentation needs to be done, while sums
exceeding , start to be excessive compared with total project development
Table 4: Basic Structuring and Capitalization
of the Project Development Fund
(In relation to funding needs)
Funding Source PDF Financing Component
Senior loan, in case the PDF is expanded Project development investments in the
form of reimbursable grants, mezzanine
loans, and/or quasi-equity
Preferred equity, mezzanine/junior loan
Reimbursable grant, equity
Grant Management and technical assistance
PDF project development fund.
Source: ADB.

Renewable Energy Financing Schemes for Indonesia
84
cost, of which the developers should cover major part. In addition, a remarkable share
of project development cost should already be incurred by the developer before the
intervention by the PDF, and the remaining costs should be divided between the
two. Therefore, the average PDF investment per project would probably fall between
, and ,.
Regarding project volume, the PDF should be able to invest in five projects per annum
as a minimum to make a dierence in the market, but the project-specific tailoring
and structuring of projects may not allow more than investments per annum
(probably less). Assuming an investment period of years, the PDF could invest in
– projects (the higher value being probably quite optimistic).
On top of this, the management of the PDF will require a properly large
and experienced team, with an annual budget being in the range of
.million–.million.
The size of the PDF could be estimated to be million– million for investment
and . million– million for management. This would also include the technical
assistance provided by the fund manager and the service provider team.
. Potential Sources of Project Development Funding
For example, bilateral development financial institutions oering commercial or
semicommercial financing could be considered. While the grant component could
be provided by similar institutions as described in the case of VGF, the equity
component could be provided by the same institutions, plus the following:
. European bilateral development finance institutions such as
(i) Nederlandse Financierings-Maatschappij voor Ontwikkelingslanden
N.V. (FMO, Netherlands Development Finance Company)
(Netherlands),
(ii) Belgian Investment Company for Developing Countries (BIO)
(Belgium),
(iii) Proparco (private sector development finance institution of France),
and
(iv) Compañía Española de Financiación del Desarrollo (COFIDES)
(Spain).
These institutions have invested in other development and climate finance
instruments, targeting financial sustainability as such. In contrast to the bilateral
institutions mentioned in case of VGF (such as the AFD), these institutions typically
cannot provide grant funding but will rather “invest” or “finance” instruments (such as
Proparco, the private sector arm of the AFD).
(b) International impact funds, philanthropies and foundations such as
(i) Grameen Foundation;
(ii) Blue Orchard;
(iii) Oxfam Novib;

Capitalization Structure and Potential Sources of Funding
85
(iv) Rockefeller Foundation;
(v) Packard Foundation’s Carol Larson, Susan Phinney Silver;
(vi) Kresge Foundation’s Rip Rapson;
(vii) MacArthur Foundation;
(viii) DOEN Foundations;
(ix) Calvert Impact Capital;
(x) Baldwin Brothers;
(xi) MCE Social Capital;
(xii) Facebook Energy Access Program; and
(xiii) Leonardo DiCaprio Foundation.
These instutions have joined bilateral and multinational development and climate
finance institutions in financing vehicles aiming at financial sustainability, such as the
three first ones investing in TCX, which oers currency risk mitigation instruments
in developing countries. The rest have been active in small-scale solar in developing
countries. Although all of these have invested in similar risk positions, some of these
may be too risk averse for the purposes of PDF.
Also, it has to be noted that many of these may prefer o-grid projects over grid-
connected ones, while most of them would probably have no formal restrictions
regarding the latter.
C. Credit Enhancement Funding
. Type of Credit Enhancement Funding
CEF provides semicommercial funding between the CEF and projects, i.e., the funding
to projects include repayment obligations (or in case of a guarantee, the guarantee
is intended to be released gradually during the respective debt repayment period.
On the other hand, CEF would include relatively heavy management, administration,
transaction, and technical assistance costs, which will not be repaid/covered by the
projects or other stakeholders. In addition, the CEF guarantee/credit line instrument
as such may have to take higher than commercial risks (depending on the detailed
mandate and strategy), possibly leading to losses that are higher than the returns
from interest and fees paid by project companies.
Therefore, the funding of the CEF instrument could be partly repayable (reimbursable
grants or financial instruments) but would need to be partly in form of grants, at least
for the share covering the management, administrative, transaction, and technical
assistance costs. Therefore, the credit enhancement funding and capitalization
structure of the CEF could be similar to the PDF. While the repayments and possible
returns from the PDF will occur primarily during a few years from the investments
(short term financing), in the case of CEF the funds are committed to long-term
guarantees and/or credit lines (– years). However, the basic instruments can be
same for both PDF and CEF. The basic structuring of the capitalization of the CEF is
shown in Table .

Renewable Energy Financing Schemes for Indonesia
86
. Sizing of Credit Enhancement Funding
As discussed in chapter X.E, the CEF window could realistically provide funding
for – projects during a years investment period. This indicative sizing of
the CEF could address a remarkable share of the total project portfolio, but also
acknowledging the probably thin bankable project pipeline that exists currently and
can be developed within a few years, and also taking into account that one fund alone
should not be funding the whole pipeline (or market portfolio, using the concepts of
economic theory).
Assuming the project’s average investment cost is somewhere close to million,
the rough initial sizing assumption for more detailed work could be about
million– million CEF scheme the needed fund management and
technical assistance budget that could add (again rough order of magnitude) in
the tune of million to the total budget (assuming management and technical
assistance costs at – per annum during the first years investment period,
then much lower. Of course, most of the funds would be repaid with interest, the
interest/guarantee fee covering a share, or even all of the management and technical
assistance budget.
This sizing should be seen as phase of the CEF, aiming to get the current project
pipeline alive. If the track record of the CEF is good, and if the market starts
expanding, it could be justified to expand the fund, including both increasing its
capitalization, but also enabling it to fund larger projects.
. Potential Sources of Credit Enhancement Funding
Since the funding structure of the CEF would be very similar to PDF, the potential
funding sources of the PDF described in chapter XI.B. would apply to credit
enhancement funding too. As a first option, these two funding windows should be
“sold” as one investment opportunity to donors and development and climate finance
institutions. The VGF instead, although being an integral part of the whole concept,
should have a dierent capitalization structure and also partly dierent target
Table 5: Basic Structuring and
Capitalization of the Credit Enhancement Fund
(In relation to funding needs)
Funding Source CEF Financing Component
Senior loan, in case the CEF is expanded Long-term guarantees and/or credit
lines for projects in construction stage,
committed at financial closing
Preferred equity, mezzanine/junior loan
Reimbursable grant, equity
Grant Management and technical assistance
CEF Credit Enhancement Fund.
Source: ADB.

Capitalization Structure and Potential Sources of Funding
87
financiers, since it is more a direct subsidy mechanism for targeted projects compared
with PDF and CEF, which are primarly financing instruments towards projects.
D. Summary
From the above elaboration of total funding needs, a rough order of magnitude
of million– million to be used as funding towards the projects, and
million– million (or million– million per year) for management,
transaction, and technical assistance. These figures should be regarded as examples
only, meant to help in rough sizing and conceptualization of the ERF, and the more
detailed and realistic estimate will need a lot more data and analysis. Especially, the
uncertainty regrading the required viability gap funding is high. The CEF assumption
is probably more accurate “ballpark figure,” and the estimate for project development
funding needs are probably the most realistic one, and could even be considered an
estimate, unlike the two other figures.
Table shows the proposed capitalization plan for the ERF split between dierent
components of the ERF. The PDF and CEF returns could also cover a remarkable part
of the management and technical assistance funding, depending on to what extent
this money needs to be repaid to the funding sources with possible interest/return.
Table 6: Summary of the Capitalization vis-a-vis Components
of the Energy Resilience Fund
Source of Funds/Capital Stack Energy Resilience Fund Component
Quasi-equity/mezzanine debt Project development funding and Credit
enhancement funding
Reimbursable grant/equity
Grant
Grant Viability Gap Fund
Technical assistance and capacity building
Management and administration
Source: ADB.

A. General
The situation of renewable energy market in Indonesia is very challenging, and the sector is
facing multiple barriers. In this assignment and report, an attempt has been made to design
a set of financial interventions that can help mobilize the sector in its current situation.
However, some of the barriers are such that they cannot be solved by financial interventions
only, but reforms to legal and regulatory environment, for example, have to be made in
parallel. Moreover, the proposed financial interventions are not meant to be a comprehensive
long term-solution to decarbonize the Indonesian power sector and achieve the climate
targets set in the Nationally Determined Contributions of Indonesia, but rather find solutions
to start moving forward and gain experience, build capacity, and improve the investment
framework in general by mobilizing and implementing projects in the ongoing project pipeline.
New, larger, and more ecient inverventions will be needed in the following phases to
respond to the huge power sector investment needs in the coming decade.
The proposed solution is based on an ERF, consisting of three separate funding windows:
VGF, PDF, and CEF (Figure ). A relatively detailed concept for each fund has been presented
in this report. However, the proposals should be treated as possible alternatives or even
examples at this stage. Also, there could be other types of suitable financial interventions,
or the proposed interventions could be implemented in a dierent way compared with the
proposals made in this report. The proposals are based on the current understanding of the
challenges and opportunities, but more analysis is needed to shape the concept further and
ensure its suitability in the context of the current short-term challenges.
In this chapter, some of the main uncertainties and implementation alternatives are briefly
discussed separately regarding each funding window.
B. Viability Gap Fund
Viability gap funding could be understood as a broader fiscal issue than just the funding
options as described in this report. In addition to the mechanisms described here, the
analysis could be expanded to various fiscal policy measures, such as green certificates,
direct or indirect tax rebates and exemptions, and funding through earmarked taxes and
charges. A starting point in this report has been that the measures should be implemented
quickly, meaning implementable in the current legal and regulatory context. Therefore, such
measures have not been evaluated in more detail in this report, but the report has focused
on designs that could be implemented in a stand-alone fund context. Such alternatives
XII. Conclusion
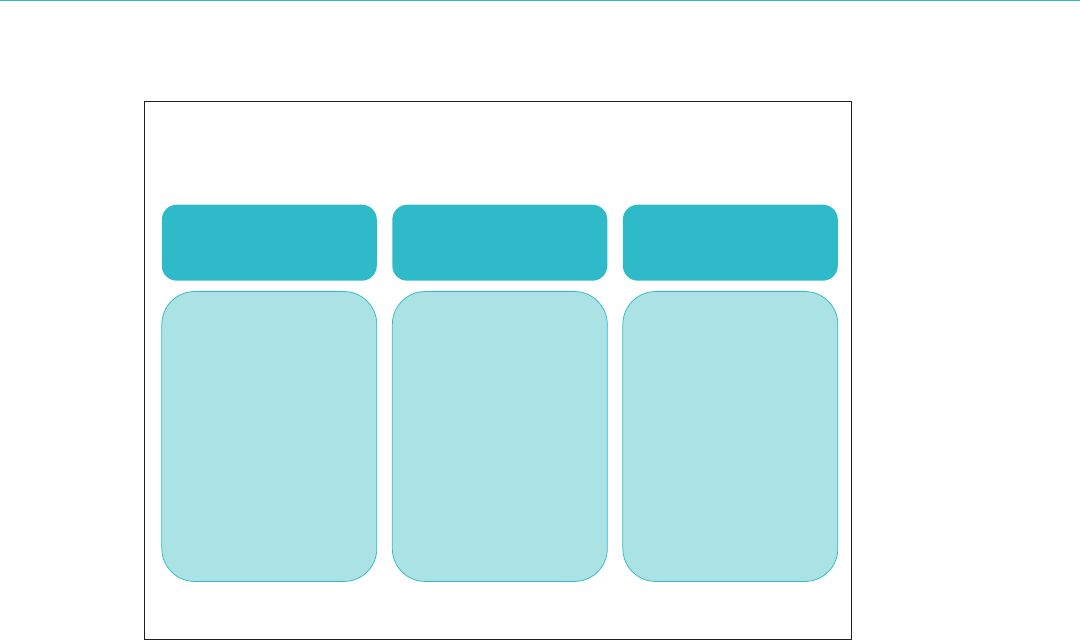
Conclusion
89
should be explored in more detail, if they emerge as realistic ones in the targeted time
frame of this fund.
Especially, regarding the VGF which is likely to be a more direct subsidy mechanism,
it could be expected that the Government of Indonesia should make a strong
contribution to have serious discussions on any external funding for such mechanism.
Furhter, from a funding source perspective, this mechanism could be split into grid-
connected and o-grid projects, the government funding being more crucial in the
former, while the latter probably being more potential for international climate and
development finance.
Partial front-loading of the VGF has been proposed to make the funding more
eective from a financial closing point of view. Also, because of time value for money,
such front-loading can improve the financial ratios of projects, while such time value
for money tends to be of less importance for at least some public funders, or at least
they may apply more modest discount rates. However, the front-loading structure
also transfers risk from investors to the VFG. Therefore, in the next steps more
discussion is required regarding the optimal timing of the VGF payments.
The proposed application and selection process in this report is a two-round bidding
process and scoring based on both technical and price. In this scheme, the potential
bidders first have to be short-listed through an EoI/prequalification phase, and the
short-listed candidates are subsequently asked to submit their full proposals through
a CfP procedure. The selection is proposed to be mostly based on price, but partly
on quality (or technical proposal). This procedure is typical, but can be relatively
burdensome for both bidders and the fund manager. Alternative ways could be:
Figure 11: Summary of the Three Funding Windows
of the Energy Resilience Fund
Viability Gap Funding
• Aims at making projects
profitable enough to attract
investors and strengthening
cash flow to attract lenders
• Premium tariff on top of the
power purchase agreement,
concession or other secured
revenue stream
• Based on annual competitive
bidding process
• Partly upfront, partly
performance based during
the first years of operation
• Direct subsidy mechanism
• Aims at making projects more
bankable by higher-quality
project development and
documentation
• Risk finance, reimbursable
grants, and traditional grants
• Continuous evaluation of
projects on a first come first
served process based on
predetermined criteria
• Available for advanced
projects having clear path to
bankability
• Balanced cofinancing with the
developer who is also required
to commit to invest in the
remaining development costs
• Aims at de-risking projects at
financial close, construction,
and operation phases from
lenders’ perspective
• Partial credit guarantee and/or
credit line mechanism made
available to banks and other
potential lenders
• Lower interest rates and
longer tenors than currently
available in the debt capital
market
• Active and hands-on
technical assistance and
capacity building to help
banks and developers in debt
capital transaction processes
Project Development Funding
Credit Enhancement for
Investments
Source: ADB.

Renewable Energy Financing Schemes for Indonesia
90
. Having qualitative parameters as eligibility criteria (not basis for scoring),
basing the decisions on bid price only, but at the same time accepting only
bids that meet the predetermined eligibility criteria.
. Having a one-round process only, i.e., bidders submitting full proposals
only without a preceding EoI/ prequalification round. This could lead to
either more or less burdensome process. If the scoring remains quality
and price based, such process might be more burdensome than the two-
round process. However, if bids can be screened quickly based on quality
parameters as eligibility criteria, ineligible bids could be rejected relatively
easily, and the procedure could be faster.
Finally, the needed sizing of the VGF is highly uncertain as it was not possible in
the context of this assignment to estimate the potential range of needed VGF. The
calculations shown in this report should be regarded as illustrative examples only, and
not used to sizing decisions as such. This will require more detailed studies on price
levels in PPAs and concessions, and cost of generation of various forms of renewable
energy generation in Indonesia. Also, more detailed analysis on other PPA terms and
conditions is needed to understand potential other PPA challenges in addition to
pricing.
An important aspect of the VGF and the whole ERF is the relationship to PLN. Since
PLN is a crucial part of making projects bankable, it is of utmost importance that the
ERF will also suciently respond to PLN’s challenges to help them in playing their
role. In this regard, VGF will be the most important funding window since it directly
helps PLN’s financial situation between the average regional taris and renewable
energy projects requiring higher taris. There was no sucient interaction with PLN
during the assignment, and involving PLN is one of the most important next steps in
the implementation process of the ERF.
C. Project Development Fund
The proposed PDF is based on a less-competitive procedure, where the developers
are not explicitly put to compete directly against each other. Many public funding
sources prefer competitive selection procedures, which in practice often means a
CfP process. A CfP process can work well in many situations, and especially when
the funding terms are very standardized, such as in the case of grants. However, in
the case of project development funding, more detailed evaluation, negotiation,
structuring, and use of financial instruments can improve the eectiveness of the
funding remarkably. In this way, at least some of the funding will be repaid, and
the funding is more likely to go to projects that have higher probability of success
compared with standardized grant facilities applying a CfP procedure. It is suggested
here that the potential funders of the PDF scheme are able and willing to actively
find solutions enabling such continuous, bilateral, first come, first served evaluation,
negotiation, and selection process, which can be very useful in the context of project
development financing.
Such process can work as long as the amount of projects is relatively limited, roughly
leading up to projects per year. If the target volume is higher than that, tailored

Conclusion
91
structuring at the project level may become burdensome, and a more traditional
standardized grant facility approach can work better. However, in that case, it has to
be accepted that, although the transaction cost can be lower in relative terms, the
eectiveness of the scheme may be lower.
It is important to discuss the project development stage financing appoach in more
detail with the domestic and international developers, IPPs, and potential financial
investors, since these are the target groups of this intervention. In this assignment, the
stakeholder consultation and written material available gave some clear indications
on this aspect, but there has not been sucient interaction with these stakeholders
to thoroughly understand the most eective form of intervention would be.
D. Credit Enhancement Fund
The primary proposal for CEF would be a Partial Credit Guarantee Fund, but based on
the fact-finding mission, it may be a too indirect and distant way of intervention, and
some banks might even face lending limits to the sector. Therefore, providing direct
finance through credit lines may work better in Indonesia, at least in the beginning.
Syndication approach could be even more certain to kickstart some of the projects,
since the syndication fund would play an active role by itself instead of relying more
on banks’ and developers’ capability and interest. However, the syndication approach
could tie a lot of resources in the fund management team and still lead to limited
actively promoted pipeline. The credit line approach can also be structured so that
the fund manager is an active player with banks (or between banks and projects),
eectively doing financial advisor’s work, and therefore make sure that the banks
using credit lines are active. This approach has been successfully used by EBRD in its
SEFF, such as the TurSEFF in Turkey.
The situation of the banking sector should be analyzed in more detail, more
consulations with banks should be carried out, and the OJK should be more closely
involved to further specify the most optimal approach in the CEF scheme.
E. Other Approaches
The proposed ERF has been designed to be as narrow as possible. It aims at
establishing just the absolutely crucial interventions to mobilize private sector to
provide the rest, in terms of capital, skills, expertise, and other resources. Therefore,
it is not proposed to necessarily blend public and private funding at the level of
the ERF, but rather make this blending happen at the project level, e.g., investors
and international IPPs investing equity directly in the projects both at the project
development and construction stages. Although the current concept consists of
three forms of financing already, the concept could in principle be further expanded
to include even more comprehensive set of financial interventions if seen necessary.
There are at least two dierent aspects that could be considered:
. Equity instrument. In this concept, it is assumed that (a) the VGF helps
making the cash flow profiles of projects attractive for investors and lenders,
(b)the PDF helps in sharing costs and risks at the project development

Renewable Energy Financing Schemes for Indonesia
92
stage and developing high-quality projects, (c) the CEF enables securing
at least large share of needed debt, and (d) these together will make the
professional (in many cases international) developers and IPPs interested
in acquiring/investing in project development stage projects in Indonesia.
These players have the needed equity and skills to develop, build, own,
and operate renewable energy investments. In that case, a separate equity
instrument is not needed. However, if even these interventions are not
enough to attract professional and better resourced developers and IPPs,
then a separate equity finance instrument could be considered. However,
this would require again a lot more resources for the fund manager, to build,
manage, and eventually exit a project equity portfolio. Such equity funding
instrument could be a blending facility with grants/first-loss instruments
provided by climate and development finance institutions to cushion the
fund against losses, therefore making the fund attractive to private sector
equity investors, for example, including institutional investors who typically
do not want to be actively and directly involved with projects. However,
an additional drawback of this approach is that it does not automatically
mobilize professional sector-specific investors, developers, and IPPs, who
in any case are needed if a solid and growing renewable energy market is
to be created in Indonesia. Such investors would not invest in a fund (like
institutional investors), but are looking for direct and usually controlling
stakes in projects. For this reason, a specific equity fund approach is not
proposed as a component in this ERF concept note.
. Refinancing instrument. Another way to mobilize debt finance would
be to provide debt funding or guarantees for construction stage only, and
then aim to refinance projects after commissioning at operational stage,
once they have proven a sucient performance level. This would take the
construction risk away from lenders. For example, such refinancing scheme
could attract institutional investors, such as pension and life insurance
funds who are, in principle, interested in (a)long-term stable cash flows
and (b) large portfolios. Therefore, a construction stage funding instrument
could take short-term fincancing responsibility during the construction and
commissioning, and the projects could then be refinanced by a refinancing
fund, which would be blended, tranched, and capitalized in the same way
as explained above in case of the equity instrument. As an example, the
EIB’s InnovFin Energy Demonstration Projects (EIB InnovFin EDP) is a
guarantee scheme that guarantees a large share () of the construction
stage loan, but does not cover operational stage (EIB ). Therefore,
it helps remarkably in arranging construction stage loan for projects, but
requires that the project owner is able to refinance the project soon after
commissioning without a guarantee. This kind of approach could also be
possible, but it can be implemented also later. In the first phase, the sector
needs to show some volumes coming online, and only then a refinancing
scheme can be relevant. The current guarantee and/or credit line instrument
could be easily modified and changed to a short-term construction finance
instrument, if such refinancing scheme is later seen realistic and feasible.

European Investment Bank. . InnovFin Energy Demonstration Projects. Luxembourg.
http://www.eib.org/en/products/blending/innovfin/products/energy-demo-projects.htm.
Global Energy Transfer Feed-in Tari Uganda. . Annual Report 2018. Kampala.
https://www.getfit-uganda.org/ (accessed September ).
Laporan Kinerja Direktorat Jenderal Ketenagalistrikan. . 2016 Performance Report of
Directorate General of Electricity. Jakarta.
International Renewable Energy Agency. . Renewable Energy Road Map Indonesia
(REMAP Indonesia). Abu Dhabi.
PricewaterhouseCoopers. . Indonesia Power Generation Guide 2017. Jakarta.
Private Finance Advisory Network. . http://pfan.net/ (accessed September ).
PT Perusahaan Listrik Negara. . Rencana Umum Penyediaan Tenaga Listrik 2017
(2017 RUPTL). Jakarta.
Renewable Energy Performance Platform. . https://repp.energy/ (accessed
September ).
Roschier. . Getting ready for the new Finnish renewable energy support scheme. Helsinki.
https://www.roschier.com/newsroom/getting-ready-for-the-new-finnish-renewable-
energy-support-scheme/ (accessed September ).
The Economist. . Economist Intelligence Unit. http://country.eiu.com/indonesia
(accessed September ).
Turkey Sustainable Energy Financing Facility. . http://www.turse.org/ (accessed
September ).
United Nations Development Programme. . ARECA Final Evaluation Report.
New York. https://info.undp.org/docs/pdc/Documents/HND/ ARECA Final
Report.pdf.
XIII. References

ASIAN DEVELOPMENT BANK
6 ADB Avenue, Mandaluyong City
1550 Metro Manila, Philippines
www.adb.org
Renewable Energy Financing Schemes for Indonesia
Despite recent eorts by the Government of Indonesia to promote renewable energy investments, fossil
fuels continue to account for around 90% of the national power generation mix. High financing costs and
low power purchase agreement taris have been identified as major roadblocks for renewable energy
investments in the country. This report examines how an Energy Resilience Fund can be designed to
overcome the investment challenges by providing financial incentives for renewable energy developers.
It makes recommendations for the fund’s scope, structure, institutional design, function, and operation.
Potential funding sources are also assessed.
About the Asian Development Bank
ADB is committed to achieving a prosperous, inclusive, resilient, and sustainable Asia and the Pacific,
while sustaining its eorts to eradicate extreme poverty. Established in 1966, it is owned by 68 members
—49 from the region. Its main instruments for helping its developing member countries are policy dialogue,
loans, equity investments, guarantees, grants, and technical assistance.
